Article

Personalized Beauty: How Clinical Insights Shape Tailored Aesthetic Treatments

Department of Information Engineering, Università Politecnica delle Marche, Via Brecce Bianche 12, 60131 Ancona, Italy
*
Author to whom correspondence should be addressed.
Cosmetics 2025, 12(3), 94; https://doi.org/10.3390/cosmetics12030094
Submission received: 4 April 2025 / Revised: 24 April 2025 / Accepted: 30 April 2025 / Published: 7 May 2025
(This article belongs to the Section Cosmetic Technology)

Abstract

:
Aesthetic procedures have advanced significantly, transcending mere vanity to become practical tools for enhancing well-being. The diversity of available aesthetic treatments and products can make it challenging for both professionals and consumers. Consequently, the field of aesthetics has begun to incorporate AI techniques. The scope of this article is to evaluate the effects of various cosmetic procedures using the T•modella 5.0 machine and assess their effectiveness. We gathered data from 11 aesthetic centres and 36 subjects with different body constitutions (normal, overweight and obese). This is a prospective, multicenter, interventional study designed to assess the impact of the procedures on the participants. Clustering methods were used to analyse the results, identify trends and evaluate the efficacy. Additionally, we developed a novel algorithm that tailors cosmetic treatment regimens according to the unique physiological characteristics of each patient. The initial weight of patients has been found to influence the efficacy of treatments. Significant improvements have been observed in obese individuals, with reductions of 6% in hip circumference, 8% in waist circumference, and a decrease in fat mass. In contrast, overweight and normal-weight individuals exhibited less consistent outcomes, with results influenced by external factors such as stress, physical exercise, and medication. By utilising clustering techniques, we were able to move beyond traditional weight-based analyses. Based on these findings, we developed a recommendation system that can be integrated into treatment devices to optimise both clinical and aesthetic results.

1. Introduction

The field of cosmetology, traditionally focused on healthy individuals, often employs local treatments such as creams to address skin conditions like acne and aging. In recent years, aesthetic procedures have undergone significant advancements, shifting from superficial vanity to becoming valuable tools for enhancing overall well-being and physical health [1]. Aesthetic therapies now go beyond surface-level improvements, addressing deeper physiological and psychological concerns, thanks to an increased focus on integrative approaches [2]. This shift represents a fusion of traditional cosmetic techniques with cutting-edge medical knowledge, aimed at harmonizing both appearance and health. By combining innovative technologies with evidence-based practices, modern cosmetology has evolved beyond mere aesthetics, helping individuals achieve holistic wellness and personalized therapeutic outcomes that cater to their unique needs and challenges [3].
Technological advancements, along with a deeper understanding of the human body, have paved the way for highly personalized treatments tailored to the specific needs of each individual. These procedures now address not only cosmetic concerns like skin texture and signs of ageing but also underlying health issues such as poor circulation, muscle imbalances, and stress-related conditions [4].
Due to the wide range of aesthetic treatments and product availability, consumers and professionals may find it difficult to select the best cosmetic product or therapy. Therefore, artificial intelligence (AI) and machine learning (ML) approaches have been included in aesthetics in recent years [5]. With the ability to reach more patients than ever before, AI is a driving factor behind innovation in cosmetic dermatology [6].
An AI-based decision support system can help make the decision and weigh the characteristics that we want to improve. Moreover, the success of a cosmetic procedure is measured by individual perception, current beauty standards, and manual observation: all highly subjective and biased measures [7]. The use of AI can help objectify the effectiveness of these treatments and shift the focus from aesthetic to clinical.
AI approaches not only enhance the reliability and efficiency of procedures but also are important for ingredient assessments and support in adopting sustainable and ethical testing methodologies. It enables the analysis of vast datasets, including chemical, biological, and clinical information, allowing for more accurate predictions of how ingredients interact with human skin or other tissues. This capability helps to identify potential risks, such as toxicity or allergic reactions, while optimising formulations for better performance [8]. Moreover, AI provides an ethical and effective alternative to animal testing. Traditional methods relied on animal models to assess skin sensitisation and allergic responses. In contrast, AI replaces these approaches with in silico models, which use computational algorithms and pre-existing datasets to simulate biological responses [9].
The primary objective of this study is to evaluate the effectiveness of aesthetic treatments by identifying meaningful patterns in patient data through clustering methods. By applying these techniques, the study aims to uncover trends and associations that could enhance our understanding of treatment outcomes. In addition to this, the study has several secondary objectives. One key aim is to assess the potential for personalising treatments based on the identified patterns, ensuring that therapeutic approaches are better tailored to individual patient characteristics. Furthermore, using AI-based clustering is crucial, as it allows for detecting complex, non-linear relationships within the data that traditional statistical methods might overlook. Finally, by leveraging these advanced algorithms, the study seeks to account for the variability in patient profiles, such as differences in body constitution and responses to treatment, ultimately contributing to more effective and personalized aesthetic therapies.

Literature Review

The literature review was conducted in January 2025, utilizing the PubMed, Web of Science, IEEE Xplore, Scopus and Google Scholar databases. The selection of these databases facilitated the comprehensive exploration. The query search included using the truncation symbol * for the terms “aestetic procedures”, “beauty”, “artificial intelligence”, “machine learning”, “deep learning”, “treatment personalization algorithm*”, “body mass”, “personal*”, “optimiz*”, “clutering”, “selfcare”, “BIA”, “electrostimulation”, “LED”, “connective tissue”, “ultrasound”, “embedded AI”, “cosmetic*”, “parameter*”, “Clinical outcomes”, and “medic*”. Search terms were combined with the Boolean operators “OR” and “AND”.
There are several studies in which we begin to notice the paradigm shift towards a union of the aesthetic side and clinical well-being. Most of the articles found have as their scope of application aesthetic medicine in the dermatological and orthodontic fields. For example, the work [10] uses AI to discover the influence of dental alignment on facial attractiveness and perceived age, compared to other modifications such as wearing glasses, earrings, or lipstick. Similarly, Patcas et al. [11] assess the effect of orthognathic therapy on facial attractiveness and apparent age, by applying a CNN algorithm, on pre-and post-treatment facial photographs. In dermatology, the dual objective is more visible: it is used to suggest skin care treatments, democratizing the process and making it less expensive [12,13], but also to study the different types of skin and therefore offer more targeted treatments [14]. If we focus more on the medical side of skin problems, we can see how traditional techniques based on image analysis are used. Junayed et al. [15] developed AcneNet, a deep residual neural network that categorizes five types of acne lesions, namely closed comedo, open comedo, cystic, pustular, and keloidal, achieving over 94% accuracy. Similarly, Yadav and colleagues [16] proposed “Acne Care”, a system using deep learning techniques and the ResNet-18 architecture for acne detection and personalized care. This system can accurately predict the number, location, and severity of acne lesions, providing a useful tool for both self-assessment by patients and clinical diagnosis by doctors. These tools guarantee that patients receive prompt and correct care by offering resources for effective diagnosis, remote consultations, and customised treatment programs. This development increases patient access to necessary skincare treatments and fosters improved collaboration between dermatologists and cosmetologists, eventually improving health outcomes and quality of life. The importance and power of these tools have been noted so much that big companies, such as L’Oreal, have developed their own models. In the case of L’Oreal, the application offers online skin analysis through the Vichy Skin Consult AI website, an antiaging and skin care simulation application for beauty and medical industries with capabilities to detect, quantify, and predict changes in the skin. This system was developed using machine learning based on dermatologist-developed skin ageing atlases and provides the consumer with information regarding their skin quality (https://www.vichyusa.com/skin-care-analysis-ai.html, accessed on 10 January 2025). Decision Support Systems (DSSs) and AI models can effectively improve body composition. By analyzing individual data, they provide personalized diet, exercise, and lifestyle recommendations to achieve optimal results. Navarro et al. [17] developed a dynamical model for daily weight change incorporating both physiological and psychological considerations: they rely on the concept of energy balance to obtain a model that describes the net effect of energy intake from food minus energy consumption, the latter including physical activity. Another application is the one suggested by Figueiredo et al. [18], which aims to develop a machine-learning model to predict future weight based on dietary records, physical exercise, and basal metabolic rate to demonstrate three days of future weight.

2. Materials and Methods
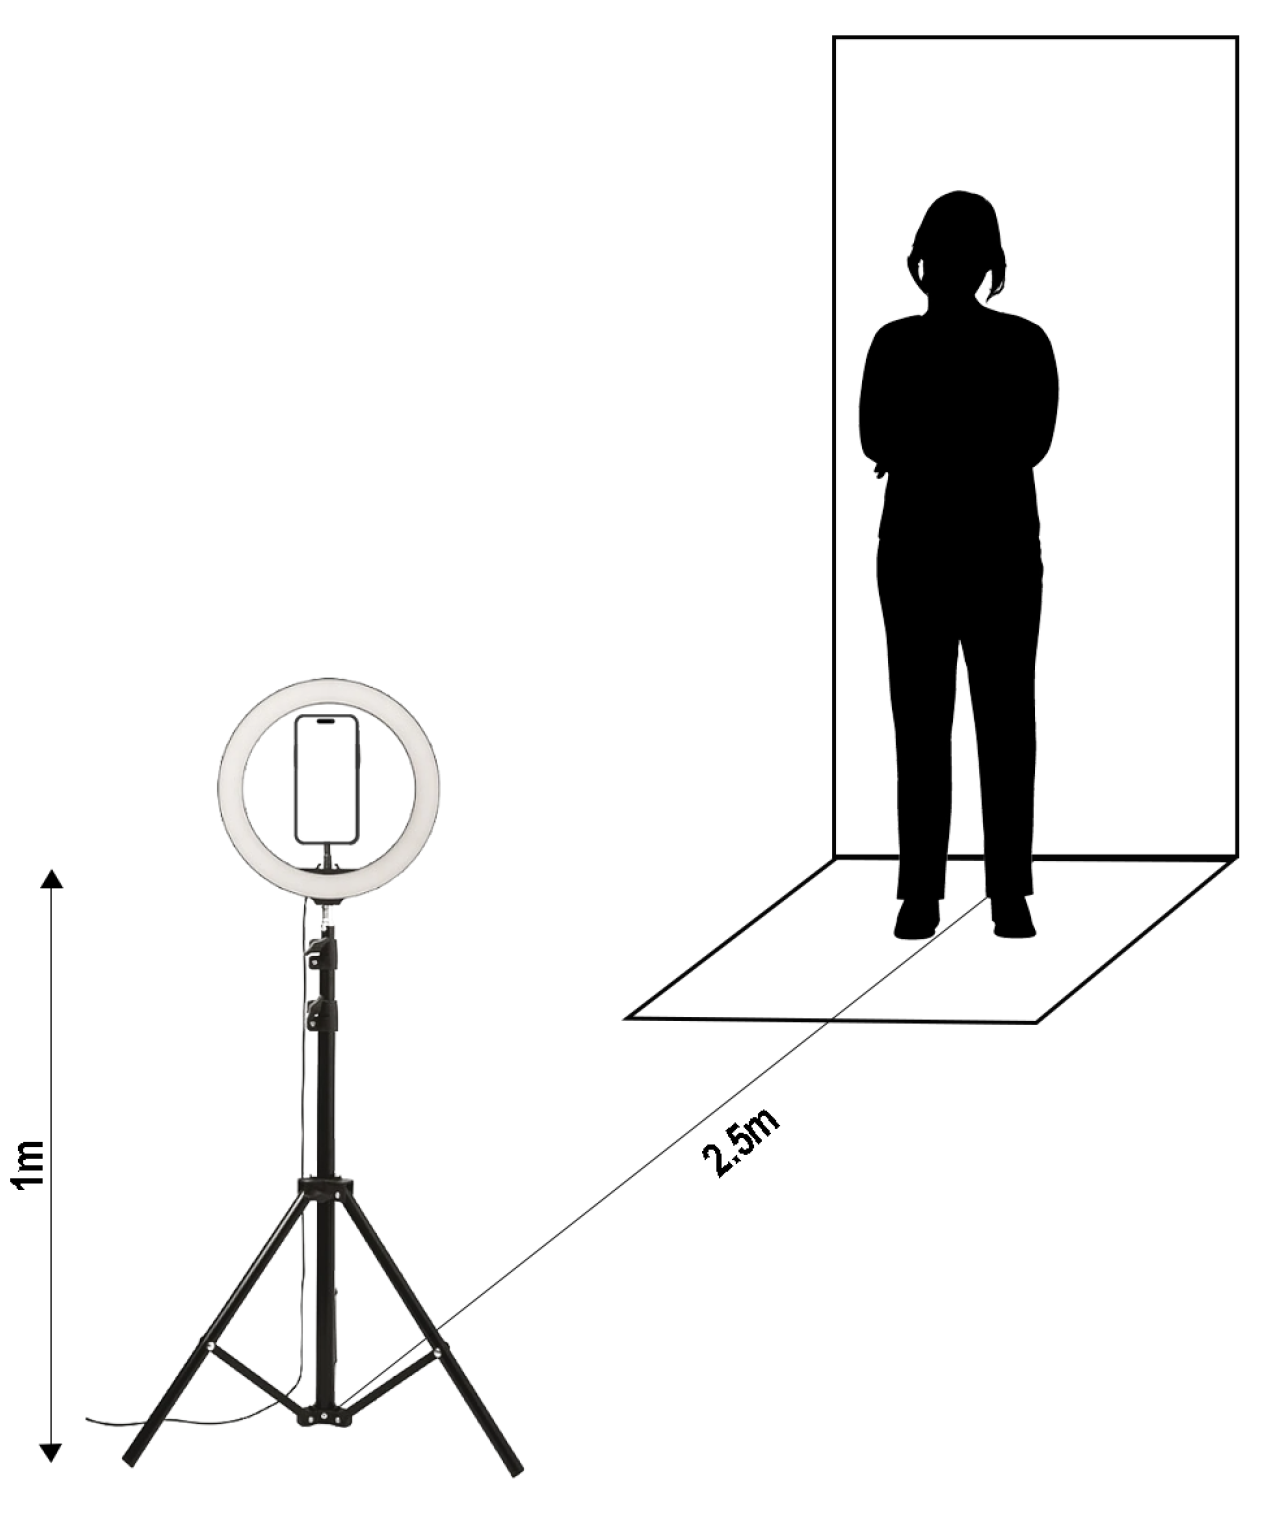
In this section, we describe the devices and technologies chosen for the study, the standardized protocol used for data acquisition, and the analytical methods applied. Our approach was carefully designed to maintain consistency and reliability throughout all stages of data collection and analysis. A schematic representation is provided in Figure 1.

2.1. Devices

The machines and technologies used for this study are the T•modella 5.0 and a device to measure bioimpedance. The T•modella 5.0 is a machine developed and produced by Shusa S.r.l., Morrovalle, Italy, (https://www.shusa.it/, accessed on 10 January 2025), to treat in synergy different parts of the body. It focuses on improving the skin and body composition of the subjects, reducing imperfections, using 4 different technologies: ultrasound, electrostimulation, infrared and connective tissue massage. The infrared is made possible by a LED device that acts on the tissue with a light stimulus, which, through interaction with the cellular structure, promotes the production of enzymes and anti-inflammatory action. The heat generated by the infrared light on the skin leads to an increase in microcirculation, lymphatic drainage and collagen synthesis. As the wavelength rises, the light’s penetration depth increases as well, stimulating the lymphatic system’s parietal cells and reactivating the lymphatic microcirculation, which improves drainage by up to 80% [19].
The foundation of electrostimulation is the stimulation of muscular contractions. It makes use of electrical impulses that are released by skin-applied electrodes. The electric field stimulates contraction by acting on the muscular plate in this manner. Because it encourages lipolysis, or the breakdown of stored fat, it helps to tone muscles, drain fluids, and increase skin suppleness [20].
The computerized connective tissue massage allows the atraumatic mobilization of the skin and subcutaneous tissue, assisted by a modulable rhythm, thus obtaining an improvement of the lymphatic, arterio-venular flow, of the interstitial and adipocyte fibroblastic metabolism [21].
Finally, ultrasound produces tiny oscillations with a frequency that varies between 1 and 3 MHz. Ultrasound travels through the skin and subcutaneous tissues at varying depths and is transmitted by a specialised probe. The resultant action is elevating, enhancing blood and lymphatic circulation, and maintaining impurity-free skin. Skin becomes harder and more compacted as a consequence, and elastin and collagen synthesis rise [19]. All the aforementioned technologies have different parameters that the operators can adjust based on the client and the session.
The fifth technology used in this study is the BIOSMART Bioimpedencemeter (https://www.eupraxia.it/bioimpedenziometro-biosmart/, accessed on 10 January 2025), which performs Bioelectrical Impedance Analysis (BIA). BIA is a widely recognized method for estimating body composition, particularly the proportions of fat mass and lean body mass [22]. The device uses a regression formula that incorporates impedance, height, weight, age, and sex to predict body composition. Height is particularly important because the relationship between height² and resistance helps model the body as an equivalent cylinder, enabling accurate calculations [23]. BIA works by passing a small, painless electrical current through the body and measuring the resistance (impedance) encountered. Since lean tissue, which contains a high proportion of water and electrolytes, conducts electricity efficiently, while fat tissue resists it, the impedance measurement provides valuable insights into body composition [24]. The BIA system calculates parameters such as total body water (TBW), which is used to estimate lean body mass (FFM) and, by subtraction, fat mass (FM) [25]. TBW is further divided into two compartments: intracellular water (ICW), found within the cells, and extracellular water (ECW), which is the fluid outside the cells. Additional parameters measured include basal metabolic rate (BM), which represents energy expenditure at rest, muscle mass (MM), body mass index (BMI), and body cell mass (BMC), the metabolically active tissue of the body (such as organs, muscles, and blood cells).

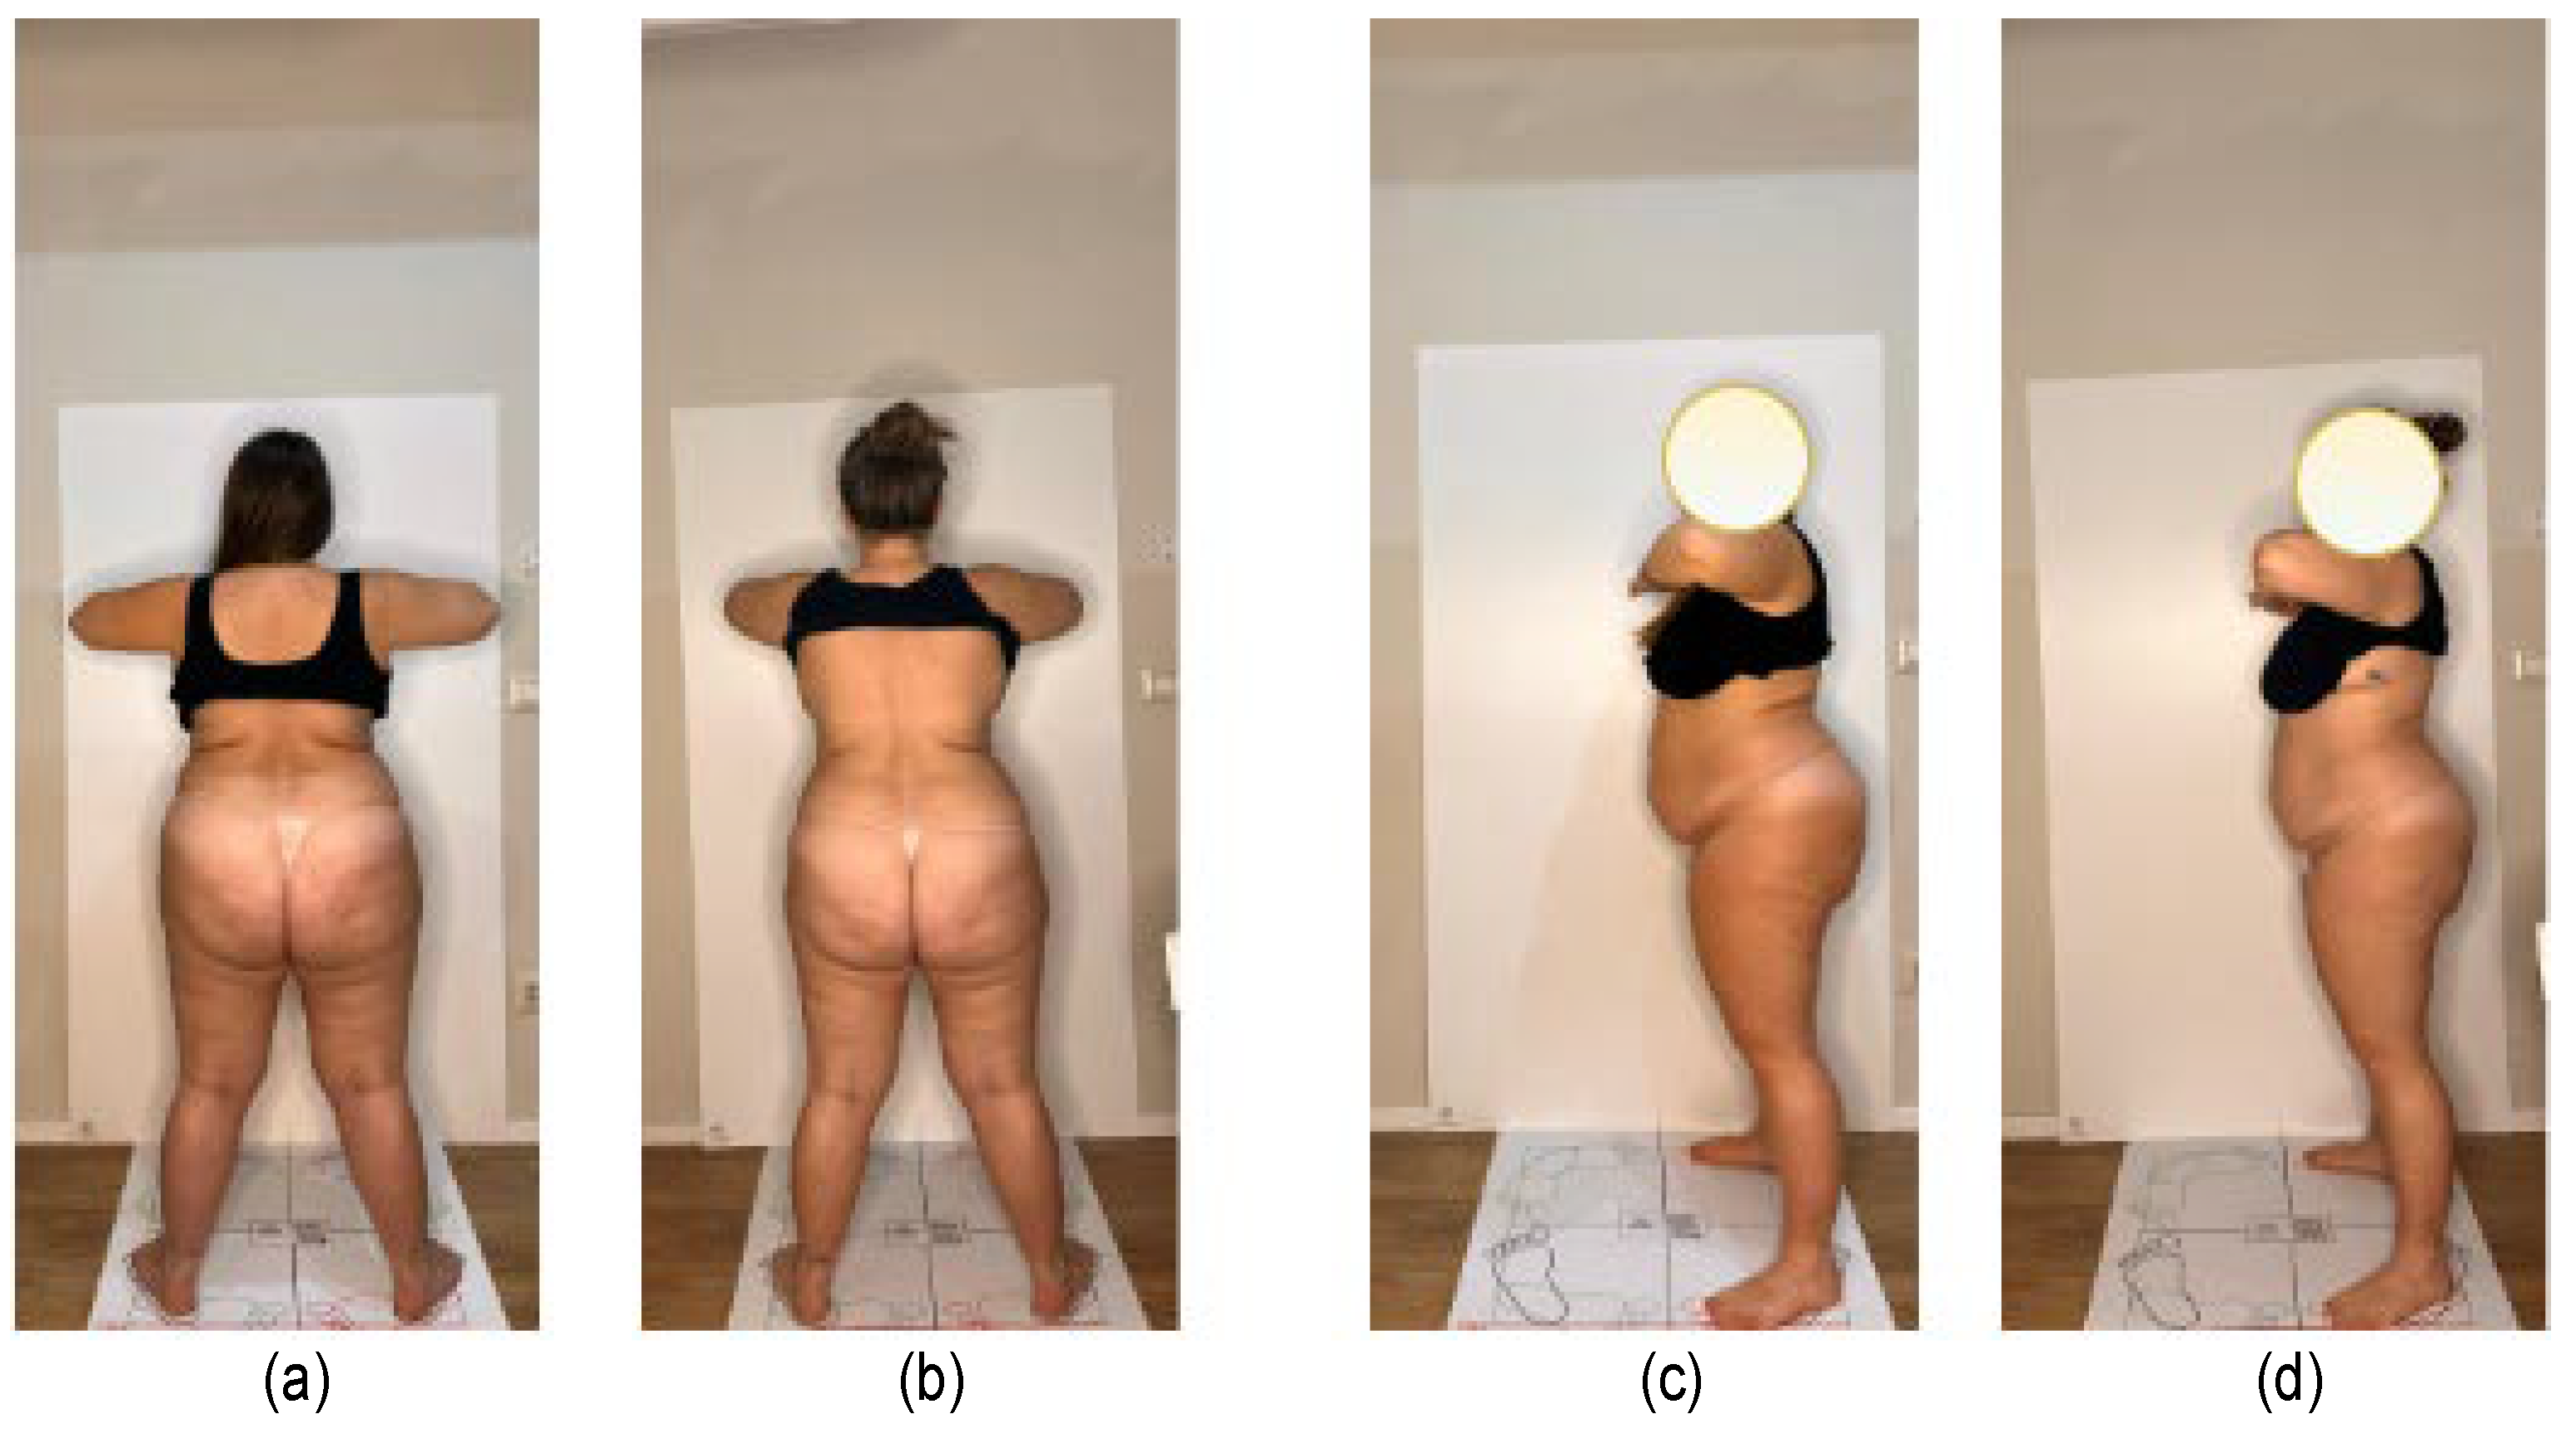
2.2. Data Acquisition
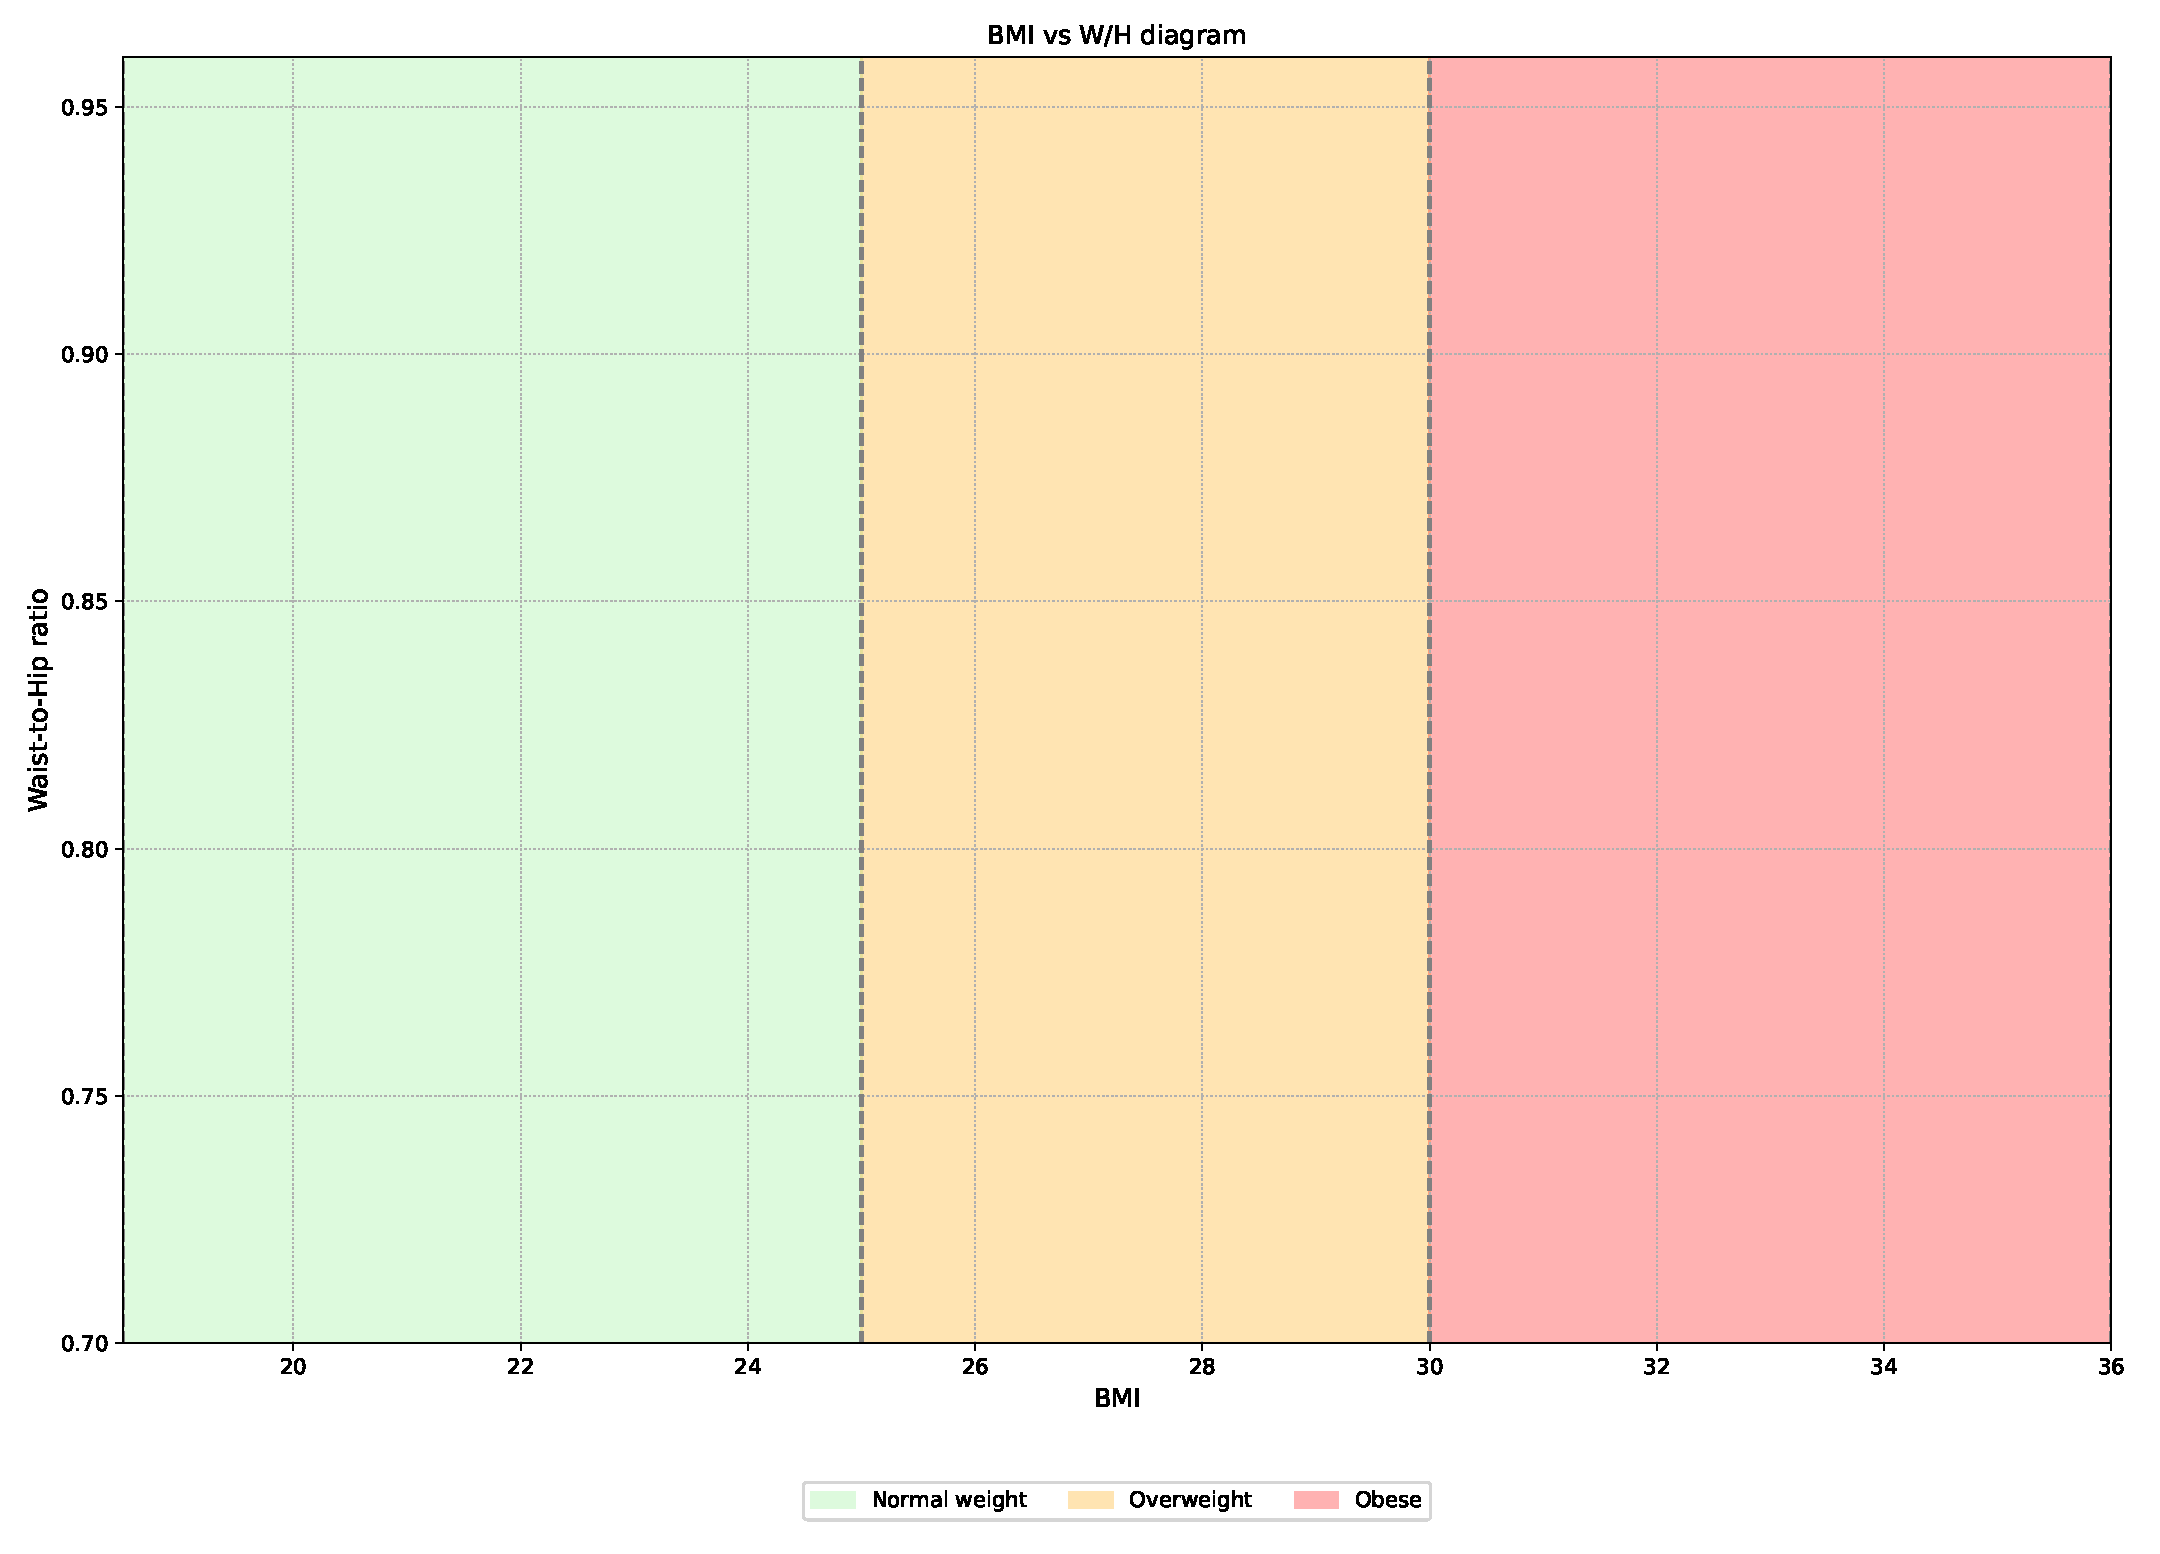
Twelve beauty shops were identified and eligible to participate in this study. Each shop selected 3 female clients who met the following characteristics: (1) age between 18 and 45 years, (2) not in menopause, and (3) specific gynoid constitutions. A total of 36 people were enrolled in the study, and all of them gave their informed consent before the collection and acquisition of the data, which was carried out in compliance with the ethical principles of the Helsinki Declaration.
The treatments were performed with the T-Modella 5.0 technologies following a pre-set path of 16 sessions, visible in Figure 2. Each client underwent 2 treatments per week for 8 weeks. Every 4 treatments, BIA data, waist and hip measurements, and photographs were collected to monitor the client’s progress. A specific protocol was developed for this data collection process, which all practitioners were required to follow. Measurements were taken after the 4th, 8th, 12th, and 16th treatments, always before starting the next session. To ensure consistency, clients were scheduled for treatments either in the morning or afternoon, maintaining the same time range throughout the process. At each appointment, clients were also asked to complete a form reporting any changes in habits, menstrual cycle, new medications, additional cosmetic body treatments, or dietary adjustments. To ensure consistency in the photographs, we designed a platform for clients to stand on, helping them maintain the same foot placement and leg distance across all sessions. A white cardboard background was used in every centre to standardise the backdrop. Photographs were taken using mobile phones placed within a ring light, which was set to a height of one meter and adjusted to a warm light setting. The distance between the platform and the ring light was 2.5 m, allowing for a full-body frame while accommodating individuals of varying heights. Figure 3 illustrates the photo acquisition setup.
The front, back, left, and right sides of the subjects were photographed with their arms spread wide in a T shape for the first two cases, and forward for the side shots. The BIA was measured with the device described above, and the waist and hip measurements were taken. The waist circumference is measured between the lower edge of the last rib and the iliac crest, or approximately at the navel, while the hip circumference is measured at the height of the upper head of the femur, which corresponds to the maximum circumference of the buttocks. Therefore, we gathered the following data for each subject: BMI, BM, hip and waist measurements, FM, FFM, MM, BCM, TBW, ECW, and ICW. The BMI ranges were defined as (i) normal between 18.5 and 24.9, (ii) overweight from 24.9 and 29.9, and (iii) obese over 30. Shusa S.r.l. supplied all of the materials, and to preserve uniformity, they were the same for all participating centres.

2.3. Data Analysis

We calculated the waist-to-hip ratio (W/H) as it is clinically relevant [26,27]. A W/H value greater than 0.80 indicates a fat distribution primarily in the abdominal area with a consequent higher probability of developing cardiometabolic disorders, such as type 2 diabetes, hypertension, and heart disease. On the contrary, a W/H ratio below 0.80 suggests that fat is predominantly stored around the hips and legs.
For each check-up, we made tables using the previously specified variables. The population was divided into three main categories based on BMI: normal weight, obese, and overweight. We determined each feature’s median and standard deviation to have a better grasp of the data distribution.
One of the objectives of this project is to develop intelligent systems for personalised treatment. As an initial step, we applied clustering algorithms to analyse how different subjects responded to the treatments. Specifically, we used the K-means algorithm [28], a form of unsupervised learning suited for unlabeled data. The purpose of this algorithm is to identify groups within the data, with the number of groups determined by the variable K. The algorithm operates iteratively, assigning each data point to one of the K clusters based on the provided features. Clustering occurs based on the similarity of features [29]. K-means clustering was selected because we had prior knowledge that the data would likely segment into predefined groups (e.g., normal weight, overweight, obese), and we expected the clustering results to align with these distinctions. Given this prior knowledge, K-means was an appropriate choice, as it efficiently handles well-separated, roughly spherical clusters and performs effectively when the number of clusters is known in advance [30]. Although K-means is typically applied to larger datasets, it was used here with a relatively small sample size (28 patients). While the limited size may affect the stability and generalizability of the clustering results, K-means can still yield meaningful insights when applied cautiously. Furthermore, the variables included were numerical, making them suitable for this algorithm. Therefore, despite the small sample size, the application of K-means was justified for preliminary exploration and pattern recognition in this context.
The algorithm was implemented using the Python 3.12.6 library sklearn and applied to each check-up. We dynamically adjusted the hyperparameters to achieve the optimal configuration. In the final step, we used the Euclidean distance with a random state set to 42 and n_init set to 100. To evaluate all configurations, we varied K and calculated the Silhouette score [31].

3. Results and Discussion

This paper aims to critically analyse the efficacy of various aesthetic treatments and assess their broader impact. We conducted data acquisition through 11 beauty shops, gathering comprehensive treatment data. The outcomes were analysed using clustering algorithms to identify patterns and assess treatment efficacy. Additionally, the paper seeks to develop an innovative algorithm capable of personalising aesthetic treatment plans based on each patient’s unique physiological characteristics, health profile, lifestyle, and personal goals. By integrating a holistic perspective with advanced therapeutic methodologies, this approach aims to maximise both aesthetic and health-related outcomes, setting a new standard in patient-centred care within the field of aesthetic medicine.
In this section, we present the numerical results, highlighting the steps and methodologies that led to the development of the personalisation algorithm. By analysing the data and refining the parameters, we achieved a tailored approach that addresses individual variability with precision. Additional results can be found in the Appendix A.

3.1. Data Acquisition and Analysis

Out of the initial 12 beauty shops, only 11 qualified for the trial, as each of them completed the protocol with at least one participant. A total of 28 clients provided all the necessary data, including measurements and images. The average age of the participants was 33.32 ± 7.57 years. To analyse the data, the participants were divided into three groups: normal weight, overweight, and obese, consisting of 14, 8, and 6 individuals, respectively. The average ages for these groups were 34.28 years for normal weight, 33.25 years for overweight, and 31.16 years for obese participants. As previously mentioned, a table was created for each subject containing their feature values. The results (mean and the confidence interval) for the three subcategories are presented in Table A1, Table A2 and Table A3 in the Appendix A. Through data analysis, we observed the effects of the treatments on each group, and none of them experienced any side effects. In general, all participants showed improvement compared to the initial control, both in terms of body composition and cosmetic appearance, as illustrated in Figure 4. This demonstrates how targeted, consistent treatment over time can lead to significant changes in physical appearance and potentially improve overall health. Looking at Table 1, it can be observed that obese subjects are those who benefit most from this type of treatment. Hip and waist measurements decreased by approximately 6% and 8% compared to the first check-up. The fat mass was significantly reduced to the benefit of lean mass while maintaining good hydration. The situation is different for those of normal weight and overweight. For the former, it can be observed that there seems to be a small worsening in terms of body composition, even if there is a good decrease in cm on the abdomen and hips (−4% and −2% respectively). Observing the results up to the 4th session, there is a notable decrease in fat mass (−9.3%), an increase in lean and muscle mass (+2.8% and +4.5%) and −2 cm in both hip and waist. For those who are overweight, the situation is particular: it can be seen that on average there is a small increase in fat mass and also in muscle mass, increasing hydration and losing centimetres on the abdomen and not on the hips. These results led to more in-depth analyses, as external factors could have influenced the final result. Each client had filled out personal sheets at each treatment in which they indicated additional information (e.g., menstruation, change in habits, physical activity, etc.). Analysing a 41-year-old overweight subject, we saw that after the second check-up, she started physical activity, and the contraceptive pill and reported experiencing periods of strong stress. The fat mass went from 12.45 kg to 17.25 kg while the lean mass decreased by 3 kg. The same thing for the abdomen and hips: after an initial decrease of 3 cm, the measurements returned to the starting point.
Based on these results, it became evident that an algorithm was required to customise the treatments for each individual. The varied responses to the program, particularly from those who were overweight and those of normal weight, highlighted that considering only basic individual factors was insufficient. The findings showed that external variables, such as stress levels, hormonal fluctuations, and physical activity, had a significant impact on the outcomes. This underscored the need for a more advanced approach capable of factoring in these individual influences and adjusting treatment plans accordingly to optimise results for each patient.

3.2. Statistical Analysis

The ANOVA results (Table 2) indicate significant differences among the three groups (normal weight, overweight, and obese) for several variables at both the initial and final sessions. Notably, FM, BMI, Waist Circumference, and Waist-to-Hip Ratio show highly significant p-values (p < 0.001) in both sessions, suggesting strong differences across the groups. Comparing the initial and final sessions, the statistical significance of Metabolism and Hip Circumference has increased, while variables such as FFM and BCM remain non-significant (p > 0.05), indicating a stable trend over time. ICW and ECW do not show significant differences among groups in either session.
These results highlight the persistent differences in body composition between groups and suggest that certain variables, particularly those related to fat distribution, remain key discriminators among normal weight, overweight, and obese individuals.

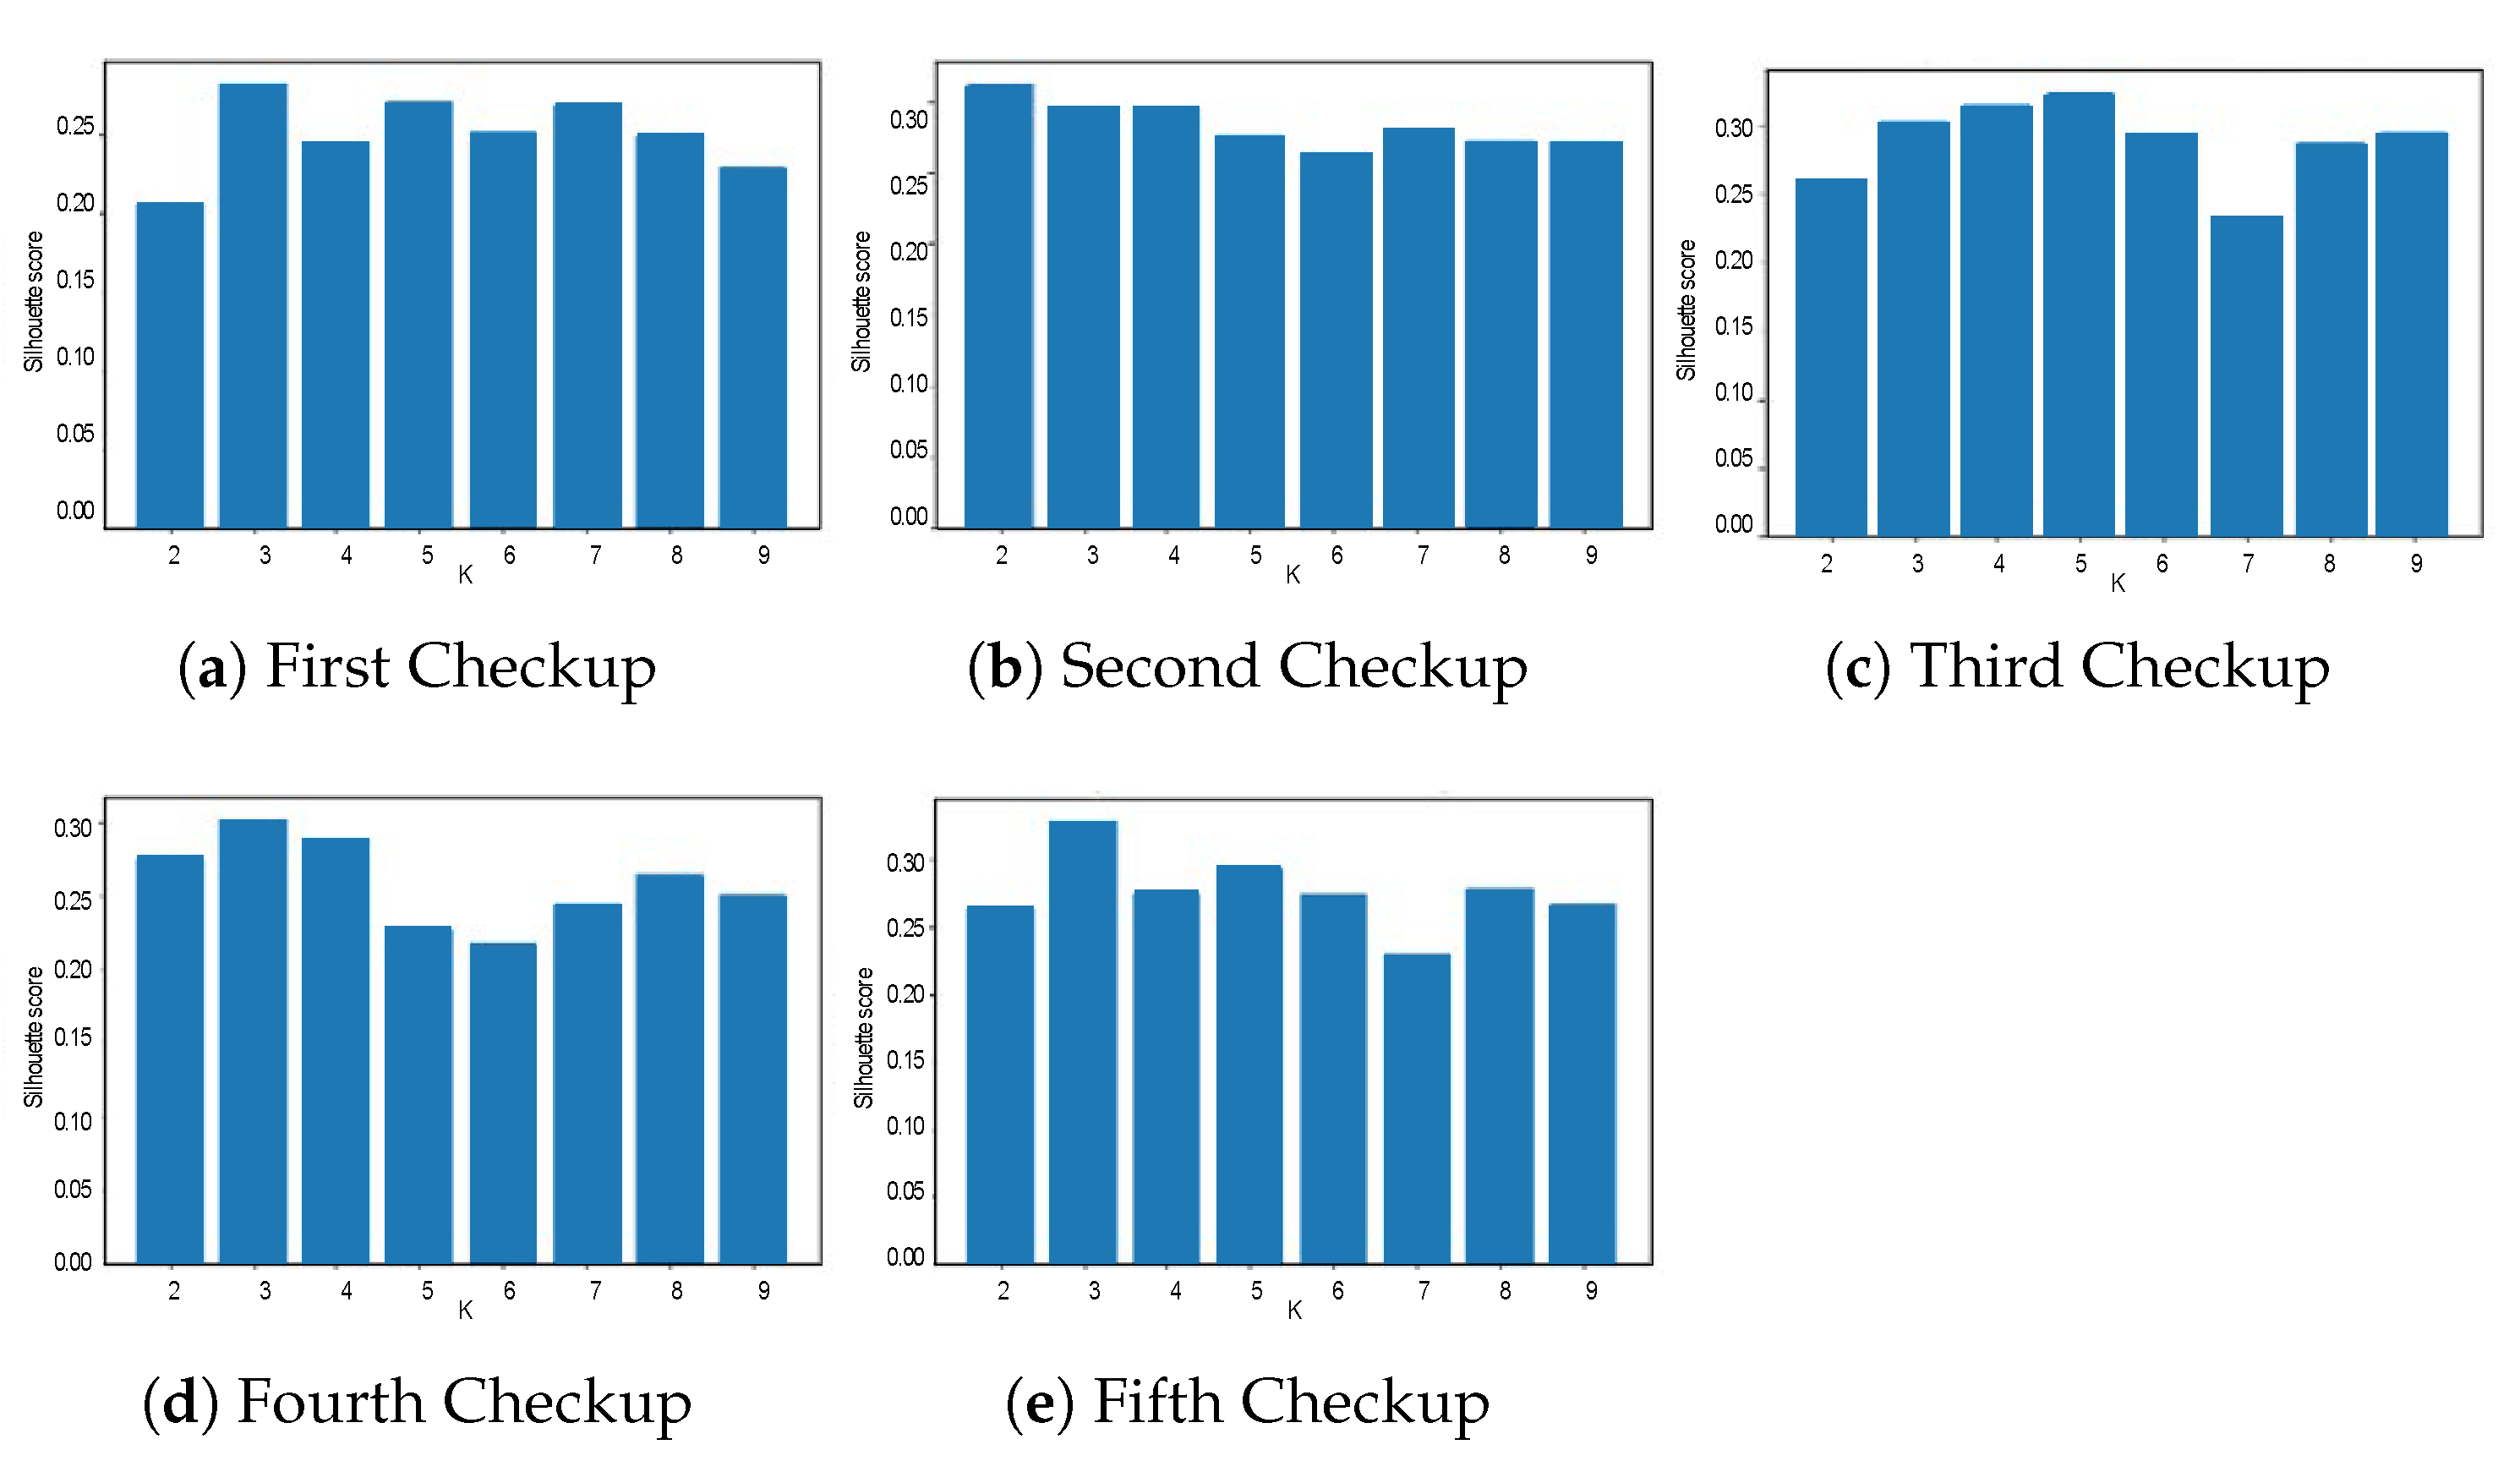
3.3. Clustering Results

The clustering evaluation metrics in Table A4 suggest that Check-up 4 produced the best overall clustering results, mainly when using two clusters (K = 2). However, as the number of clusters increased (K = 3, K = 4), the clustering quality did not significantly improve according to the Davis–Bouldin and Calinski–Harabasz scores. This indicates that adding more clusters did not necessarily lead to better-defined groups. Looking at the silhouette scores across check-ups (Figure A1), the optimal number of clusters varied. For some check-ups, the best clustering was achieved with K = 2 or K = 5, while others performed best at K = 3. However, to maintain consistency across all check-ups, we decided to use K = 3 for all cases. This choice was based on the fact that, in some cases, the difference between K = 3 and K = 4 was minimal, and in others, using fewer clusters (K = 2) would have been too restrictive given the complexity of the data. By standardising the number of clusters to three across all check-ups, we ensured that the clustering approach remained comparable across different time points, while still preserving meaningful group distinctions within the data.
The clusters were characterised based on the previously described features, with results available in the Appendix A. Once the clusters were identified, we analysed the average values of all the features to connect the clusters over time. This allowed us to identify trajectories that expressed the impact of the treatment over time, providing valuable insights into the temporal dynamics and the effectiveness of the intervention (Table A5 in the Appendix A shows the results). We identified these three paths:
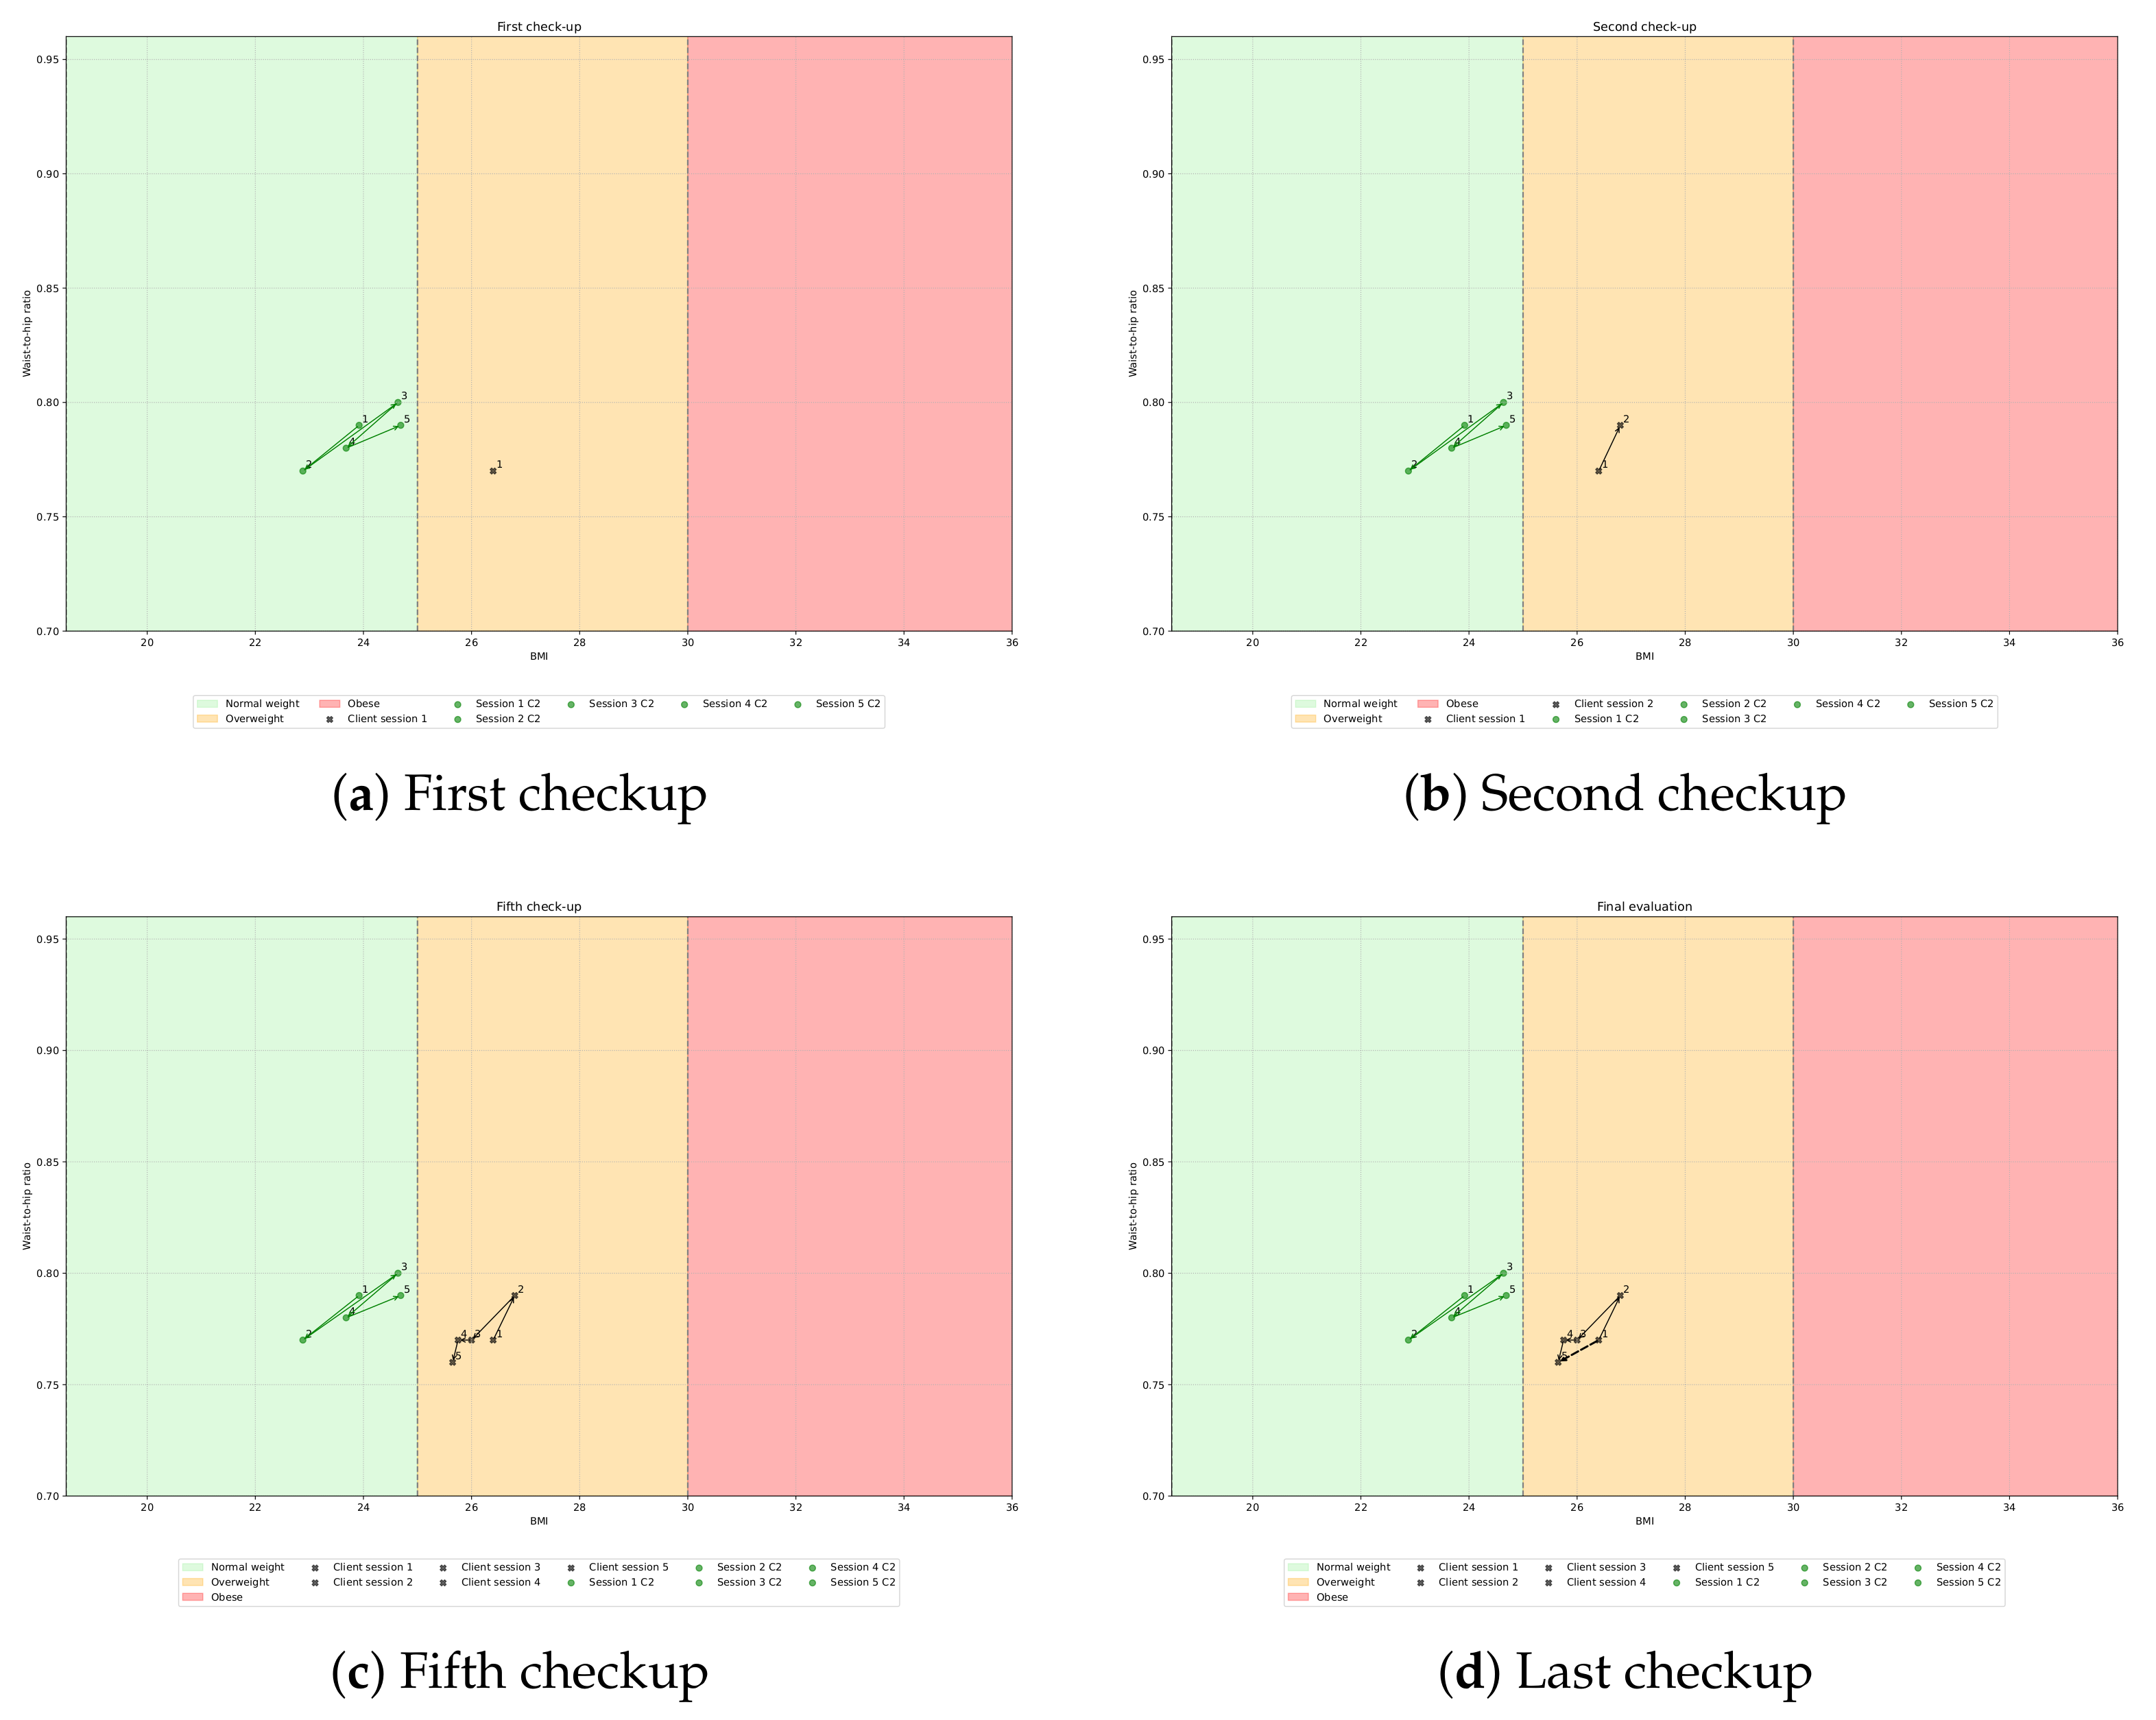
  • Path 1: Cluster 1 → Cluster 3 → Cluster 3 → Cluster 1 → Cluster 1.
  • Path 2: Cluster 2 → Cluster 1 → Cluster 1 → Cluster 3 → Cluster 3.
  • Path 3: Cluster 3 → Cluster 2 → Cluster 2 → Cluster 2 → Cluster 2.
Path 3 reflects individuals with obesity, characterized by values outside the recommended ranges for maintaining good health and preventing cardiometabolic complications. These individuals show clear markers of increased risk due to excessive body mass and unfavourable metabolic profiles. In contrast, Path 1 and Path 2 represent individuals with values that fall within the normal weight/slightly overweight range on average. However, the distribution of body mass in these groups varies significantly, indicating potential early signs of future cardiometabolic complications. For instance, disproportionate fat distribution or altered body composition could still predispose these individuals to health issues, even if their weight appears “normal” by conventional metrics.
These findings have underscored the necessity of incorporating medical considerations into the development and implementation of such protocols. They demonstrate that focusing solely on weight or BMI is insufficient; a more comprehensive approach, which evaluates body composition and fat distribution, is essential. Moreover, the results highlight the importance of personalized strategies to address individual risk profiles effectively, ensuring both safety and optimal outcomes.

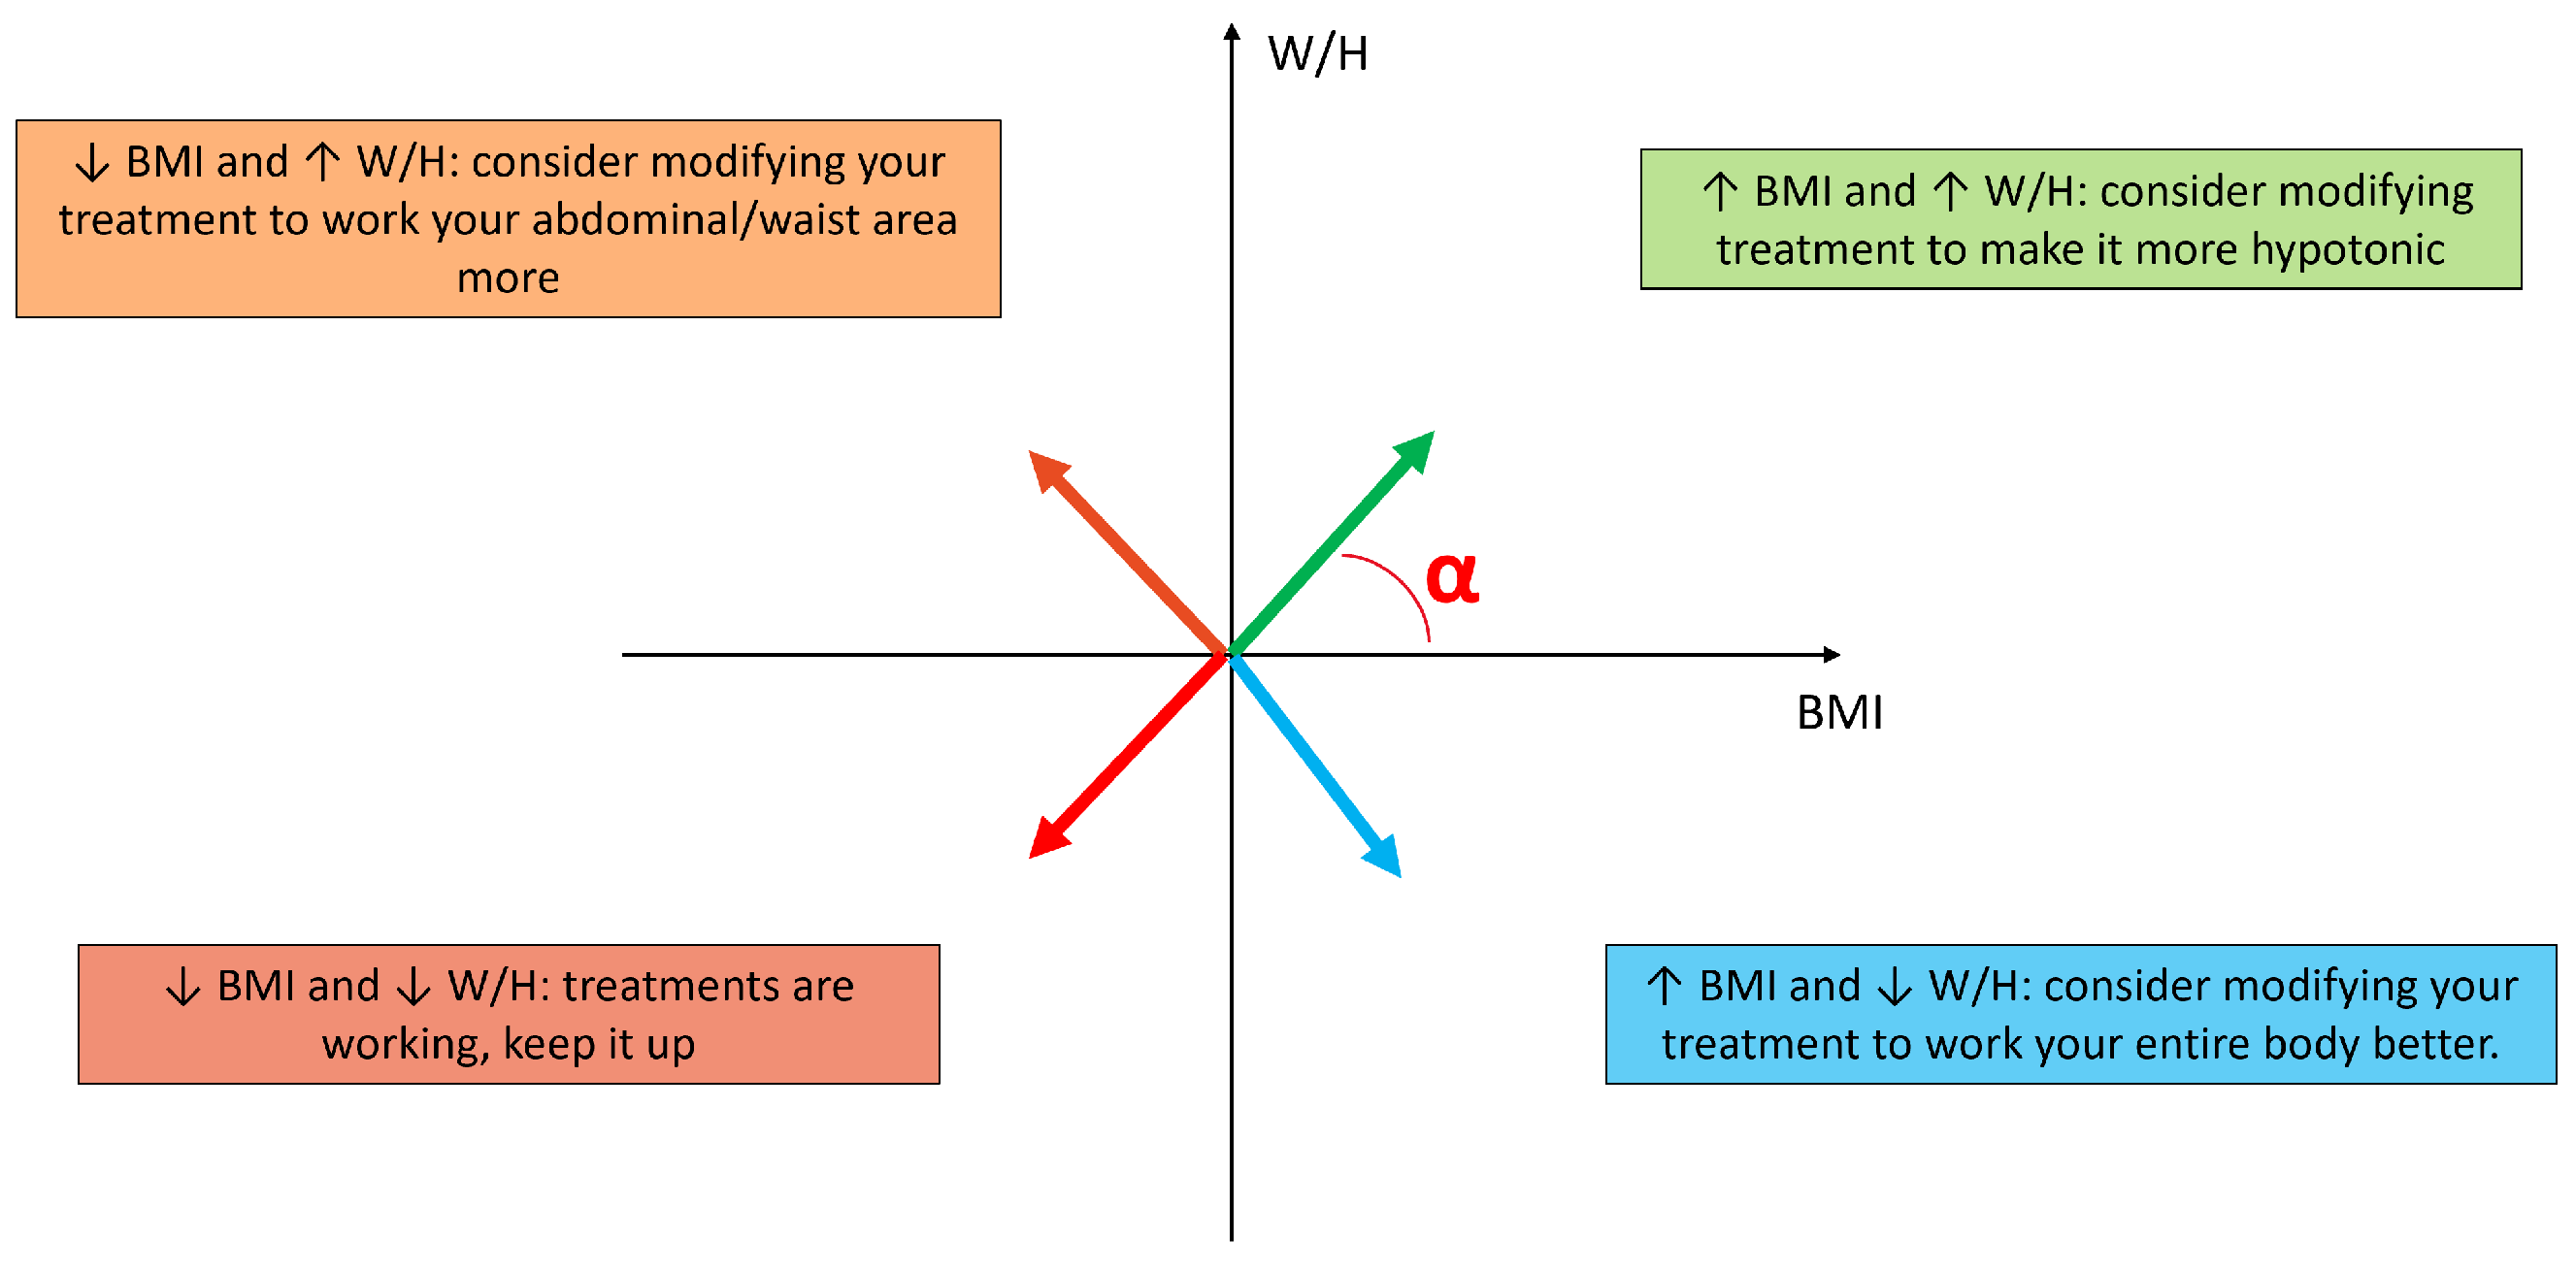
3.4. Treatment Suggestion Algorithm

Based on the clustering results, which revealed that aesthetic and clinical outcomes do not always align, and supported by the statistical significance observed in the table—particularly the p-values for BMI and W/H—we decided to develop an algorithm to guide treatment planning in a way that both factors would converge. The statistical analysis underscores the importance of using BMI and W/H as key metrics for achieving a balanced approach between aesthetic and clinical outcomes. A treatment personalisation system should be user-friendly and simple to operate. We found that the BMI, waist, and hip measurements were the most commonly used and familiar features for operators. For the waist and hip measurements, we opted to use the waist-hip ratio, as it is both meaningful and holds significant clinical relevance. In fact, a higher value reflects an important central adiposity and highlights the critical need for targeted lifestyle changes to mitigate these health risks. ON the contrary, a lower value is considered less harmful since it means that the fat is smaller on the abdominal area, significantly reducing the likelihood of experiencing cardiometabolic complications. Maintaining a lower W/H ratio is not only beneficial for overall health but also underscores the importance of adopting a balanced diet and regular physical activity to preserve this healthier fat distribution pattern [32].
In this way, treatments may be used for cosmetic reasons and to enhance one’s health. Therefore, we constructed a BMI vs. W/H diagram (Figure 5 and Figure 6) to visualise the clients’ progress during the treatments.
The concept behind the system is outlined as follows (Figure A2 in the Appendix A): the operator inputs the client’s initial BMI and waist-to-hip (W/H) measurements into the algorithm. This allows the system to determine the initial cluster to which the client belongs and predict their progression if no adjustments are made to the treatment. The first four sessions are standardised for all clients, ensuring a uniform starting point. After these initial sessions, the operator provides the algorithm with both the first and second BMI and W/H ratio values to compute a vector. This vector represents the client’s response to the treatments. The direction of the vector is influenced by the changes in these values, and the angle of the vector is then used to generate specific treatment recommendations. Based on the vector’s angle, the system offers targeted suggestions for the next steps in the treatment process (Figure 7). Specifically:
  • Angle between 0 and π / 2 : ↑ BMI and ↑ W/H consider modifying treatment to make it more hypotonic;
  • Angle between π / 2 and π : ↓ BMI and ↑ W/H consider modifying your treatment to work your abdominal/waist area more;
  • Angle between π and 3 π / 2 : ↓ BMI and ↓ W/H treatments are working, keep it up.
  • Angle between 3 π / 2 and 2 π : ↑ BMI and ↓ W/H consider modifying your treatment to work your entire body better.
Each suggestion provided by the algorithm is linked to a new set of treatments or sessions, which the operator can either accept or decline based on their professional judgment. This iterative process is followed at each check-up, allowing for continuous monitoring of the client’s progress. As the treatment evolves, the algorithm suggests modifications or adjustments to ensure the most effective path is taken to optimise the results. After four sessions, the final vector is calculated, and a comprehensive evaluation of the entire treatment journey is conducted. This assessment provides an overall view of the progress and allows the operator to make informed decisions about the next steps. Based on the same criteria previously mentioned, the algorithm will generate a recommendation to either continue or adjust the treatment plan accordingly. Figure 8 illustrates how the algorithm functions, outlining the decision-making process from initial input to final recommendations. This dynamic system not only personalises the treatment based on individual responses but also adapts over time to maximise the outcome for each client.

3.5. Limitations and Future Works

This study faced several limitations that may have influenced the results. Firstly, the number of participants was limited, and inconsistencies in material sharing among participating centres hindered recruitment efforts. While the sample size was adequate for generating preliminary insights and conducting exploratory analyses, such as clustering and personalised treatment suggestions, we acknowledge that the relatively small cohort may constrain the generalisability of the findings. This highlights the importance of future studies involving larger and more diverse populations to validate the robustness and clinical relevance of our approach. Another limitation was the limited variability in the participants’ body compositions. The sample included predominantly normal-weight and overweight individuals, with relatively few obese participants. This uneven distribution may have restricted the clinical inferences that could be drawn. A broader range of body types would enhance the depth and reliability of the analysis. Lastly, the collection of photographic data proved challenging. The beauty industry currently lacks standardised methods for capturing and documenting visual outcomes, which in turn limits the potential for objectively evaluating treatment effectiveness. To address this, improved training for operators is essential—not only to ensure consistent tracking of results, but also to encourage a more holistic health-focused approach, ideally in collaboration with medical professionals and nutritionists.
Future research must greatly expand both the number of individuals and the variability to provide generalisation and scalability in different situations. Additionally, a second campaign to validate and refine the treatment suggestion algorithm’s performance should be done. This will allow us to further evaluate its effectiveness and robustness in different patient populations. From a clinical and aesthetic perspective, it will be essential to investigate whether and how the implementation of this therapy personalisation algorithm has affected the end outcomes. Additionally, expanding the range of therapy options and delving deeper will be interesting. Lastly, creating AI algorithms that can recommend the optimal course of action based on a client’s photo is a novel approach comparable to those used in other fields of aesthetic medicine.

4. Conclusions

Cosmetic procedures are increasingly being embraced not only to enhance physical appearance but also to promote overall well-being. Today, individuals are often driven by both medical and aesthetic motivations when seeking such treatments. This dual purpose highlights the importance of integrating clinical and cosmetic goals within a single, cohesive approach. By studying a group of individuals, we have demonstrated how physiological responses to specific stimuli are reflected in their body composition. Advanced technologies have shown strong potential in delivering results that are both medically beneficial and aesthetically satisfying. To further underscore the health-related value of these procedures, we have developed an algorithm that recommends and personalises cosmetic treatments, aiming to optimise both clinical effectiveness and aesthetic appeal. The integration of artificial intelligence enhances the precision and adaptability of these technologies, enabling a more targeted and physiologically informed application. This innovative approach represents a significant breakthrough—the first of its kind in the field. It lays the groundwork for the future of personalised care, where state-of-the-art protocols and intelligent algorithms converge to achieve superior outcomes in both health and appearance. Ultimately, it sets a new standard for the intersection of medical science and aesthetic practice.

Author Contributions

Conceptualization, S.C. and L.P.; methodology, S.C. and L.P.; software, S.C.; validation, S.C. and L.P.; formal analysis, S.C. and L.P.; investigation, S.C. and L.P.; resources, S.C. and L.P.; data curation, S.C. and L.P.; writing—original draft preparation, S.C. and L.P.; writing—review and editing, S.C. and L.P.; visualization, S.C. and L.P.; supervision, S.C. and L.P.; project administration, L.P.; funding acquisition, L.P. All authors have read and agreed to the published version of the manuscript.

Funding

This research received no external funding.

Institutional Review Board Statement

Ethics review and approval were waived for this study because the retrospective analysis of the recorded data was conducted using completely anonymous data. The experimental study did not involve any invasive or medical procedures and introduced no lifestyle changes. All subjects gave their informed consent before the collection and acquisition of the data, which was carried out in compliance with the ethical principles of the Helsinki Declaration.

Informed Consent Statement

Written informed consent for publication was obtained from all subjects involved in the study.

Data Availability Statement

The raw data supporting the conclusions of this article will be made available by the authors upon request.

Acknowledgments

Shusa S.r.l (Morrovalle, Macerata, Italy) supported this study by providing the T•modella 5.0 technologies used for the treatments. Nobody from that company participated in the data collection, analysis, and interpretation.

Conflicts of Interest

Author Lorenzo Palma has disclosed a potential conflict of interest, including receipt of payment for the design of the T•modella 5.0 technologies. Other author declares no conflict of interest.

Abbreviations

The following abbreviations are used in this manuscript:
AIArtificial IntelligenceBMIBody Mass Index
DSSDecision Support SystemECWExtracellular Water
BIABioelectrical Impedance AnalysisMMMuscle Mass
TBWTotal Body WaterFMFat Mass
FFMFat Free MassBCMBody Cell Mass
ICWIntracellular WaterW/HWaist to Hip ratio
BMBasal Metabolic Rate

Appendix A

Table A1. Normal weight.
VariableCheck Up 1Check Up 2Check Up 3Check Up 4Check Up 5
FM15.97 (13.65–18.29)15.25 (12.97–17.53)16.01 (13.86–18.16)15.09 (13.21–16.98)15.65 (14.05–17.26)
FFM43.24 (37.87–48.62)44.07 (41.61–46.53)44.67 (41.55–47.79)46.10 (43.58–48.62)45.34 (42.87–47.82)
MM21.46 (19.49–23.43)20.91 (19.07–22.74)20.74 (18.22–23.25)22.57 (20.87–24.26)21.93 (20.33–23.54)
BCM21.33 (20.00–22.66)20.92 (19.73–22.12)19.81 (16.76–22.86)21.73 (20.55–22.92)21.38 (20.21–22.54)
TBW33.05 (30.30–35.80)32.44 (29.68–35.20)32.10 (28.52–35.67)34.55 (32.32–36.79)33.67 (31.39–35.95)
ICW18.91 (17.20–20.61)18.45 (16.95–19.95)18.39 (16.33–20.45)19.73 (18.33–21.12)19.25 (18.11–20.40)
ECW14.37 (13.22–15.53)15.92 (11.43–20.41)13.70 (12.11–15.29)14.23 (12.28–16.19)14.59 (13.42–15.76)
BMI22.68 (21.81–23.55)22.19 (21.34–23.04)22.54 (21.71–23.37)22.71 (21.90–23.51)22.64 (21.76–23.53)
Metabolism1171.93 (1023.13–1320.72)1235.50 (1208.68–1262.33)1268.29 (1211.10–1325.48)1264.39 (1231.61–1297.18)1258.06 (1224.26–1291.85)
Waist78.50 (74.42–82.58)71.04 (66.28–75.79)73.03 (68.18–77.88)73.29 (68.52–78.06)73.00 (67.80–78.20)
Hip100.06 (95.63–104.50)94.57 (89.76–99.38)94.12 (88.50–99.75)94.82 (89.14–100.51)94.50 (88.51–100.49)
Height164.25 (161.35–167.15)163.57 (160.43–166.72)164.12 (161.14–167.11)164.18 (161.39–166.96)164.18 (161.39–166.96)
W/H0.77 (0.75–0.80)0.75 (0.72–0.78)0.78 (0.75–0.81)0.77 (0.75–0.80)0.77 (0.74–0.80)
Age33.75 (29.80–37.70)33.79 (29.45–38.13)33.50 (29.72–37.28)32.59 (28.56–36.62)32.59 (28.56–36.62)
Table A2. Overweight.
VariableCheck Up 1Check Up 2Check Up 3Check Up 4Check Up 5
FM21.53 (11.50–31.56)23.20 (15.48–30.91)22.18 (12.57–31.78)28.11 (18.90–37.31)25.43 (18.27–32.59)
FFM47.70 (39.78–55.63)46.62 (40.25–52.98)47.95 (40.80–55.09)42.61 (38.00–47.23)45.99 (38.15–53.84)
MM22.48 (17.15–27.81)23.38 (18.83–27.93)23.10 (18.77–27.43)20.10 (17.80–22.40)21.72 (17.78–25.67)
BCM22.49 (18.75–26.22)21.98 (18.98–24.98)22.61 (19.24–25.98)20.09 (17.91–22.27)21.69 (17.99–25.38)
TBW35.54 (28.65–42.43)32.77 (21.35–44.19)36.44 (31.42–41.46)32.77 (29.86–35.69)34.82 (30.55–39.08)
ICW19.66 (15.11–24.21)20.10 (16.28–23.92)20.21 (16.74–23.69)17.52 (15.57–19.46)19.17 (16.63–21.70)
ECW15.88 (13.21–18.55)16.42 (14.37–18.47)16.23 (14.35–18.10)15.26 (13.62–16.91)15.65 (13.76–17.54)
BMI27.64 (26.09–29.19)26.75 (25.29–28.20)27.03 (25.08–28.98)27.50 (25.03–29.96)27.78 (25.44–30.13)
Metabolism1421.39 (1231.14–1611.64)1394.48 (1270.41–1518.55)1437.41 (1278.50–1596.32)1342.70 (1203.28–1482.12)1402.44 (1210.02–1594.86)
Waist86.83 (82.46–91.21)86.81 (83.29–90.33)85.08 (81.41–88.76)84.20 (77.15–91.25)85.00 (79.73–90.27)
Hip109.33 (105.97–112.70)106.00 (102.34–109.66)107.83 (103.77–111.89)106.60 (100.74–112.46)108.00 (102.66–113.34)
Height160.50 (154.14–166.86)162.62 (157.15–168.10)160.83 (154.66–167.00)160.00 (152.35–167.65)160.00 (152.35–167.65)
W/H0.79 (0.76–0.82)0.82 (0.78–0.86)0.79 (0.76–0.82)0.79 (0.75–0.83)0.79 (0.77–0.81)
Age34.33 (23.78–44.88)34.12 (26.42–41.83)35.00 (23.85–46.15)38.40 (29.25–47.55)38.40 (29.25–47.55)
Table A3. Obese.
Table A3. Obese.
VariableCheck Up 1Check Up 2Check Up 3Check Up 4Check Up 5
FM47.43 (46.53–48.34)45.08 (44.22–45.94)45.17 (42.96–47.39)43.81 (42.36–45.26)44.72 (39.46–49.99)
FFM39.00 (38.47–39.52)40.64 (39.47–41.82)41.04 (38.83–43.25)40.34 (39.56–41.13)40.85 (38.59–43.10)
MM19.85 (19.33–20.37)20.36 (19.62–21.10)20.94 (20.25–21.62)20.88 (20.04–21.72)20.92 (20.21–21.63)
BCM18.19 (17.82–18.56)19.25 (18.57–19.93)19.22 (18.12–20.33)19.26 (18.81–19.71)19.23 (18.10–20.36)
TBW32.87 (31.85–33.88)34.04 (32.51–35.57)34.10 (31.96–36.24)33.64 (32.90–34.37)34.15 (32.31–35.98)
ICW17.39 (17.04–17.73)17.91 (17.18–18.65)18.35 (17.12–19.58)17.90 (17.50–18.30)18.07 (17.15–19.00)
ECW15.20 (14.47–15.93)15.69 (14.99–16.39)15.59 (14.81–16.38)15.85 (15.57–16.14)16.08 (15.17–16.99)
BMI33.17 (30.19–36.16)32.97 (30.30–35.65)32.90 (30.34–35.46)32.61 (30.11–35.11)32.62 (30.36–34.87)
Metabolism1419.70 (1418.27–1421.14)1440.83 (1437.86–1443.80)1434.57 (1421.35–1447.80)1201.75 (587.35–1816.16)1434.78 (1430.75–1438.82)
Waist113.75 (112.71–114.79)115.00 (112.52–117.48)114.08 (110.93–117.24)111.08 (107.93–114.24)104.38 (102.33–106.42)
Hip121.25 (118.40–124.10)120.79 (118.40–123.19)120.29 (117.77–122.81)118.29 (115.77–120.81)114.46 (111.45–117.47)
Height157.83 (153.94–161.73)157.83 (153.94–161.73)157.83 (153.94–161.73)157.83 (153.94–161.73)157.83 (153.94–161.73)
W/H0.93 (0.91–0.95)0.95 (0.94–0.96)0.95 (0.94–0.96)0.94 (0.93–0.95)0.91 (0.90–0.93)
Age31.17 (24.82–37.51)31.17 (24.82–37.51)31.17 (24.82–37.51)31.17 (24.82–37.51)31.17 (24.82–37.51)
Table A4. Clustering metrics.
MetricsCheck-Up 1Check-Up 2Check-Up 3Check-Up 4Check-Up 5
K = 2K = 3K = 4K = 2K = 3K = 4K = 2K = 3K = 4K = 2K = 3K = 4K = 2K = 3K = 4
Calinski-Harabatz80.50157.23187.6564.4078.3999.6368.9176.96101.33163.76457.41567.4277.3869.1982.22
Davis-Boulding0.080.370.260.480.320.430.540.550.560.0680.270.480.460.500.62
Table A5. Biometric data for the three paths (Path 1, 2, and 3).
PathCFMFFMMMBCMTBWICWECWBMIBMWAISTHIPHEIGHTW/HAGE
Path 1C117.13 ± 3.339.20 ± 9.819.16 ± 2.219.76 ± 1.2230.20 ± 3.2917.21 ± 1.9913.05 ± 1.5523.72 ± 2.141223.19 ± 47.3478.27 ± 7.32101.54 ± 7.27159.45 ± 4.650.76 ± 0.0434.27 ± 7.55
C312.53 ± 7.5752.61 ± 12.4528.32 ± 9.4725.81 ± 4.4542.44 ± 13.0524.33 ± 8.2131.61 ± 14.2524.65 ± 0.771481.88 ± 300.25100.00 ± 14.176.0 ± 18.3162.5 ± 3.530.75 ± 0.0722.5 ± 6.36
C317.7 ± 3.5541.13 ± 2.3918.33 ± 3.2717.57 ± 5.5828.85 ± 4.5516.38 ± 2.3512.46 ± 2.3722.53 ± 1.961250 ± 12091.45 ± 10.769.63 ± 7.73161.8 ± 5.20.76 ± 0.0532 ± 6.40
C117.22 ± 3.5842.01 ± 2.4819.99 ± 1.6719.81 ± 1.1731.31 ± 2.0917.66 ± 1.3112.55 ± 3.8422.91 ± 1.961233.6 ± 33.9292.18 ± 11.4070.31 ± 8.53161.09 ± 6.310.76 ± 0.0532.63 ± 7.04
C116.58 ± 3.6941.96 ± 2.8619.98 ± 2.0719.78 ± 1.3531.16 ± 2.517.93 ± 1.5913.47 ± 1.5422.72 ± 2.201229.3 ± 2.2091.5 ± 11.4169.33 ± 7.93160.83 ± 6.080.76 ± 0.0532.83 ± 6.75
Path 2C216.42 ± 7.750.48 ± 5.4124.78 ± 3.6223.90 ± 2.4537.63 ± 5.2121.37 ± 3.5916.55 ± 1.5723.92 ± 3.171249.31 ± 417.7782.50 ± 7.67102.5 ± 9.25167.60 ± 3.650.79 ± 0.0332.40 ± 8.24
C116.30 ± 4.5444.13 ± 4.7721.11 ± 3.2621.11 ± 2.2520.81 ± 4.6232.81 ± 2.5814.21 ± 2.2422.88 ± 2.011249.96 ± 60.6196.7 ± 81374.88 ± 9.66163.23 ± 6.440.77 ± 0.0535 ± 7.32
C116.22 ± 7.2250.8 ± 5.0524.98 ± 3.2923.98 ± 2.3838.23 ± 4.7221.83 ± 2.9616.40 ± 2.0624.6 ± 2.481383 ± 139.07103.4 ± 6.9382.7 ± 6.22165 ± 6.250.80 ± 0.0334.9 ± 9.10
C315.37 ± 6.4749.86 ± 3.5424.97 ± 2.3823.51 ± 1.6938.01 ± 2.7921.73 ± 1.9716.49 ± 1.2823.60 ± 2.201320.7 ± 90.83101.1 ± 7.9279.72 ± 7.39165.8 ± 4.590.78 ± 0.0434.44 ± 9.26
C318.18 ± 6.3750.31 ± 3.1824.74 ± 1.7023.72 ± 1.5037.77 ± 2.3221.13 ± 1.2616.64 ± 1.5234.69 ± 2.811363.4 ± 124.14103.94 ± 7.6582.88 ± 7.65166.66 ± 3.570.79 ± 0.0434.1 ± 9.29
Path 3C345.23 ± 5.8739.42 ± 1.2119.82 ± 0.4518.41 ± 0.6832.94 ± 0.9017.38 ± 0.2915.32 ± 0.7232.51 ± 3.131407.02 ± 33.56110.50 ± 8.64120.35 ± 3.42158.28 ± 3.590.91 ± 0.0533.14 ± 7.60
C240.82 ± 6.5242.01 ± 2.8820.69 ± 1.5919.87 ± 1.3630.88 ± 10.5617.95 ± 1.3015.95 ± 0.9331.56 ± 2.911431.63 ± 46.48116.97 ± 6.33106.0 ± 13.62159.77 ± 4.290.90 ± 0.0732.5 ± 6.72
C243.32 ± 3241.13 ± 1.9320.64 ± 0.9619.28 ± 0.9733.85 ± 1.9618.15 ± 1.1815.57 ± 0.6832.28 ± 2.761419 ± 42.39119.25 ± 3.52110.07 ± 10.96158.28 ± 3.590.92 ± 0.0733.14 ± 7.60
C241.51 ± 4.4540.97 ± 1.5120.58 ± 1.0619.49 ± 0.6633.32 ± 0.8517.55 ± 0.7115.85 ± 0.3631.74 ± 2.571245.3 ± 502.01116.34 ± 4.34105.31 ± 11.18159.12 ± 4.060.90 ± 0.0633.0 ± 7.05
C242.7 ± 7.0441.35 ± 2.3820.63 ± 0.9719.47 ± 1.1733.91 ± 1.718.01 ± 0.8115.90 ± 0.9132.09 ± 2.401426 ± 22.40114.25 ± 2.67102.03 ± 6.43158.28 ± 3.590.89 ± 0.0533.14 ± 7.60
Figure A1. Silhouette scores.
Cosmetics 12 00094 g0a1
Figure A2. Treatment suggestion made by the personalization algorithm on the diagram.
Cosmetics 12 00094 g0a2

References

  1. Grech, V.S.; Kefala, V.; Rallis, E. Cosmetology in the Era of Artificial Intelligence. Cosmetics 2024, 11, 135. [Google Scholar] [CrossRef]
  2. Ashley, E.; Parmar, A.; Novintan, S.; Watson, L.; Chadha, P. Exploring the psychological and social motivations for aesthetic treatments in the post-COVID era. J. Cosmet. Med. 2024, 8, 34–40. [Google Scholar] [CrossRef]
  3. Barone, M.; De Bernardis, R.; Persichetti, P. Aesthetic medicine across generations: Evolving trends and influences. Aesthetic Plast. Surg. 2024, 1–3. [Google Scholar] [CrossRef] [PubMed]
  4. Vatiwutipong, P.; Vachmanus, S.; Noraset, T.; Tuarob, S. Artificial Intelligence in Cosmetic Dermatology: A Systematic Literature Review. IEEE Access 2023, 11, 71407–71425. [Google Scholar] [CrossRef]
  5. Haykal, D.; Garibyan, L.; Flament, F.; Cartier, H. Hybrid cosmetic dermatology: AI generated horizon. Skin Res. Technol. 2024, 30, e13721. [Google Scholar] [CrossRef]
  6. Elder, A.; Cappelli, M.O.; Ring, C.; Saedi, N. Artificial intelligence in cosmetic dermatology: An update on current trends. Clin. Dermatol. 2024, 42, 216–220. [Google Scholar] [CrossRef]
  7. Kania, B.; Montecinos, K.; Goldberg, D.J. Artificial intelligence in cosmetic dermatology. J. Cosmet. Dermatol. 2024, 23, 3305–3311. [Google Scholar] [CrossRef]
  8. Vora, L.K.; Gholap, A.D.; Jetha, K.; Thakur, R.R.S.; Solanki, H.K.; Chavda, V.P. Artificial intelligence in pharmaceutical technology and drug delivery design. Pharmaceutics 2023, 15, 1916. [Google Scholar] [CrossRef]
  9. Kalicińska, J.; Wiśniowska, B.; Polak, S.; Spiewak, R. Artificial Intelligence That Predicts Sensitizing Potential of Cosmetic Ingredients with Accuracy Comparable to Animal and In Vitro Tests—How Does the Infotechnomics Compare to Other “Omics” in the Cosmetics Safety Assessment? Int. J. Mol. Sci. 2023, 24, 6801. [Google Scholar] [CrossRef]
  10. Obwegeser, D.; Timofte, R.; Mayer, C.; Eliades, T.; Bornstein, M.M.; Schätzle, M.A.; Patcas, R. Using artificial intelligence to determine the influence of dental aesthetics on facial attractiveness in comparison to other facial modifications. Eur. J. Orthod. 2022, 44, 445–451. [Google Scholar] [CrossRef]
  11. Patcas, R.; Bernini, D.A.; Volokitin, A.; Agustsson, E.; Rothe, R.; Timofte, R. Applying artificial intelligence to assess the impact of orthognathic treatment on facial attractiveness and estimated age. Int. J. Oral Maxillofac. Surg. 2019, 48, 77–83. [Google Scholar] [CrossRef] [PubMed]
  12. Tian, B. Tele-aesthetics in South Asia. J. Cosmet. Dermatol. 2017, 16, 21–25. [Google Scholar] [CrossRef] [PubMed]
  13. Flament, F.; Jiang, R.; Houghton, J.; Zhang, Y.; Kroely, C.; Jablonski, N.G.; Jean, A.; Clarke, J.; Steeg, J.; Sehgal, C.; et al. Accuracy and clinical relevance of an automated, algorithm-based analysis of facial signs from selfie images of women in the United States of various ages, ancestries and phototypes: A cross-sectional observational study. J. Eur. Acad. Dermatol. Venereol. 2023, 37, 176–183. [Google Scholar] [CrossRef] [PubMed]
  14. Fliorent, R.; Fardman, B.; Podwojniak, A.; Javaid, K.; Tan, I.J.; Ghani, H.; Truong, T.M.; Rao, B.; Heath, C. Artificial intelligence in dermatology: Advancements and challenges in skin of color. Int. J. Dermatol. 2024, 63, 455–461. [Google Scholar] [CrossRef]
  15. Junayed, M.S.; Jeny, A.A.; Atik, S.T.; Neehal, N.; Karim, A.; Azam, S.; Shanmugam, B. AcneNet—A deep CNN based classification approach for acne classes. In Proceedings of the 2019 12th International Conference on Information & Communication Technology and System (ICTS), Surabaya, Indonesia, 18 July 2019; pp. 203–208. [Google Scholar]
  16. Yadav, R.; Jain, A.; Sharma, S. Acne Detection Care System using Deep Learning. In Proceedings of the 2024 11th International Conference on Reliability, Infocom Technologies and Optimization (Trends and Future Directions) (ICRITO), Noida, India, 14–15 March 2024; pp. 1–5. [Google Scholar]
  17. Navarro-Barrientos, J.E.; Rivera, D.E.; Collins, L.M. A dynamical model for describing behavioural interventions for weight loss and body composition change. Math. Comput. Model. Dyn. Syst. 2011, 17, 183–203. [Google Scholar] [CrossRef]
  18. Figueiredo, D.M.; Duarte, R.P.; Cunha, C.A. Predictive Model for Estimating Body Weight Based on Artificial Intelligence: An Integrated Approach to Pre-processing and Evaluation. In Proceedings of the International Conference on Disruptive Technologies, Tech Ethics and Artificial Intelligence; Springer: Cham, Switzerland, 2024; pp. 28–39. [Google Scholar]
  19. Juhász, M.; Korta, D.; Mesinkovska, N.A. A review of the use of ultrasound for skin tightening, body contouring, and cellulite reduction in dermatology. Dermatol. Surg. 2018, 44, 949–963. [Google Scholar] [CrossRef]
  20. Taher, A.A.M.; Al-Sultani, A.H. Electrical muscle stimulation and its advantages. J. Humanit. Soc. Sci. Res. 2023, 2. [Google Scholar]
  21. Paul, A.; Usman, J.; Ahmad, M.Y.; Hamidreza, M.; Maryam, H.; Ong, Z.C.; Hasikin, K.; Lai, K.W. Health efficacy of electrically operated automated massage on muscle properties, peripheral circulation, and physio-psychological variables: A narrative review. EURASIP J. Adv. Signal Process. 2021, 2021, 80. [Google Scholar] [CrossRef]
  22. Duren, D.L.; Sherwood, R.J.; Czerwinski, S.A.; Lee, M.; Choh, A.C.; Siervogel, R.M.; Chumlea, W.C. Body composition methods: Comparisons and interpretation. J. Diabetes Sci. Technol. 2008, 2, 1139–1146. [Google Scholar] [CrossRef]
  23. Aldobali, M.; Pal, K. Bioelectrical Impedance Analysis for Evaluation of Body Composition: A Review. In Proceedings of the 2021 International Congress of Advanced Technology and Engineering (ICOTEN), Taiz, Yemen, 4–5 July 2021; pp. 1–10. [Google Scholar]
  24. Kyle, U.G.; Bosaeus, I.; De Lorenzo, A.D.; Deurenberg, P.; Elia, M.; Gómez, J.M.; Heitmann, B.L.; Kent-Smith, L.; Melchior, J.C.; Pirlich, M.; et al. Bioelectrical impedance analysis—Part I: Review of principles and methods. Clin. Nutr. 2004, 23, 1226–1243. [Google Scholar] [CrossRef]
  25. Schoeller, D.A. Bioelectrical impedance analysis what does it measure? Ann. New York Acad. Sci. 2000, 904, 159–162. [Google Scholar] [CrossRef] [PubMed]
  26. Kułaga, Z.; Świąder-Leśniak, A.; Kotowska, A.; Litwin, M. Population-based references for waist and hip circumferences, waist-to-hip and waist-to-height ratios for children and adolescents, and evaluation of their predictive ability. Eur. J. Pediatr. 2023, 182, 3217–3229. [Google Scholar] [CrossRef] [PubMed]
  27. Zhang, F.L.; Ren, J.X.; Zhang, P.; Jin, H.; Qu, Y.; Yu, Y.; Guo, Z.N.; Yang, Y. Strong association of waist circumference (WC), body mass index (BMI), waist-to-height ratio (WHtR), and waist-to-hip ratio (WHR) with diabetes: A population-based cross-sectional study in Jilin Province, China. J. Diabetes Res. 2021, 2021, 8812431. [Google Scholar] [CrossRef] [PubMed]
  28. Ahmed, M.; Seraj, R.; Islam, S.M.S. The k-means algorithm: A comprehensive survey and performance evaluation. Electronics 2020, 9, 1295. [Google Scholar] [CrossRef]
  29. Jain, A.K. Data clustering: 50 years beyond K-means. Pattern Recognit. Lett. 2010, 31, 651–666. [Google Scholar] [CrossRef]
  30. Sharma, N.; Bajpai, A.; Litoriya, M.R. Comparison the various clustering algorithms of weka tools. Facilities 2012, 4, 78–80. [Google Scholar]
  31. Shahapure, K.R.; Nicholas, C. Cluster quality analysis using silhouette score. In Proceedings of the 2020 IEEE 7th international conference on data science and advanced analytics (DSAA), Sydney, NSW, Australia, 6–9 October 2020; pp. 747–748. [Google Scholar]
  32. Lind, L.; Ahmad, S.; Elmståhl, S.; Fall, T. The metabolic profile of waist to hip ratio—A multi-cohort study. PLoS ONE 2023, 18, e0282433. [Google Scholar] [CrossRef]
Figure 1. Pipeline of the proposed work.
Cosmetics 12 00094 g001
Figure 2. Sessions specification: each block represents a specific technology used and the part of the body under treatment.
Cosmetics 12 00094 g002
Figure 3. Setup for the photo acquisition: the arrangement for capturing the photos, including how and where the client should be positioned and the materials required for taking the photos.
Cosmetics 12 00094 g003
Figure 4. Before and after the treatments of an obese subject: (a,c) are the pictures taken before the beginning of the protocol, while (b,d) are 4 days after the 16th session.
Cosmetics 12 00094 g004
Figure 5. BMI vs. W/H diagram: the green part is the normal weight section while the yellow and red ones are the overweight and obese sections, respectively. On the x-axis are the BMI values, while on the y-axis are the W/H ratios.
Cosmetics 12 00094 g005
Figure 6. Cluster paths in the diagram: the red, blue and black are the paths individuated using the clustering algorithm. In black is Path 3, while in red and blue are Paths 2 and 1, respectively.
Cosmetics 12 00094 g006
Figure 7. How the vector angle works and the treatment suggestion associated to each position.
Cosmetics 12 00094 g007
Figure 8. Developed algorithm to suggest changes in the treatments.
Cosmetics 12 00094 g008
Table 1. Average percentage increase/decrease between the first and last session.
VariableNormal WeightOverweightObese
FM+1.41+1.39−5.71
FFM+0.17−0.55+4.74
MM−1.94+2.43+5.35
BCM−0.47+0.50+5.74
TBW+0.24+4.20+3.90
ICW−2.69+4.35+3.96
ECW−1.85−0.18+5.79
BMI+1.35+0.11−1.6
MB−0.07−1.00+1.06
HIP−2.11+0.46+5.79
WAIST−4.10−2.32−8.24
Table 2. ANOVA test among the three groups at the first and last check-ups.
Variablep-Value
Check-Up 1Check-Up 5
FM 7.78 × 10 12 8.86 × 10 13
FFM 3.66 × 10 1 6.04 × 10 2
MM 5.48 × 10 1 6.48 × 10 1
BCM 1.07 × 10 2 5.84 × 10 2
TBW 8.68 × 10 1 6.27 × 10 1
ICW 4.91 × 10 1 3.47 × 10 1
ECW 3.83 × 10 1 2.02 × 10 1
BMI 2.98 × 10 10 5.55 × 10 11
Metabolism 4.48 × 10 2 1.62 × 10 5
Waist 3.61 × 10 10 3.94 × 10 4
Hip 7.82 × 10 6 2.21 × 10 7
Height 5.06 × 10 2 4.97 × 10 2
W/H 7.11 × 10 8 7.33 × 10 6
Age 4.62 × 10 1 7.1 × 10 1
Disclaimer/Publisher’s Note: The statements, opinions and data contained in all publications are solely those of the individual author(s) and contributor(s) and not of MDPI and/or the editor(s). MDPI and/or the editor(s) disclaim responsibility for any injury to people or property resulting from any ideas, methods, instructions or products referred to in the content.

