Article

Exploring Skin Biometrics, Sensory Profiles, and Rheology of Two Photoprotective Formulations with Natural Extracts: A Commercial Product Versus a Vegan Test Formulation

by
Karine Campos Nunes
1,
Bruna Lendzion Alves
1,
Rafaela Said dos Santos
1,
Lennon Alonso de Araújo
2,
Rosângela Bergamasco
2,
Marcos Luciano Bruschi
1,
Tânia Ueda-Nakamura
1,
Sueli de Oliveira Silva Lautenschlager
1 and
Celso Vataru Nakamura
1,*
1
Post-Graduate Program in Pharmaceutical Sciences, State University of Maringa, Maringa 87020-900, PR, Brazil
2
Department of Chemical Engineering, State University of Maringa, Maringa 87020-900, PR, Brazil
*
Author to whom correspondence should be addressed.
Cosmetics 2025, 12(3), 112; https://doi.org/10.3390/cosmetics12030112
Submission received: 28 March 2025 / Revised: 14 May 2025 / Accepted: 16 May 2025 / Published: 27 May 2025
(This article belongs to the Special Issue Feature Papers in Cosmetics in 2025)

Abstract

:
Cumulative exposure to UV radiation can lead to harmful effects such as skin burns, photoaging, and skin cancer, thus highlighting the importance of using photoprotective formulations. Many sunscreens are vegan and have antioxidant substances to ensure additional photochemoprotective action. We evaluated biophysical, rheological, and sensorial parameters of Face Care Facial Moisturizing Cream® (P1) and a vegan formulation (P2) by in vitro and in vivo tests. Sun Protection Factor (SPF) was evaluated by Mansur method. Biophysical parameters were analyzed: sebum content, hydration level, transepidermal water loss, erythema and melanin level, skin color, and skin pH. The acceptance profile of the formulations was determined using a 9-point hedonic scale and a 5-point purchase intention test. The SPF values of P1 and P2 obtained by in vitro tests were 25.21 and 12.10, respectively. They also exhibited pseudoplastic and thixotropic behavior, which could contribute to better spreadability and form a protective film. Biometric tests showed an increase in hydration and skin sebum, decreased erythema, and maintenance of skin pH after application of both formulations. The comparison of a commercialized product and a vegan test version showed similar rheological and great acceptance profiles. Therefore, the vegan formulation is a good alternative to reach a different market.

1. Introduction

The skin is an important protection organ of the human body. It has a complex structure that is constantly renewed, acting as a barrier against various harmful agents [1]. The skin has different layers: the outermost layer is the epidermis and just below this is the dermis. There is also a layer composed mainly of adipose tissue called the hypodermis [2].
Solar radiation can cause several types of damage to the organism depending on the duration and type of exposure [3]. Individuals’ negligence regarding skin protection, coupled with excessive sun exposure, can contribute to the development of various skin pathologies. Inflammation, apoptosis, and necrosis can occur following acute UV radiation exposure, which can lead to tissue damage. DNA damage can also occur, which leads to a higher probability of developing skin cancer [4,5].
The damage to cellular structures is mediated by oxidative stress that occurs with an exacerbated increase in reactive oxygen species (ROS), that is, very unstable and reactive molecules [4,6]. When this imbalance between oxidizing and antioxidant compounds occurs, there is oxidation of biomolecules and loss of their functions [7]. To combat these damages, the skin has an enzymatic antioxidant system, which includes enzymes such as superoxide dismutase, glutathione peroxidase, and catalase. Antioxidants are important to counteract effects caused by ROS [8,9,10,11].
Therefore, some studies have sought to incorporate antioxidants in cosmetic formulations, constituting a viable and effective alternative for greater photoprotection [12,13,14,15]. Sunscreens are formulations designed to specifically attenuate the effect of UV radiation on the skin by means of physical or chemical action resulting in radiation absorption, dispersion, or reflection mechanisms. The quality control of a photoprotective formulation is essential, and this depends not only on its sun protection factor (SPF), but also on its physical-chemical properties, stability, solubility and toxicity [12,16]. Although organic filters protect against UV exposure, some, like benzophenone-3, have been associated with adverse effects, toxicity, and ecological risks. This underscores the need to consider less harmful alternatives in sunscreen formulations. Consequently, there is a growing focus on natural compounds and plant extracts for their potential to provide photoprotection in cosmetics [17].
Rheology can aid in quality control and enhance understanding of sunscreen properties by assessing the texture, consistency, and spreadability of the product, ensuring optimal performance and user experience. There are different methods available for the evaluation of the stability of cosmetic products [18]. Furthermore, non-invasive in vivo methods have enabled a greater understanding of skin physiology [18,19] and these cutaneous biometrics can be used to assess the physicochemical properties of the skin and the behavior of a formulation within it. Such parameters that can be evaluated include skin hydration, pH, transepidermal water loss (TEWL), melanin and erythema levels, and temperature [20].
The quality profile of a product also covers the sensory aspect and the degree of acceptance of the product by the target audience [21,22]. Many consumers are looking for products that meet the ethical requirements of their lifestyle. There is concern on the part of such individuals regarding the impacts that products generate on the environment, in themes such as cruelty-free, sustainability, and vegan formulations [23,24]. Vegan formulations are pharmaceutical preparations whose composition and raw materials are free from animal-derived substances and have not been tested on animals [25].
The present work evaluated the biophysical properties of two multifunctional formulations: Face Care Facial Moisturizing Cream® and the second formulation is a vegan test formulation. Additionally, a comparison was conducted between the two products regarding in vitro SPF, rheological profiles, and sensory analysis, encompassing male and female human volunteers.

2. Materials and Methods

2.1. Ingredients and Specifications of Formulations

The two formulations evaluated in this work were the commercialized Face Care Facial Moisturizing Cream (P1) with SPF 30 from the company PURIFIC PREMIUM® (Maringa-PR, Brazil) and a vegan formulation (P2) provided by the company Naturelle® (Cotia-SP, Brazil). P1 and P2 are classified as multifunctional products and their compositions (INCI—International Nomenclature Cosmetic Ingredient) are provided below:
For P1: Aqua (water); Tribehenin PEG-20 esters; Theobroma grandiflorum seed butter; Tocopheryl acetate; C12-15 Alkyl benzoate; Diethylamino hidroxybenzoyl hexyl benzoate; Ethylhexyl triazone; Hypnea musciformis extract; Bis-ethylhexyloxyphenol methoxyphenyl triazine; Ethylhexyl methoxycinnamate; Titanium dioxide; Hydrated silica; Hydrogen dimethicone; Aluminum hydroxide; Dimethicone; Panthenol; Glycerin; Disodium EDTA; Acrylates/C10-30 alkyl acrylate crosspolymer; Triethanolamine; Biosaccharide gum 4; Methylisothiazolinone; Phenoxyethanol; Cyclomethicone; Parfum (Fragrance); Xanthan gum; Cyclopentasiloxane; Dimethicone crosspolymer; Butylphenyl methylpropional; Alpha-isomethyl ionone; Coumarin; Hexyl cinnamal; Linalool.
For P2: Aqua (water); Caprylic/capric triglyceride; Titanium dioxide; Hydrated silica; Hydrogen dimethicone; Aluminum hydroxide; Zinc oxide; Triethoxycaprylylsilane; Cetearyl olivate/sorbitan olivate; Propanediol; Coco-caprylate/caprate; Polyglyceryl-10 pentastearate; Behenyl alcohol; Sodium stearoyl lactylate; Squalene; Hypnea musciformis extract; Gellidiela acerosa extract; Cucumis sativus seed extract; Ammonium acryloyldimethyltaurate/vp copolymer; Phenoxyethanol; Ethylhexylglycerin; Tocopheryl acetate; Sodium stearoyl glutamate; Disodium EDTA; Parfum (fragrance).

2.2. Evaluation of Formulation pH

To determine the pH of the formulations, they were diluted to 10% (w/w) in water, and three determinations were made for each sample using a pH meter (Digimed®), previously calibrated with pH 4.00 and pH 6.86 buffers.

2.3. SPF Determination

The SPF was calculated using the Mansur equation, which assesses sunscreen effectiveness by measuring the sample’s absorbance under spectrophotometer light. The absorbance at various wavelengths is used to determine the in vitro SPF value [26].
Firstly, the samples were diluted to 100 µg/mL in triplicate, and the absorbance of P1 and P2 was read between 290 and 320 nm at 5 nm intervals (Shimadzu, UV-1700). The SPF was calculated using the following equation:
SPF   ( spectrophotometric ) = C F × 290 n m 320 n m E E λ × I λ × A b s λ × 2
where
CF = correction factor (equal to 10); EE (λ) = erythematogenic effect of radiation with wavelength λ; Ι (λ) = intensity of sunlight at wavelength λ; Abs (λ) = spectrophotometric reading of the absorbance of the sample solution at wavelength (λ); 2 = Dilution factor
The EE (λ) × I (λ) values are given in the Supplementary Material (Table S1).

2.4. Rheological Analysis

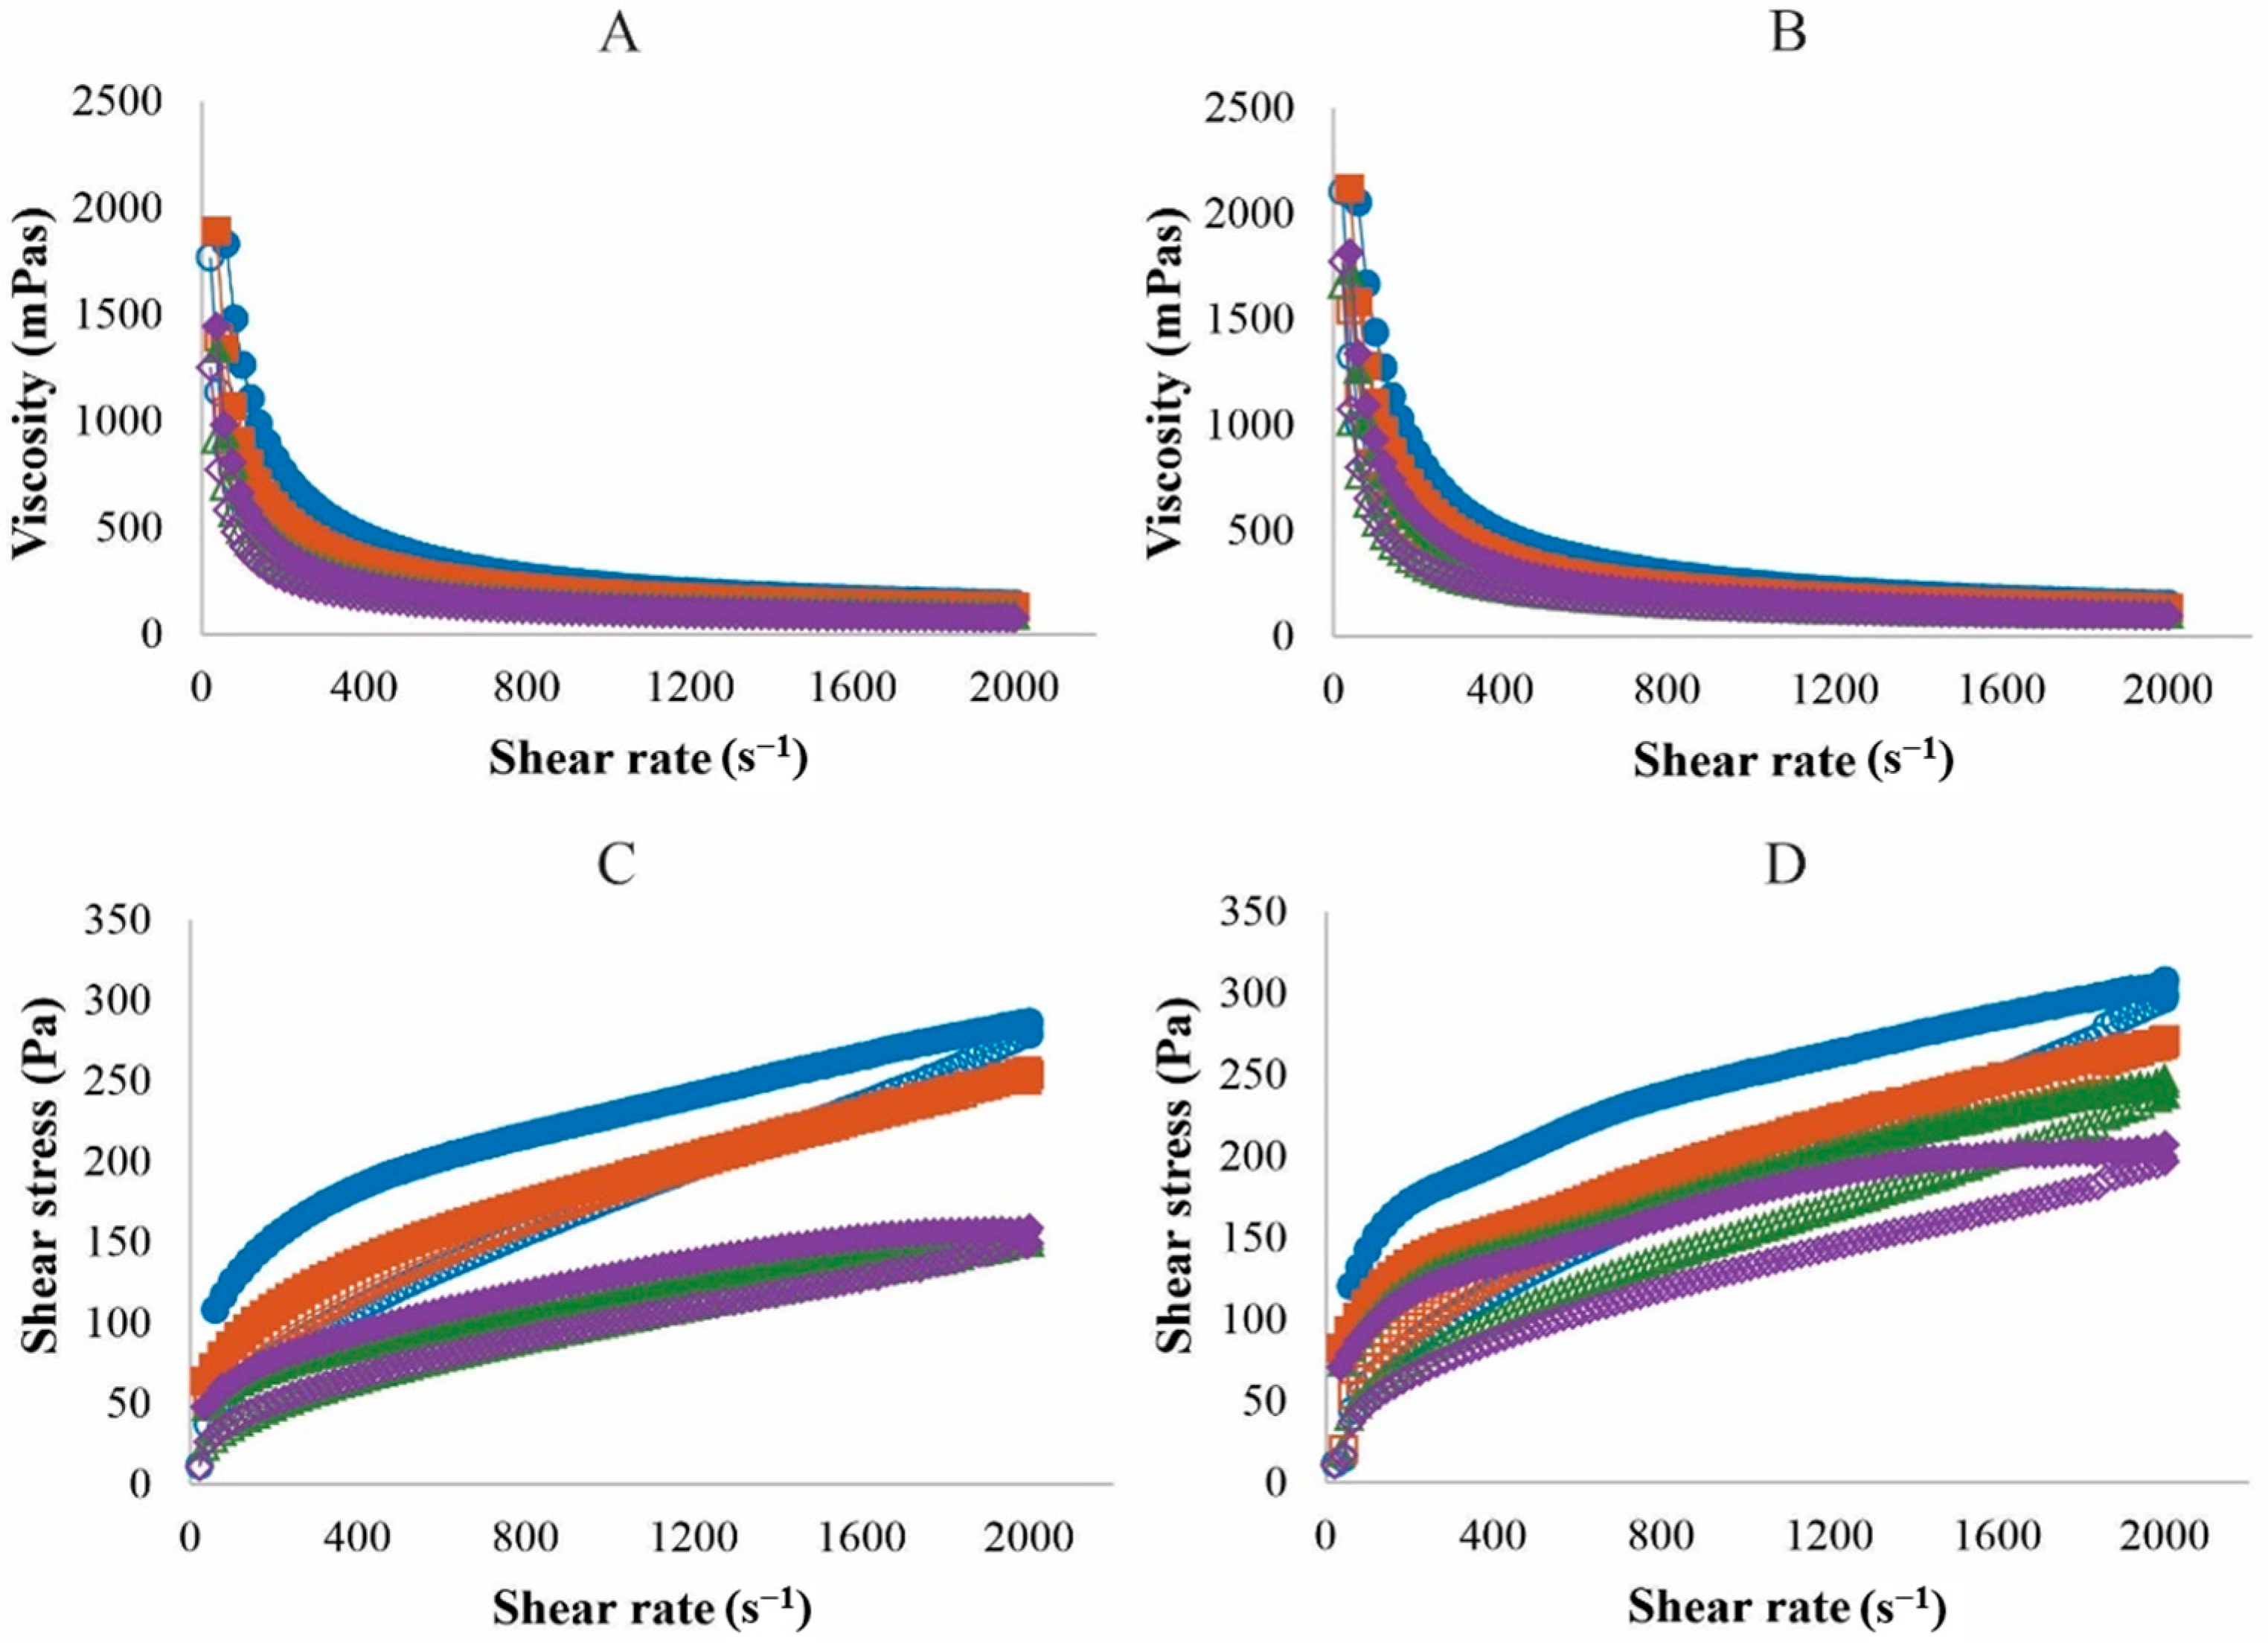
2.4.1. Continuous Flow Shear Rheometry

Rheograms were generated by means of a gradient rheometer and controlled shear stress MARS II® (Haake®), in continuous flow mode, at temperatures of 4, 25, 34, and 40 ± 0.1 °C, with parallel cone–plate geometry of 35 mm in diameter, separated by a fixed distance of 0.052 mm. It was found that the formulations did not break at up to 2000 s−1 of shear gradient. Therefore, the measurements of the flow curves were taken with a variation in the shear rates from 0 to 2000 s−1 in order to verify the behavior of the formulations submitted to such rates.
The upward and downward flow curves were calculated based on the Oswald de Waele equation (Power Law–Power Law), obtaining the k and n indices [27]:
τ = k × γn
where τ is the shear stress (Pa), k is the consistency index [(Pa·s)n], γ is the shear rate (s−1), and n is the flow behavior index (dimensionless).
In addition, the yield of each formulation was obtained using the Herschel–Buckley equation/model [28]:
τ = τ0 + k × γn
where τ is the shear stress (Pa), τ0 is the yield stress (Pa), k is the consistency index [(Pas)n], γ is the rate of shear (s−1), and n is the flow behavior index (dimensionless).
The hysteresis area was also obtained using the RheoWin 4.10.0000 program (Haake®) and the thixotropy coefficient (Kt) was calculated using the equation.

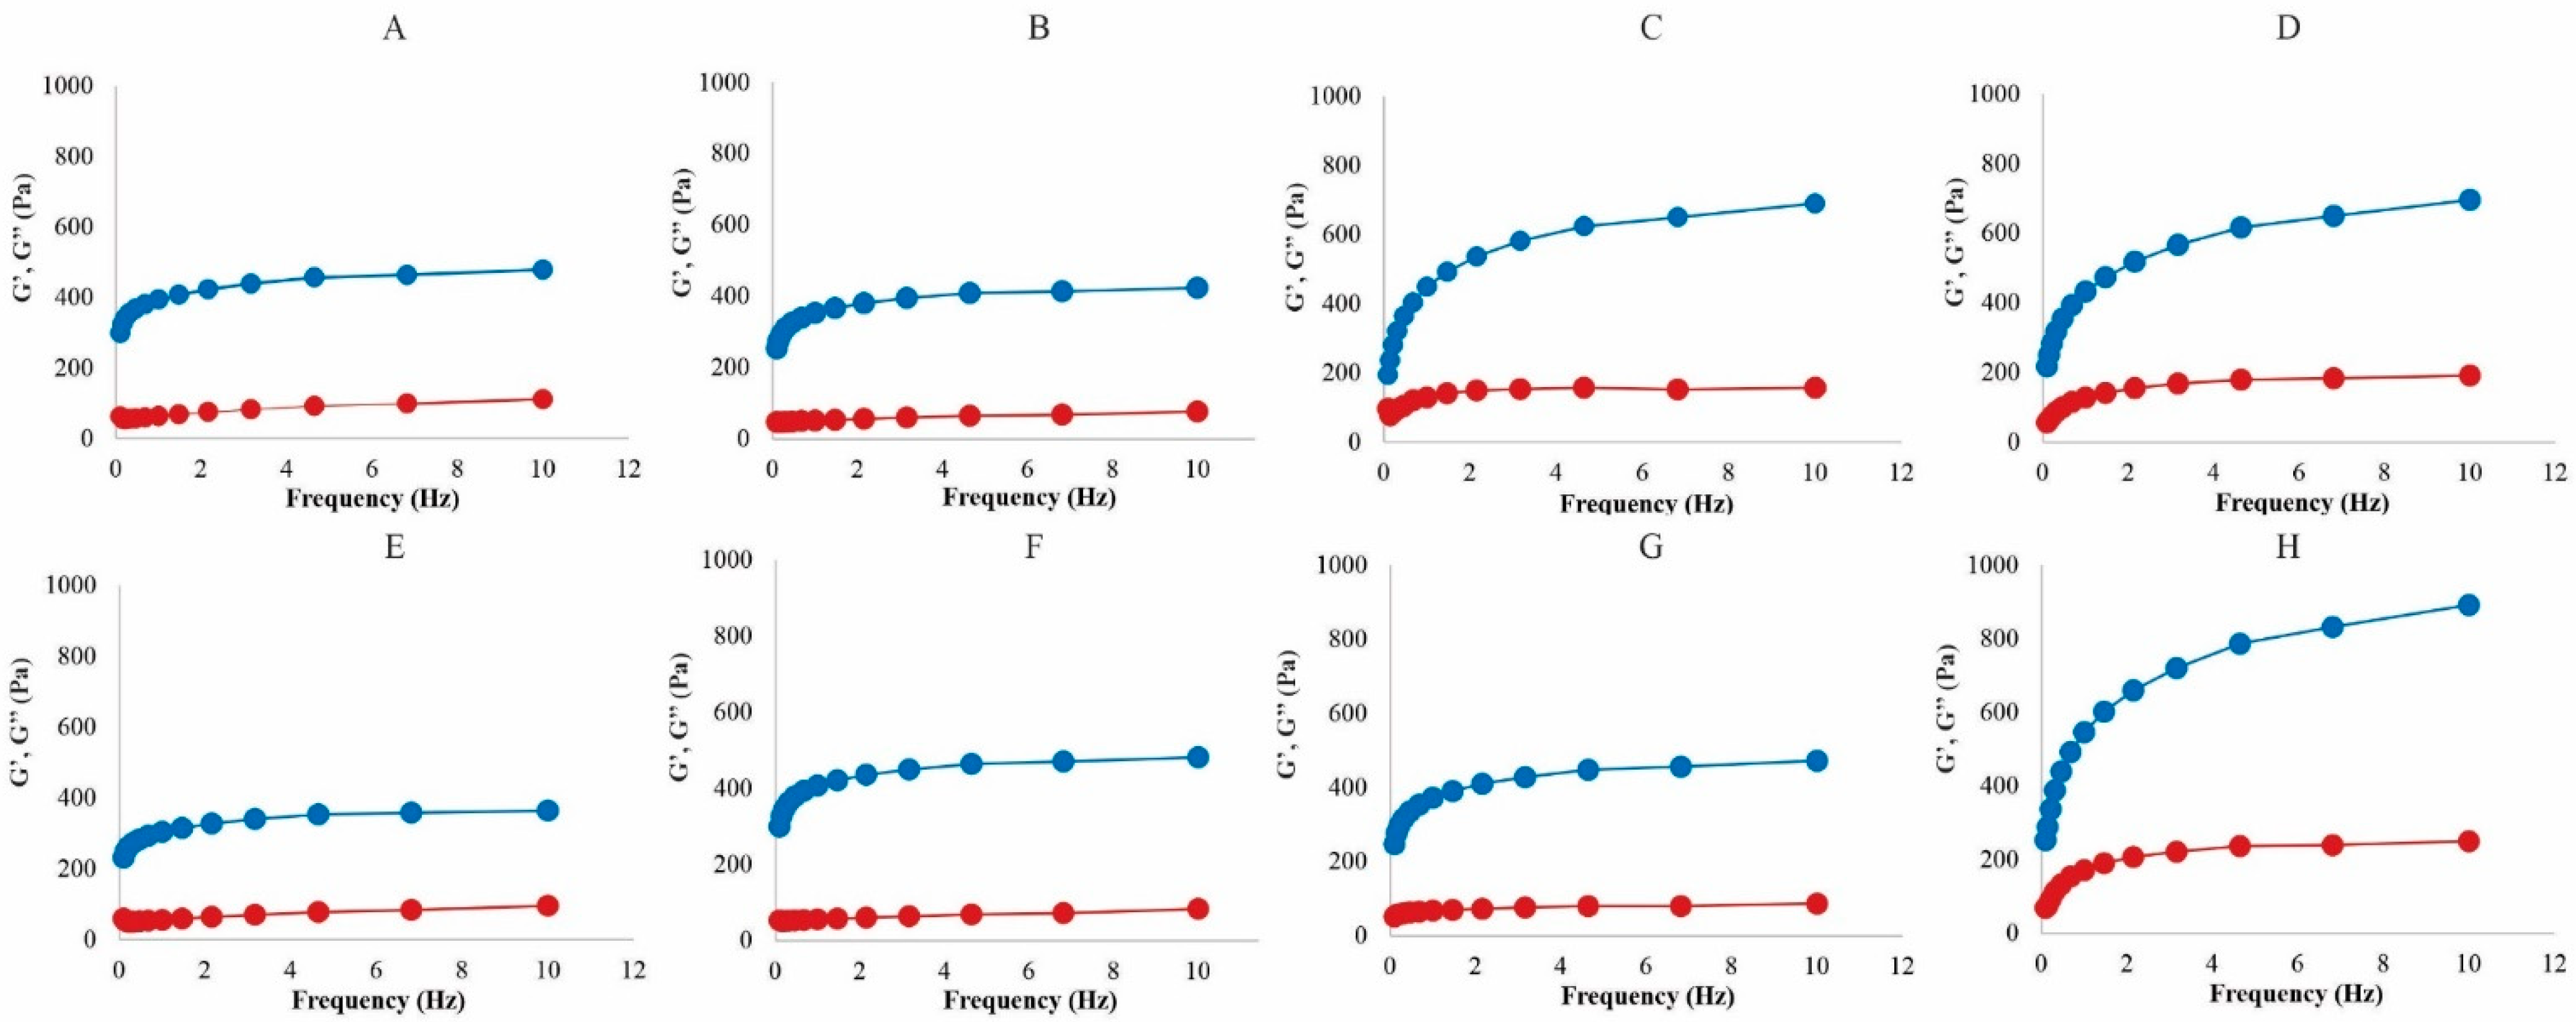
2.4.2. Oscillatory Rheometry

The samples were gently applied to the bottom plate, allowing a resting time of 1 min before each determination and ensuring the minimum shear of the formulation [29]. After determining the linear viscoelastic region, the frequency scan analysis from 0.1 to 10.0 Hz was performed. Viscosity (n′), tangent (tan), storage module (G′), and loss module (G″) were calculated using the RheoWin 4.10.0000 (Haake) software [27,29]. Three repetitions were made for each sample.

2.5. Evaluation of Formulation by Cutaneous Biometrics

2.5.1. Experimental Conditions and Climate Description

The experimental part of the study regarding the cutaneous biometrics was conducted from December to February in southern Brazil (Geographical Coordinates: 23°24′17.2″ S 51°56′07.2″ W). In January, temperatures typically reach a high of around 28.8 °C (83.8°F), with only a slight decrease from December’s average of 29.5 °C (85.1°F). January nights average about 20 °C (68°F). The mean heat index for January is approximately 35 °C (95°F), indicating a high level of heat.
From January to March, Maringá, Brazil experiences its highest UV levels, with an average maximum UV index of 6. A UV index of 6 to 7 signifies a high risk of harm from UV exposure for the general population [30].

2.5.2. Selection of Test Subjects

Inclusion Criteria

A total of 14 healthy female and 14 healthy male volunteers between 18 and 60 years of age were recruited to the study. The individuals had skin phototypes I, II, and III based on the Fitzpatrick classification scale, which are the skin types more sensitive to UV radiation and thus greater sun protection is recommended [31]. Recruited individuals were also instructed to read the Free and Informed Commitment Term and sign it if they agreed to participate in the research. This study was approved by the Ethics Committee of the State University of Maringa, with the number of the report: 2.990.495.

Exclusion Criteria

Exclusion criteria were volunteers who were undergoing dermatological treatment, had an allergy to cosmetics, had endocrine or dermatological diseases, were smokers, and pregnant women [32]. Skin tones that were not type I, II, and III, or had the presence of sunburn, sun tanning, scarring, or active dermal lesions were also considered exclusion criteria.

2.5.3. Sample Application

The volunteers were received in a room with controlled temperature and humidity, and were instructed to wash their face with neutral soap before the measurements were taken. They then stayed in the test room for 20 min in order to adapt to the environmental conditions. Using a glove, the volunteers spread 180 mg of P1 on their right cheek area, until complete absorption. The same was performed with P2, with application on the left side. The first measurements were made at time 0, with skin pH measurement, transepidermal water loss, skin sebum content, melanin content, erythema level, skin color, and hydration. Subsequently, new readings of the biometric parameters were made one and two hours after the application of the formulations. The negative control (NC) was a region of the skin to which formulation was not applied.

2.5.4. Assessment of Cutaneous Sebum Content

The determination of the skin sebum content was performed using the Sebumeter® SM 815 cassette (Courage-Khazaka, Koln, Germany). The Sebumeter® SM 815 adhesive tape was placed in contact with the skin and the surface of the main measurement area becomes transparent in the presence of grease/oiliness. Then, the tape was inserted into the opening of the device and the transparency was measured by a photocell. Light transmission represents the sebum content [33].

2.5.5. Assessment of Skin Hydration Level

The hydration level of the skin was measured using the Corneometer® probe (Courage-Khazaka, Koln, Germany), with the measurement of the capacitance of a dielectric medium. Changes in the dielectric constant due to the variation in the hydration of the skin surface can be measured in the precision measurement capacitor [34]. The device can determine the water content of the superficial epidermal layers to a depth of 0.1 mm, and the values are expressed in arbitrary units (AU), where 1 AU corresponds to 0.2 to 0.9 mg of water per gram of stratum corneum [35].

2.5.6. Assessment of Transepidermal Water Loss (TEWL)

Using the Tewameter® probe (Courage-Khazaka, Koln, Germany), the percentage of water that evaporated on the skin surface was measured, since there is an increase in TEWL when the skin barrier is damaged [36]. When the capacity of the stratum corneum to retain water decreases, such as in the case of skin damage, there is an increase in the flow of water vapor and a consequent increase in the value of TEWL [20].

2.5.7. Assessment of Erythema Level and Melanin Content

The evaluation of the melanin content and the erythema level of the skin are based on absorption/reflection and were performed using the Mexameter® MX 18 probe (Courage-Khazaka, Koln, Germany). That probe emits 3 specific wavelengths of light, and a receiver measures the light reflected by the skin. As the amount of light emitted is defined, the amount of light absorbed by the skin can be calculated. The melanin content was measured by specific wavelengths chosen to correspond to different rates of absorption by the pigments. Regarding the level of erythema, specific wavelengths were also used, corresponding to the peak spectral absorption of hemoglobin and to avoid other color influences (e.g., bilirubin) [33].

2.5.8. Assessment of Skin Color

The skin color was assessed using the Skin-Colorimeter® CL 400 probe (Courage-Khazaka, Koln, Germany). The probe contains white LED light, arranged circularly to illuminate the skin in an even manner. The emitted light is spread in all directions, some parts go through the layers of the skin and some are reflected. The light reflected from the skin is then measured by the instrument [33].

2.5.9. Evaluation of Cutaneous pH

The pH measurement on the skin was made by the Skin-pH-meter® probe (Courage-Khazaka, Koln, Germany), which is based on a high-quality combined electrode. The glass H+ ion sensitive electrode and the additional reference electrode are placed in a single reservoir [33].

2.6. Sensorial Analysis

A 9-point hedonic test was applied to perform the sensory analysis. The test was sample-blind, that is, the volunteers did not know which formulation was applied to their face. They also answered a test of intention to purchase the product, described by Prudencio et al. [37] and it is included in the Supplementary Material (Annex S1).

2.7. Statistical Analysis

All data were analyzed using the ANOVA test, considering p < 0.05 to be significant, followed by the Tukey test. Statistical analyses were performed using the GraphPad Prism 5 software.

3. Results and Discussion

3.1. SPF of the Formulations

SPF is an interesting tool for evaluating the effectiveness of multifunctional products. In vitro techniques for evaluating SPF have been developed and standardized, offering lower cost and labor than in vivo ones [17]. The technique described by Mansur [26] was used and the results were favorable for both products (Table 1):
P1 has some chemical filters that can absorb UV radiation, such as diethylamino hydroxybenzoyl hexyl benzoate, an organic filter. P1 also has titanium dioxide, a physical filter. The composition of P2 includes physical filters, such as zinc oxide and titanium dioxide, which act to reflect solar radiation. To complement UV protection, P2 contains antioxidant components. The primary objective of P2 was to formulate a product using naturally derived ingredients, particularly focusing on physical filters.
Although P1 exhibited a higher SPF value than P2 based on the Mansur in vitro method, future clinical studies are essential to confirm and compare their real photoprotective effectiveness [38]. P1 is marketed as SPF 30 (based on in vivo testing), whereas P2 has not yet undergone in vivo evaluation. It is important to note that in vitro SPF values, particularly those obtained via the Mansur method, often underestimate protection compared to in vivo results. As shown by Draghici-Popa et al. (2024), in vitro evaluations may yield significantly lower SPF values than clinical testing, including formulations with natural or physical UV filters [16].
Furthermore, the relationship between in vivo SPF value and UV protection efficacy is not linear. For example, an SPF 30 blocks approximately 96% of UVB radiation, while an SPF 15 blocks around 92%, indicating that the real difference in protection is only 4% [8]. Therefore, despite the difference in SPF values, the photoprotective efficacy of P2 may be comparable to that of P1, underscoring the need for further clinical studies for accurate assessment.

3.2. Rheological Analysis Results

3.2.1. Continuous Flow Shear Rheometry

Rheological studies are tools to characterize cosmetic formulations and analyze their behavior under different conditions, obtaining characteristics such as spreadability on the skin and sensory aspects [17]. Our results showed that both formulations are non-Newtonian fluids with pseudoplastic behavior (n < 1) (Table 2); the viscosity decreased as the shear rate increased, a characteristic that can be observed in Figure 1 (A and B). There was also a decrease in viscosity with increasing temperature, a characteristic that is reported in the literature for sunscreens [39].
The rheograms were better adjusted in the Herschel–Bulkley model, that is, the formulations started to flow after an initial shear stress (τ0) and later, they flowed with the increase in the shear rate. Thixotropy consists of a gradual reduction in viscosity under shear stress followed by a recovery of the structure when the stress is stopped [17,29]. It was observed that the shear gradient increased until reaching its maximum value (2000 s−1) and, subsequently, the process was reversed by decreasing the gradient and generating the two curves [40].
The rheological profiles of both formulations showed the presence of a hysteresis area, mainly at the extremes of temperature (4 °C and 40 °C) (Figure 1). P2 had a significantly larger area of hysteresis at temperatures of 4 and 34 °C than P1 (Table 2). The presence of a hysteresis area is an interesting finding, since it contributes to the release of the fragrance and the composition’s assets [41]. The increase in the hysteresis area in photoprotective formulations may be related to the presence of emollients and emulsifiers which alter the rheological behavior, causing a desirable effect for the formulation [12,42].
Regarding the consistency index values (k), Table 2 shows that there was a significant difference (p < 0.05) comparing the values between P1 and P2 at each temperature. Since k is related to the degree of resistance of the fluid to the flow [17], it can be inferred that P2 is more consistent than P1 due its higher consistency index. The lowest temperature generated a higher k value in both products which can be explained by the fact that the temperature influences the consistency of the formulations [40,43]. However, there was no significant variation in the k value between the values at 25, 34, and 40 °C. This fact demonstrates the possible stability with the gradual increase in temperature.

3.2.2. Oscillatory Rheometry

Many emulsions have viscoelastic properties that can be affected by oscillatory frequency and temperature [44]. With P1 and P2, the increase in oscillatory frequency raised G′ mainly at the highest temperature (Figure 2D,H). The formulations presented a G′ (elastic modulus) greater than G″ (loss modulus), confirming the characteristics of a viscoelastic system [17,45] (Figure 2).
Tangent δ, on the other hand, remained relatively constant with an increase in frequency, but P1 had the tangent values higher for higher temperatures (34 and 40 °C). Both products showed tangent δ values and less than 1, at all temperatures studied, indicating that the viscoelasticity of the formulations was also maintained (Supplementary Material, Figure S1).
Studies with photoprotective formulations demonstrated a viscoelastic profile, that is, they had a predominant elastic behavior [39,46], with hysteresis or thixotropy area. These features are suitable for this kind of formulation since it facilitates the application, indicates the reversible variation in the viscosity with the time, and increases the stability [12]. It is very important to analyze the rheological profiles of the formulations in order to modulate the desired sensory properties and to also analyze the quality and stability of products [17].

3.3. Evaluation of Formulations by Cutaneous Biometrics

3.3.1. Distribution of Skin Tones and Ages Among Male and Female Volunteers

Regarding the age of the volunteers, all male participants were under 31 years old. For female participants, the majority were below 30 years old (Table 3). Regarding skin tone, 64% of the male participants had skin tone type III, while 36% had skin tone type II (Table 3), based on the Fitzpatrick classification scale [31]. Among female participants, 50% had skin tone type II and 50% had skin tone type III (Table 3).
Melanin levels play a key role in determining skin color and can impact the skin’s reaction to environmental influences like UV exposure [47]. Aging leads to a gradual decrease in the number of melanocytes, estimated at approximately 6% to 8% per decade. Additionally, while there is a reduction in melanocyte density with age, an increase in pigmentation can often be observed, particularly in sun-exposed areas. This occurs due to an increase in local melanin production in response to sun exposure or other environmental factors [36].

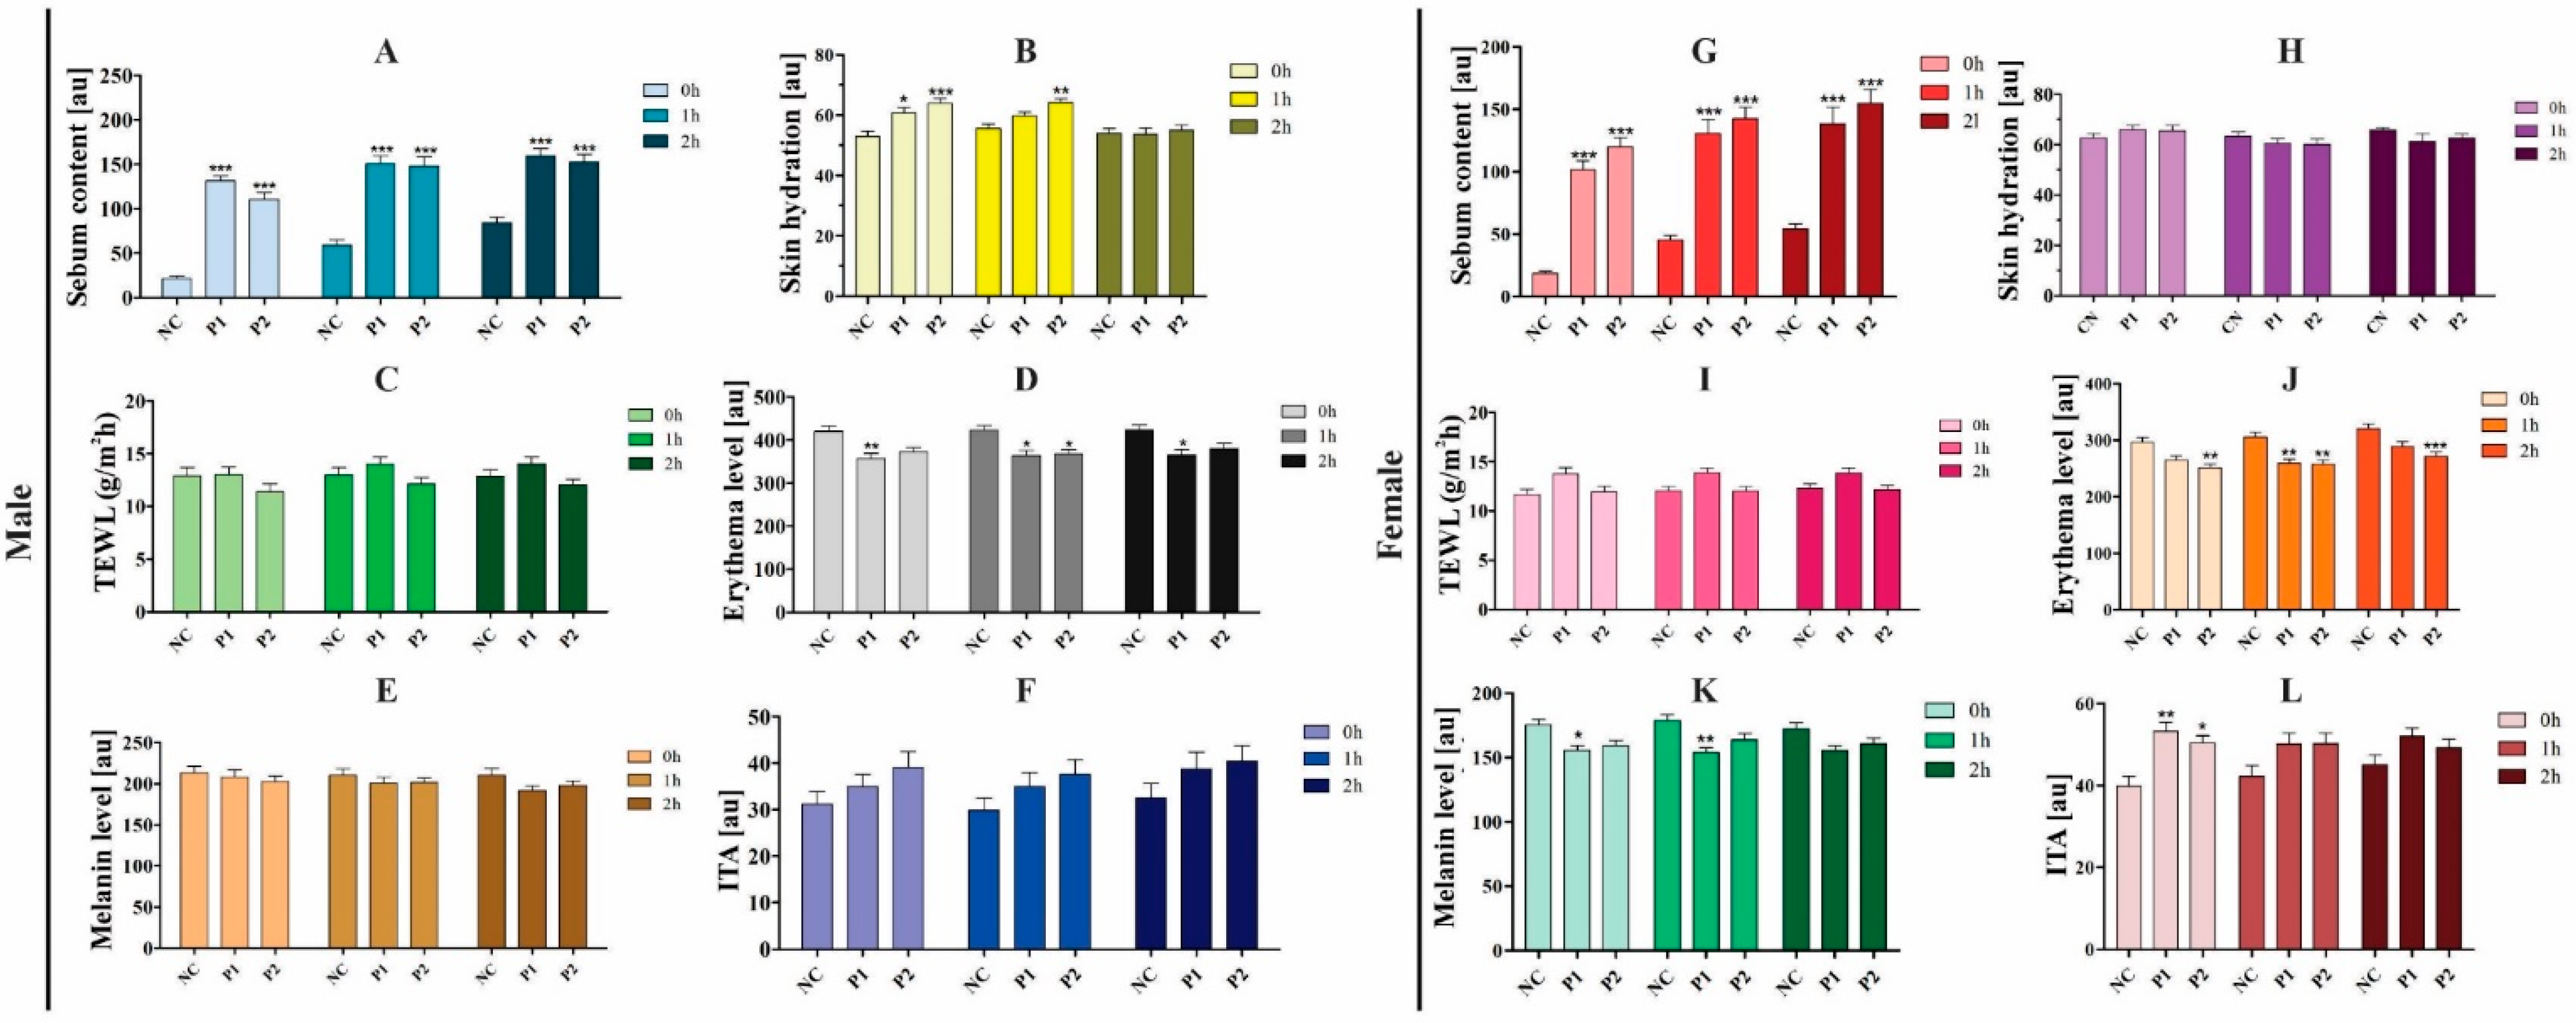
3.3.2. Analysis of Cutaneous Sebum Levels

It is extremely important to study and develop safe, effective photoprotective formulations that meet consumer demand. Therefore, the choice of raw materials and components must be made carefully, as they influence the biophysical parameters as well as the acceptance of the product by the consumer [37,39]. At time 0 min, the skin sebum content of the volunteers was low for both sexes (Figure 3A,G). However, that may be a result of the volunteers first washing their faces with neutral soap 20 min before the administration of the formulations.
Studies have proven that, even when there is a disturbance in the hydrolipidic film, normal skin is able to restore the skin sebum content in approximately two hours [35]. That event can be observed in our study (Figure 3A,G). It also appeared that there could be differences between the sexes, perhaps due to different skin characteristics, since the secretions excreted by the sebaceous glands are under the influence of androgenic hormones [36].
The two formulations showed excellent results in terms of skin sebum content, and there were no significant differences between them at the evaluated times. Comparing the area of skin where the formulations were applied with the negative controls (NC; skin without product application), a significant difference was observed with p < 0.001. From the moment of application, the products were able to raise the sebaceous content to over 100, which restored the skin to its normal characteristic in both sexes. Even after two hours, the sebum content did not exceed 180, revealing that the formulations did not leave the skin oily, but only restored its normal condition. In short, the sebum excreted by the sebaceous glands, along with the moist components excreted with sweat, form a hydrolipidic film, protecting the skin from dryness [48,49]. The sebum content is essential for the health of the skin, since it has an emollient function and maintains the appropriate level of humidity in the stratum corneum [36].

3.3.3. Analysis of Skin Hydration

Regarding hydration, there were not many significant differences in women, who had sufficiently hydrated skin (Figure 3H). At time 0 min, men exhibited lower skin hydration levels compared to women, in which they have a hydration level of 50 (AU), whereas female skin started the tests at 60 (AU). These sex-related differences may also be linked to the use of moisturizers and sunscreens [40], as the majority of male participants in this study reported not using skincare products daily. For males, at time 0 min, the two products caused a significant increase in hydration when compared to the NC, reaching (60 AU). After 1 h, only P2 resulted in significantly higher hydration values compared to NC at p < 0.01 (Figure 3B).
An increase in skin hydration is a desirable factor for skin care formulations. It can occur due to the presence of hydration-promoting components present in both products. In P1, for example, there is the presence of panthenol, dimethicone, glycerin, and triethanolamine alkyl acrylate crosspolymer, emollient components, and moisturizers that contribute to skin softness. P2 has caprylate/caprate, squalene, in addition to others, that act as emollient and moisturizing components.
There are reports in the literature of treatments for many pathologies related to skin such as sunburn, as well as scaly or dry skin, through photoprotective formulations [50]. Although there was a significant increase in skin hydration in males only, all results were higher than 50 (AU), which implies sufficiently hydrated skin. The skin hydration level and the barrier function are essential for a hydrated, healthy- and good-looking skin [51].

3.3.4. Analysis of Transepidermal Water Loss

TEWL, a biophysical parameter, refers to the stratum corneum’s ability to prevent uncontrolled water evaporation from the skin layers [52]. According to the table specified by the manufacturer, values of 10–15 (AU) reveal a healthy skin condition of individuals [33]. That result could be seen in both males (Figure 3C) and females (Figure 3I). In other words, in both sexes, with and without the presence of formulations, values below 15 AU were obtained, showing that the individuals were healthy in relation to this parameter.
A reduction in TEWL is observed following the application of occlusive components, which help prevent water evaporation [52]. In the formulation, it is possible to observe the presence of components such as polyglyceryl-10 pentaestearate, capric/caprylic triglyceride, and berrenyl alcohol, components already reported in multifunctional formulations that can fulfill the emollient and occlusive function. The use of multifunctional formulations for daily use becomes an excellent alternative for protection against solar radiation [17], since exposure to solar radiation through UV rays generates several negative consequences on the skin [4].

3.3.5. Analysis of Erythema and Melanin Assessment

Erythema, the redness caused by the vasodilation of cutaneous capillaries, is just one of the consequences of UV exposure in the skin [53]. The level of skin erythema was analyzed when administering the two test products. These products were not irritating to the skin of the volunteers at the time analyzed. Furthermore, in both sexes, there was a significant decrease in the level of erythema following treatment (Figure 3D,J).
Although erythema was not artificially induced in this study, baseline erythema levels are naturally present on human skin, especially in tropical regions such as Brazil [30], due to environmental factors like high temperatures, frequent sun exposure, and individual variability in skin sensitivity [53,54]. Therefore, evaluating erythema before and after product application, based on non-invasive biometric measurements, can demonstrate reductions in pre-existing erythema, highlighting the formulations’ potential for soothing and anti-inflammatory effects [15,23]. This real-condition assessment provides valuable insight into the efficacy of the formulations in everyday scenarios, aligning with their intended use as photoprotective and calming skincare products [54].
It has been proven that plant extracts containing polyphenols have high antioxidant and anti-inflammatory activity, being able to also reduce erythema [47,55]. P1 has Theobroma grandiflorum in its composition, a species known for its high content of phenolic compounds. In addition, P1 also contains algae extract and coumarin, known for their antioxidant and stimulating action [56,57]. The vegan formulation (P2) has in its constitution extracts of two red algae Hypnea musciformis and Gelidiela acerosa, and cucumber extract (Cucumis sativus), active in the scavenging of free radicals, besides relieving the skin of cutaneous irritations [58].
The skin phototype can be associated with the melanin content. Melanin determines the color of our hair and skin, and provides protection against UV radiation. The Fitzpatrick skin phototype describes different skin tones, photosensitivity, and response to tanning [59]. The volunteers had phototypes I, II, and III, with melanin values as expected, since the melanin level did not exceed 250 (AU) in both sexes (Figure 3E,K).
In the female volunteers, a significant decrease in the level of melanin was observed between zero and one hour with the application of P1 (Figure 3K). Interestingly, according to the questionnaire in this study, most women reported using sunscreen daily. There are reports in the literature that the prolonged use of photoprotective formulations were able to reduce the melanin content in patients with hyperpigmentation [32]. Another study proved that the administration of sunscreens containing antioxidants reduces the pigmentation of the skin and decreases the degradation of collagen in the dermis [40].

3.3.6. Analysis of Skin Color

The study also showed some results about the skin color of the volunteers. The men presented individual typology angles (ITAs) from 30° to 40° (AU), revealing an intermediate skin color. The women obtained ITAs from 40° to 55° (AU), featuring a white skin (Figure 3F,L). Individuals with type I, II, and III may have lighter skin, and that claim was confirmed by analyzing the results of the ITAs of both sexes.

3.4. Formulation pH and Skin pH

It is important to maintain the appropriate skin pH [1], and the analysis and study of the cutaneous pH parameter can assist in the interpretation of skin conditions. Furthermore, it elucidates the action of topical formulations, as well as the effectiveness of active substances [27]. The pH (in vitro) of both studied formulations remained in a neutral range using a pH meter (Digimed®) (Table 4).
The application of the formulations did not generate significant changes in the pH value of the volunteers’ faces (in vivo), which was approximately 5.5, compatible with the pH of the skin.

3.5. Sensorial Analysis Results

A sensory analysis was carried out on a 9-point hedonic scale, representing a scale with nine categories, ranging from “I liked it very much” to “I disliked it very much”. Through this scale, opinions of the volunteers in relation to the products can be verified [60]. For the hedonic test, the acceptance index was given in percentage, and the parameters investigated were appearance, fragrance, texture, and sensation on the skin.
The results of P1 (Figure 4A) showed that most volunteers answered “like very much” for the four parameters analyzed. For this formulation, “dislike extremely” was not selected by any individual for any of the parameters. For the fragrance, a small percentage answered “dislike very much”. There was also a small percentage of people who were indifferent to the parameters, answering “I neither like nor dislike”. The vast majority of the results were between “like extremely” and “like slightly”.
For P2 (Figure 4B), the result of the sensory analysis was similar to P1, in which most responses were positive. The appearance, texture, and sensation parameters on the skin obtained a greater number of “like very much” in P1 than in P2. P2 did not obtain any “dislike very much” and “dislike extremely” for the four parameters, a positive point to be taken into account. As for P1, most volunteers responded that they liked P2.
The purchase intention graph (Figure 4C) revealed that most volunteers would probably buy both formulations (more than 50%). P2 did not obtain any votes for “Certainly would buy” and “Certainly would not buy”. Approximately 17% of volunteers would probably not buy P2, and approximately 4% would certainly not buy P1. Finally, almost 20% of volunteers would certainly buy P1.
Studies have already been reported using this type of sensory test to verify the acceptance of photoprotective formulations, in addition to applying a 7-point purchase intention test, and there was a good acceptance profile [37]. Determining the tactile characteristics of cosmetic products through sensory analysis is of great importance, as it generates additional improvements that could be made to achieve consumer acceptance [39]. In addition, there are few reports in the literature of the sensory analysis of vegan photoprotective multifunctional formulations, making this study relevant to expanding knowledge among different audiences in the cosmetic market.

4. Conclusions

The study evaluated biophysical, rheological and sensorial parameters of Face Care Facial Moisturizing Cream® (P1) and a vegan formulation (P2) by in vitro and in vivo tests. The formulations are photoprotective, presenting a SPF in vitro higher than 10. They increased the cutaneous sebum content, which can form an emulsion with water, playing a role in maintaining the hydration of the skin surface. There was an increase in hydration, maintenance of cutaneous pH, and reduction in erythema. In addition, the formulations had very similar rheological profiles, exhibiting pseudoplastic and thixotropic behavior, important for the dispersion of the present assets and to form a protective film.
The sensory analysis showed a promising result for both products, which obtained great purchase intention scores by the participating volunteers. The vegan formulation presents itself as a viable alternative to access a distinct market. Given the dynamic evolution of consumer preferences and the increasing demand for ethical and sustainable products, future research should further explore the development and performance of diverse formulation types. Investigating their impacts not only on skin health but also on sensorial profiles and market acceptance will be essential for advancing innovation in the cosmetic field.

Supplementary Materials

The following supporting information can be downloaded at: https://www.mdpi.com/article/10.3390/cosmetics12030112/s1, Table S1. Correlation between the erythematogenic effect and the intensity of the radiation (EE (λ) x I (λ)) at each wavelength (1). Figure S1. Viscosity (η′) (A) and tangent (tan δ) (B) as a function of frequency for P1, viscosity (η′) (C) and tangent (tan δ) (D) for P2. The temperatures were 4 °C, 25 °C, 34 °C, and 40 °C. Each rheogram is the average of at least three replicates. All points in each rheogram show a variation coefficient of less than 10%. Annex S1: Hedonic test of sensory attributes and purchase intention.

Author Contributions

K.C.N. and C.V.N. conceptualized the project. K.C.N. and B.L.A. conducted the experimental work. M.L.B. and R.S.d.S. contributed to the result interpretation. Data curation and graphics were made by K.C.N. and L.A.d.A. The initial draft was written by K.C.N. Funding acquisition, managed by R.B., S.d.O.S.L., T.U.-N. and C.V.N. Project administration and review were conducted by C.V.N. All authors have read and agreed to the published version of the manuscript.

Funding

This research was funded by Coordenação de Aperfeiçoamento de Pessoal de Nível Superior–Brasil (CAPES), grant number 001.

Institutional Review Board Statement

This study was approved by the Ethics Committee of the State University of Maringa, under report number 2.990.495.

Informed Consent Statement

Written informed consent has been obtained from the volunteers for the publication of this paper.

Data Availability Statement

The data presented in this study are available on request from the corresponding author due to the proprietary nature of the formulations, which are owned by private companies and are subject to confidentiality agreements.

Conflicts of Interest

The authors declare that the research was conducted in the absence of any commercial or financial relationships that could be construed as a potential conflict of interest. The funders had no role in the design of the study; in the collection, analyses, or interpretation of data; in the writing of the manuscript; or in the decision to publish the results.

References

  1. Michalak, M.; Pierzak, M.; Kręcisz, B.; Suliga, E. Bioactive compounds for skin health: A review. Nutrients 2021, 13, 1–31. [Google Scholar] [CrossRef] [PubMed]
  2. Tortora, G.J.; Derrickson, B.; Tortora, G.J. Principles of Anatomy and Physiology, 12th ed.; Wiley: Hoboken, NJ, USA, 2009; 1288p. [Google Scholar]
  3. Ansary, T.M.; Hossain, M.R.; Kamiya, K.; Komine, M.; Ohtsuki, M. Inflammatory molecules associated with ultraviolet radiation-mediated skin aging. Int. J. Mol. Sci. 2021, 22, 3974. [Google Scholar] [CrossRef] [PubMed]
  4. Afaq, F. Natural agents: Cellular and molecular mechanisms of photoprotection. Arch. Biochem. Biophys. 2011, 508, 144–151. [Google Scholar] [CrossRef] [PubMed]
  5. Sgarbi, F.C.; Carmo EDDo Rosa, L.E.B. Radiação ultravioleta e carcinogênese. Rev. Ciencias Médicas 2007, 16, 245–250. [Google Scholar]
  6. Scandalios, J.G. Oxidative stress: Molecular perception and transduction of signals triggering antioxidant gene defenses. Braz. J. Med. Biol. Res. 2005, 38, 995–1014. [Google Scholar] [CrossRef]
  7. Nunes, K.C.; Lazarin-Bidoia, D.; Ueda-Nakamura, T.; Lautenschlager, S.O.S.; Michel, R.; Auzély-Velty, R.; Nakamura, C.V. Syringic acid protective role: Combatting oxidative stress induced by UVB radiation in L-929 fibroblasts. J. Photochem. Photobiol. B Biol. 2025, 264, 113104. [Google Scholar] [CrossRef]
  8. Ngoc, L.T.N.; Tran, V.V.; Moon, J.Y.; Chae, M.; Park, D.; Lee, Y.C. Recent trends of sunscreen cosmetic: An update review. Cosmetics 2019, 6, 64. [Google Scholar] [CrossRef]
  9. Ribeiro, F.M.; Volpato, H.; Lazarin-Bidóia, D.; Desoti, V.C.; de Souza, R.O.; Fonseca, M.J.V.; Ueda-Nakamura, T.; Nakamura, C.V.; Silva, S.d.O. The extended production of UV-induced reactive oxygen species in L929 fibroblasts is attenuated by posttreatment with Arrabidaea chica through scavenging mechanisms. J. Photochem. Photobiol. B Biol. 2018, 178, 175–181. [Google Scholar] [CrossRef]
  10. Masaki, H. Role of antioxidants in the skin: Anti-aging effects. J. Dermatol. Sci. 2010, 58, 85–90. [Google Scholar] [CrossRef]
  11. Limón-Pacheco, J.; Gonsebatt, M.E. The role of antioxidants and antioxidant-related enzymes in protective responses to environmentally induced oxidative stress. Mutat. Res. Genet. Toxicol. Environ. Mutagen. 2009, 674, 137–147. [Google Scholar] [CrossRef]
  12. Felippim, E.C.; Marcato, P.D.; Maria, P.; Gonçalves, B.; Campos, M. Development of Photoprotective Formulations Containing Nanostructured Lipid Carriers: Sun Protection Factor, Physical-Mechanical and Sensorial Properties. AAPS Pharmscitech 2020, 21, 1–14. [Google Scholar] [CrossRef] [PubMed]
  13. Piccinino, D.; Capecchi, E.; Tomaino, E.; Gabellone, S.; Gigli, V.; Avitabile, D.; Saladino, R. Nano-structured lignin as green antioxidant and uv shielding ingredient for sunscreen applications. Antioxidants 2021, 10, 274. [Google Scholar] [CrossRef] [PubMed]
  14. Mutalik, S.; Shetty, P.K.; Venuvanka, V.; Jagani, H.V.; Gejjalagere, C.H.; Nayak, U.Y.; Musmade, P.B.; Reddy, M.S.; Kalthur, G.; Udupa, N.; et al. Development and evaluation of sunscreen creams containing morin-encapsulated nanoparticles for enhanced UV radiation protection and antioxidant activity. Int. J. Nanomed. 2015, 10, 6477–6491. [Google Scholar] [CrossRef]
  15. Joshi, H.; Hegde, A.R.; Shetty, P.K.; Gollavilli, H.; Managuli, R.S.; Kalthur, G.; Mutalik, S. Sunscreen creams containing naringenin nanoparticles: Formulation development and in vitro and in vivo evaluations. Photodermatol. Photoimmunol. Photomed. 2018, 34, 69–81. [Google Scholar] [CrossRef]
  16. Draghici-Popa, A.M.; Buliga, D.I.; Popa, I.; Tomas, S.T.; Stan, R.; Boscornea, A.C. Cosmetic products with potential photoprotective effects based on natural compounds extracted from waste of the winemaking industry. Molecules 2024, 29, 2775. [Google Scholar] [CrossRef]
  17. Morocho-Jácome, A.L.; Freire, T.B.; de Oliveira, A.C.; de Almeida, T.S.; Rosado, C.; Velasco, M.V.R.; Baby, A.R. In vivo SPF from multifunctional sunscreen systems developed with natural compounds—A review. J. Cosmet. Dermatol. 2021, 20, 729–737. [Google Scholar] [CrossRef]
  18. Huang, N. Rheological Characterization of Pharmaceutical and Cosmetic Formulations for Cutaneous Applications. Curr. Pharm. Des. 2019, 25, 2349–2363. [Google Scholar] [CrossRef]
  19. Heinrich, U.; Koop, U.; Leneveu-Duchemin, M.; Osterrieder, K.; Bielfeldt, S.; Chkarnat, C.; Degwert, J.; Häntschel, D.; Jaspers, S.; Nissen, H.; et al. Multicentre comparison of skin hydration in terms of physical-, physiological- and product-dependent parameters by the capacitive method (Corneometer CM 825). Int. J. Cosmet. Sci. 2003, 25, 45–53. [Google Scholar] [CrossRef]
  20. Andrei, F. Sensory Science in Cosmetics. In Cosmetic Industry—Trends, Products and Quality Control; IntechOpen: London, UK, 2025; pp. 1–29. [Google Scholar]
  21. Böger, B.R.; Lonni, A.A.S.G.; Benassi, M.d.T. Characterization and Sensory Evaluation of a Cosmeceutical Formulation for the Eye Area with Microencapsulated Roasted Coffee Oil. Cosmetics 2025, 10, 24. [Google Scholar] [CrossRef]
  22. Wang, I.-C.; Jiang, Y.-R.; Wang, Y.-W.; Li, C.-Y. Exploring the multisensory attractiveness of cosmetic packaging: A study of visual and tactile design elements and attractiveness factors. Sustainability 2024, 16, 5716. [Google Scholar] [CrossRef]
  23. Flor, J.; Mazin, M.R.; Ferreira, L.A. Cosméticos Naturais, Orgânicos e Veganos. Cosmet. Toilet. 2019, 31, 30–36. [Google Scholar]
  24. Lee, J.; Kwon, K.H. Good ingredients from foods to vegan cosmetics after COVID-19 pandemic. J. Cosmet. Dermatol. 2022, 21, 3190–3199. [Google Scholar] [CrossRef] [PubMed]
  25. Miguel, I.; Coelho, A.; Bairrada, C.M. Modelling attitude towards consumption of vegan products. Sustainability 2021, 13, 9. [Google Scholar] [CrossRef]
  26. Mansur, J.S.; Breder, M.N.R.; Mansur, M.C.A.; Azulay, R.D. Determinação do fator de proteção solar por espectrofotometria. An. Bras. Dermatol. 1986, 61, 121–124. [Google Scholar]
  27. Bruschi, M.L.; Jones, D.S.; Panzeri, H.; Gremião, M.P.D.; Freitas, O.; Lara, E.H.G. Semisolid Systems Containing Propolis for the Treatment of Periodontal Disease: In Vitro Release Kinetics, Syringeability, Rheological, Textural, and Mucoadhesive Properties. Semisolid Syst. Treat. Periodontal Dis. 2007, 96, 2074–2089. [Google Scholar] [CrossRef]
  28. Hemphill, T.; Campos, W.; Pilehvari, A. Yield-power law model more accurately predicts mud rheology. Oil Gas. J. 1993, 91, 45–50. [Google Scholar]
  29. Santos, R.S.; da Silva, J.B.; Rosseto, H.C.; Vecchi, C.F.; Campanholi, K.d.S.S.; Caetano, W.; Bruschi, M.L. Emulgels containing propolis and curcumin: The effect of type of vegetable oil, poly(acrylic acid) and bioactive agent on physicochemical stability, mechanical and rheological properties. Gels 2021, 7, 120. [Google Scholar] [CrossRef]
  30. Weather Atlas. January Weather Forecast Maringá, Brazil. Available online: https://www.weather-atlas.com/en/brazil/maringa-weather-january (accessed on 15 August 2024).
  31. Fitzpatrick, T.B.; Pathak, M.; Parrish, J.A. Protection of Human Skin Against the Effects of the Sunburn Ultraviolet (290–320 nm), in Sunlight and Man, Normal and Abnormal Photobiological Responses; University of Tokyo: Tokyo, Japan, 1974; p. 751. [Google Scholar]
  32. Martini, A.P.M.; Maia Campos, P.M.B.G. Influence of visible light on cutaneous hyperchromias: Clinical efficacy of broad-spectrum sunscreens. Photodermatol. Photoimmunol. Photomed. 2018, 34, 241–248. [Google Scholar] [CrossRef]
  33. Courage-Khazaka-Scientific-Devices. Multi Probe Adapter 9. 2022. Available online: https://www.courage-khazaka.de/de/wissenschaftliche-produkte/alle/sondensysteme/16-wissenschaftliche-produkte/alle-produkte/75-mpa-d (accessed on 7 December 2022).
  34. Qassem, M.; Kyriacou, P. Review of Modern Techniques for the Assessment of Skin Hydration. Cosmetics 2019, 6, 19. [Google Scholar] [CrossRef]
  35. Courage-Khazaka-Scientific-Devices. Information and Operating Instructions for the Multi Probe Adapter MPA and Its Probes; Courage + Khazaka electronic GmbH: Köln, Germany, 2007. [Google Scholar]
  36. Seno, S.; Shimazu, H.; Kobayashi, H.; Kogure, E.; Watanabe, A.; Isoyama, T. Quantitative evaluation of skin barrier function using water evaporation time related to transepidermal water loss. Skin. Res. Technol. 2023, 29, e13242. [Google Scholar] [CrossRef]
  37. Prudencio, S.; Prude, H.; Ceratti, V.S. Avaliação sensorial de formulações fotoprotetoras em diferentes bases cosméticas. Rev. Saúde e Pesqui. 2012, 5, 487–494. [Google Scholar]
  38. Mbanga, L.; Mulenga, M.; Mpiana, P.T.; Bokolo, K.; Mumbwa, M.; Mvingu, K. Determination of sun protection factor (SPF) of some body creams and lotions marketed in Kinshasa by ultraviolet spectrophotometry. Int. J. Adv. Res. Chem. Sci. 2014, 1, 7–13. [Google Scholar]
  39. Yarovaya, L. Correlation between sensory and instrumental characterization of developed sunscreens containing grape seed extract and a commercial product. Int. J. Cosmet. Sci. 2022, 44, 569–587. [Google Scholar] [CrossRef]
  40. Souza, C.; de Freitas, L.A.P.; Maia Campos, P.M.B.G. Topical Formulation Containing Beeswax-Based Nanoparticles Improved In Vivo Skin Barrier Function. AAPS Pharmscitech 2017, 18, 2505–2516. Available online: http://link.springer.com/10.1208/s12249-017-0737-x (accessed on 7 December 2022). [CrossRef]
  41. Arancibia, C.; Castro, C.; Jublot, L.; Costell, E.; Bayarri, S. Colour, rheology, flavour release and sensory perception of dairy desserts. Influence of thickener and fat content. LWT Food Sci. Technol. 2015, 62, 408–416. [Google Scholar] [CrossRef]
  42. Osterwalder, U.; Sohn, M.; Herzog, B. Global state of sunscreens. Photodermatol. Photoimmunol. Photomed. 2014, 30, 62–80. [Google Scholar] [CrossRef]
  43. Chow, P.S.; Lim, R.T.Y.; Cyriac, F.; Shah, J.C.; Badruddoza, A.Z.M.; Yeoh, T.; Yagnik, C.K.; Tee, X.Y.; Wong, A.B.H.; Chia, V.D.; et al. The Effect of Process Parameters on the Microstructure, Stability, and Sensorial Properties of an Emulsion Cream Formulation. Pharmaceutics 2024, 16, 773. [Google Scholar] [CrossRef]
  44. Said, R.; Cássia, H.; Bassi, J.; Félix, C.; Caetano, W.; Luciano, M. The effect of carbomer 934P and different vegetable oils on physical stability, mechanical and rheological properties of emulsion-based systems containing propolis. J. Mol. Liq. 2020, 307, 112969. [Google Scholar] [CrossRef]
  45. Huang, Z.; Delparastan, P.; Burch, P.; Cheng, J.; Cao, Y.; Messersmith, P.B. Injectable dynamic covalent hydrogels of boronic acid polymers cross-linked by bioactive plant-derived polyphenols. Trans. Annu. Meet. Soc. Biomater. Annu. Int. Biomater. Symp. 2019, 40, 61. [Google Scholar] [CrossRef]
  46. Tadros, T.F. Correlation of viscoelastic properties of stable and flocculated suspensions with their interparticle interactions. Adv. Colloid. Interface Sci. 1996, 68, 97–200. [Google Scholar] [CrossRef]
  47. Krutmann, J. New Developments in Photoprotection of Human Skin. Skin. Pharmacol. Appl. Skin. Physiol. 2001, 14, 401–407. [Google Scholar] [CrossRef] [PubMed]
  48. Hoover, E.; Aslam, S.; Krishnamurthy, K. Physiology, Sebaceous Glands. StatPearls Publishing. 2025. Available online: https://www.ncbi.nlm.nih.gov/books/NBK499819/ (accessed on 24 May 2024).
  49. Man, M.; Xin, S.; Song, S.; Cho, S.; Zhang, X.; Tu, C.; Feingold, K.; Elias, P. Variation of skin surface pH, sebum content and stratum corneum hydration with age and gender in a large chinese population. Skin. Pharmacol. Physiol. 2009, 22, 190–199. [Google Scholar] [CrossRef] [PubMed]
  50. Maan, A.A.; Nazir, A.; Khan, M.K.I.; Ahmad, T.; Zia, R.; Murid, M.; Abrar, M. The therapeutic properties and applications of Aloe vera: A review. J. Herb. Med. 2018, 12, 1–10. [Google Scholar] [CrossRef]
  51. Melo, M.O.; Campos, P.M.B.G. Técnicas para Avaliar a Hidratação e a Oleosidade da Pele. Cosmet. Toilet. 2016, 28, 30–34. [Google Scholar]
  52. Melo, M.O.; Campos, P.M.B.G. Função de Barreira da Pele e pH Cutâneo. Bioengenharia Cutânea 2016, 28, 34–38. [Google Scholar]
  53. Matsumura, Y.; Ananthaswamy, H.N. Toxic effects of ultraviolet radiation on the skin. Toxicol. Appl. Pharmacol. 2004, 195, 298–308. [Google Scholar] [CrossRef]
  54. Vitale, M.; Truchuelo, M.T.; Nobile, V.; Gómez-Sánchez, M.J. Clinical Tolerability and Efficacy Establishment of a New Cosmetic Treatment Regimen Intended for Sensitive Skin. Appl. Sci. 2024, 14, 6252. [Google Scholar] [CrossRef]
  55. Hu, S.; Zhang, X.; Chen, F.; Wang, M. Dietary polyphenols as photoprotective agents against UV radiation. J. Funct. Foods 2017, 30, 108–118. [Google Scholar] [CrossRef]
  56. Balboa, E.M.; Conde, E.; Moure, A.; Falqué, E.; Domínguez, H. In vitro antioxidant properties of crude extracts and compounds from brown algae. Food Chem. 2013, 138, 1764–1785. [Google Scholar] [CrossRef]
  57. Pugliese, A.G.; Tomas-barberan, F.A.; Truchado, P.; Genovese, M.I.; Prestes, L. Flavonoids, Proanthocyanidins, Vitamin C, and Antioxidant Activity of Theobroma grandif lorum (Cupuassu) Pulp and Seeds. J. Agric. Food Chem. 2013, 61, 2720–2728. [Google Scholar] [CrossRef]
  58. Chakraborty, K.; Joseph, D.; Joy, M.; Raola, V.K. Characterization of substituted aryl meroterpenoids from red seaweed Hypnea musciformis as potential antioxidants. Food Chem. 2016, 212, 778–788. [Google Scholar] [CrossRef] [PubMed]
  59. Li, X.; Dinish, U.S.; Aguirre, J.; Bi, R.; Dev, K.; Attia, A.B.E.; Nitkunanantharajah, S.; Lim, Q.H.; Schwarz, M.; Yew, Y.W.; et al. Optoacoustic mesoscopy analysis and quantitative estimation of specific imaging metrics in Fitzpatrick skin phototypes II to V. J. Biophotonics. 2019, 12, 1–9. [Google Scholar] [CrossRef] [PubMed]
  60. Lim, J. Hedonic scaling: A review of methods and theory. Food Qual. Prefer. 2011, 22, 733–747. [Google Scholar] [CrossRef]
Figure 1. Rheological behavior of P1 and P2. Viscosity as a function of the shear rate, flow diagram of P1 (A) and P2 (B). Shear stress as a function of the shear rate, flow diagram of P1 (C) and P2 (D). The analyses were performed at temperatures of 4 °C (), 25 °C (), 34 °C (), and 40 °C (). The closed symbol represents the forward curve, and the open symbol represents the return curve. Each rheogram is the average of at least three replicates with a variation coefficient of less than 10%.
Cosmetics 12 00112 g001
Figure 2. Storage module G′ () and loss module G″ () depending on the frequency of P1 at temperatures of 4 °C (A), 25 °C (B), 34 °C (C), and 40 °C (D), and P2 at temperatures of 4 °C (E), 25 °C (F), 34 °C (G), and 40 °C (H). Each rheogram is the average of at least three replicates with a variation coefficient of less than 10%.
Cosmetics 12 00112 g002
Figure 3. Skin sebum content assessment in male (A) and female (G) individuals, skin hydration for male (B) and female (H), transepidermal water loss for male (C) and female (I), skin erythema for male (D) and female (J), melanin level for male (E) and female (K), and skin color in male (F) and female (L) (MPA 9, Courage-Khazaka) at time 0 min, time 1 (one hour after application), and time 2 (two hours after application). (NC) negative control, (P1) product 1, (P2) product 2. * p < 0.05, ** p < 0.01, and *** p < 0.001 indicate a significant difference compared with NC according to one-way ANOVA with Tukey test.
Cosmetics 12 00112 g003
Figure 4. Acceptance index (%) using the adopted parameters: appearance, fragrance, texture, and skin sensation for (A) P1 and (B) P2. 5-point purchase intention graph (%) for P1 and P2 (C).
Cosmetics 12 00112 g004
Table 1. Sun protection factor (SPF) of P1 and P2 by Mansur in vitro method.
FormulationSPF ± SD
P125.21 ± 1.09
P212.10 ± 0.43
Table 2. Results of the hysteresis areas, k, n, and τ0, at temperatures of 4, 25, 34, and 40 °C for P1 and P2. Means with the same letter are significantly different comparing P1 with P2 (p < 0.05) according to the one-way ANOVA with Tukey test.
Temperature (°C). k   ( Pa × s ) n (dimensionless)τ0 (Pa)Hysteresis Area (Pa/s)
P1
4c 35.08 ± 1.410.27 ± 0.01g 36.50 ± 2.57a 89,097.50 ± 9034.23
25d 14.66 ± 0.950.37 ± 0.0017.37 ± 2.4712,934.00 ± 832.60
34e 12.29 ± 0.460.35 ± 0.0217.80 ± 2.82b 30,046.67 ± 2832.85
40f 13.88 ± 1.480.30 ± 0.02h 11.82 ± 3.0457,483.33 ± 6890.91
P2
4c 41.25 ± 2.680.26 ± 0.00g 15.45 ± 4.56a 105,525.00 ± 1951.71
25d 22.67 ± 0.470.32 ± 0.0022.73 ± 0.8126,993.33 ± 12.79
34e 20.95 ± 1.310.33 ± 0.0018.07 ± 3.31b 61,085.00 ± 2990.85
40f 24.38 ± 5.130.28 ± 0.01h 2.93 ± 0.8566,178.00 ± 13,671.29
Table 3. Skin Tones According to the Fitzpatrick scale and age of male and female volunteers [31].
VolunteersAgeSkin Tone
Male26; 18; 19; 25; 22; 23; 22; 31; 20; 22; 20; 18; 28; 26III; III; III; II; III; II; II; III; III; II, II, III; III; III
Female27; 29; 20; 28; 33; 19; 20; 30; 24; 30; 51; 35; 59; 26II; II; II; III; III; III; II; II; III; III; III; II; III; II
Table 4. pH values of P1 and P2, considering three replicates by pH meter (Digimed®).
FormulationpH ± SD
P17.48 ± 0.13
P27.40 ± 0.12
Disclaimer/Publisher’s Note: The statements, opinions and data contained in all publications are solely those of the individual author(s) and contributor(s) and not of MDPI and/or the editor(s). MDPI and/or the editor(s) disclaim responsibility for any injury to people or property resulting from any ideas, methods, instructions or products referred to in the content.

