Article

Development of a “Green” Emulsion with a Milk Protein Hydrolysate: An Evaluation of Rheology, Texture, In Vitro Bioactivity, and Safety

by
Mila Vukašinović
1,
Ivana Pantelić
1,
Sanela Savić
2,3,
Nebojša Cekić
2,3,
Maja Vukašinović Sekulić
4,
Jelena Antić Stanković
5,
Dragana D. Božić
5,
Anđela Tošić
1,
Slobodanka Tamburić
6 and
Snežana D. Savić
1,*
1
Department of Pharmaceutical Technology and Cosmetology, Faculty of Pharmacy, University of Belgrade, Vojvode Stepe 450, 11221 Belgrade, Serbia
2
DCP Hemigal, R&D Sector, Tekstilna 97, 16000 Leskovac, Serbia
3
Faculty of Technology, University of Niš, Bulevar Oslobodjenja 124, 16000 Leskovac, Serbia
4
Department of Biochemical Engineering and Biotechnology, Faculty of Technology and Metallurgy, University of Belgrade, Karnegijeva 4, 11000 Belgrade, Serbia
5
Department of Immunology and Microbiology, Faculty of Pharmacy, University of Belgrade, Vojvode Stepe 450, 11221 Belgrade, Serbia
6
Cosmetic Science Research Group, London College of Fashion, University of the Arts London, London WC1V 7EY, UK
*
Author to whom correspondence should be addressed.
Cosmetics 2023, 10(6), 162; https://doi.org/10.3390/cosmetics10060162
Submission received: 30 October 2023 / Revised: 16 November 2023 / Accepted: 20 November 2023 / Published: 28 November 2023
(This article belongs to the Collection Feature Papers in Cosmetics in 2023)

Abstract

:
Bioactive peptides are promising cosmetic active ingredients that can improve skin health and appearance. They exhibit a broad spectrum of activity, including anti-aging, antioxidant, antimicrobial, and anti-inflammatory effects. The aim of this study was to develop a safe, stable, and efficacious environmentally friendly (“green”) emulsion using a milk protein hydrolysate as a model active ingredient. Potential emulsions were formulated with biodegradable emollients, stabilized with naturally derived mixed emulsifier, and prepared by cold process. They were evaluated for rheological behavior (continuous rotation and oscillation tests), physical stability (dynamic mechanical thermal analysis—DMTA test), and texture profiles, as well as cytotoxic, antioxidant, and antimicrobial effects. Rheological characterization revealed shear-thinning flow behavior with yield point from continuous rotation tests and predominantly elastic character from oscillation (amplitude and frequency sweep) tests, with small structural change detected in the DMTA test. These results implied satisfactory rheological properties and good stability. Texture analysis revealed acceptable spreadability and substantivity of the emulsions. The protein hydrolysate showed antioxidant activity. The developed emulsions showed low antibacterial activity against selected microorganisms, but this was due to the action of preservatives, not peptides. All potential emulsions showed a desirable safety profile. The results obtained provide the basis for the next stage of formulation development, i.e., in vivo efficacy tests.

Graphical Abstract

1. Introduction

Numerous peptides with cosmetic potential have been developed in response to frequent and not fully satisfied market needs for the formulation of innovative and effective cosmetic products with noticeable, immediate, and long-lasting effects [1,2]. The potential benefits of topically applied peptides have been identified through research in the area of wound healing, as these compounds may have a positive effect on skin components, particularly collagen synthesis [3]. In general, peptides intended for topical use can be divided into four main categories based on their mechanism of action: signal peptides (stimulate matrix protein production, cell growth, and other cell metabolic functions); carrier peptides (facilitate the transport of trace elements within the cell); neurotransmitter-inhibiting peptides (inhibit the release of acetylcholine and thus reduce the contraction of facial muscles and the expression of lines and wrinkles); and enzyme-inhibiting peptides (decrease the activity of enzymes related to skin aging) [3,4,5]. In addition, the application of cosmetic formulations containing peptides showed some immediate effects, including a significant increase in the water content of the stratum corneum layer, an increase in skin elasticity, and an improvement in microrelief after a single application [6].
Biopeptides are a new generation of active ingredients from natural sources, developed as a response to the growing consumer awareness of environmental protection and sustainability [2,4,7]. Researchers are particularly interested in food-derived bioactive peptides produced by the hydrolysis of food proteins (animal, marine, and plant origin) because they are naturally derived and considered “green” and potentially have few side effects [4,8]. Milk proteins (from cows, sheep, goats, etc.) are considered the most important source of bioactive peptides, and an increasing number of bioactive peptides have been identified in milk protein hydrolysates and fermented milk products [9]. The main function of milk in infancy is to serve as a source of protein and nitrogen for young mammals [10]. A considerable part of the health benefits of milk are associated with its proteins, not only for their nutritional value but also for their biological properties. Although proteins from plant sources are attracting increasing interest, plant foods generally provide less complete protein nutrition than animal proteins due to lower digestibility and source-specific deficiencies in essential amino acids [11]. Protein hydrolysates containing bioactive peptides are classified as “Generally Recognized as Safe” (GRAS) by the U.S. Food and Drug Administration (FDA) [5].
Bioactive peptides are defined as specific regions of proteins whose activity is based on their inherent amino acid composition and sequence. Active sequences can have two to twenty amino acid residues [7,9]. Food peptides have no effect unless they are released from the precursor protein in which they are encoded [9,12,13]. Various methods have been developed to obtain biopeptides. The characteristics of an optimal method include low-cost, large-scale production, reproducibility, and biocompatibility [10]. The most efficient methods for producing functional hydrolysates or peptides are enzymatic hydrolysis of precursor proteins by digestive enzymes, fermentation with proteolytic starter cultures, and proteolysis by enzymes from microorganisms or plants [14]. The biological activity of peptides depends on the protein source, the enzyme used, and the processing conditions, such as substrate concentration, enzyme/substrate ratio, incubation time, degree of hydrolysis (number of broken peptide bonds relative to the original protein), and physicochemical conditions during the process (pH and temperature) [8,15]. Therefore, to ensure high activity of the peptides formed, it is necessary to strictly control the degree of enzymatic hydrolysis [4].
It is known that many peptides have single or multifunctional biological properties (antioxidant, antimicrobial, anti-inflammatory, and anti-aging) with potential topical applications. In particular, antioxidant peptides have become active materials of interest in various fields [16]. There is growing evidence that oxidative stress caused by the disruption of redox homeostasis in living organisms is involved in aging, as well as the onset and development of numerous chronic diseases such as cancer, cardiovascular disease, weakened immune system, liver disease, inflammation, kidney failure, brain dysfunction, cataracts, and diabetes. Reactive oxygen species (ROS) are a class of free radical species produced primarily by the mitochondrial respiratory chain and are associated with oxidative stress signaling in normal cells. However, when the accumulation of ROS exceeds the ability of the cellular system to scavenge free radicals, these reactive species trigger uncontrolled reactions with non-target biomolecules (lipids, proteins, and DNA) and mediate the subsequent activation of pro-inflammatory or pro-apoptotic signaling pathways. This condition necessitates additional supplementation to balance antioxidants and oxidants in biological tissues [17,18]. Antioxidants can stabilize or deactivate free radicals before they attack cells [18]. Bioactive peptides with antioxidant properties can be used in cosmetics to prevent the harmful effects of oxidative stress caused by the excessive production of ROS in the skin. The antioxidant activity depends on the structural properties of the peptides, such as molecular weight, hydrophobicity, and the presence of certain amino acids, as well as the amino acid sequence. It occurs through several mechanisms: hydrogen atom transfer (HAT), single-electron transfer (SET), and chelating (prooxidant) transition metals [4,7,12]. The hydrophobic character of peptides plays an important role in enhancing antioxidant properties by increasing the accessibility of the peptide to hydrophobic cellular targets, such as polyunsaturated fatty acids, in biological membranes [7].
Antimicrobial peptides (AMPs) serve as the first line of defense of the innate immune system and are secreted by keratinocytes and other skin cells such as eccrine gland cells, mast cells, and sebocytes. AMPs play an essential role in protecting the skin and body from invading pathogens and exhibit broad-spectrum antimicrobial activity against a range of bacteria (both Gram-negative and Gram-positive), fungi, and viruses [19]. AMPs are primarily a family of small peptides (less than 100 amino acids) that are generally cationic and amphipathic. AMPs are water soluble, and their amphipathic structure allows them to bind both hydrophilic phospholipid head groups and hydrophobic tail groups that form the lipid bilayers of microbial cells. The positive charge allows AMPs to adsorb to the anionic phospholipids of bacterial cell membranes, effectively disrupting and destabilizing them, leading to the leakage of cell contents and eventual death of the microbial cell [19,20]. AMPs can be produced from a variety of protein sources, such as milk, by enzymatic hydrolysis or microbial fermentation. AMPs are more advantageous compared to conventional antibiotics because they bypass common resistance mechanisms and limit microbial resistance [20].
The main concern and challenge in the use of bioactive peptides in cosmetic formulations is the maintenance of their physicochemical stability and biological activity during the manufacture and storage of the product since their properties can be affected by several variables [7,21]. Chemical instability of peptides corresponds to the formation or degradation of covalent bonds; physical instability is mainly caused by denaturation, aggregation, and surface adsorption. Biological instability is caused by the hydrolytic action of cellular enzymes leading to the degradation or inactivation of the active molecule and consequent loss of biological activity. All these degradation processes shorten the shelf life of peptides and limit their use in different formulations [21]. It is, therefore, necessary to evaluate the quality of a cosmetic product using different techniques.
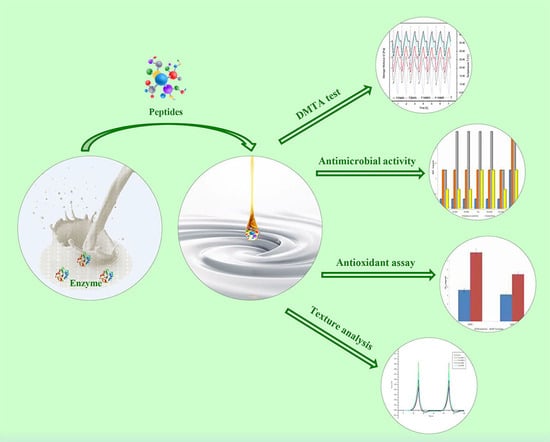
The aim of the present study was to explore the use of two different cow’s milk protein hydrolysates in the development of safe, stable, and efficacious fluid O/W emulsions with a good sustainability profile (also defined as “green”). In addition to the hydrolysates, the formulations contained two novel emollients from the class of C15-C19 alkanes, promoted as biodegradable alternatives to silicone oils and an innovative naturally derived glycolipid mixed emulsifier (lauryl glucoside/myristyl glucoside/polyglyceryl–6 laurate). This emulsifier allowed the use of a cold emulsification process, contributing to the green credentials of the proposed formulation.
The formulations with and without active ingredients were extensively studied for their rheological behavior, physical stability, and textural profile, while bioactivity and safety were assessed through in vitro evaluation of antioxidant activity, antimicrobial activity, and effects on cell viability.

2. Materials and Methods

2.1. Materials

The active ingredients, milk protein hydrolysates named Nutrilan® Milk EP (NM hydrolysate) and Milk Protein COS (MPC hydrolysate), were kindly provided by BASF (Monheim, Germany) and Lipoid (Duisburg, Germany), respectively. A key emulsion stabilizer (mixed emulsifier consisting of lauryl glucoside, myristyl glucoside, and polyglyceryl-6 laurate) named Fluidifeel® Easy (FFE) was generously provided by Seppic (Paris, France), as were the biocompatible emollients Emogreen® L15 and Emogreen® L19 (both with the same International Nomenclature of Cosmetic Ingredients (INCI) name, C15–19 alkane). Glycerin was purchased from Fagron (Trikala, Greece). A preservative mixture of Ethylhexylglycerol and Phenoxyethanol (Sharomix® EG 10) was purchased from Sharon Laboratories (Ashdod, Israel), while xanthan gum (Safic Care® T XGC 80) was from Safic-Alcan (Milan, Italy). 2,2-diphenyl-1-picrylhydrazyl (DPPH)), laboratory-grade, was from Merck (Darmstadt, Germany), and 2,2′-azino-bis-(3-ethylbenzothiazoline-6-sulfonic) acid (ABTS)), purity 98%, was from Alfa Aesar (Haverhill, MA, USA). Potassium persulfate (≥98% purity) was purchased from Lechner (Neratovice, Czech Republic), while 96% ethanol (Ph Eur) was from Zorka Pharma (Šabac, Serbia). Pharmaceutical-grade purified water was obtained internally using a Gen Pure Ultrapure device (Thermo Fisher Scientific GmbH, Munich, Germany). Resazurin sodium salt (laboratory grade) was from Sigma—Aldrich (Saint Louis, MO, USA).

2.2. Preparation of the Samples

All emulsions (see Table 1 for exact composition), differing in the type of emollients and the presence and concentration of milk protein hydrolysates, were prepared by a “cold” emulsification procedure (at room temperature). In liquid form, the nonionic O/W emulsifier Fluidifeel® Easy (lauryl glucoside/myristyl glucoside/polyglyceryl–6 laurate mixture) at 2% (w/w) was added to the water and then stirred at 6000 rpm for 40 s using a rotor-stator homogenizer (Ultra-Turrax T25, IKA, Staufen, Germany). Subsequently, the oil phase, in the quantity of 30% (w/w) consisting of either Emogreen® L15—EG L15 or Emogreen® L19—EG L19, was slowly added to the aqueous phase while stirring at 4400 rpm. The obtained emulsion was then homogenized at 8000 rpm for 5 min. In the last min of homogenization, 1% (w/w) of the preservative was added. The emulsion was then transferred to a laboratory stirrer with a propeller agitator (Heidolph RZR 2020, Heidolph, Schwabach, Germany), and homogenization continued with the addition of a rheology modifier (xanthan gum dispersed in glycerol) at 650 rpm for 6 min. Finally, in the preparation of the “active” emulsions, the liquid form of the active ingredient was added at a reduced mixing speed (200 rpm), and homogenization continued for 5 min.

2.3. Determination of the Antioxidative Activity of Milk Protein Hydrolysates

The antioxidant activity of milk protein hydrolysates per se was evaluated by two spectrophotometric SET methods: 2,2′-azino-bis-(3-ethylbenzothiazoline-6-sulfonic) acid (ABTS) and a 2,2-Diphenyl-1-picrylhydrazyl (DPPH) radical scavenging test.
Before performing the antioxidant tests, the peptide content in both commercial hydrolysates was determined using the Lowry method [22]. The total peptide content was calculated from the linear equation of a standard curve prepared with bovine serum albumin.

2.3.1. DPPH Radical Scavenging Activity

The modified method of Li et al. [23] was used to determine the DPPH radical scavenging activity of the milk protein hydrolysates. A total of 0.5 mL of the hydrolysate sample (each sample with different peptide concentrations, from 1 to 10 mg/mL) was mixed with 1.5 mL of 0.1 mM DPPH solution in 96% ethanol. The control was prepared in the same way, except that distilled water was used instead of the sample. The mixture obtained was shaken vigorously before incubation for 30 min under the exclusion of light and at room temperature. The sample was again vigorously shaken, and the absorbance at 517 nm was measured using a UV-VIS spectrophotometer (Ultrospec® 3300 Amersham Biosciences, Little Chalfont, Buckinghamshire, UK). A lower absorbance of the reaction mixture indicates higher scavenging activity for the DPPH radical. DPPH radical scavenging was calculated using the following equation:
D P P H   r a d i c a l   s c a v e n i n g   a c t i v i t y % = A c A s A c × 100
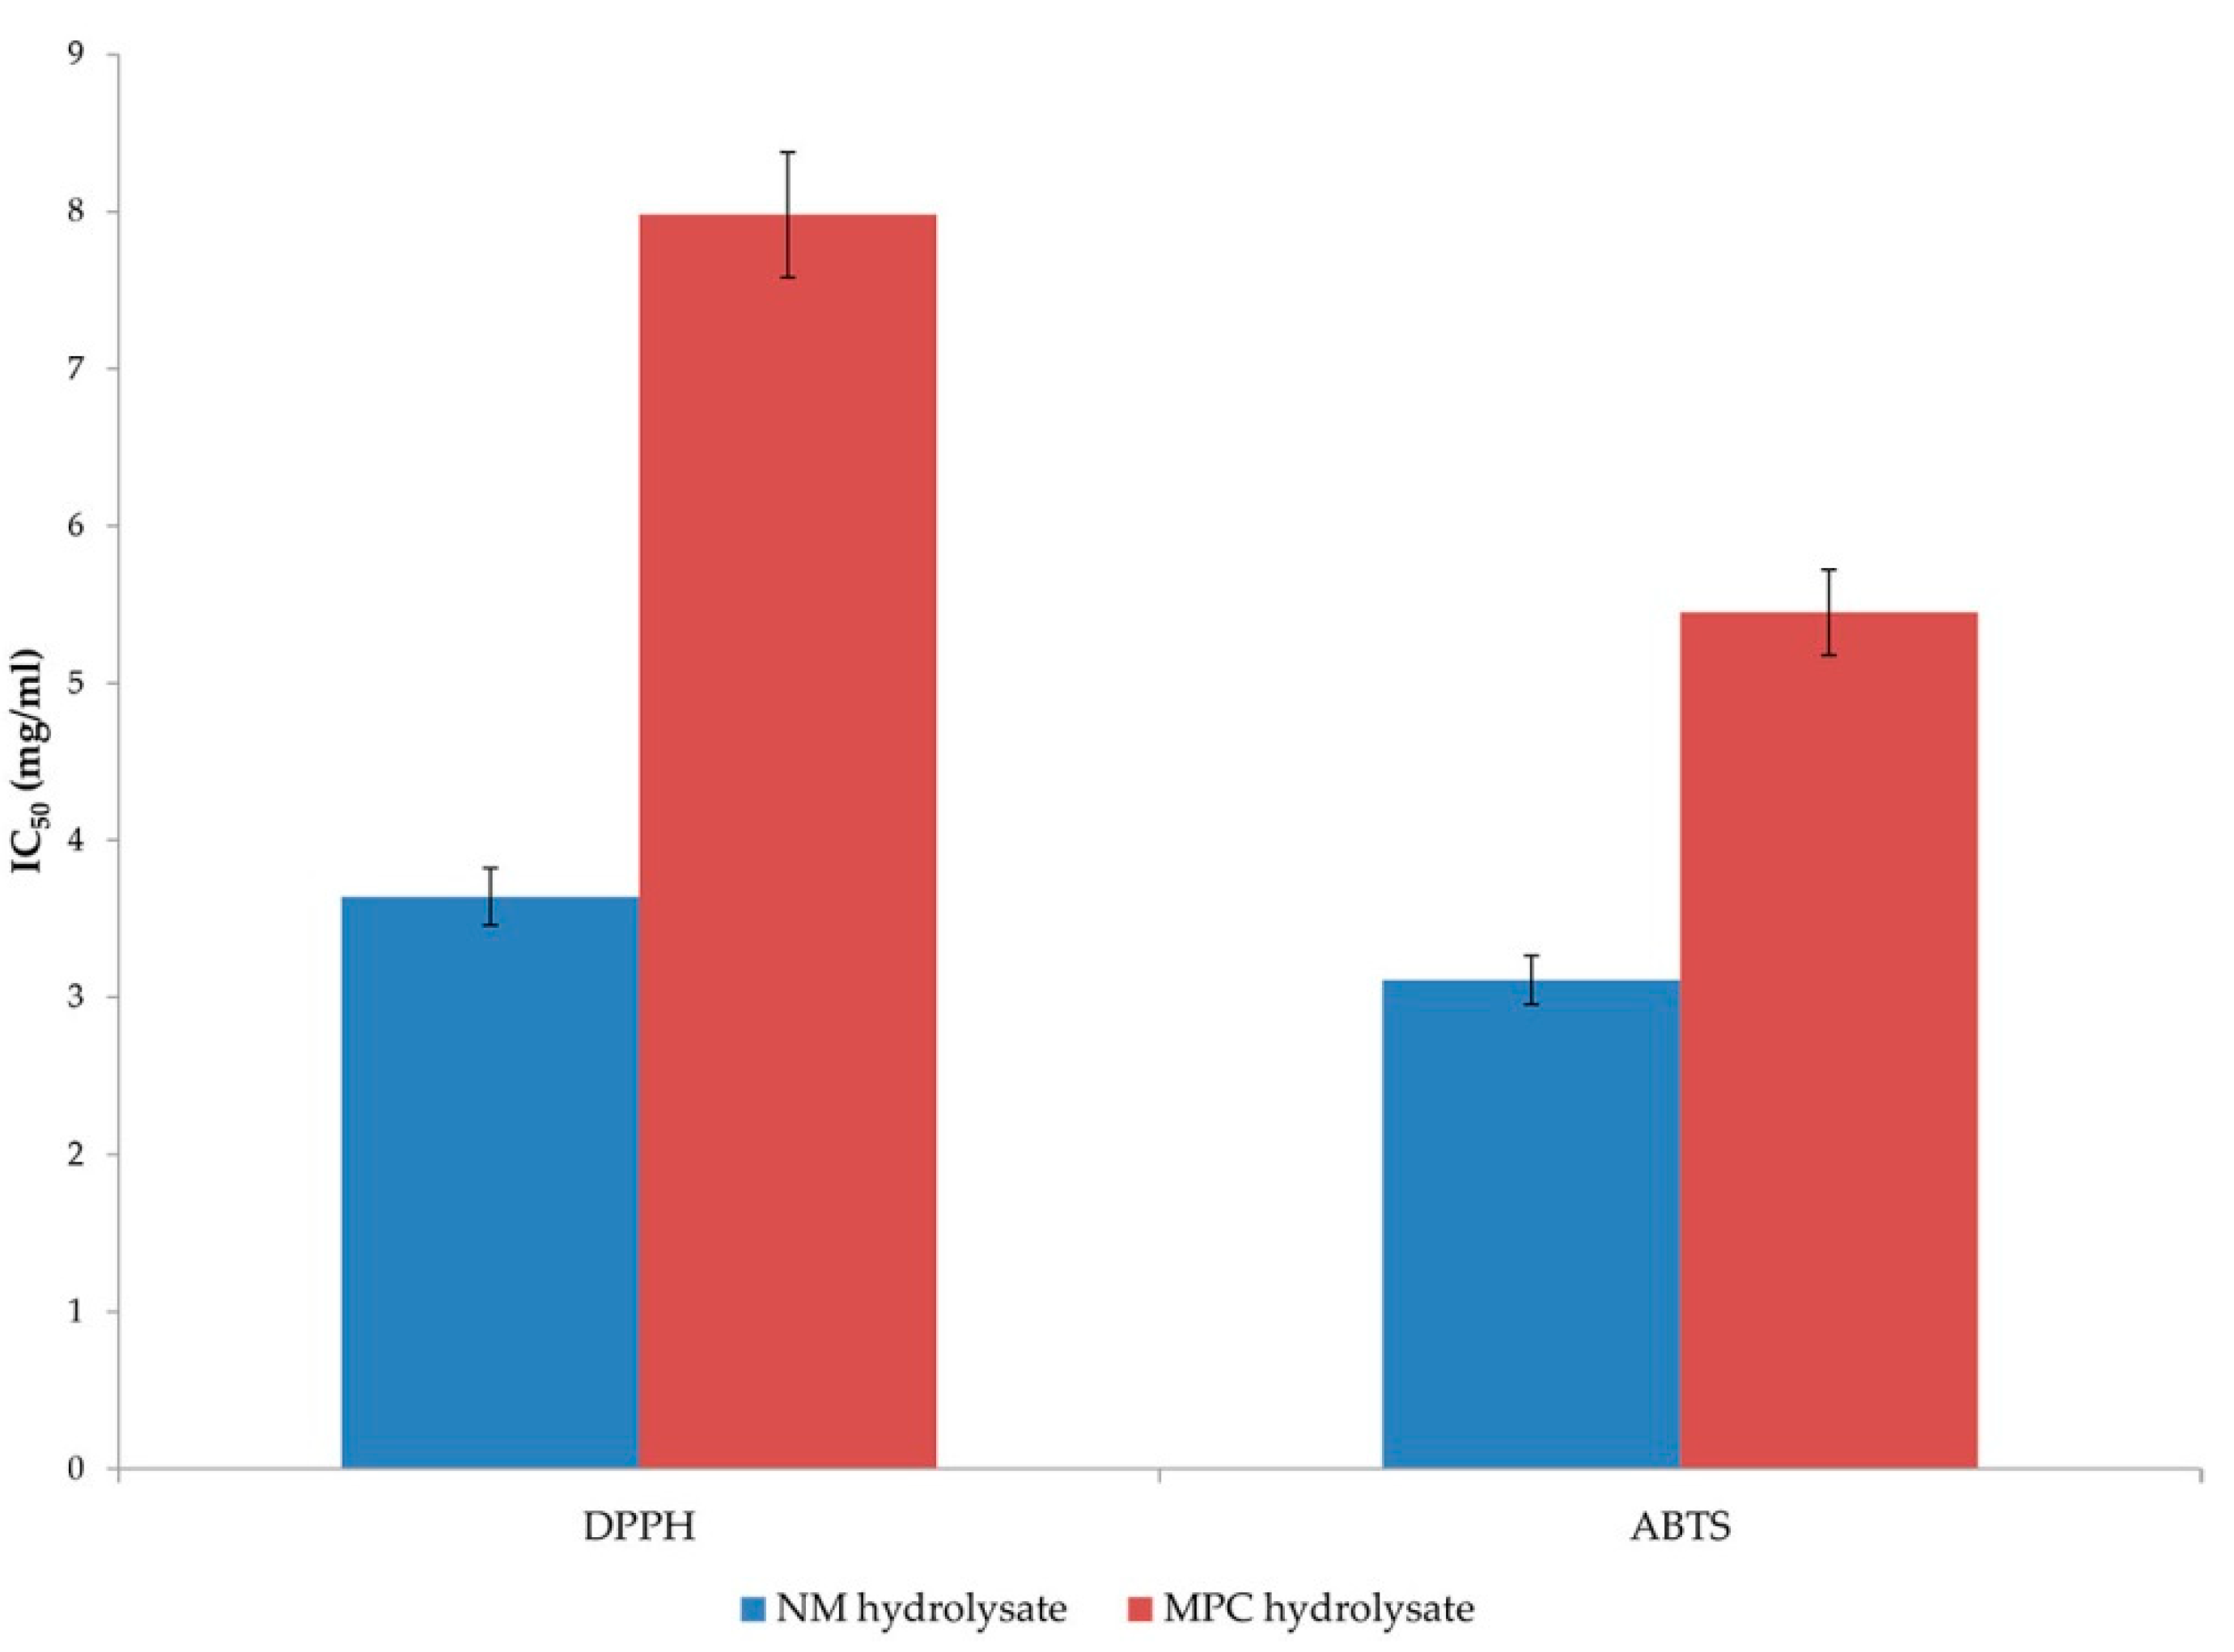
In the formula, Ac is the absorbance of the control, while As is the absorbance of the sample. The activity is expressed as inhibitory concentration IC50, which is the concentration of antioxidants required to reduce the initial DPPH activity by 50%. The lower the IC50, the higher the efficacy against radicals [18]. All measurements were performed in triplicate, and data are presented as the mean of three values.

2.3.2. ABTS Radical Scavenging Activity

The antioxidant activity of the milk protein hydrolysates was determined according to the method described by Re et al. [24]. ABTS radical cation (ABTS•+) was prepared by reacting a 7 mM ABTS stock solution with 2.45 mM potassium persulfate (final concentration), and the mixture was kept in the dark at room temperature for 12–16 h before use. The solution was then diluted in 5 mM phosphate-buffered saline (PBS, pH 7.4) to an absorbance of 0.70 ± 0.02 at 734 nm. A total of 10 µL of the sample (each sample with different peptide concentrations, from 1 to 10 mg/mL) was added to 1 mL of the diluted ABTS•+ solution and incubated for 6 min at room temperature in the dark. The control was prepared in the same manner, except that PBS was used instead of the sample. The reduction of the blue-green ABTS•+ by hydrogen-donating antioxidants was measured spectrophotometrically by observing the suppression of the characteristic long-wavelength absorption spectrum [18,25]. The ABTS scavenging effect was calculated using the following equation:
A B T S   r a d i c a l   s c a v e n i n g   a c t i v i t y % = A c A s A c × 100
where Ac is the absorbance of the control and As is the absorbance of the sample. The activity is expressed as inhibitory concentration IC50, which is the concentration of antioxidants required to reduce the initial ABTS activity by 50%. All measurements were performed in triplicate, and data are presented as the mean of three values.
The UV-VIS spectrophotometer used (Ultrospec® 3300 Amersham Biosciences, Little Chalfont, Buckinghamshire, UK) is a stand-alone, easy-to-use device with a high-resolution liquid crystal display (LCD). It works on the basis of light from deuterium and tungsten lamps, which is guided by a fixed mirror through the entrance slit of the monochromator. Absorbance mode measures the amount of light that has passed through a sample relative to a blank. The wavelength range extends from 190 to 1100 nm.

2.4. Rheological Analysis

The rheological characteristics of the formulated model emulsions were explored with an Anton Paar MCR 302 air-bearing rheometer (Anton Paar, GmbH, Graz, Austria), equipped with a coaxial cylinder system CC27/C-PTD 180/AIR PELTIER Temp Control System (including an appropriate evaporation blocker system) and navigated by RheoCompass
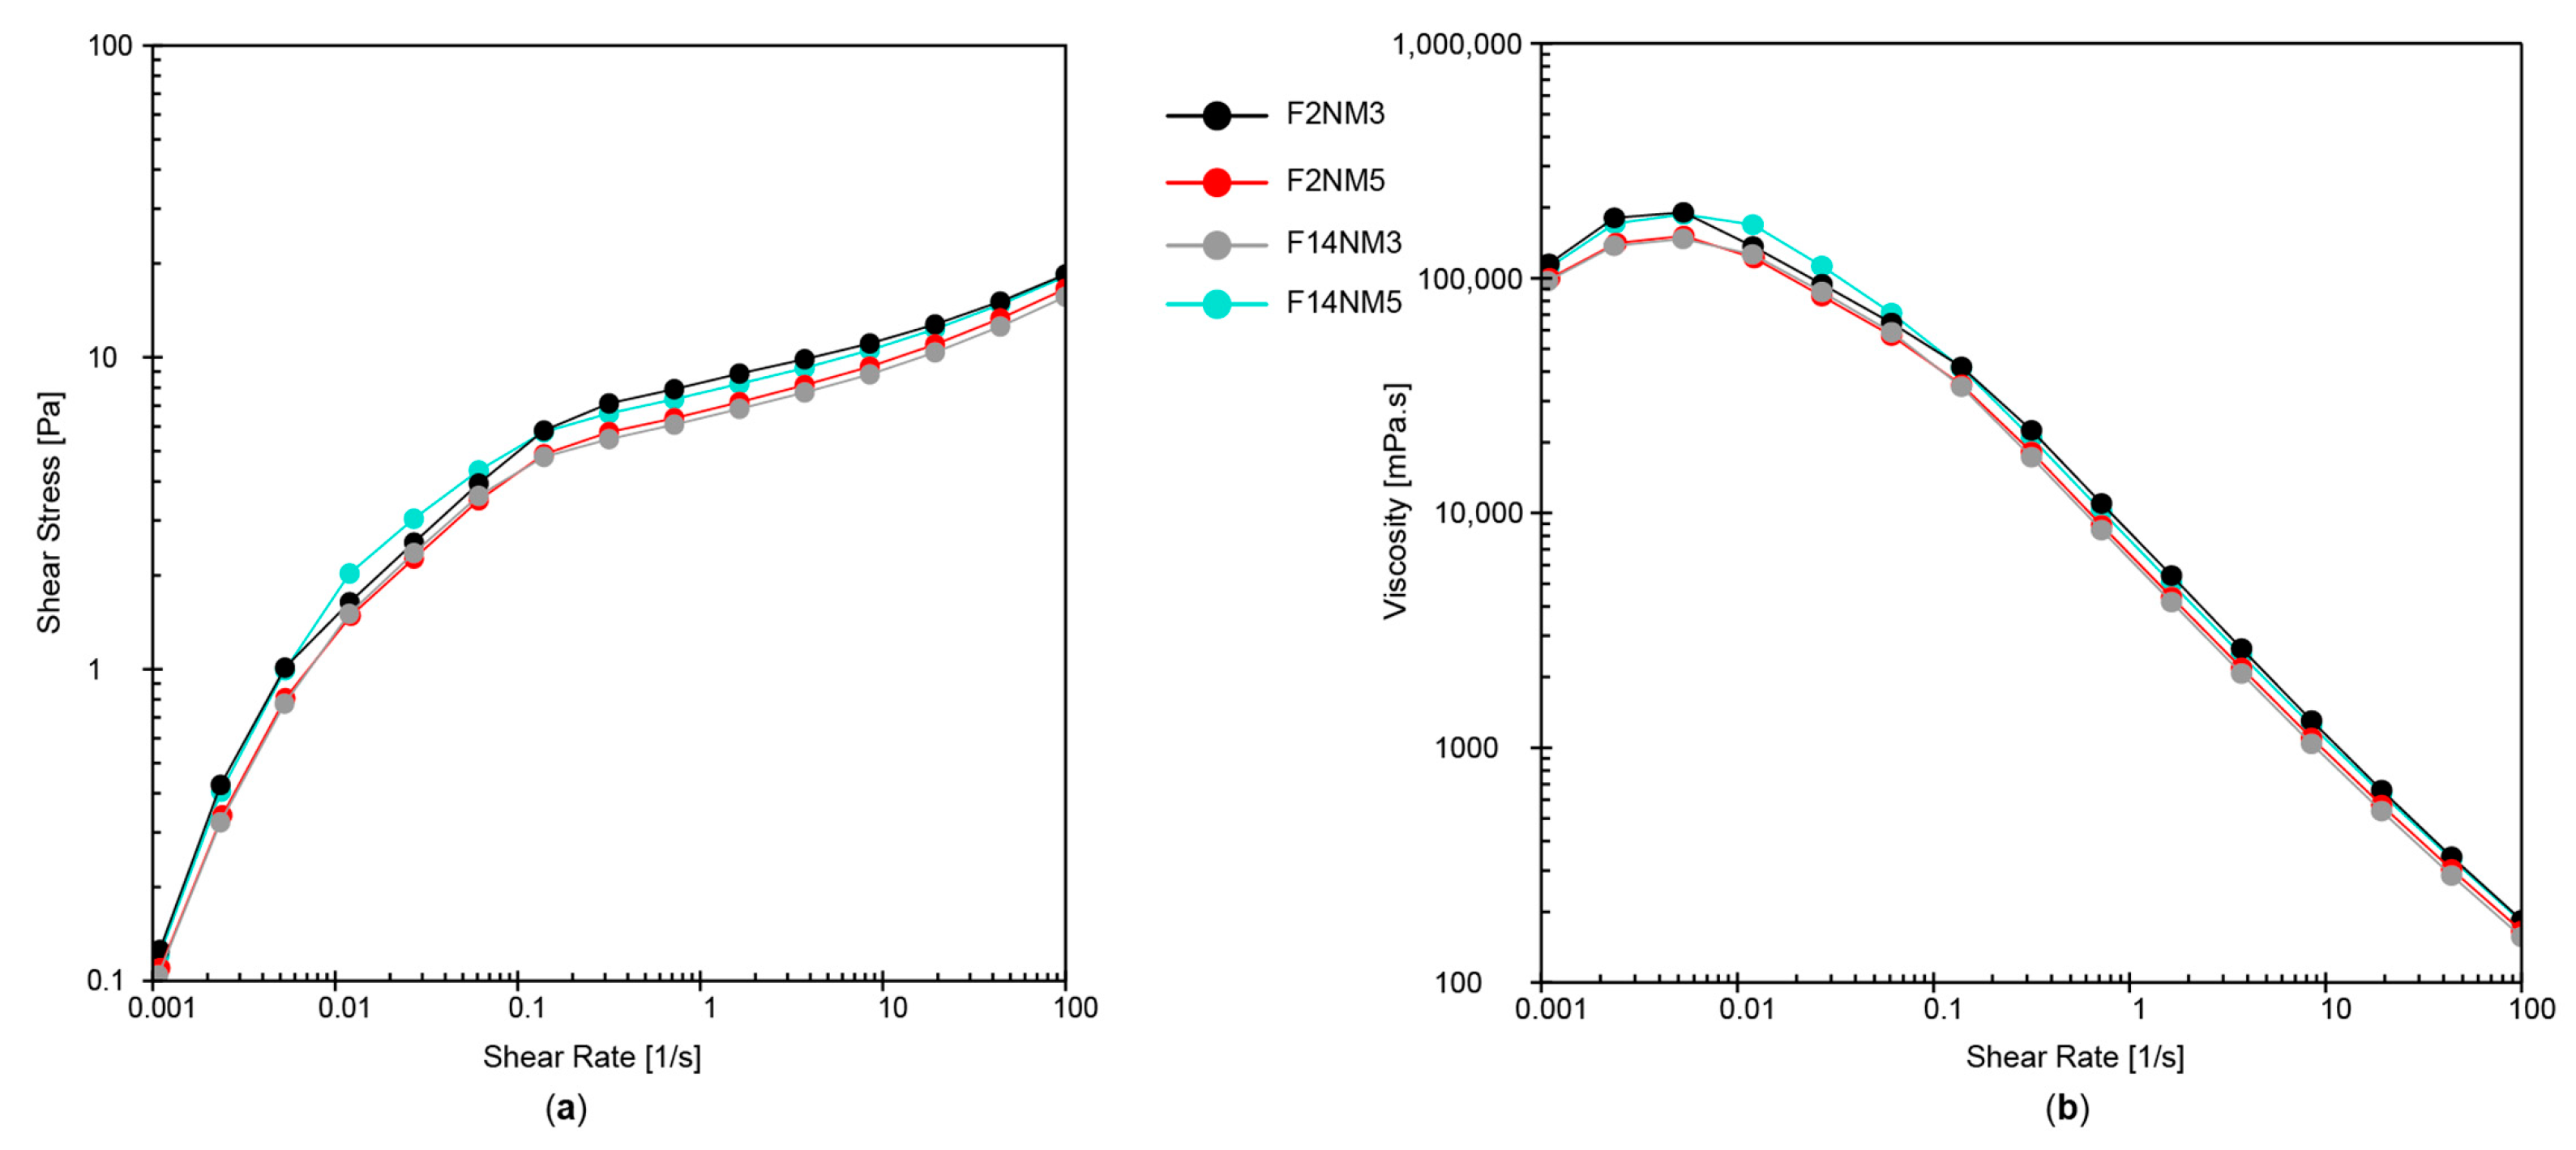
® software v130. 1227 (Anton Paar GmbH). To obtain flow curves and viscosity curves of the emulsion samples, continuous rotational tests were conducted at 20 °C in the shear rate range of 0.1–100 s−1 and vice versa for the upward and downward curves, respectively. The parameters obtained from continuous rotational testing were apparent viscosity (interpolated at a shear rate of 50 s−1) and hysteresis area. To characterize the viscoelastic properties of the developed emulsions, isothermal oscillatory tests (dynamical–mechanical analysis), including amplitude and frequency sweeps, were performed. First, the amplitude sweeps were conducted at a radial frequency (ω) value of 10 rad s−1 in the deformation range of 0.01–200%. Afterward, the frequency sweeps were carried out in the linear viscoelastic region (LVER) at the deformation value equal to the deformation limit (γL) acquired from previously performed amplitude sweeps [26], while ω varied from 0.01 to 100 rad s
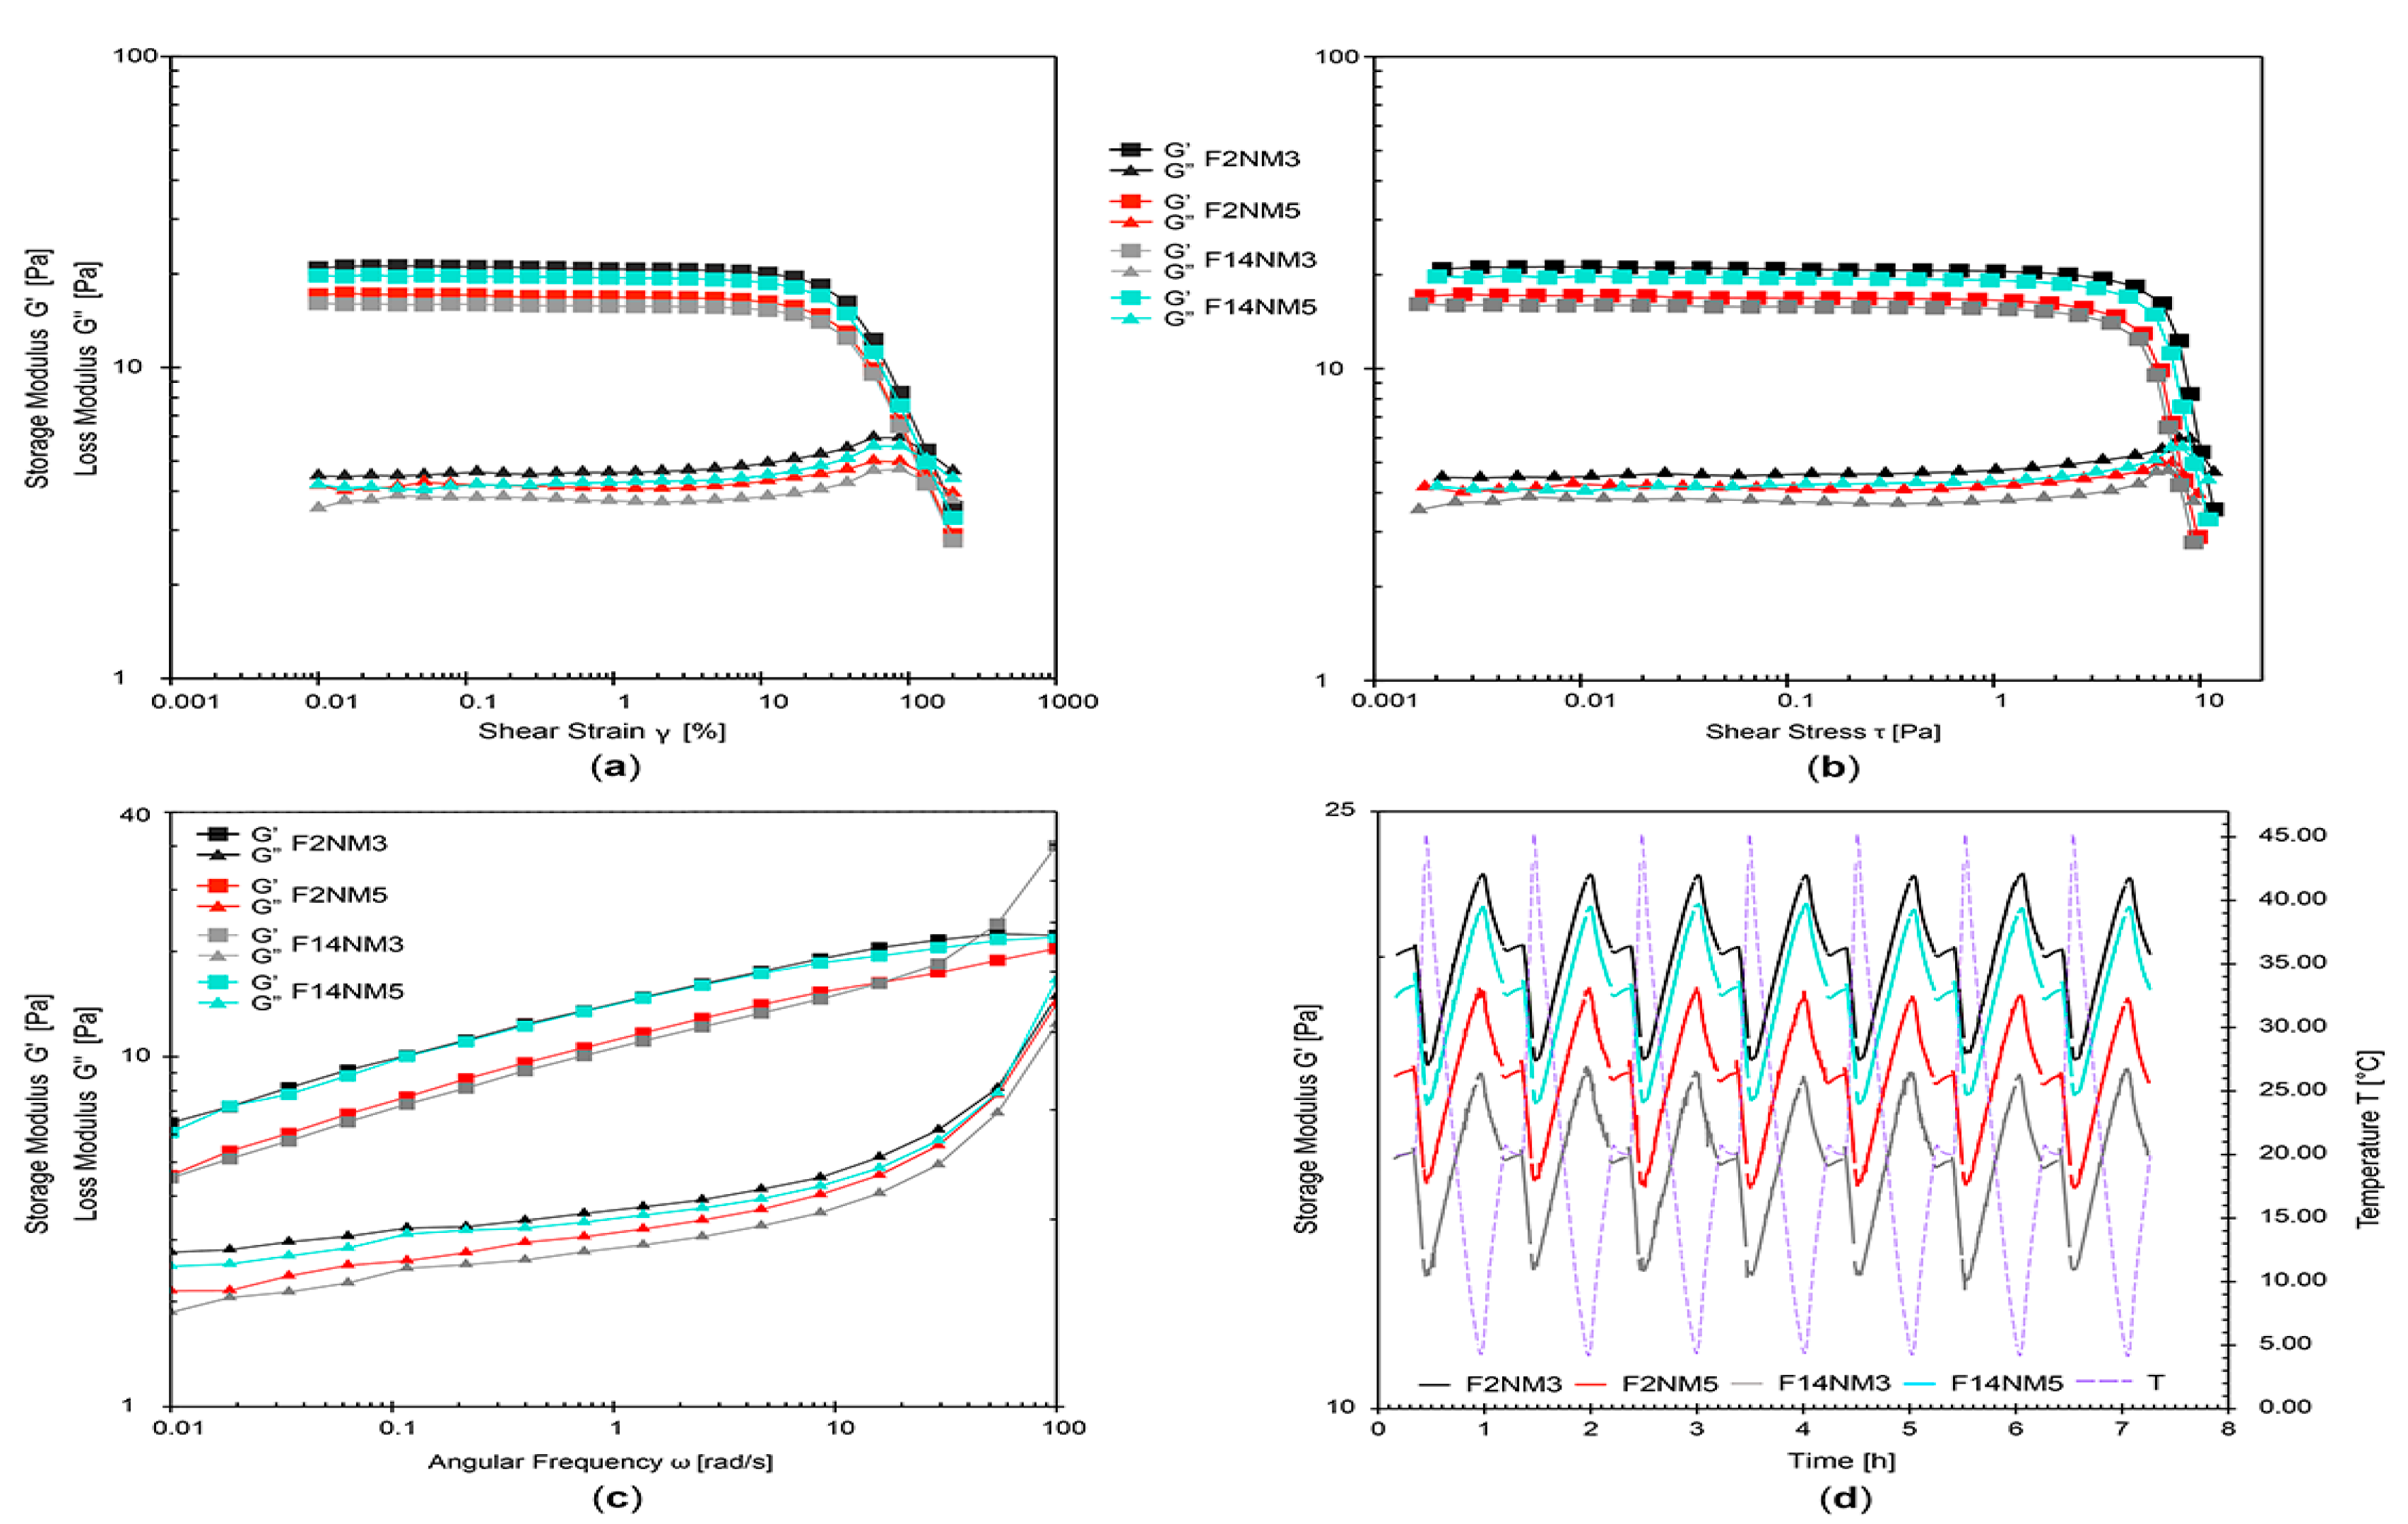
−1. The parameters gained from the amplitude sweeps were yield point (yield stress), determined as the shear stress at the upper limit of LVER where non-destructive, reversible, and elastic deformations exist; flow point, determined as the shear stress where G′ = G”, i.e., above which the internal structure sufficiently breaks down and the system flows (G” > G′); storage (elastic) modulus G′; loss (viscous) modulus G”; and loss factor (tan δ = G”/G′). From the frequency sweeps, the G′ value at ω = 0.01 rad s−1 was acquired as a parameter useful for assessing emulsion behavior at rest.

2.5. Stability Study by Dynamical–Mechanical Thermoanalysis (DMTA)

The DMTA test, recently explored as a rapid, rheology-based alternative to the conventional freeze–thaw test, was applied to monitor the change in maximal G′ value during each successive temperature oscillation cycle (G′max, n, n = 1–6) relative to the initial G′ value obtained before temperature oscillation (G′max, t0) [27,28]. The test was performed using an air-bearing rheometer (MCR 302) in the LVER at deformation γL for respective model formulations, while ω was fixed at 10 rad s−1. The test started by setting the sample temperature to 20 °C, and once the thermal equilibrium was reached, G′ was measured and G′max, t0 was determined. Afterward, the temperature was increased and then cycled from the selected high temperature (45 °C) through the chosen low temperature (4 °C) and then back to room temperature (20 °C), constituting a single freeze–thaw cycle (20 °C to 45 °C/45 °C to 4 °C/4 °C to 20 °C). At each cycle, G′ measurements were taken, and the subsequent G′max analysis at thermal equilibrium (20 °C) was conducted, allowing for the calculation of the delta (Δ) value (Δn = G′max, n/G′max, t0, n = 1–6), which serves as an indicator of the structural change in the tested emulsion formulation. Afterward, an absolute value of delta difference was calculated (Δdif = |Δn − Δt0|, n = 1–6) [28]. Temperature oscillations were programmed only once and repeated six times using an internal loop in the RheoCompass® software v130. 1227 [27,28].

2.6. pH Value and Electrical Conductivity Measurements

The pH value and electrical conductivity of all emulsion samples were determined by direct immersion of the pH meter glass electrode (Eutech pH 700; Eutech Instruments Pte Ltd., Gul Circle, Singapore) and conductivity meter electrode (Eutech CON 700; Eutech Instruments Pte Ltd., Gul Circle, Singapore), respectively, into the investigated samples. The measurements were performed in triplicate at 20 °C before and after conducting the DMTA test for stability assessment purposes.

2.7. Texture Analysis

The prepared emulsions were analyzed with the EZ-LX Texture analyzer (Shimadzu, Kyoto, Japan). The immersion/deimmersion test (2-cycle compression analysis) was carried out with two different measuring tools: a cylindrical acrylic press jig and a conical acrylic press jig. The test speed was set to 1 mm/s and the immersion distance to 30 mm. All measurements were performed in triplicate at a constant temperature of 20 ± 2 °C. The built-in Trapezium-X Single software v1.5.2 was used for data analysis.

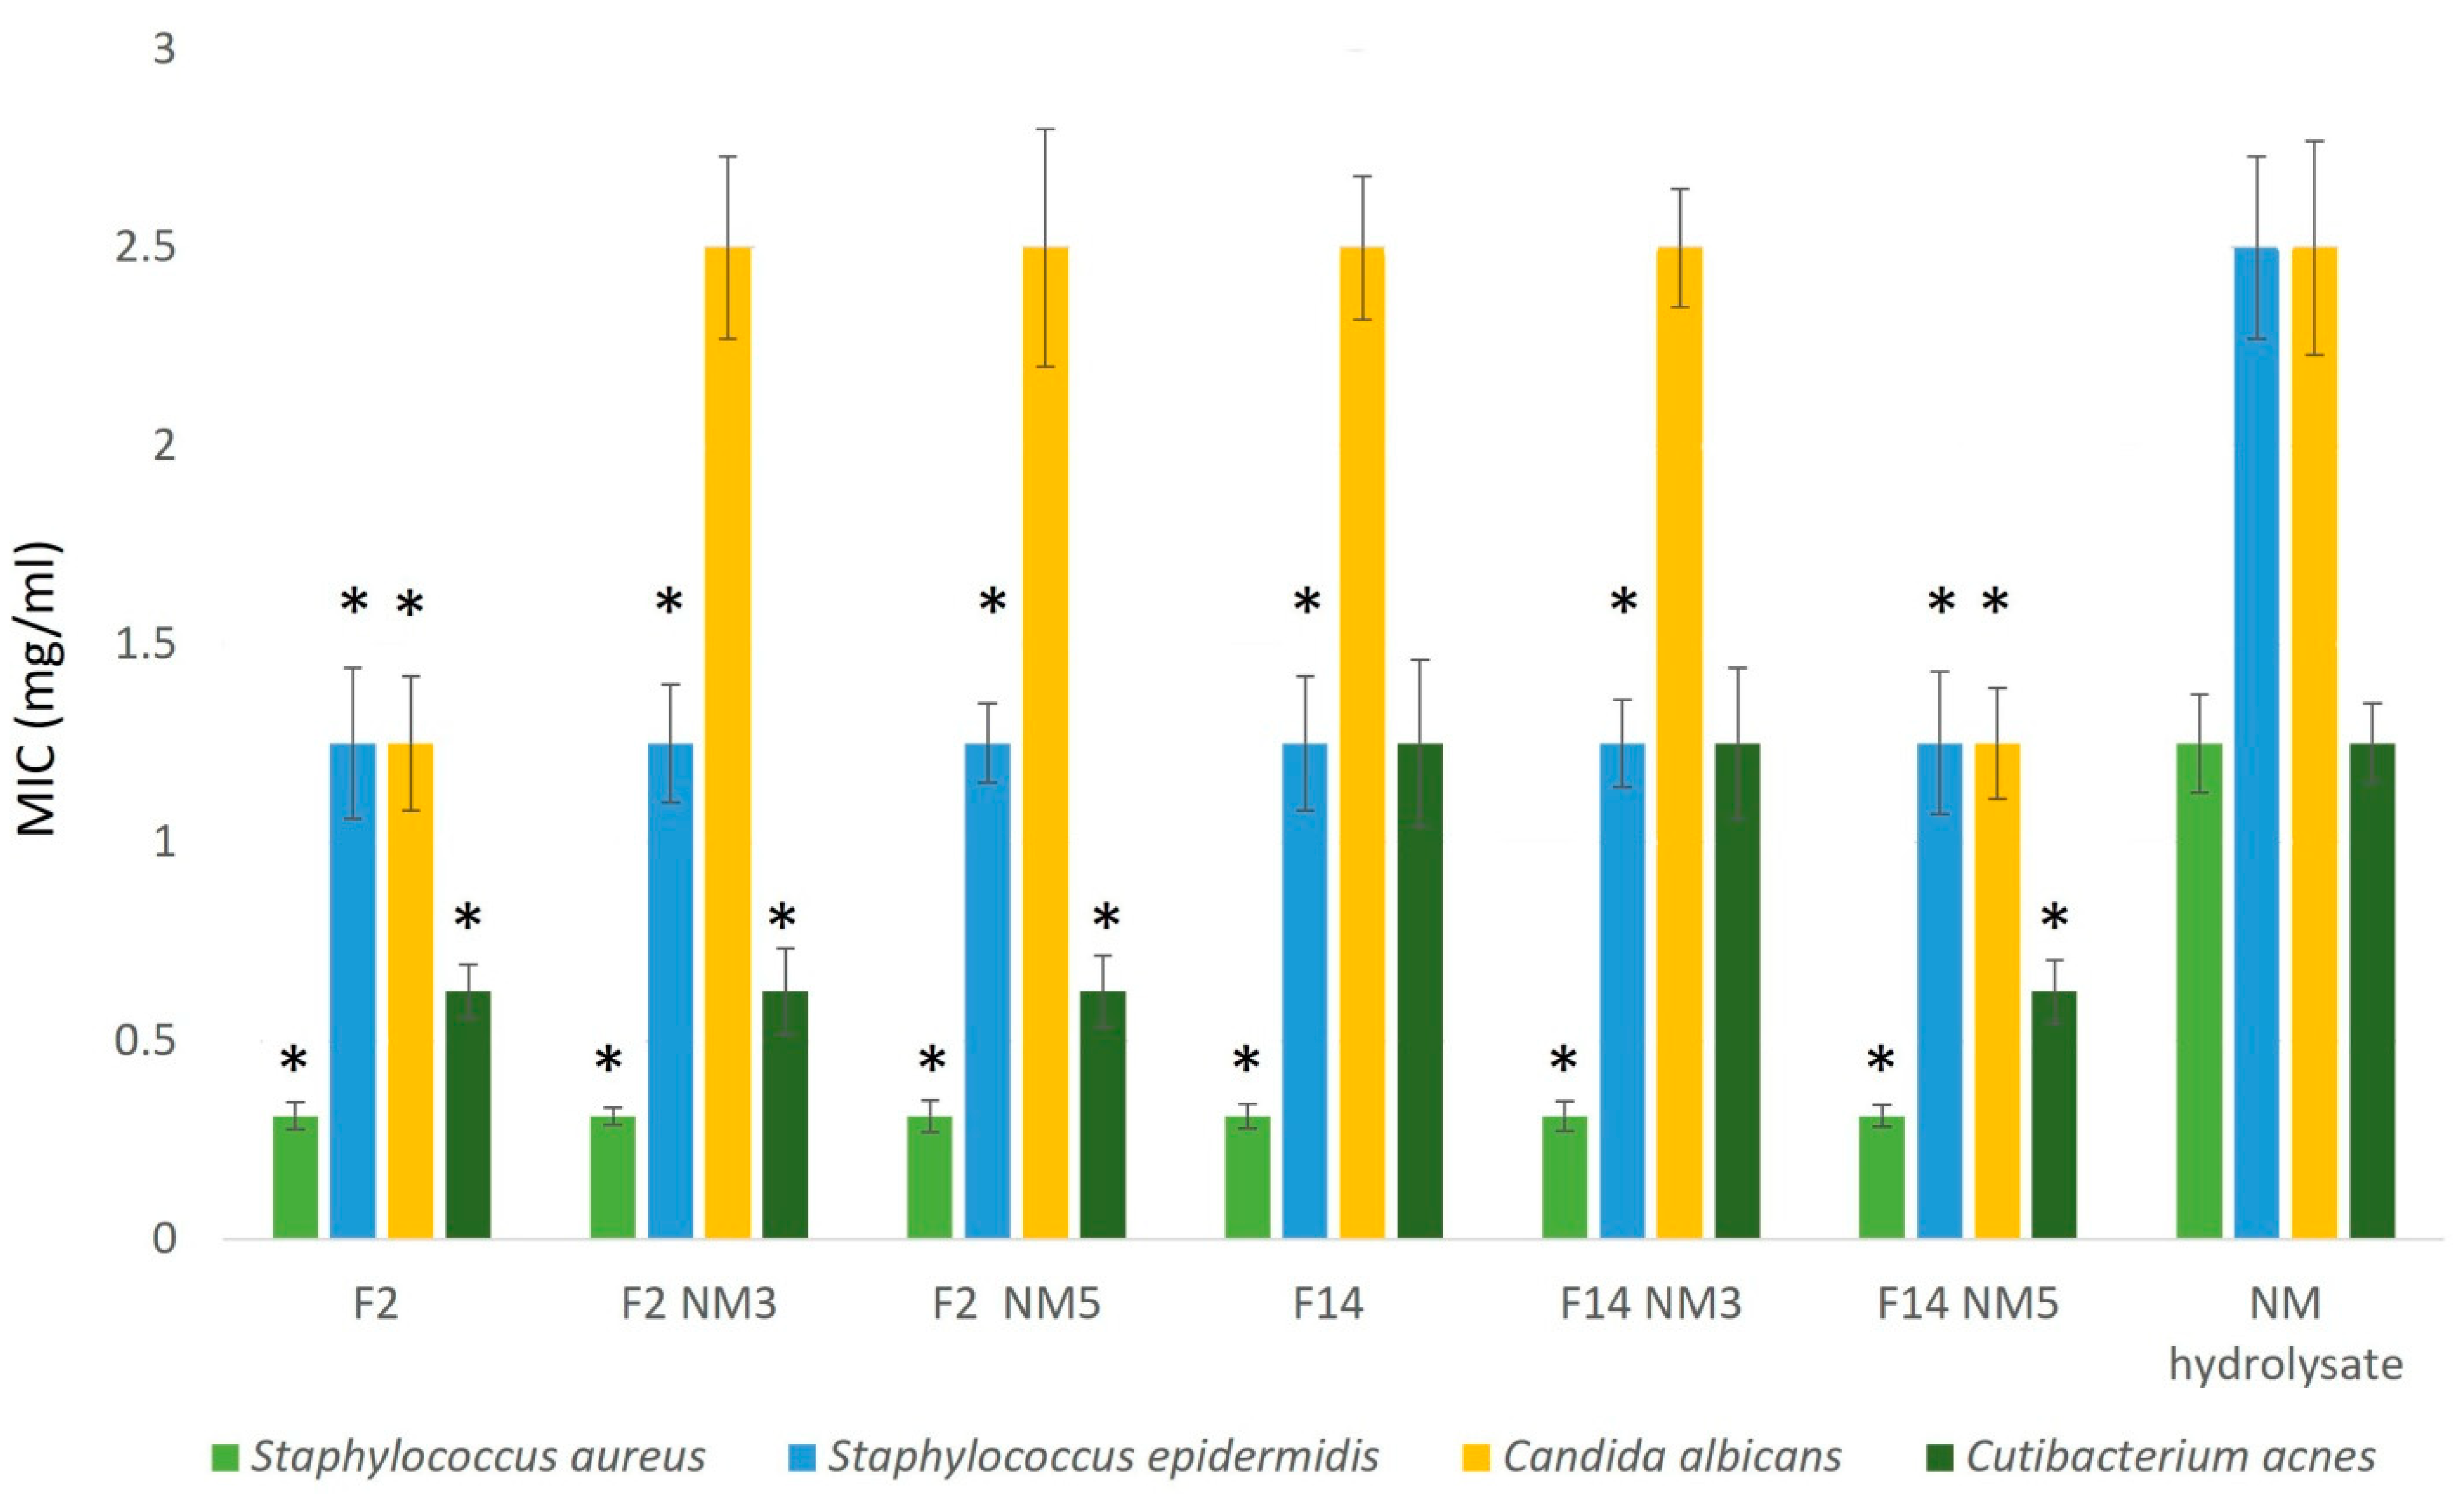
2.8. Antimicrobial Activity Determination

The antimicrobial activity of blank formulations (F2, F14), “active” emulsions containing different emollients and different concentrations of the milk protein hydrolysate (F2NM3, F2NM5, F14NM3, F14NM5) and pure NM hydrolysate, were tested against four ATCC laboratory control strains of microorganisms (KWIK-STIK®, Microbiologics, St Cloud, MN, USA): three Gram-positive bacteria, Staphylococcus aureus subsp. Aureus Rosenbach ATCC 6538, Staphylococcus epidermidis ATCC 12228, and Cutibacterium acnes ATCC 29399, and a yeast, Candida albicans ATCC 24433. The lyophilized microorganism pellet was hydrated before experiments; staphylococci were inoculated on Triptic Soy Agar/Broth (TSA/TSB, Oxoid Ltd., Basingstoke, Hampshire, UK) and Mueller–Hinton broth (MHB, Oxoid), C. acnes on blood agar (anaerobic agar +5% defibrinated horse blood) and thioglycollate broth (TG, Merck-Millipore, Darmstadt, Germany), and C. albicans on Sabouraud dextrose agar/broth (SDA/SDB, Oxoid). Staphylococci and C. albicans were cultured under aerobic conditions at 35 ± 1 °C for 24–48 h, and C. acnes were cultured under anaerobic conditions (GasPack® systems, Becton, Dickinson and Company, Sparks, MD, USA) at 35–37 °C for 48–72 h. The suspension of microorganisms used as inoculum was prepared from fresh cultures in a saline solution with a density of 0.5 per McFarland standard (Bio-Merieux, Craponne, France).
Minimum inhibitory concentrations (MICs) were determined by a broth microdilution assay in 96-well flat-bottomed microtiter plates according to the European Committee on Antimicrobial Susceptibility Testing guidelines (EUCAST 2020, 2023). Samples F2, F14, F2NM3, F2NM5, F14NM3, F14NM5, and the NM hydrolysate were prepared in fresh MHB, TG, or SDB at concentrations of 0.08–10 mg/mL; each concentration was prepared in duplicate and inoculated with 5 × 10⁵ CFU/mL microorganisms. To detect cell growth and metabolism, the broths were spiked with the redox indicator resazurin (7-hydroxy-3H-phenoxazin-3-one 10-oxide) (Sigma-Aldrich, Saint Louis, MO, USA), a blue non-fluorescent dye that is reduced to the pink metabolite resorufin (7-hydroxy-3H-phenoxazin-3-one) when the microorganisms are viable. The MIC of the samples was determined to be the lowest concentration that inhibited the growth of the microorganisms after incubation at 35 °C for 20 to 48 h under aerobic/anaerobic conditions (depending on the bacterial species). Positive controls (microorganisms in the medium) and negative controls (medium with samples only) were included in the experiments. Each test was repeated three times (The European Committee on Antimicrobial Susceptibility Testing; breakpoint tables for interpretation of MICs and zone diameters. Version V.13.1; http://www.eucast.org accessed on 1 June 2023).

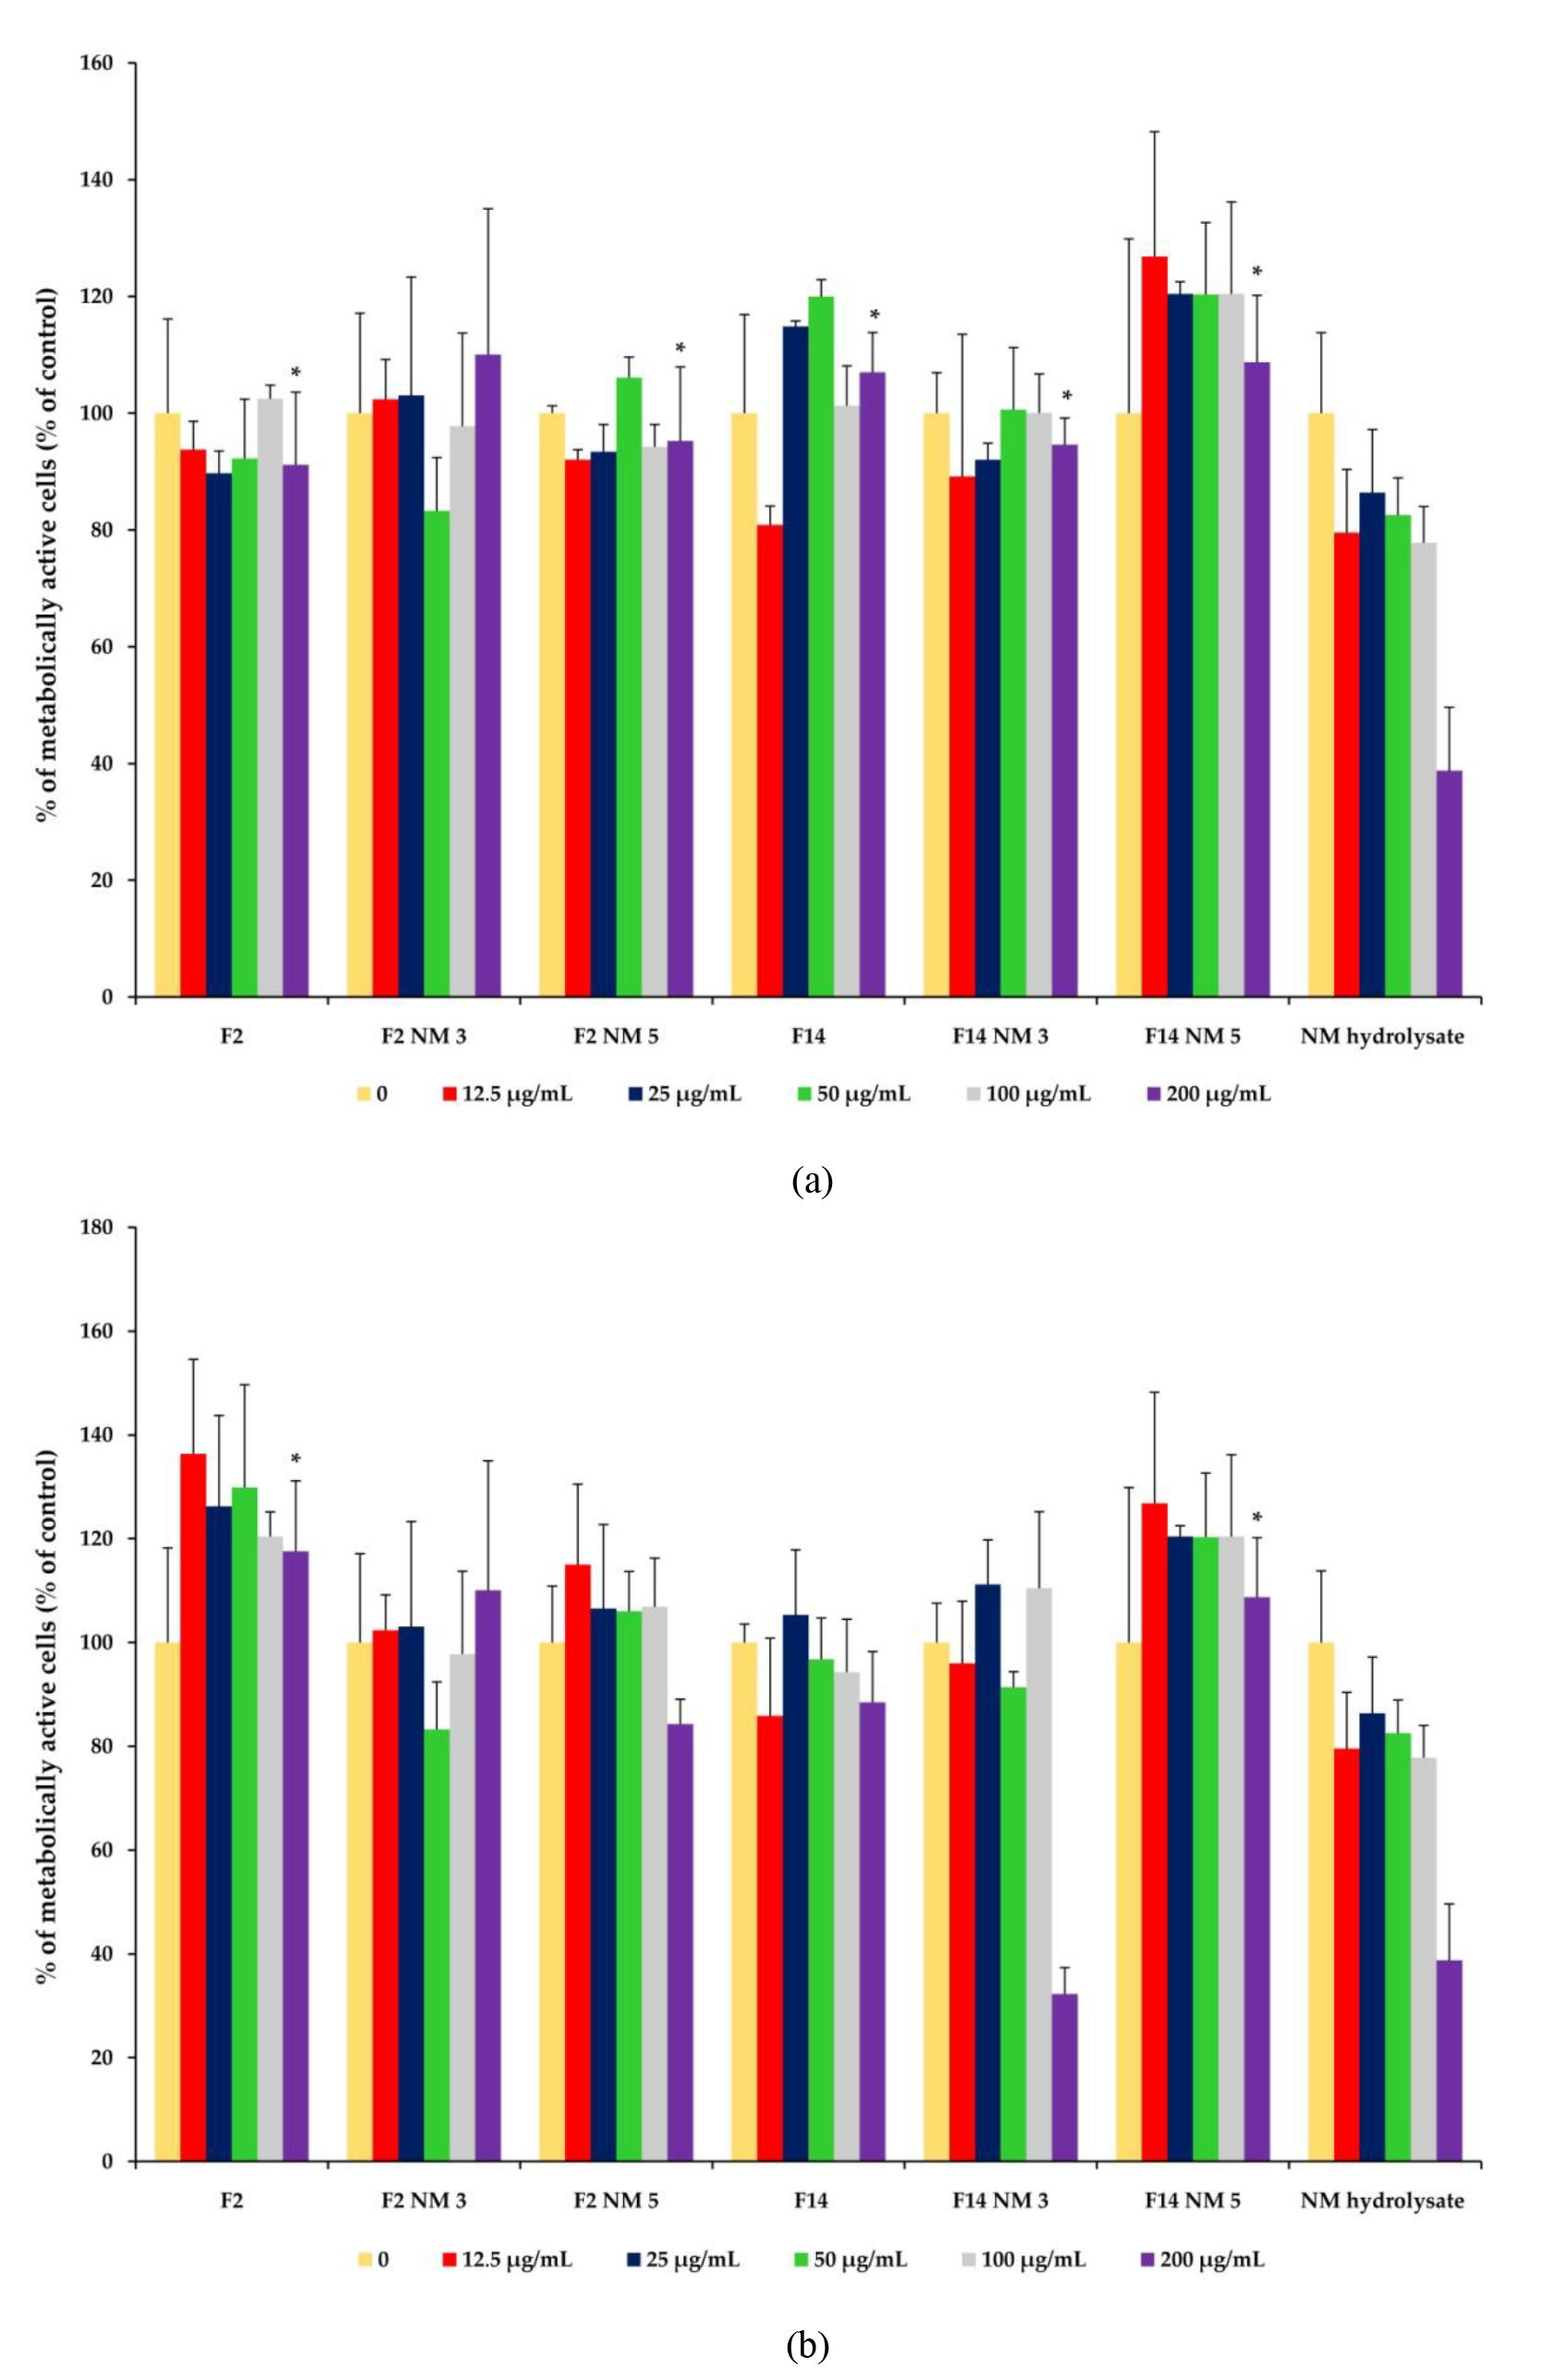
2.9. Cytotoxicity MTT Assay

2.9.1. Preparation of Stock Solutions

Stock solutions of samples (F2, F14, F2NM3, F2NM5, F14NM3, F14NM5, and the NM hydrolysate) were prepared in dimethyl sulfoxide (DMSO) at the concentration of 600 µg/mL. All samples were diluted to the appropriate working concentrations for use in the culture medium. For all cells used, the culture medium was RPMI 1640 (Sigma Aldrich, Saint Louis, MO, USA), supplemented to final concentration with L-glutamine (3 mM), streptomycin (100 mg/mL), penicillin (100 IU/mL), and fetal bovine serum (10%; FBS; 56 °C heat-inactivated due to inactivation of cholinesterases and system complement and HEPES (25 mM)), and adjusted to pH 7.2 (bicarbonate solution). For cell survival determination, 3-(4,5-dimethylthiazol-2-yl)-2,5-diphenyltetrazolium bromide—MTT (Sigma Aldrich, Saint Louis, MO, USA) was dissolved in phosphate-buffered saline (PBS).

2.9.2. Cell Lines

The cell lines of human lung fibroblast (MRC-5) and human keratinocytes (HaCaT) were maintained in complete nutrient medium RPMI-1640 at 37 °C in a humidified atmosphere with 5% CO2. All cell lines were obtained from the American Type Culture Collection (Manassas, VA, USA).

2.9.3. Cell Sensitivity Analysis

MRC-5 (5 × 10³ cells/100 µL per well) and HaCaT (7 × 10³ cells/100 µL per well) cells were seeded in 96-well microtiter plates and 20 h later, after cell attachment, five different concentrations of test compounds were added to the wells. The final test compound concentrations ranged from 12.5 μg/mL to 200 μg/mL. Only the culture medium was added to the cells in the control wells.
All experiments were performed in triplicate. The nutrient medium with the corresponding concentrations of the test substances but without cells was used as a blank.

2.9.4. Determination of Target-Cell Survival

Cell survival was determined using the 3-(4,5-dimethyl-2-thiazolyl)-2,5-diphenyl-2H-tetrazolium bromide, MTT (purity ˃ 98%, Sigma Aldrich, Saint Louis, MO, USA) assay according to the method of Mosmann [29] and van Meerloo [30] 48 h after addition of the compounds. Briefly, 20 µL of the MTT solution (5 mg/mL in phosphate-buffered saline, PBS) was added to each well. Samples were incubated for an additional 4 h at 37 °C, 5% CO2 in a humidified atmosphere. Then, 100 µL of 10% sodium dodecyl sulfate, SDS (quality level 100, Sigma Aldrich, Saint Louis, MO, USA), was added to each of the wells, and the absorbance of the cell medium from each well was measured at 490 nm the next day. The measurements were performed using a Multiskan® FC Microplate Photometer (Thermo Scientific, Waltham, MA, USA).
To calculate the cell survival rate (%), the absorbance at 490 nm of each sample containing cells grown in the presence of the test compounds was divided by the absorbance of the control sample (the absorbance of cells grown in the culture medium only) after subtracting the absorbance of the blank sample. IC50 was determined from the graph as the concentration of the compound that reduced the survival of treated cells by 50%. The IC50 values for each compound were determined by numerical analysis of the data obtained.

2.10. Statistical Analysis

The effect of formulation composition, i.e., the presence of two different types of milk proteins at two different concentrations and two types of emollients on the critical rheological properties of the developed model emulsions was investigated using a model fitting/regression procedure created with the Design–Expert® software platform (version 11.1.0; Stat-Ease Inc., Minneapolis, MN, USA). The main effects and the interaction effects of the studied formulation variables on the apparent viscosity, hysteresis area, yield point, storage modulus, loss factor, and structural change in the emulsions as response variables were statistically evaluated by backward analysis using analysis of variance (one-way ANOVA).
In addition, the statistical differences between the electrical conductivity values and pH values of the emulsions measured before and after performing the DMTA test (two matched groups) were determined with a paired samples t-test using IBM SPSS® Statistics software (version 26.0; IBM, New York, NY, USA). The significance level was set at p < 0.05 with a 95% confidence interval.

3. Results

3.1. Antioxidant Assay

It is well-known that the radical system used to evaluate antioxidants can affect the experimental results, so two or more radical systems are required to investigate the radical scavenging properties of a selected antioxidant [31]. The determination of total peptide content in commercial hydrolysates by the Lowry method is essential for antioxidant assays. In this case, it was 17.5 mg/mL for the MPC hydrolysate and 234 mg/mL for the NM hydrolysate. It should be noted that the hydrolysates studied were diluted to the same peptide concentration before the tests were carried out.
The DPPH radical scavenging test is the simplest and most widely used method for screening the antioxidant activity of food ingredients. In this test, the oil-soluble stable purple chromogenic radical DPPH is reduced to the corresponding pale-yellow hydrazine by antioxidant/reducing compounds. [18,25,32]. The scavenging activities of the two milk protein hydrolysates increased with increasing peptide concentration, i.e., the peptides in both milk protein hydrolysates were able to scavenge DPPH radicals in a concentration-dependent manner. The IC50 values of the peptide mixtures in the two tested hydrolysates (NM hydrolysate and MPC hydrolysate), defined as the concentration of the samples required to inhibit 50% of the initial DPPH radical activity, were 3.64 ± 0.18 mg/mL and 7.98 ± 0.4 mg/mL, respectively (Figure 1). The peptides in the NM hydrolysate showed higher DPPH radical scavenging activity than the peptides in the MPC hydrolysate.
The ABTS radical scavenging test is based on the interaction between the antioxidant and the ABTS radical cation (ABTS•+), which has a characteristic color with an absorption maximum at 734 nm. The method is rapid and can be applied in a wide pH range [18]. When the sample exhibits antioxidant activity, the blue ABTS radical cation is converted to its colorless form. With increasing concentration, the two milk protein hydrolysates showed increased ABTS radical scavenging activity. The IC50 values of the peptide mixtures in the NM hydrolysate and MPC hydrolysate were 3.11 ± 0.15 mg/mL and 5.45 ± 0.27 mg/mL, respectively (Figure 1). These values indicate that the peptides in the NM hydrolysate have higher ABTS radical scavenging activity than the peptides in the MPC hydrolysate and correlate with the DPPH radical scavenging test results.

3.2. Rheological Analysis

In developing liquid oil-in-water emulsions, the influences of key formulation factors were investigated, namely the type of emollient (EG L15 and EG L19) and the presence of two different types of milk protein hydrolysate in two different concentrations (3% and 5%) on their critical rheological properties. This was analyzed methodically and concomitantly using an experimental design strategy. For each evaluated response (Table 2), the direct effect of each variable (emollient type, type of hydrolyzed milk protein, and concentration) and their interaction effects were statistically studied; a p-value of < 0.05 indicated a significant influence of the factor/interaction on the studied response.
The viscosity and flow curves (Figure 2) obtained from the continuous rotation tests showed that all test emulsions were characterized by shear-thinning flow behavior. The apparent viscosity ranged from 211 to 311 mPa s, and the hysteresis area values ranged from 19.5 to 67.8 Pa s−1 (Table 2). The results from ANOVA showed that the apparent viscosity of the developed emulsions was significantly affected by the concentration of incorporated hydrolyzed milk protein in a positive linear manner, which means that a higher milk protein concentration (5% vs. 3%) could produce emulsions with higher apparent viscosity. An exception was the formulation with EG L19 and the NM hydrolysate, where increasing the concentration of hydrolyzed milk protein from 3% to 5% resulted in a lower apparent viscosity (see F2NM3 vs. F2NM5 emulsion, Table 2).
In terms of hysteresis area as a measure of thixotropy, data analysis showed that both the concentration and type of milk protein hydrolysates and their interaction had notable effects, with the type of milk protein having the greatest influence. As shown in Table 2, the emulsion formulations prepared with the NM hydrolysate had a larger hysteresis area than the emulsions loaded with the MPC hydrolysate; this was true for the model formulations containing both 3% and 5% of the active ingredient regardless of the emollient type. In addition, increasing the milk protein concentration from 3% to 5% resulted in a higher hysteresis area the with NM hydrolysate in both cases, although the increase was less pronounced for emulsions containing the MPC hydrolysate and, in particular, EG L19 as an emollient (Table 2).
Amplitude sweep tests showed that all test emulsions exhibited the character of viscoelastic solids, i.e., they showed dominant elastic behavior over viscous behavior (G′ > G”, tan δ < 1) (Figure 3a,b), indicating certain physical stability [33]. As Table 2 shows, the G′ values of the developed emulsions generated from amplitude sweeps varied from 12.1 to 20.1 Pa, while the loss factor, calculated as the ratio of viscous and elastic modulus (G”/G′), ranged from 0.23 to 0.31. In addition, all emulsion formulations showed yield points in the range of 1.2 to 2.1 Pa and flow points in the range of 6.4 to 10.2 Pa (Table 2). The data also showed that the yield point, which is an indicator of emulsion structure and stability, was higher when a higher concentration of hydrolyzed milk protein was used (Table 2). The yield point and storage modulus G′ of the developed emulsions were also significantly affected by the concentration of hydrolyzed milk protein. Table 2 shows that the addition of hydrolyzed milk protein at higher concentrations resulted in emulsions with a higher flow point and G′ modulus, except for the formulation containing EG L19 as an emollient. Here, the addition of the NM hydrolysate at a concentration of 5% resulted in a lower flow point and G′ than when 3% was used.
Regarding the loss factor, the statistical analysis showed that the subtle differences between the test emulsions were due to the milk protein concentration, as well as its interaction with the emollient type. Increasing the milk protein concentration from 3% to 5% generally resulted in lower dissipation factor values, although these differences had no real practical significance (Table 2). In addition, for the emulsions loaded with either 3% or 5% MPC hydrolysate or 5% NM hydrolysate, it was found that the loss factor was higher when EG L19 was used instead of EG L15. In contrast, for the emulsion sample loaded with the 3% NH hydrolysate, the loss factor was higher when EG L15 was used (Table 2).
Complementary to yield point, frequency sweep tests were performed to evaluate the stability of emulsions at rest and during long-term storage. The frequency curves of selected model emulsions shown in Figure 3c confirm that the G′ curves outweigh the corresponding G” curves. Moreover, the G′ values of the test emulsions obtained from the frequency sweeps at the lowest angular frequency (ω = 0.01 rad s–1) varied between 3.4 and 6.5 Pa (Table 2), suggesting good structural strength at rest [33] and good long-term physical stability. When analyzing the effects of the investigated formulation factors on the G′ values, only the milk protein concentration proved to be considerable and positive, i.e., increasing the milk protein content from 3% to 5% resulted in higher G′ values of the emulsions (Table 2), regardless of the type of milk protein or the type of emollient in the formulation. An exception was, again, the emulsion prepared with EG L19 and the NM hydrolysate, for which lower G′ values were observed when the concentration of the NM hydrolysate was increased from 3% to 5% (Table 2).

3.3. Stability Study by the DMTA Test

To complement the frequency sweep results and monitor the structural changes of the test emulsions on temperature variations, the DMTA test was performed. This test was recently established as a time-efficient rheological alternative to the conventional freeze–thaw test, aiming to accelerate the stability evaluation of both water-in-oil and oil-in-water emulsions [2,27,28]. The DMTA diagrams of selected emulsions loaded with the NM hydrolysate in Figure 3d show the trend of structural change Δ through successive G′ peaks at 20 °C, where each peak corresponds to the change in G′ during each successive temperature oscillation cycle relative to the G′ value of the first measurement [27,28]. As shown in the DMTA diagram (Figure 3d), the structural change Δ for the representative model emulsions (F2NM3, F2NM5, F14NM3, and F14NM5) was negligible.
Overall, it is important to emphasize that the observed values of the Δ structural change in all the studied model emulsions were rather low and almost constant during the DMTA cycles, supporting their good physical stability. As shown in Table 2, the values of the delta difference (Δ dif) at the end of the DMTA test were in the range of 0.0002–0.0124, which means that the structural change Δ varied from 0.02% to 1.24% from the initial value, depending on the studied emulsion. In addition, the results of ANOVA showed that the Δ dif values (log-transformed data) were not significantly dependent on the individually evaluated formulation factors, but the interaction between milk protein concentration and emollient type showed a significant effect. When comparing the effects of milk protein concentration on the Δ dif values of model emulsions formulated with the emollient EG L15, a more favorable lower Δ dif value (a smaller structural change) was observed when the milk protein concentration was increased from 3% to 5%. In contrast, when EG L19 was used as the emollient, a trend toward a greater increase in Δ dif with increasing milk protein concentration was observed (Table 2). A deviation from this trend was registered when the 3% NM hydrolysate was incorporated into the formulation with EG L15, where greater structural changes were observed compared to the emulsion with EG L19 (Table 2).

3.4. pH Value and Electrical Conductivity Measurements

As shown in Table 3, the pH of all developed model emulsions was in a narrow range of 5.5–6.4, while the electrical conductivity values ranged from 370 to 1840 µS cm−1. The addition of hydrolyzed milk protein had no significant effect on the pH of the corresponding emulsions but contributed significantly (p < 0.05) to a higher electrical conductivity of the emulsions. As far as stability is concerned, when comparing the tested emulsions before and after performing the DMTA test, only minor deviations were observed in the measured parameters (Table 3). As can be seen in Table 3, the pH values of all test emulsions remained almost unchanged. On the other hand, some significant (p < 0.05) changes in electrical conductivity values were observed after performing the DMTA test, namely a decrease in electrical conductivity in the F2MPC3 emulsion and an increase in electrical conductivity in the F2NM3, F2NM5, and F14NM5 model emulsions (Table 3). However, no phase inversion or other destabilization phenomena were observed.

3.5. Texture Analysis

The main texture parameters were evaluated by immersion/deimmersion with two probes of different geometry: a cylinder and a cone. Two probes were used to investigate the importance of geometric effects, i.e., different forces generated during the measurement. Both probes were made of the same material to assume similar surface energies and force magnitudes [34]. A typical response of a semisolid sample, shown in Figure 4a–d, consists of a positive and a negative curve with the following standard parameters: firmness (maximum on the positive curve; the higher the value, the firmer the sample), consistency (area under the positive curve; the higher the value, the ticker the sample), cohesiveness, a parameter that indicates the strength of internal bonds (maximum on the negative curve), and work of the cohesion/index of viscosity (area under the negative curve) [35,36]. When the probe was immersed in the sample, the measured forces were used to calculate the firmness and consistency of the samples; when the probe was withdrawn from the sample, the viscosity index and cohesive force were determined [36].
As can be seen in the graphs obtained with the cylindrical probe (Figure 4a,b), the emulsion with EG L15 and the 3% NM hydrolysate has the lowest firmness. In general, emulsions containing EG L15 have lower strength (better spreadability) than emulsions containing EG L19. In this case, firmness does not correlate with yield point values of emulsions with EG L15, which is unexpected. This discrepancy is due to a combination of EG L15′s inherent properties and the basic mixing principles of rotor-stator devices. The lower intrinsic viscosity (4.5 mPa s) and contact angle value (3.3) of this emollient make it more sensitive to processing parameters, such as mixing time and rotor speed, which affects the total interfacial area. As a result, the breakup of the oil into a droplet population during this turbulent flow can sometimes occur simultaneously and sometimes in sequence, resulting in different rheological parameters [34]. The most cohesive sample (with the best substantivity) is the emulsion with EG L19 and the 3% NM hydrolysate. It is also worth mentioning that the maximum total force (firmness) does not decrease during the second deformation. This means that the original structure of the samples is not destroyed [37].
The conical probe showed a clearer difference between the blank and the “active” emulsions (Figure 4c,d). The lowest firmness was registered with EG L15 and the 3% NM hydrolysate, which correlated with the cylindrical probe. The most cohesive sample was the emulsion containing EG L19 and the 3% NM hydrolysate, which also correlates with the cylindrical probe results. The conical probe provided a smoother appearance of the negative portion of the curve, which is often considered a desirable characteristic in topical formulations [34].

3.6. Antimicrobial Activity

Due to the low peptide content (17.5 mg/mL), we excluded the MPC hydrolysate and its emulsions from this test and performed it only with the NM hydrolysate and its emulsions, including blank emulsion samples. The antimicrobial activity of all peptides was evaluated in vitro using a broth microdilution assay against several laboratory microbial strains. The results of the antibacterial activity of the protein hydrolysate and other test formulations are shown in Figure 5. MIC values ranged from 0.312 to 2.5 mg/mL.
The protein hydrolysate NM (which contains a combination of preservatives—ethylhexylglycerol and fenoxyethanol), the blank emulsions, and the “active” emulsions generally showed low antimicrobial activity against Gram-positive bacteria and one yeast. The formulations showed the best activity against S. aureus and C. acnes, with lower activity against S. epidermidis and C. albicans.
The NM hydrolysate showed low antimicrobial activity, while the selected emulsions showed identical activity against S. aureus and S. epidermidis but differed for C. albicans and C. acnes. In all samples, better activity was observed against the pathogenic microorganism S. aureus compared to S. epidermidis, which is part of the normal human skin microbiota. Formulations F2 (blank with EG L19 as an emollient) and F14 NM5 (with EG L15 and a 5% milk protein hydrolysate) showed better activity against C. albicans (with a twofold lower MIC value compared to other emulsions tested, Figure 5), while formulations F2, F2NM3 (with EG L19 and a 3% milk protein hydrolysate), F2NM5 (with EG L19 and a 5% milk protein hydrolysate), and F14NM5 (with EG L15 and a 5% milk protein hydrolysate) showed better activity against C. acnes (with a twofold lower MIC value compared to other tested emulsions, Figure 5).
It can be seen that antimicrobial activity does not change in the presence of a protein hydrolysate or its increased concentration, except in the case of F14NM5 against C. albicans and C. acnes, where the MIC is lower compared to the blank emulsion and the active emulsion with a 3% hydrolysate. It can be concluded that the antimicrobial activity is a result of the effect of preservatives in the hydrolysate and the tested emulsions.

3.7. Cytotoxic MTT Assay

The MTT cytotoxicity test is a standard protocol for screening formulations. The presence of an irritant results in a corresponding decrease in mitochondrial activity, which is detected by the colorimetric assay. Tetrazolium salts are reduced only by metabolically active cells; thus, the yellow tetrazolium salt MTT can be reduced to a blue-colored formazan dye by various dehydrogenase enzymes present in viable, metabolically active cells. The threshold for relative cell viability is 50%. More specifically, quantitative cell viability is determined as a percentage of the negative control and is used to predict irritation potential—if the mean cell viability is less than or equal to 50%, a product can be defined as locally irritating [38].
To evaluate the safety of the milk protein NM hydrolysate, blank formulations (F2 and F14) and “active” emulsions containing 3% and 5% milk protein hydrolysate (F2NM3, F2NM5, F14NM3, F14NM5), cell viability was studied in vitro using two cell lines (human keratinocytes and normal human lung fibroblasts). These cells were treated with different sample concentrations (0–200 µg/mL).
None of the tested samples showed a significant antiproliferative effect on the selected cell lines; the highest concentration tested (200 μg/mL) did not reach 50% cytotoxicity (Table 4).
As shown in Figure 6a,b, the NM hydrolysate showed some degree of cytotoxicity below the concentration of 200 µg/mL. Blank emulsion F14 with EG L15 showed a higher increase in cellular viability than blank emulsion F2 with EG L19. Emulsions with EG L15 and a 5% hydrolysate showed the best effect on cell proliferation. In the graphs (Figure 6a,b), it can be seen that the concentration–response relationship was not linear, which is not an uncommon phenomenon in samples that are not pure but consist of a mixture of many components [39]. In general, emulsions containing a 5% protein hydrolysate showed better cell proliferation-stimulating activity than blank and “active” emulsions containing a 3% protein hydrolysate.

4. Discussion

In cosmetics, emulsion systems are the most commonly used formulations. The reasons for the widespread use of low-viscosity O/W emulsions (lotions) in skin care products are their high water content (which means lower cost), their light, non-greasy feel, and their good spreadability on the skin. Emulsions must meet numerous requirements and expectations in terms of stability, safety, efficacy (both actual and perceived), and appropriate aesthetic and sensory properties [34]. Bioactive peptides have attracted considerable attention in the cosmetic industry due to their potential to improve skin health and appearance. These small protein fragments are shown to have biological activities, such as antioxidant, anti-aging, anti-inflammatory, and antimicrobial effects, making them potential active ingredients for cosmetic formulations [40]. The major challenge in the use of bioactive peptides in cosmetic formulations is the maintenance of their physicochemical stability and biological activity during the manufacturing and storage of the product. Therefore, it is necessary to evaluate the quality of a developed cosmetic product using various methods.
Peptides and protein hydrolysates derived from the proteolysis of various dietary sources (including cow milk) are believed to have antioxidant activity. Antioxidant mechanisms include radical scavenging activity (both the ability to donate hydrogen and to suppress free radicals), the inhibition of lipid peroxidation, the chelation of metal ions, or a combination of these properties. Antioxidant activities could protect biological systems from damage associated with oxidative stress [16]. The peptides in both commercial hydrolysates tested in this study showed concentration-dependent antioxidant activity (Figure 1). The differences in the antioxidant ability of the peptides in the two hydrolysates are probably due to different peptide properties (molecular mass and amino acid composition). The difference in the relative radical scavenging ability of the protein hydrolysates with two test radicals could be due in part to the different solubility of these radicals and their ability to diffuse into the reaction medium. DPPH can only be dissolved in organic solvents (especially alcohol) and not in an aqueous solution. Therefore, it poses a significant limitation in determining the potential of hydrophilic antioxidants. The opaqueness caused by the presence of peptides in alcoholic solvents negatively affects the DPPH assay [25]. In addition, the steric accessibility of the DPPH radical is an important factor in the reaction since small molecules that have better access to the radical site have a relatively higher antioxidant capacity. Many large antioxidant compounds that react rapidly with peroxyl radicals may react slowly or even be inert in this assay [18]. In contrast, the ABTS method is more sensitive because ABTS radicals can be dissolved in aqueous and organic media, which allows the measurement of the radical scavenging activity of both hydrophilic and lipophilic compounds [25].
Combining all rheological results, it has been revealed that all developed emulsions exhibited favorable shear-thinning flow behavior (with thixotropy, yield point, and flow point) and viscoelastic character with dominant elastic properties. Importantly, the DMTA tests have shown a very small extent of structural change Δ (0.02%–1.24%). Together with small changes in pH and electrical conductivity, this indicated that all test emulsions had satisfactory stability profiles.
The concentration of hydrolyzed milk protein was found to have a notable effect on the rheological properties (apparent viscosity, hysteresis area, yield point, G′, loss factor) as critical quality characteristics of the developed emulsions (Table 2). In addition, the interactions between the independent formulation factors (concentration and type of hydrolyzed milk protein, type of emollient) were found to considerably affect the hysteresis area, loss factor, and structural change in the developed emulsions (Table 2). However, the addition of hydrolysates to the model emulsions, regardless of their type and concentration, does not adversely affect the rheological properties and stability of the emulsions.
It should be noted that the MPC hydrolysate has a low protein content (17.5 mg/mL) and, according to the manufacturer, contains about 80% glycerin, so it can be assumed that the influence on the rheological properties of emulsions with this active ingredient comes from the glycerin and not from the peptides. A much higher protein content of the NM hydrolysate (234 mg/mL) has caused a larger hysteresis area in comparison to emulsions loaded with the MPC hydrolysate and higher electrical conductivity values of the emulsions. Due to its higher peptide content and potentially better cosmetic effect, the NM hydrolysate is preferred as an active ingredient.
It Is of interest to note that the DMTA test has proven to be a useful method for accelerated stability testing of the developed naturally based emulsions loaded with hydrolyzed milk protein. It was capable of distinguishing the structural changes and thus predicting the stability of different formulations in a much shorter period of time. The DMTA test required about 7 h per formulation, compared to at least 12 days required for the conventional freeze–thaw test.
Texture analysis, a technique widely used in food research, is used to evaluate the mechanical properties of emulsion systems. It is becoming a standard method for the evaluation of emulsion stability, but it is even more useful in the analysis of sensory properties [41]. The success of a product often depends on its sensory properties, of which many are related to its texture [42]. All emulsions developed in this study have exhibited good texture profiles, i.e., satisfactory spreadability and adhesiveness (Figure 4). The presence and concentration of milk protein hydrolysates have had an effect on the emulsions’ sensory properties. This is reflected in an increase in firmness with increasing hydrolysate concentration (with the exception of F14NM3—both the cylindrical and conical probe and F14MPC3—the conical probe) and in the change in adhesiveness compared to blank emulsions. In general, adhesiveness was higher in emulsions with the NM hydrolysate and lower in emulsions with the MPC hydrolysate compared to the blank emulsions. It is possible that the effect is due to the presence of peptides since emulsions with the NM hydrolysate have a higher peptide content.
Cow milk is a rich source of antimicrobial peptides released during the hydrolysis of milk proteins. The antimicrobial activity of the peptides depends on the cations bound (peptides rich in arginine, lysine, and histidine) and the composition of hydrophobic amino acids. Cationic peptides interact electrostatically with the negatively charged surfaces of bacterial cell membranes, leading to their destabilization. Highly hydrophobic peptides can also easily penetrate the lipid bilayer of cell membranes [43]. According to Najafian and Babji [44], antimicrobial peptides usually have less than 50 amino acids, of which almost 50% are hydrophobic and have a molecular weight below 10 kDa. Commercial protein hydrolysates investigated in this study showed relatively low antimicrobial activity against several selected laboratory microorganisms (Figure 5). It is worth noting that the NM hydrolysate is preserved with ethylhexylglycerol and phenoxyethanol. The antimicrobial activity of the placebo emulsions can also be attributed to the presence of preservatives. Therefore, it is assumed that the concentration of antimicrobial peptides present in protein hydrolysates was quite low.
The results of the cytotoxicity assay have shown that milk protein hydrolysates have no cytotoxic effects on skin cells. In fact, it was shown that those hydrolysates can even promote cell proliferation (Figure 6).

5. Conclusions

Research into bioactive peptides for cosmetic applications has created new opportunities for the development of innovative and effective skin care products. The developed “green” O/W emulsion formulations with the milk protein hydrolysate showed favorable rheological and texture properties, good safety profiles, and in vitro efficacy. They were produced with a naturally derived emulsifier mixture consisting of lauryl glucoside, myristyl glucoside, and polyglyceryl-6 laurate, using a cold emulsification process, which all contributed to their favorable sustainability profile. In particular, the emulsion containing a 5% hydrolysate NM and a biodegradable emollient EG L15 was found to be a promising candidate for further in vivo studies. It showed satisfactory rheological behavior and stability, some antimicrobial activity against C. albicans and C. acnes, and cell proliferation stimulation activity.

Author Contributions

Conceptualization, S.D.S., N.C. and S.T.; methodology, I.P., S.S., J.A.S., D.D.B. and S.S.; validation, N.C.; formal analysis, M.V., M.V.S. and A.T.; investigation, M.V.; resources, S.D.S. and N.C.; writing—original draft preparation, M.V., S.S. and I.P.; writing—review and editing, S.D.S., N.C. and S.T.; supervision, S.D.S. and S.T. All authors have read and agreed to the published version of the manuscript.

Funding

This research was funded by the Ministry of Education, Science and Technological Development, Republic of Serbia, through a grant agreement with the University of Belgrade, Faculty of Pharmacy, No. 451-03-47/2023-01/200161, and the Faculty of Technology in Leskovac, University of Nis, No. 451-03-47/2023-01/200133.

Institutional Review Board Statement

Not applicable.

Informed Consent Statement

Not applicable.

Data Availability Statement

Data are contained within the article.

Conflicts of Interest

The authors Sanela Savić and Nebojša Cekić are employed by the company DCP Hemigal, Leskovac, Serbia. The remaining authors declare that the research was conducted in the absence of any commercial or financial relationships that could be construed as a potential conflict of interest.

References

  1. Errante, F.; Ledwoń, P.; Latajka, R.; Rovero, P.; Papini, A.M. Cosmeceutical Peptides in the Framework of Sustainable Wellness Economy. Front. Chem. 2020, 8, 572923. [Google Scholar] [CrossRef] [PubMed]
  2. Savic, S.; Cekic, N.; Savic, R.; Ilic, T.; Savic, S. ‘All-natural’ anti-wrinkle emulsion serum with Acmella oleracea extract: A design of experiments (DoE) formulation approach, rheology and in vivo skin performance/efficacy evaluation. Int. J. Cosmet. Sci. 2021, 43, 530–546. [Google Scholar] [CrossRef] [PubMed]
  3. Abu Samah, N.H.; Heard, C.M. Topically applied KTTKS: A review. Int. J. Cosmet. Sci. 2011, 33, 483–490. [Google Scholar] [CrossRef] [PubMed]
  4. Dini, I.; Mancusi, A. Food Peptides for the Nutricosmetic Industry. Antioxidants 2023, 12, 788. [Google Scholar] [CrossRef] [PubMed]
  5. Ferreira, M.S.; Magalhães, M.C.; Sousa-Lobo, J.M.; Almeida, I.F. Trending Anti-Aging Peptides. Cosmetics 2020, 7, 91. [Google Scholar] [CrossRef]
  6. Campos, P.M.B.G.M.; Melo, M.O.; César, F.C.S. Topical application and oral supplementation of peptides in the improvement of skin viscoelasticity and density. J. Cosmet. Dermatol. 2019, 18, 1693–1699. [Google Scholar] [CrossRef]
  7. Aguilar-Toalá, J.E.; Hernández-Mendoza, A.; González-Córdova, A.F.; Vallejo-Cordoba, B.; Liceaga, A.M. Potential role of natural bioactive peptides for development of cosmeceutical skin products. Peptides 2019, 122, 170170. [Google Scholar] [CrossRef]
  8. Wu, Y.H.S.; Chen, Y.C. Trends and applications of food protein-origin hydrolysates and bioactive peptides. J. Food Drug Anal. 2022, 30, 172–184. [Google Scholar] [CrossRef]
  9. Korhonen, H.; Pihlanto, A. Bioactive peptides: Production and functionality. Int. Dairy J. 2006, 16, 945–960. [Google Scholar] [CrossRef]
  10. Akbarian, M.; Khani, A.; Eghbalpour, S.; Uversky, V.N. Bioactive Peptides: Synthesis, Sources, Applications, and Proposed Mechanisms of Action. Int. J. Mol. Sci. 2022, 23, 1445. [Google Scholar] [CrossRef]
  11. Day, L.; Cakebread, J.A.; Loveday, S.M. Food proteins from animals and plants: Differences in the nutritional and functional properties. Trends Food Sci. 2022, 119, 428–442. [Google Scholar] [CrossRef]
  12. Soares de Castro, R.J.; Sato, H.H. Biologically active peptides: Processes for their generation, purification and identification and applications as natural additives in the food and pharmaceutical industries. Food Res. Int. 2015, 74, 185–198. [Google Scholar] [CrossRef] [PubMed]
  13. Bhat, Z.F.; Kumar, S.; Bhat, H.F. Bioactive peptides of animal origin: A review. J. Food Sci. Technol. 2015, 52, 5377–5392. [Google Scholar] [CrossRef] [PubMed]
  14. Korhonen, H. Milk-Derived Bioactive Peptides: From Science to Applications. J. Funct. Foods 2009, 1, 177–187. [Google Scholar] [CrossRef]
  15. López-García, G.; Dublan-García, O.; Arizmendi-Cotero, D.; Gómez Oliván, L.M. Antioxidant and Antimicrobial Peptides Derived from Food Proteins. Molecules 2022, 27, 1343. [Google Scholar] [CrossRef]
  16. Kumar, S.; Teotia, U.V.S.; Sanghi, A. Antioxidative property of cow milk caseinates hydrolysed with different proteases. Int. J. Pharm. Pharm. Sci. 2013, 5, 418–422. [Google Scholar]
  17. Zhu, Y.; Lao, F.; Xin Pan, X.; Wu, J. Food Protein-Derived Antioxidant Peptides: Molecular Mechanism, Stability and Bioavailability. Biomolecules 2022, 12, 162. [Google Scholar] [CrossRef]
  18. Boligon, A.A.; Machado, M.M.; Athayde, M.L. Technical Evaluation of Antioxidant Activity. Med. Chem. 2014, 4, 517–522. [Google Scholar] [CrossRef]
  19. Reinholz, M.; Ruzicka, T.; Schauber, J. Cathelicidin LL37: An Antimicrobial Peptide with a Role in Inflammatory Skin Disease. Ann. Dermatol. 2012, 24, 126–135. [Google Scholar] [CrossRef]
  20. Singh, A.; Duche, R.T.; Wandhare, A.G.; Sian, J.K.; Singh, B.P.; Sihag, M.K.; Singh, K.S.; Sangwan, V.; Talan, S.; Panwa, H. Milk-Derived Antimicrobial Peptides: Overview, Applications, and Future Perspectives. Probiotics Antimicrob. Proteins 2023, 15, 44–62. [Google Scholar] [CrossRef]
  21. Jiménez-Rodríguez, A.; Guardado-Félix, D.; Antunes-Ricardo, M. Challenges and Strategies for Topical and Transdermal Delivery of Bioactive Peptides. Crit. Rev. Ther. Drug Carr. Syst. 2022, 39, 1–31. [Google Scholar] [CrossRef] [PubMed]
  22. Lowry, O.H.; Rosebrough, N.J.; Farr, A.L.; Randall, R.J. Protein measurement with the Folin phenol reagent. J. Biol. Chem. 1951, 193, 265–275. [Google Scholar] [CrossRef] [PubMed]
  23. Li, X.; Wu, X.; Huang, L. Correlation between Antioxidant Activities and Phenolic Contents of Radix Angelicae Sinensis (Danggui). Molecules 2009, 14, 5349–5361. [Google Scholar] [CrossRef] [PubMed]
  24. Re, R.; Pellegrini, N.; Proteggente, A.; Pannala, A.; Yang, M.; Rice-Evans, C. Antioxidant activity applying an improved ABTS radical cation decolorization assay. Free Radic. Biol. Med. 1999, 26, 1231–1237. [Google Scholar] [CrossRef] [PubMed]
  25. Aloğlu, H.Ş.; Oner, Z. Determination of antioxidant activity of bioactive peptide fractions obtained from yogurt. J. Dairy Sci. 2011, 94, 5305–5314. [Google Scholar] [CrossRef] [PubMed]
  26. Mezger, T. The Rheology Handbook: For Users of Rotational and Oscillatory Rheometers, 5th ed.; Vincentz Network GmbH & Co. KG: Hanover, Germany, 2020. [Google Scholar]
  27. Cekic, N.; Savic, S.; Savic, S. Dynamic-mechanical thermoanalysis test: A rapid alternative for accelerated freeze-thaw stability evaluation of W/O emulsions. Drug Dev. Ind. Pharm. 2019, 45, 1896–1906. [Google Scholar] [CrossRef]
  28. Cekic, N.; Savic, S.; Savic, S. Dynamic-mechanical thermoanalysis test as a high-performance alternative for accelerated freeze-thaw stability testing: A case study of O/W emulsions. Drug Dev. Ind. Pharm. 2020, 46, 505–520. [Google Scholar] [CrossRef]
  29. Mosmann, T. Rapid colorimetric assay for cellular growth and survival: Application to proliferation and cytotoxicity assays. J. Immunol. Methods 1983, 65, 55–63. [Google Scholar] [CrossRef]
  30. van Meerloo, J.; Kaspers, G.J.L.; Cloos, J. Cell sensitivity assays: The MTT assay. Methods Mol Biol. 2011, 731, 237–245. [Google Scholar] [CrossRef]
  31. Yu, L.; Haley, S.; Perret, J.; Harris, M.; Wilson, J.; Qian, M. Free radical scavenging properties of wheat extracts. J. Agric. Food Chem. 2002, 50, 1619–1624. [Google Scholar] [CrossRef]
  32. Ajibola, C.F.; Fashakin, J.B.; Fagbemi, T.N.; Aluko, R.R. Effect of peptide size on antioxidant properties of African yam bean seed (Sphenostylis stenocarpa) protein hydrolysate fractions. Int. J. Mol. Sci. 2011, 12, 6685–6702. [Google Scholar] [CrossRef] [PubMed]
  33. Mezger, T. Applied Rheology: With Joe Flow on Rheology Road, 5th ed.; Anton Paar GmbH: Graz, Austria, 2018. [Google Scholar]
  34. Vukasinovic, M.; Savic, S.; Cekic, N.; Ilic, T.; Pantelic, I.; Savic, S.D. Efficient Development of Green Emulsifier/Emollient-Based Emulsion Vehicles: From RSM Optimal Experimental Design to Abridged In Vivo Assessment. Pharmaceutics 2023, 15, 486. [Google Scholar] [CrossRef] [PubMed]
  35. Tamburic, S.; Stevic, C.M.; Sisson, H. Rheological and texture analysis methods for the assessment of viscoelasticity. SOFW J. 2018, 144, 20–25. [Google Scholar]
  36. Greenaway, R.E. Psychorheology of Skin Cream. Ph.D. Thesis, University of Nottingham, Nottingham, UK, 2010. [Google Scholar]
  37. Tai, A.; Bianchini, R.; Jachowicz, J. Texture analysis of cosmetic/pharmaceutical raw materials and formulations. Int. J. Cosmet. Sci. 2014, 36, 291–304. [Google Scholar] [CrossRef]
  38. Tasic-Kostov, M.; Vesic, S.; Savic, S. Objective skin performance evaluation: How mild are APGs to the skin? In Alkyl Polyglucosides, from Natural Origin Surfactants to Prospective Delivery Systems; Pantelic, I., Ed.; Woodhead Publishing-Elsevier: Cambridge, UK, 2014; pp. 135–161. [Google Scholar] [CrossRef]
  39. Augustyniak, A.; Gottardi, D.; Giordani, B.; Gaffey, J.; McMahon, H. Dairy Bioactives and Functional Ingredients with Skin Health Benefits. J. Funct. Foods 2023, 104, 105528. [Google Scholar] [CrossRef]
  40. Ngoc, L.T.N.; Moon, J.-Y.; Lee, Y.-C. Insights into Bioactive Peptides in Cosmetics. Cosmetics 2023, 10, 111. [Google Scholar] [CrossRef]
  41. Lukic, M.; Jaksic, I.; Krstonosic, V.; Cekic, N.; Savic, S. A combined approach in characterization of an effective w/o hand cream: The influence of emollient on textural, sensorial and in vivo skin performance. Int. J. Cosmet. Sci. 2012, 34, 140–149. [Google Scholar] [CrossRef]
  42. McMullen, R.L.; Gorcea, M.; Chen, S. Emulsions and their characterization by texture profile analysis. In Handbook of Formulating Dermal Applications: A Definitive Practical Guide; Dayan, N., Ed.; John Wiley & Sons, Inc.: Hoboken, NJ, USA, 2017; pp. 131–154. [Google Scholar]
  43. Bielecka, M.; Cichosz, G.; Czeczot, H. Antioxidant, antimicrobial and anticarcinogenic activities of bovine milk proteins and their hydrolysates—A review. Int. Dairy J. 2022, 127, 105208. [Google Scholar] [CrossRef]
  44. Najafian, L.; Babji, A.S. A review of fish-derived antioxidant and antimicrobial peptides: Their production, assessment, and applications. Peptides 2012, 33, 178–185. [Google Scholar] [CrossRef]
Figure 1. IC50 values of the antioxidant DPPH and ABTS activities for the NM hydrolysate and MPC hydrolysate.
Cosmetics 10 00162 g001
Figure 2. Rheological properties of the test emulsions obtained by continuous rotational tests: flow curves (a) and viscosity curves (b) for selected model formulations (F2NM3, F2NM5, F14NM3, and F14NM5).
Cosmetics 10 00162 g002
Figure 3. Rheological properties of the test emulsions obtained by the oscillatory tests: amplitude sweep (a), shear stress sweep (b), frequency sweep (c), and DMTA test (d) for selected model formulations (F2NM3, F2NM5, F14NM3, and F14NM5).
Cosmetics 10 00162 g003
Figure 4. Texture profiles of blank and “active” emulsions obtained with a cylindrical measuring probe, containing EG L19 (a) and EG L15 (b), and a conical measuring probe, containing EG L19 (c) and EG L15 (d).
Cosmetics 10 00162 g004
Figure 5. Minimum inhibitory concentration (MIC) of the selected samples in mg/mL for different test microorganisms. * p < 0.05, compared to the NM hydrolysate.
Cosmetics 10 00162 g005
Figure 6. Effect of different concentrations of samples on the metabolic activity of MRC5 cells (a) and HaCaT cells (b) in vitro. * p < 0.05 versus a 200 µg/mL NM hydrolysate (one-way ANOVA).
Cosmetics 10 00162 g006
Table 1. Composition of the blank and “active” O/W emulsions.
Ingredients (% w/w)Formulation Code
F2F14F2MPC3F2MPC5F14MPC3F14MPC5F2NM3F2NM5F14NM3F14NM5
EG L1930.0 30.030.0 30.030.0
EG L15 30.0 30.030.0 30.030.0
FFE2.02.02.02.02.02.02.02.02.02.0
PRESERVATIVE1.01.01.01.01.01.01.01.01.01.0
XANTHAN GUM0.350.350.350.350.350.350.350.350.350.35
GLYCERIN3.03.03.03.03.03.03.03.03.03.0
MPC HYDROLYSATE 3.05.03.05.0
NM HYDROLYSATE 3.05.03.05.0
AQUA63.6563.6560.6558.6560.6558.6560.6558.6560.6558.65
Table 2. Rheological parameters of the test emulsions derived from the continuous rotational and oscillatory tests.
Formulation
Code
Parameter (Mean ± Standard Deviation)
Apparent Viscosity (mPa s)Hysteresis Area (Pa s−1)Yield Stress (Pa)Flow Point (Pa)Storage Modulus G′ (Pa)Loss FactorStorage Modulus G′ (Pa) at ω = 0.01 Rad s−1Delta Difference (Absolute Value)
F2211.92 ± 1.9119.64 ± 0.281.26 ± 0.266.58 ± 0.2312.10 ± 0.350.306 ± 0.0093.44 ± 0.440.0003 ± 0.0002
F14247.85 ± 0.9528.61 ± 0.211.74 ± 0.148.54 ± 0.1516.90 ± 0.130.246 ± 0.0034.83 ± 0.260.0080 ± 0.0002
F2MPC3263.33 ± 2.2932.15 ± 0.101.73 ± 0.118.67 ± 0.1916.70 ± 0.080.261 ± 0.0034.76 ± 0.330.0063 ± 0.0009
F2MPC5272.77 ± 0.3232.26 ±0.161.84 ± 0.089.31 ± 0.1417.80 ± 0.160.258 ± 0.0025.15 ± 0.430.0055 ± 0.0014
F14MPC3269.80 ± 0.8731.52 ± 0.591.83 ± 0.179.19 ± 0.1517.80 ± 0.150.250 ± 0.0035.24 ± 0.210.0044 ± 0.0010
F14MPC5306.86 ± 0.3537.51 ± 0.672.05 ± 0.2610.12 ± 0.1920.00 ± 0.070.241 ± 0.0096.28 ± 0.610.0005 ± 0.0004
F2NM3311.41 ± 0.5454.80 ± 0.752.07 ± 0.2810.12 ± 0.3320.10 ± 0.080.243 ± 0.0026.48 ± 0.230.0030 ± 0.0013
F2NM5275.64 ± 0.4158.64 ± 0.191.68 ± 0.108.24 ± 0.0916.30 ± 0.040.264 ± 0.0014.58 ± 0.380.0094 ± 0.0010
F14NM3259.85 ± 2.1041.66 ± 1.141.58 ± 0.197.94 ± 0.1015.30 ± 0.090.250 ± 0.0014.51 ± 0.140.0124 ± 0.0004
F14NM5305.02 ± 0.3167.83 ± 0.771.93 ± 0.279.29 ± 0.1718.80 ± 0.100.238 ± 0.0046.07 ± 0.190.0070 ± 0.0011
Table 3. Electrical conductivity and pH values (mean ± standard deviation) of the test emulsions before and after conducting the DMTA test.
FormulationpH ValueElectrical Conductivity (µS cm−1)
Before DMTA TestAfter DMTA TestBefore DMTA TestAfter DMTA Test
F26.23 ± 0.066.19 ± 0.05410 ± 2409 ± 1
F145.91 ± 0.075.96 ± 0.02371 ± 18397 ± 15
F2MPC36.17 ± 0.036.14 ± 0.05590 ± 7514 ± 12 *
F2MPC56.33 ± 0.086.41 ± 0.07495 ± 9506 ± 8
F14MPC36.23 ± 0.046.17 ± 0.04498 ± 9514 ± 7
F14MPC56.15 ± 0.076.23 ± 0.05505 ± 10481 ± 13
F2NM35.65 ± 0.045.63 ± 0.02994 ± 41050 ± 5 ***
F2NM55.91 ± 0.025.92 ± 0.031836 ± 31905 ± 6 **
F14NM35.80 ± 0.105.56 ± 0.13940 ± 13905 ± 18
F14NM55.51 ± 0.035.54 ± 0.041162 ± 51290 ± 3 ***
* p < 0.05, ** p < 0.01, and *** p < 0.001 before and after DMTA comparisons (paired samples t-test).
Table 4. The concentration of the NM hydrolysate, blanks, and “active” emulsions, expressed in µg/mL, which induced a 50% decrease in cell survival (IC50).
Sample
(µg/mL)
Cell Line
MRC5HaCaT
F2>200>200
F2NM3>200>200
F2NM5>200>200
F14>200>200
F14NM3177.31>200
F14NM5>200>200
NM hydrolysate171.18>200
Disclaimer/Publisher’s Note: The statements, opinions and data contained in all publications are solely those of the individual author(s) and contributor(s) and not of MDPI and/or the editor(s). MDPI and/or the editor(s) disclaim responsibility for any injury to people or property resulting from any ideas, methods, instructions or products referred to in the content.

