Mapping Ecosystem Services for Marine Planning: A UK Case Study

 ,
,  ,
,
Abstract
1. Introduction
2. Literature Review
3. Methods
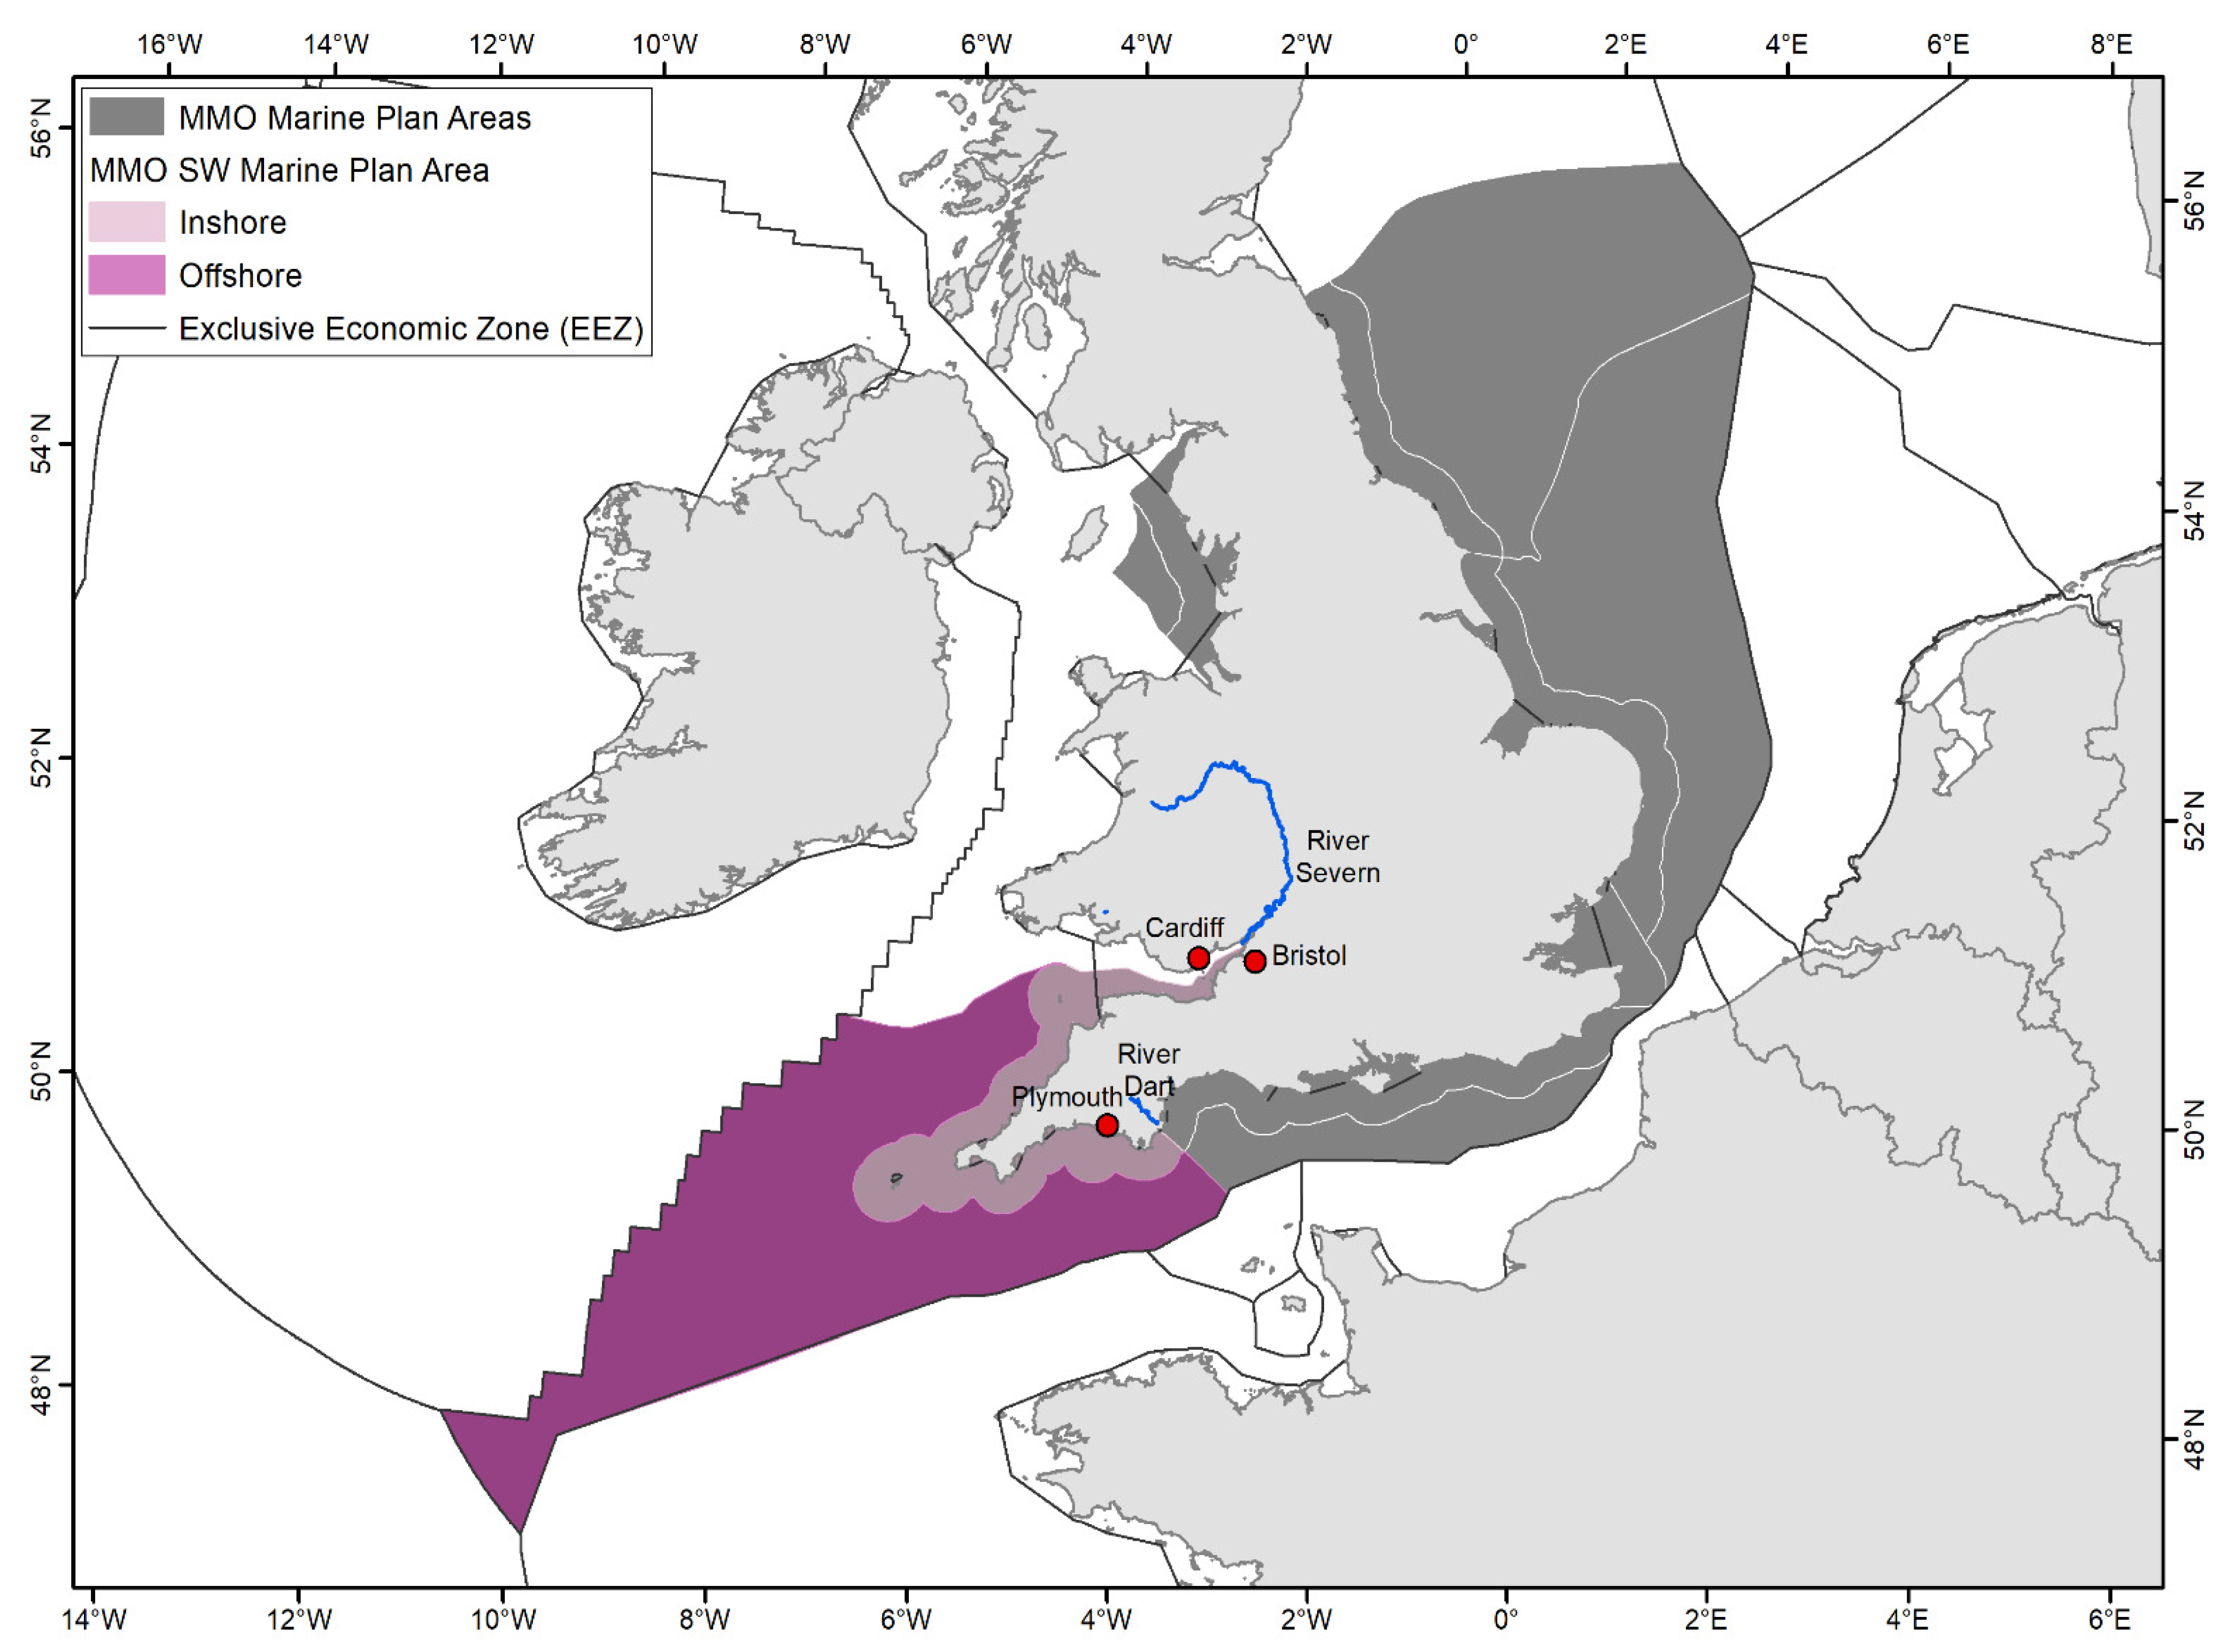
3.1. Study Area
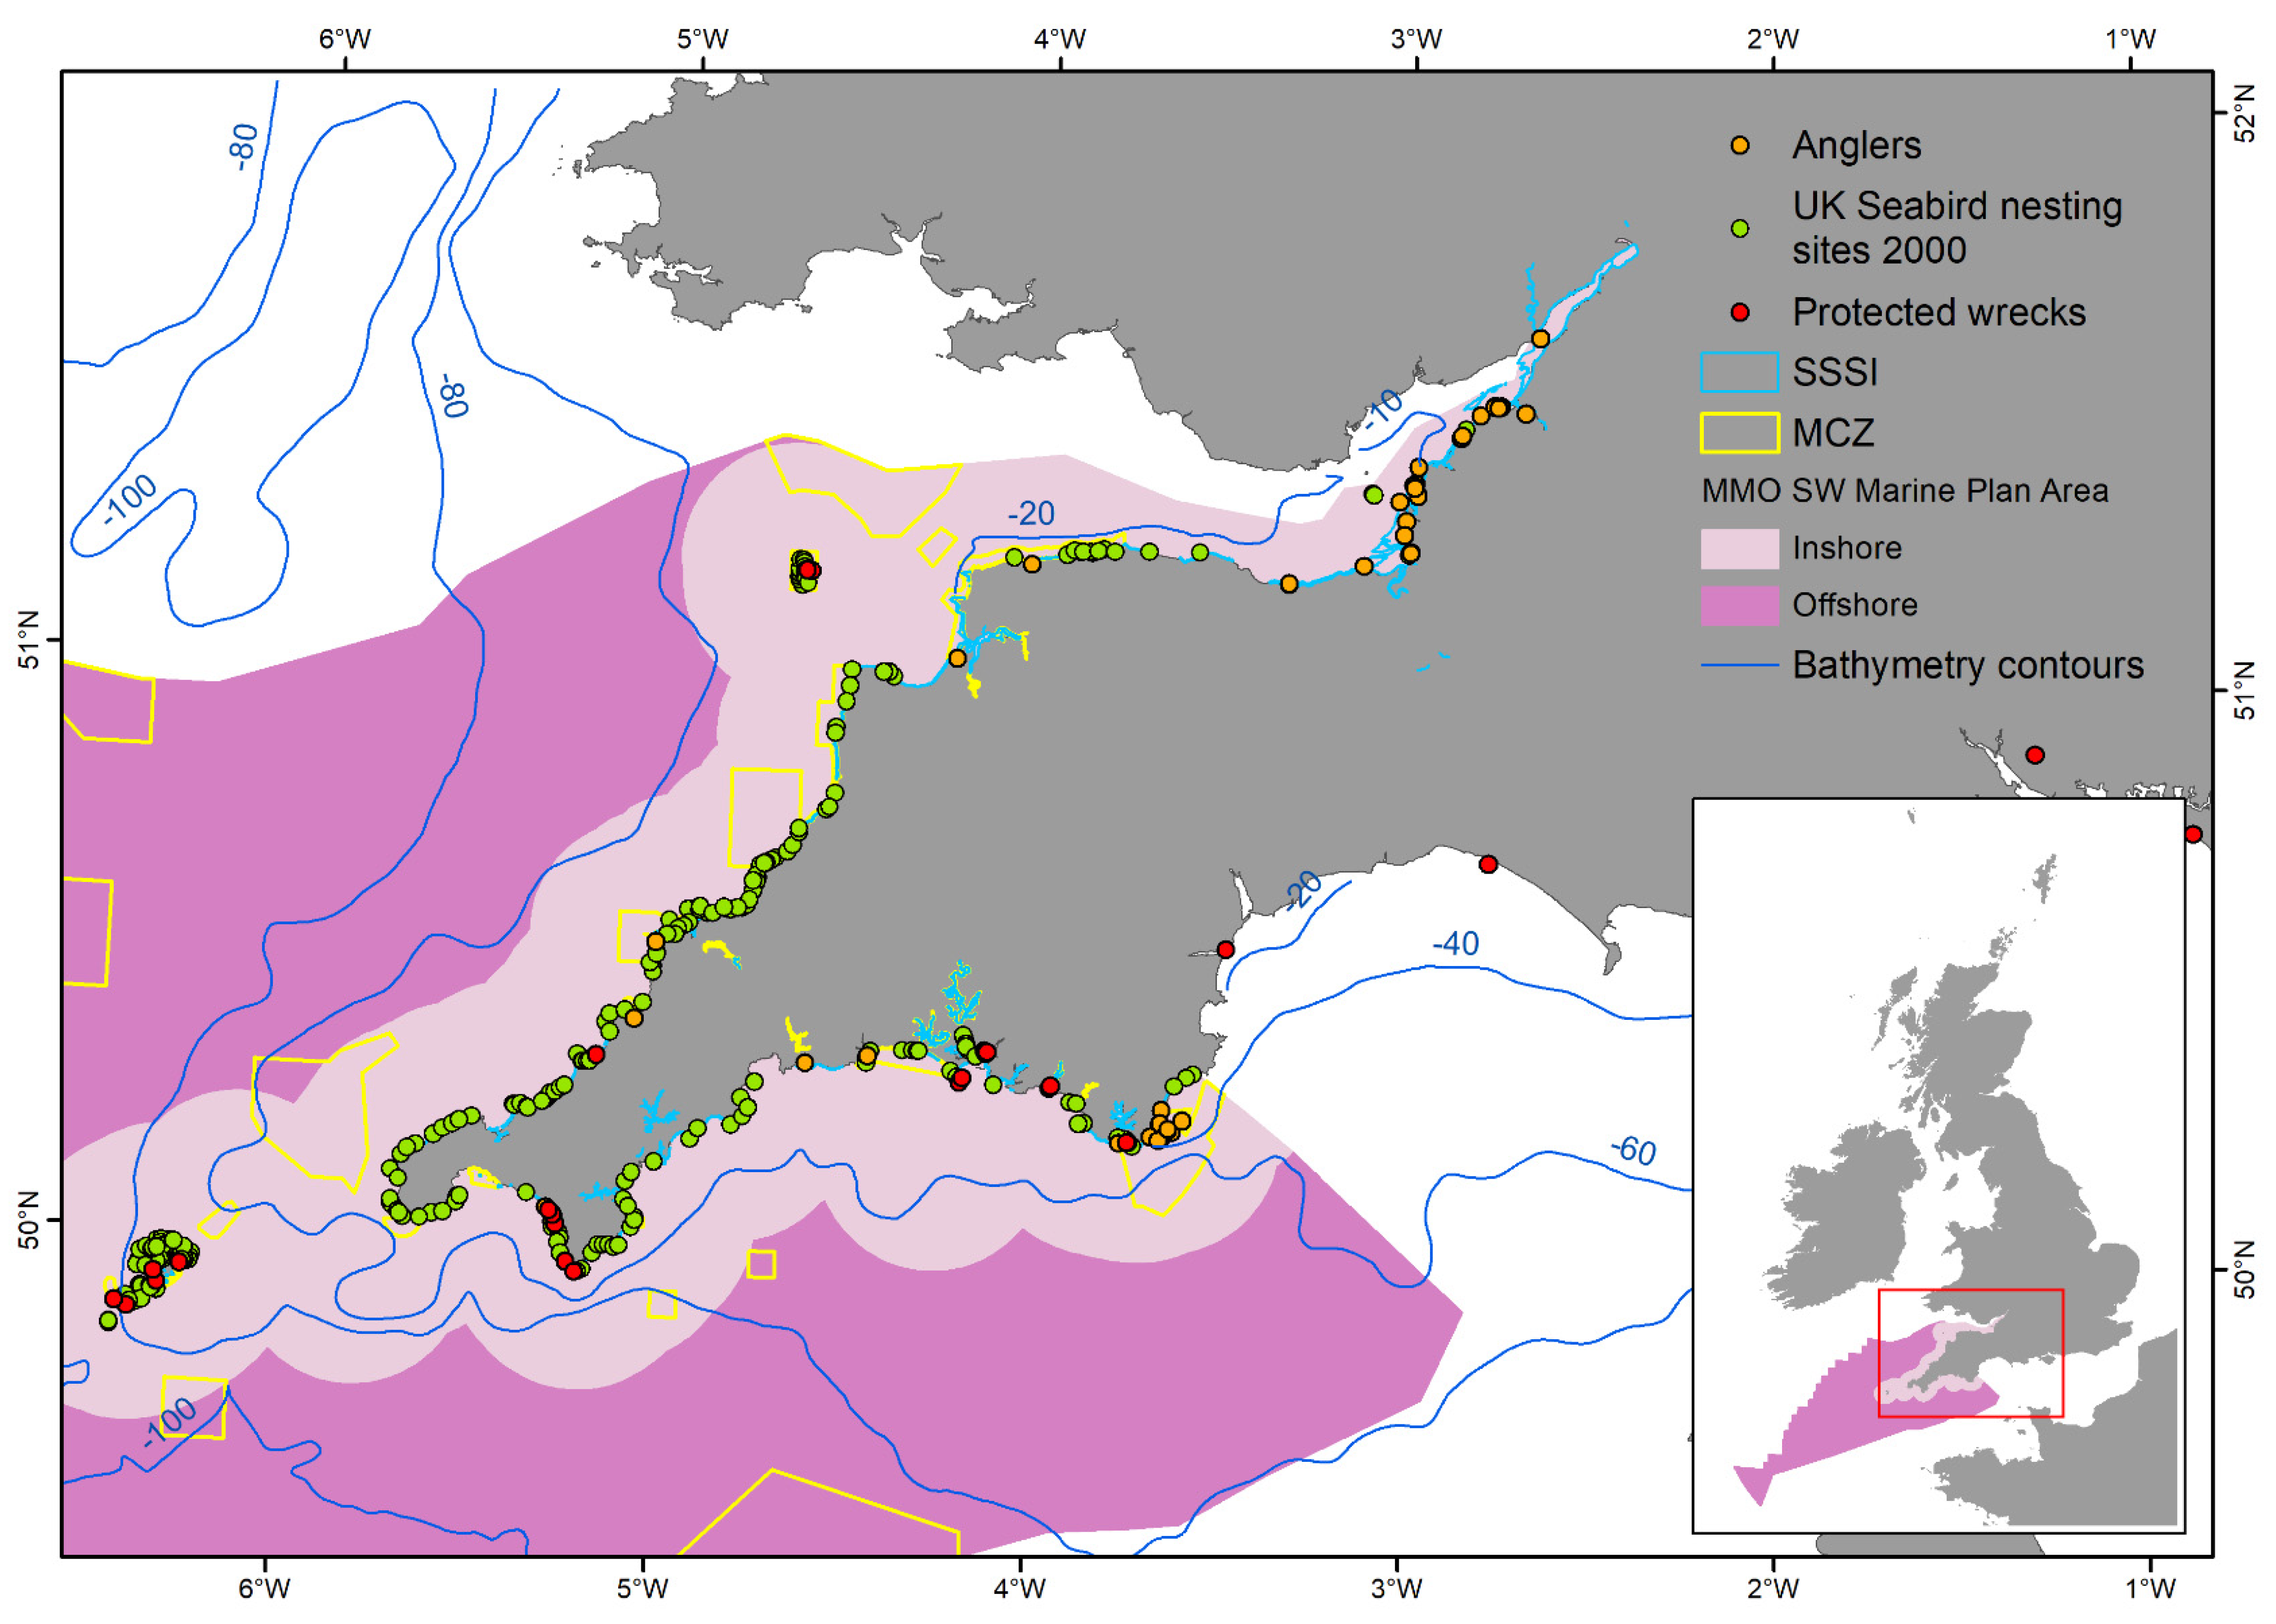
3.2. Data Layers
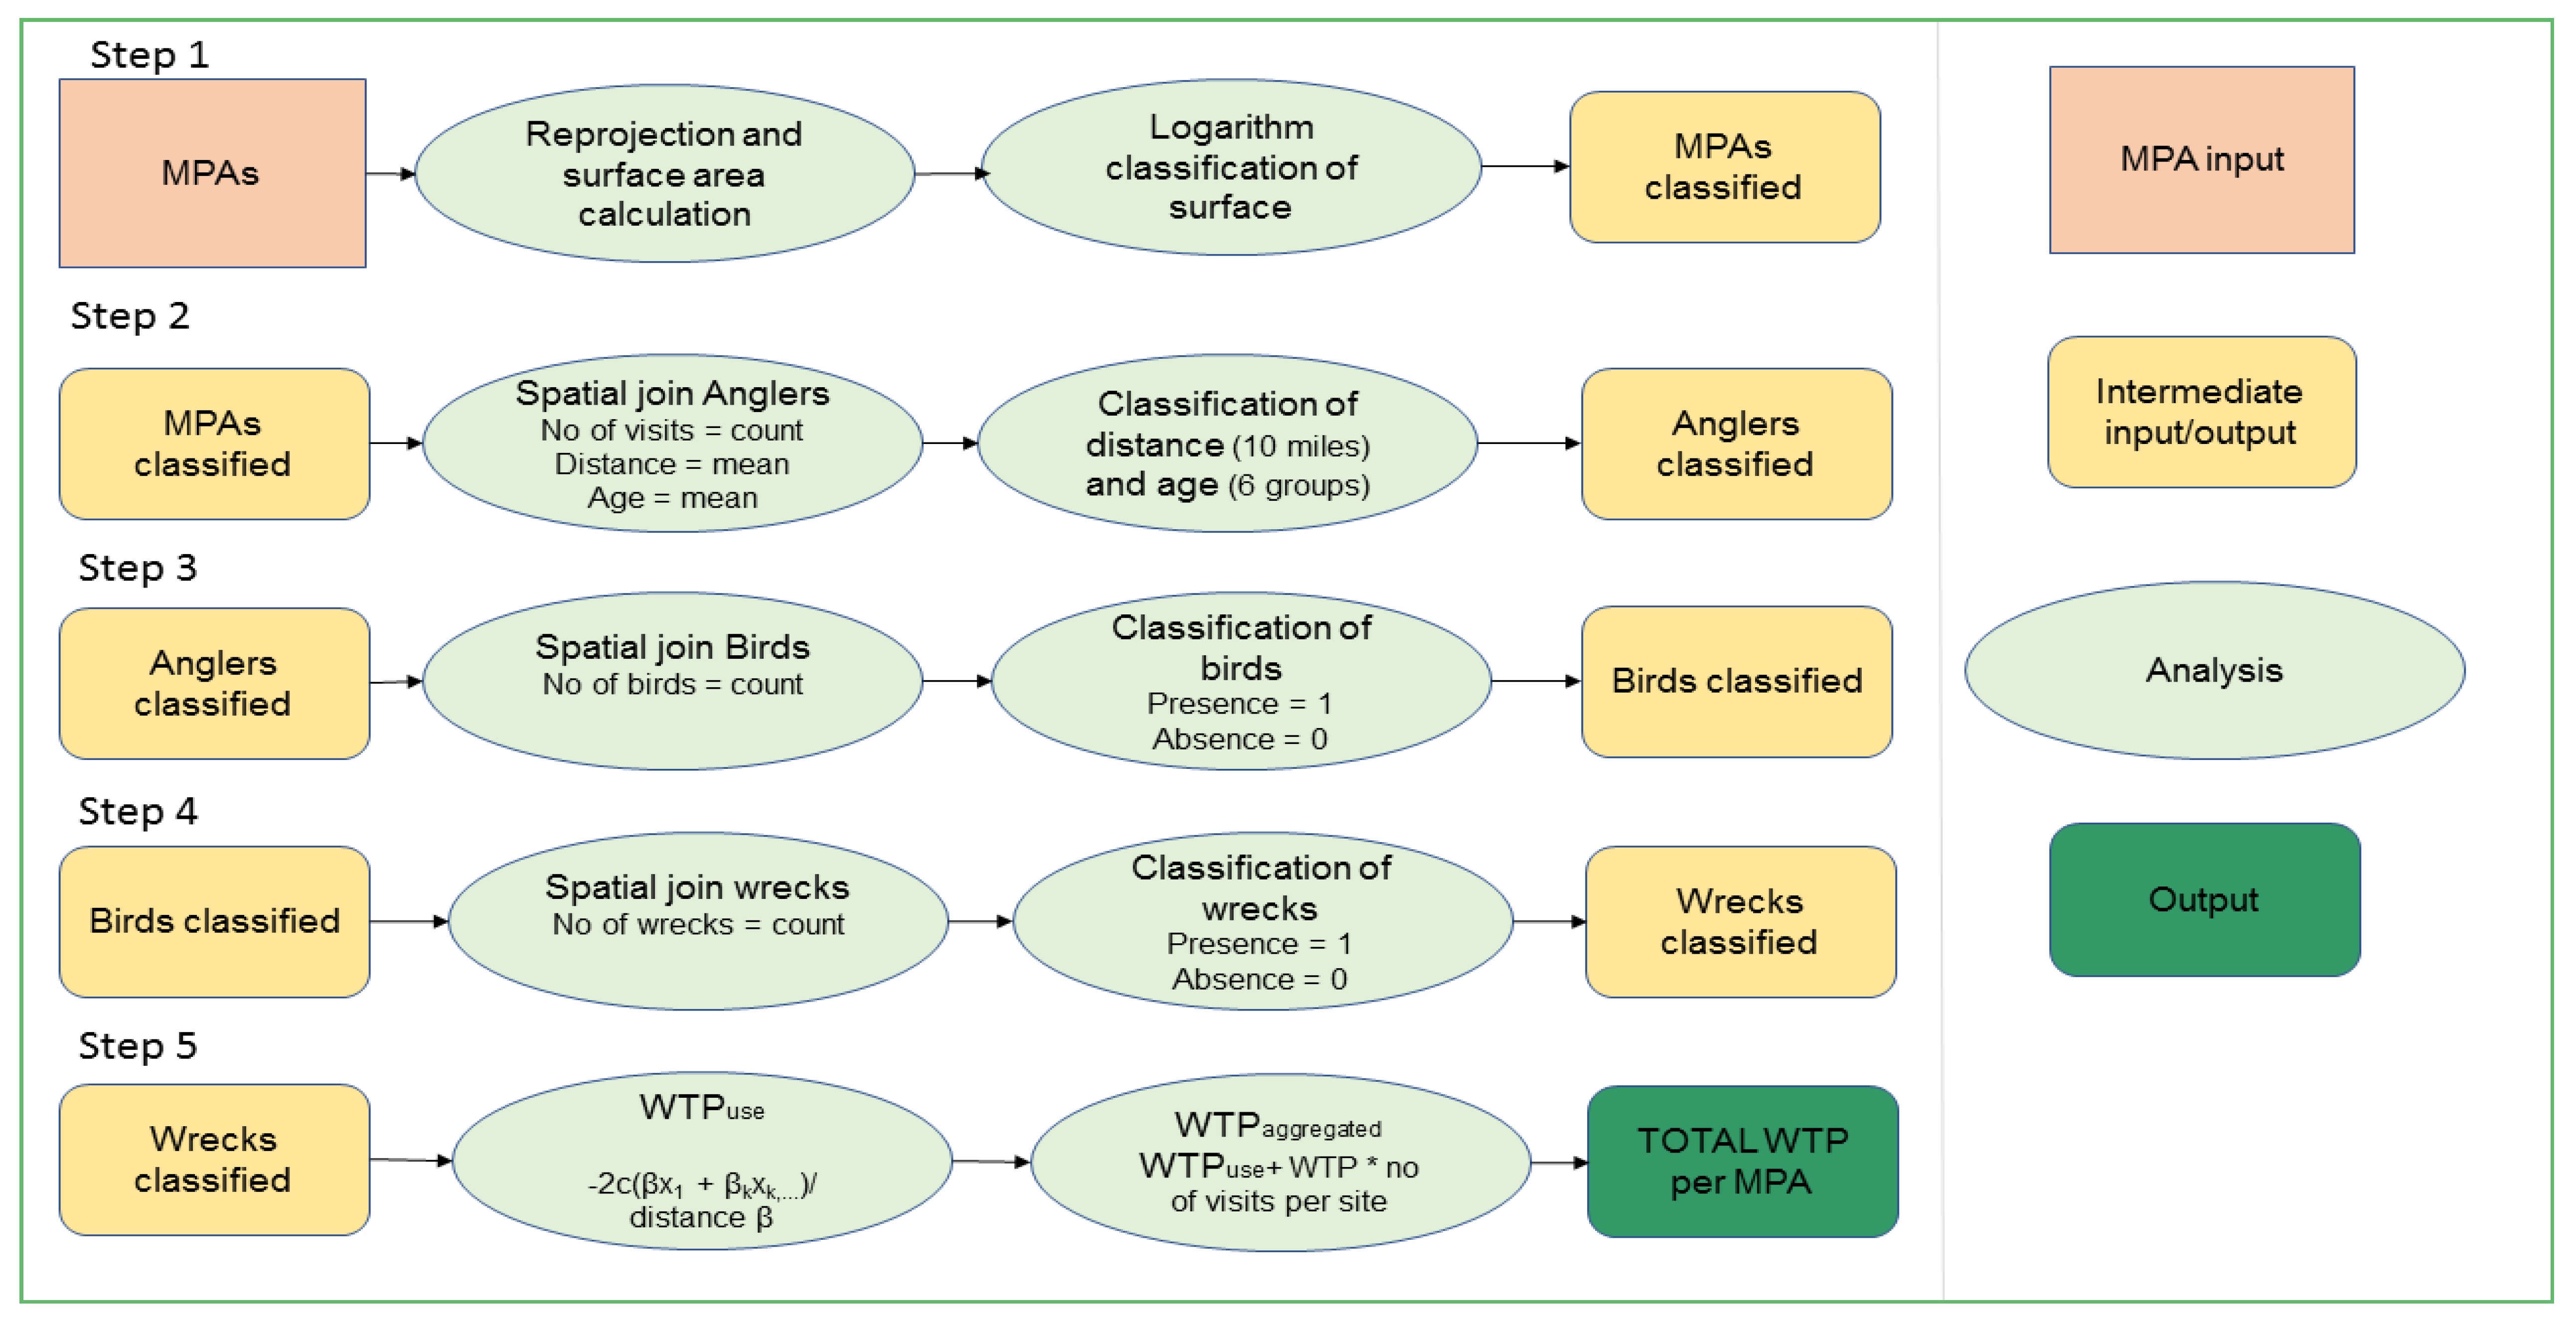
3.3. Mapping
4. Economic Estimates for Ecosystem Services
4.1. Carbon Sequestration and Storage
4.2. Recreational Angling
- The beta coefficients and estimates from the Kenter’s et al. [41] choice experiment study (see Equation (1)). This was done specifically to exploit the marginal values given for specific attributes of the MPAs and associate them with available biophysical data.
- The TC model used by Kenter et al. [41] only takes account of the distance i.e., the cost of travelling an extra mile, by using a fixed estimate of the cost per mile. This approach does not include time costs, i.e., the opportunity cost, which is the cost of performing a specific activity rather than all of the others one could engage in during the same period. Thus, the travel cost estimates used here are an under-representation of the true travel cost for a visitor to an MPA.
- All variables that are statistically significant, but non-existent in the South West MMO data, are included as a fixed value, using the sum of mean estimates for the respective beta coefficients and explanatory variables (WTPnormalised).
- We assume that the UK-wide coefficients provided by Kenter et al. [41] are representative for the individuals and their preferences in the South West MMO.
5. Results
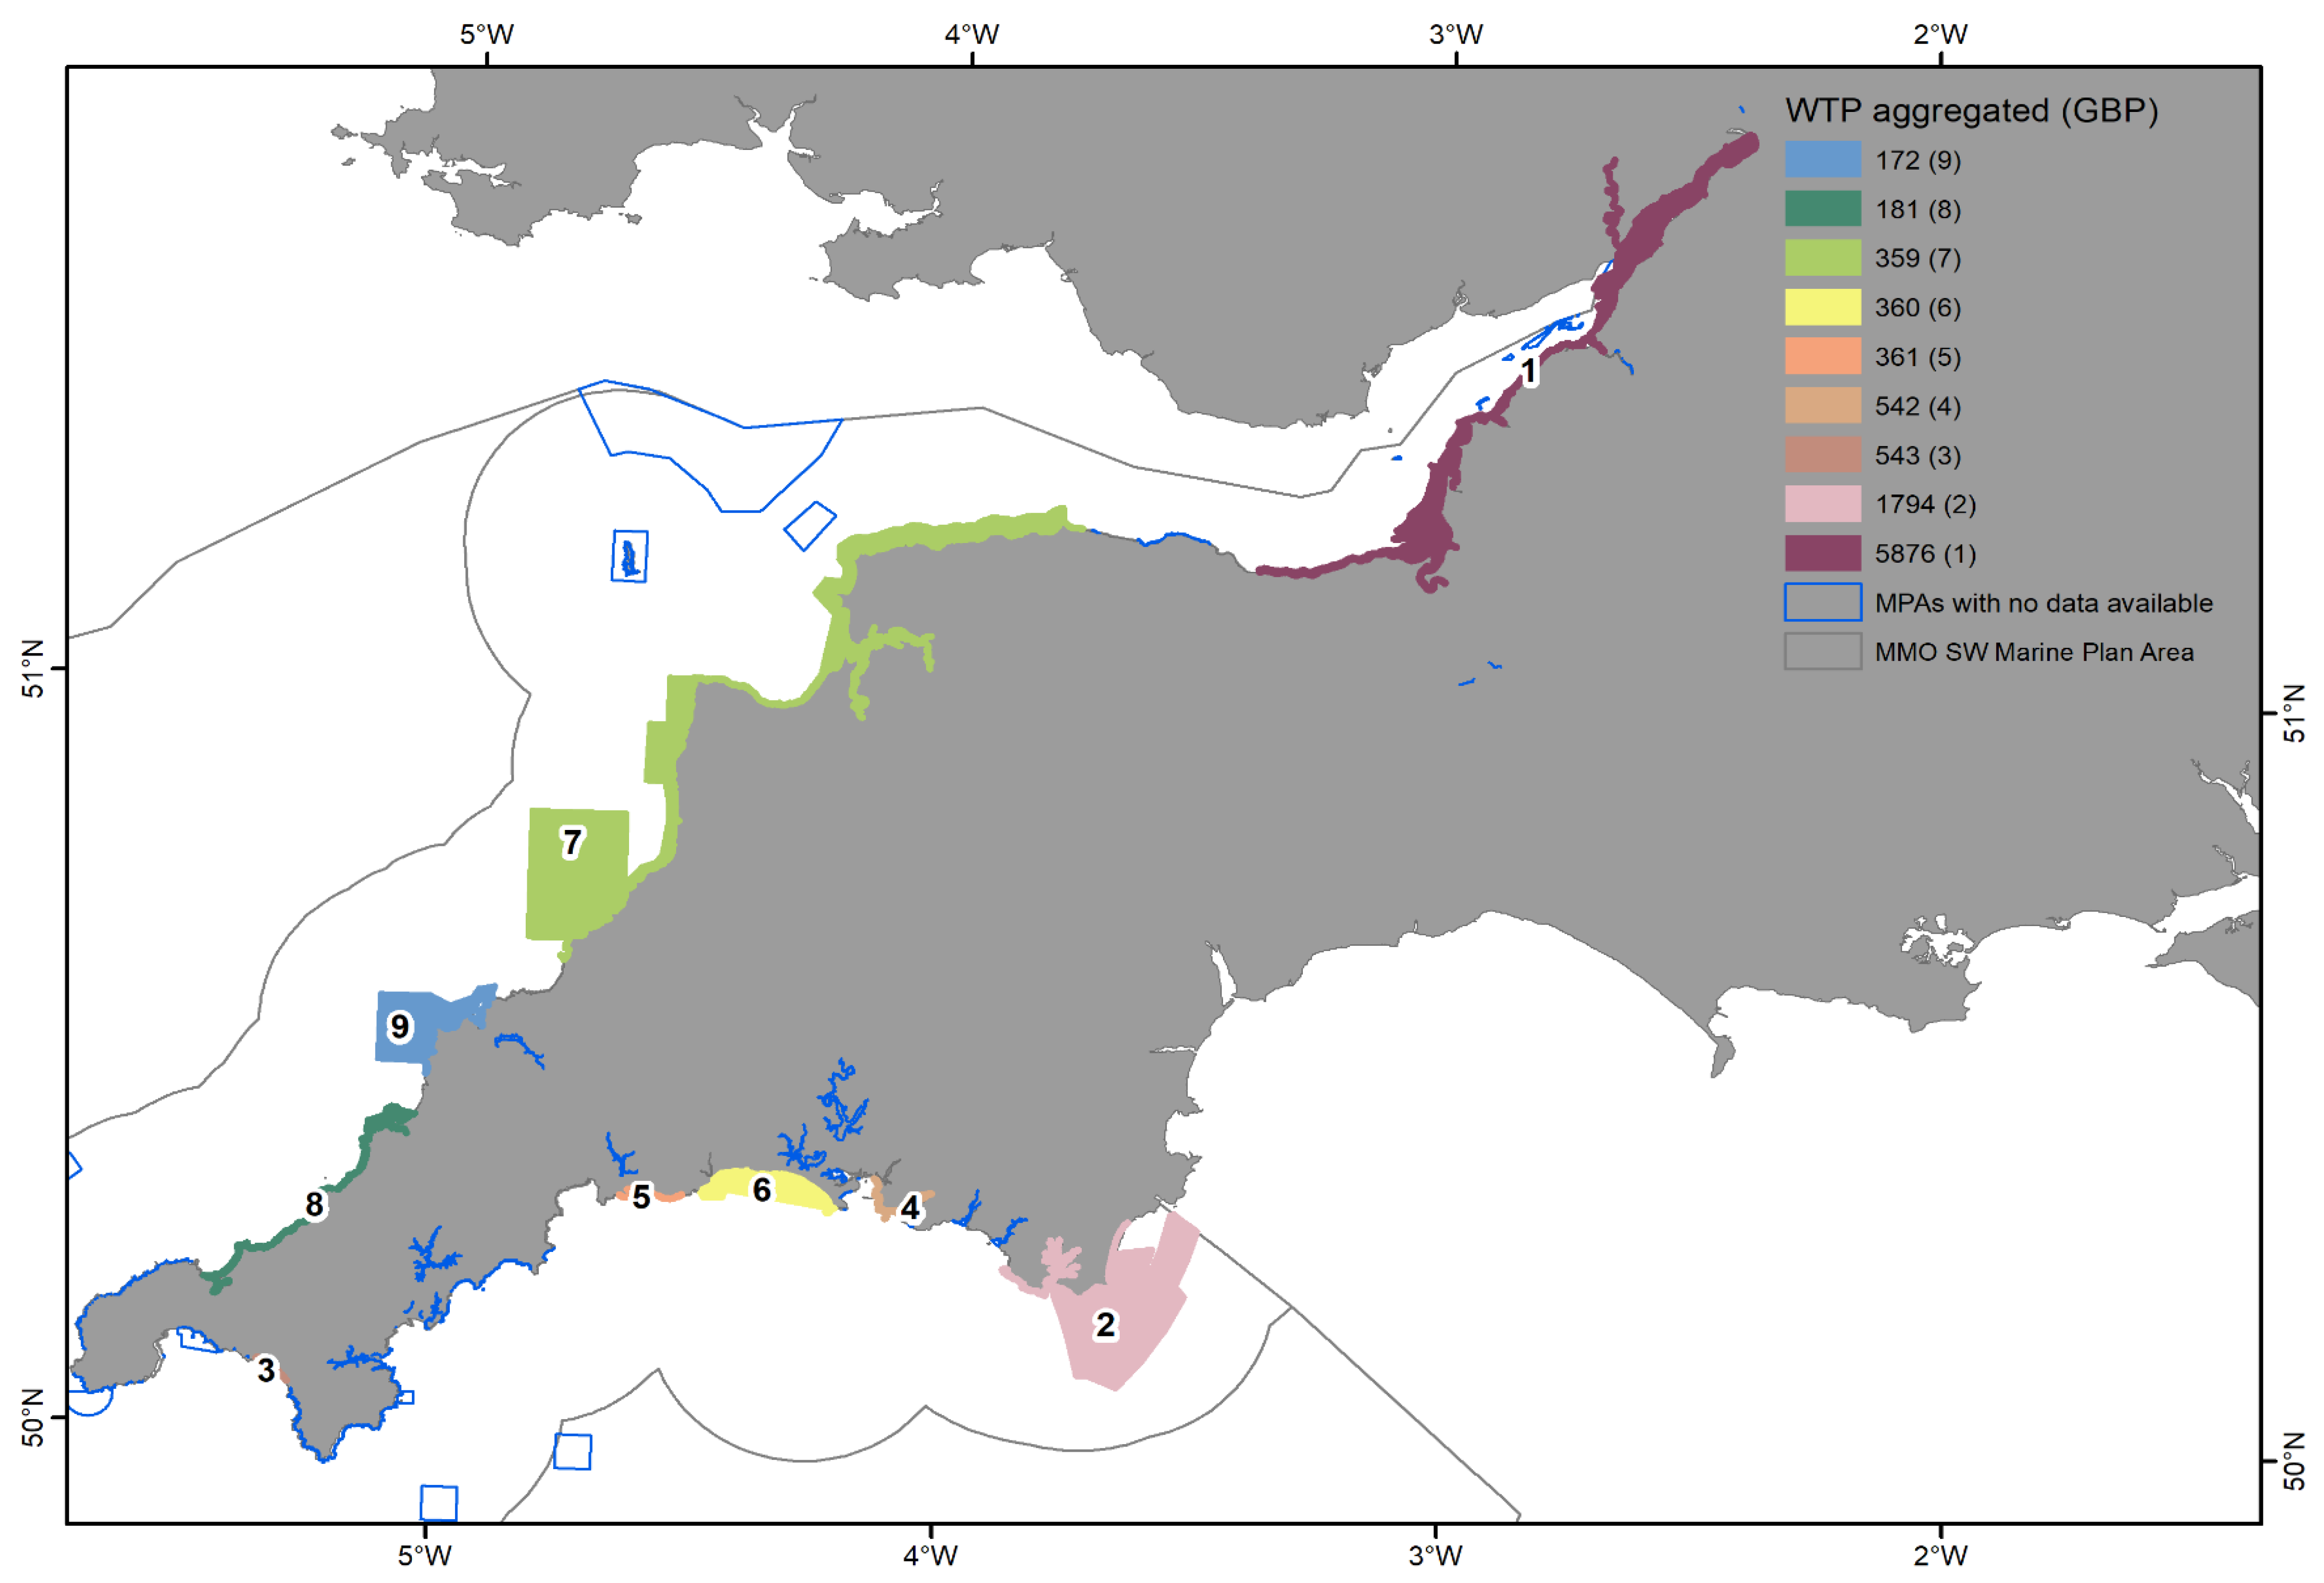
5.1. Recreational Angling
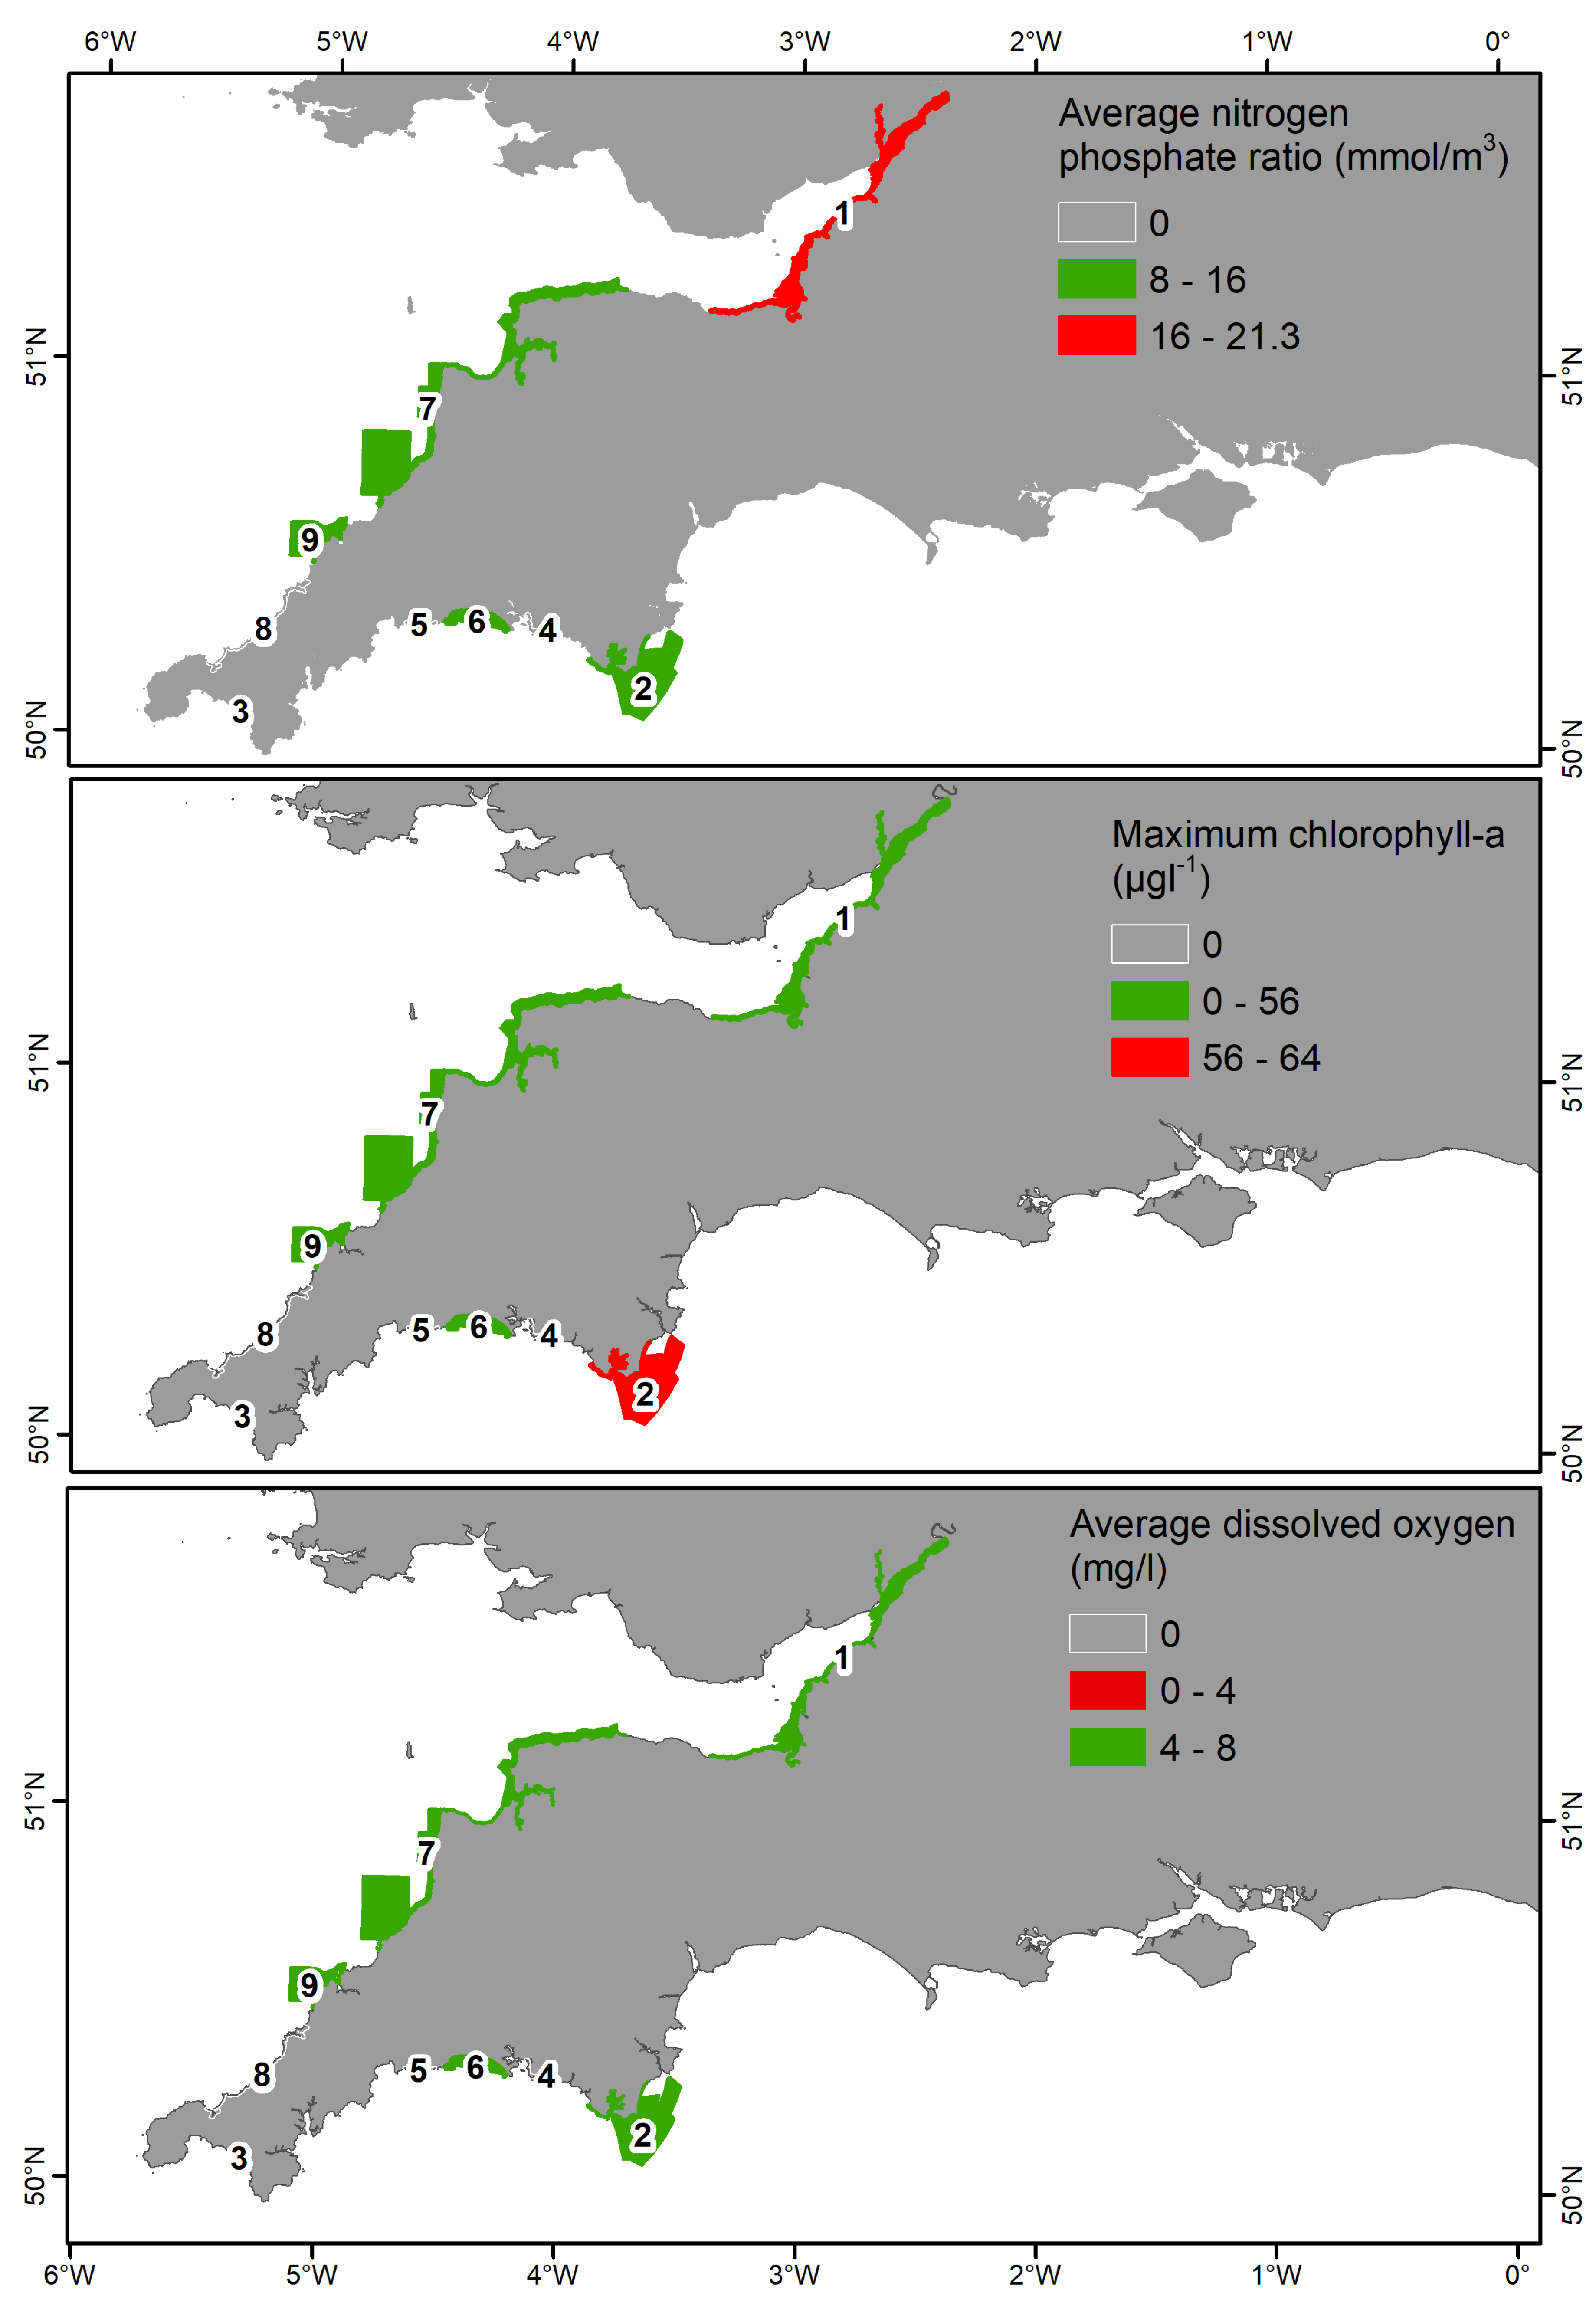
5.2. Water Quality
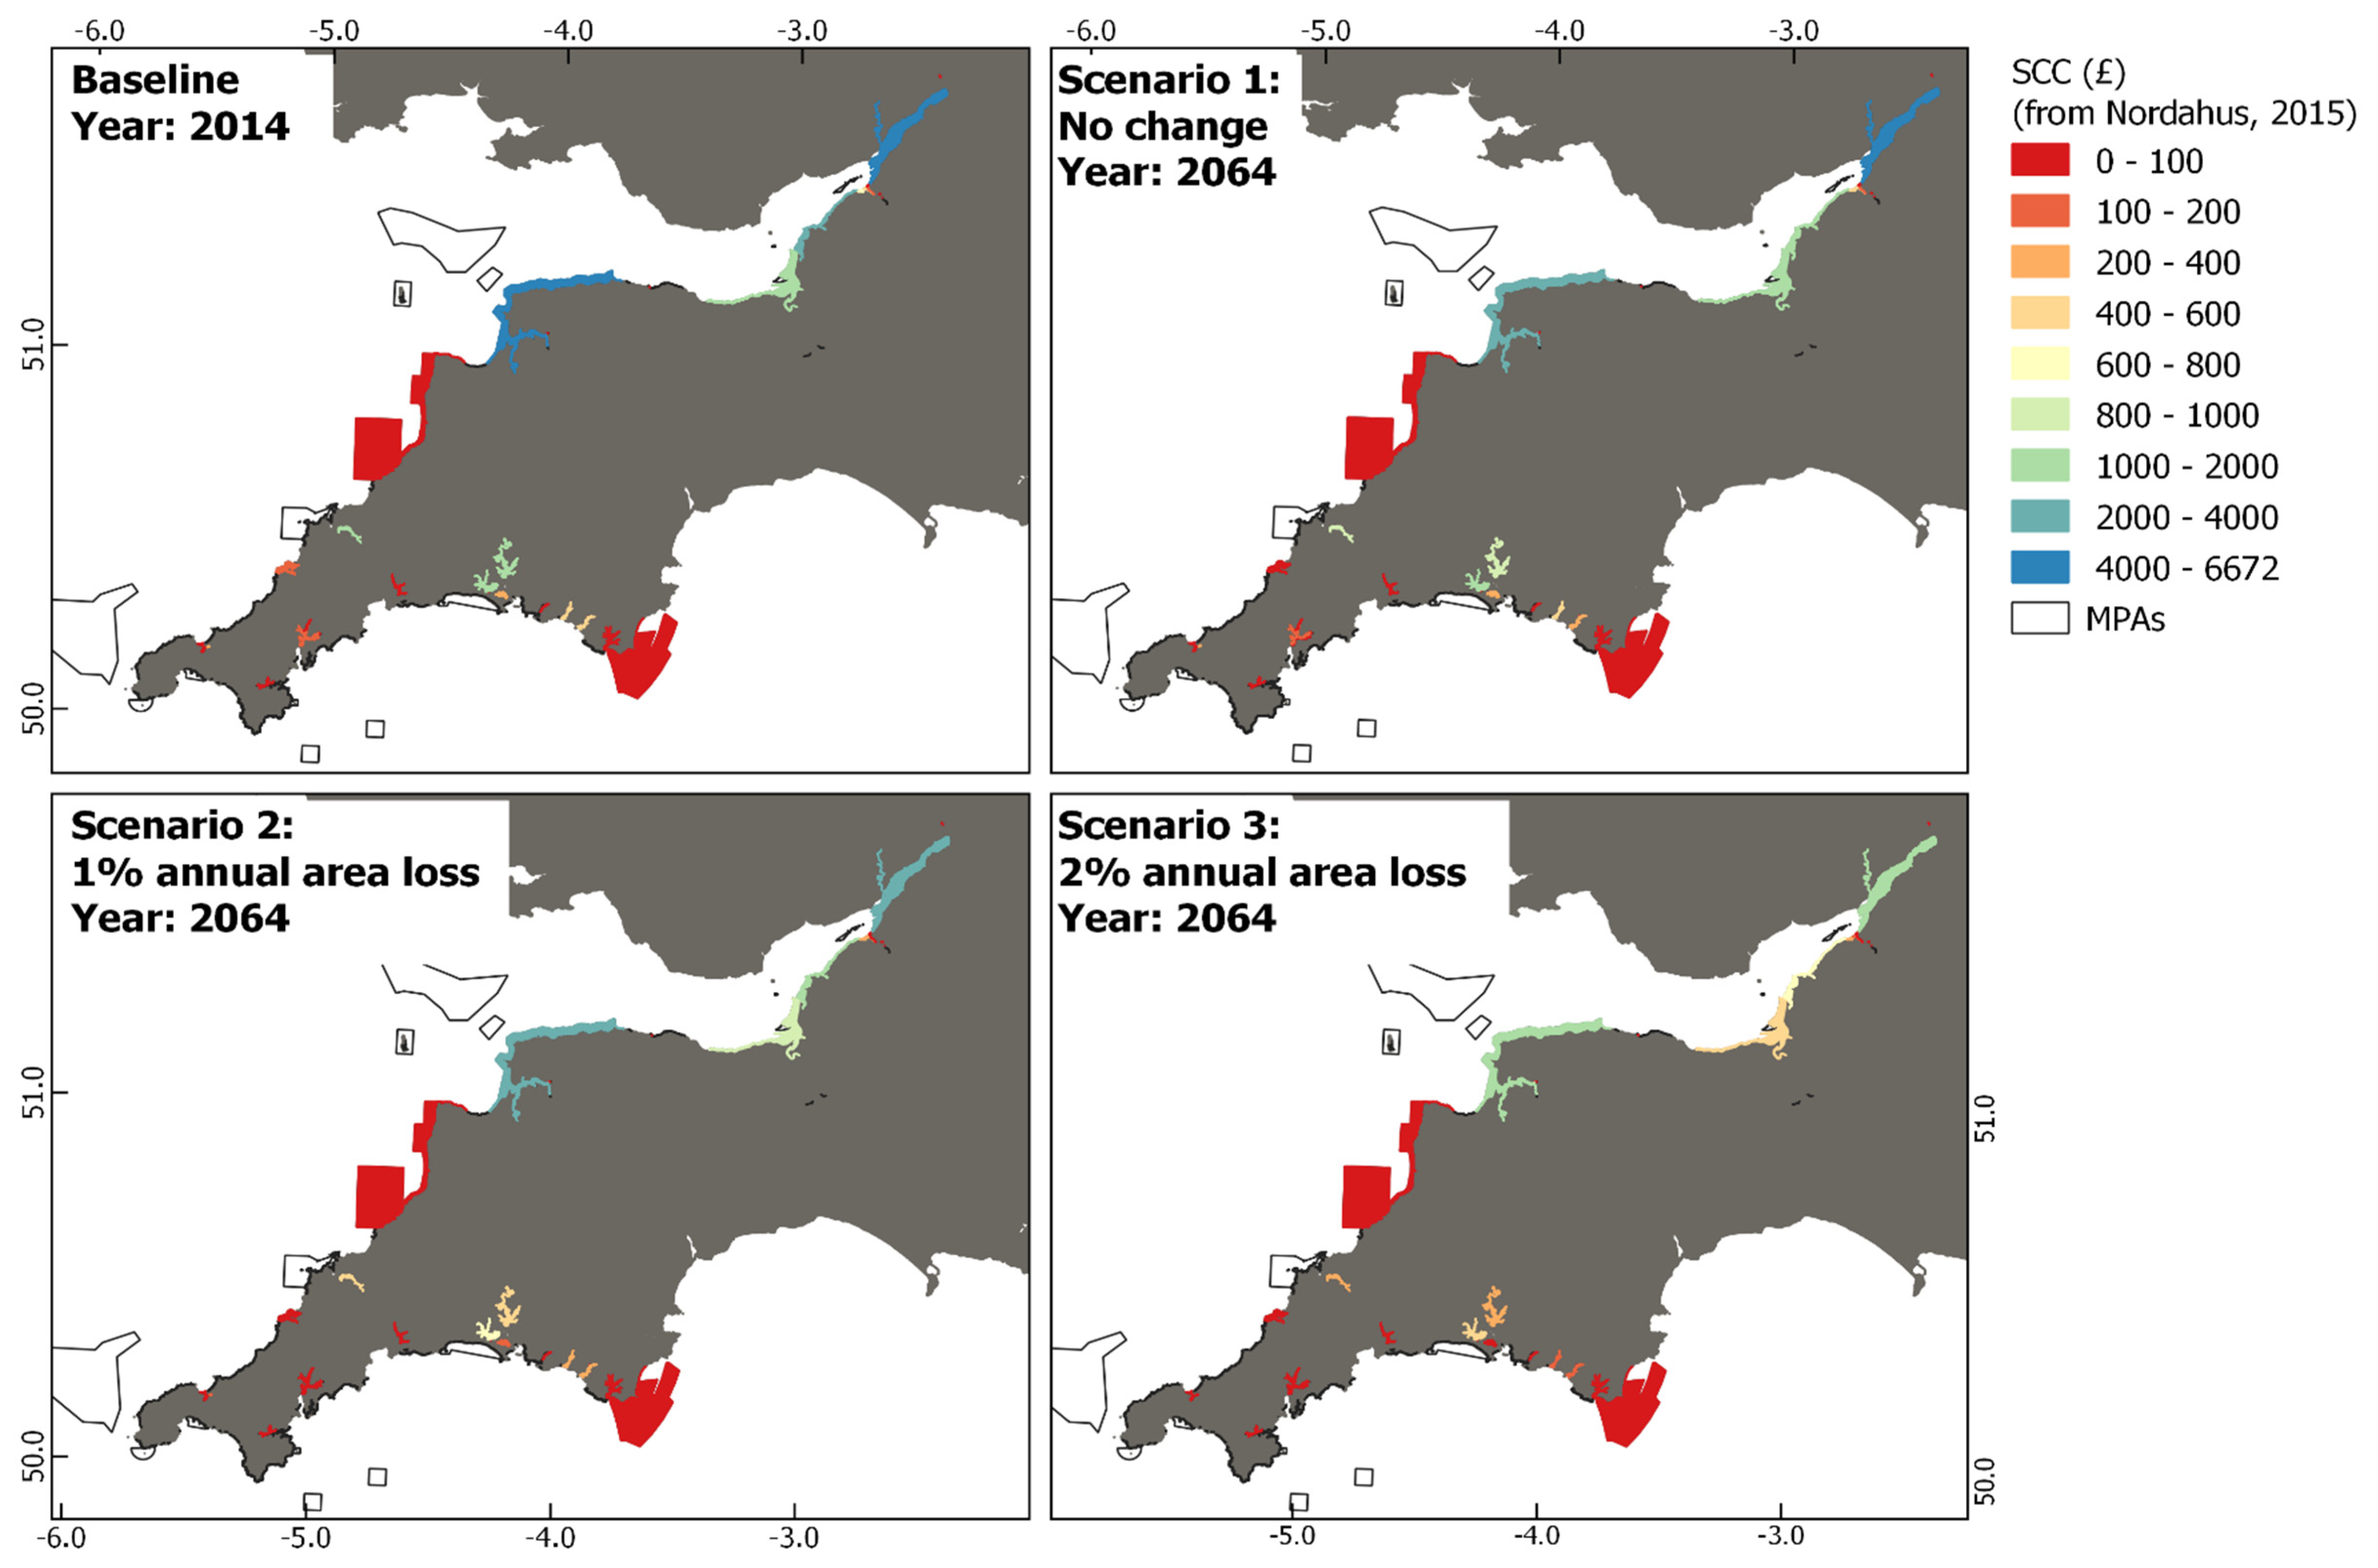
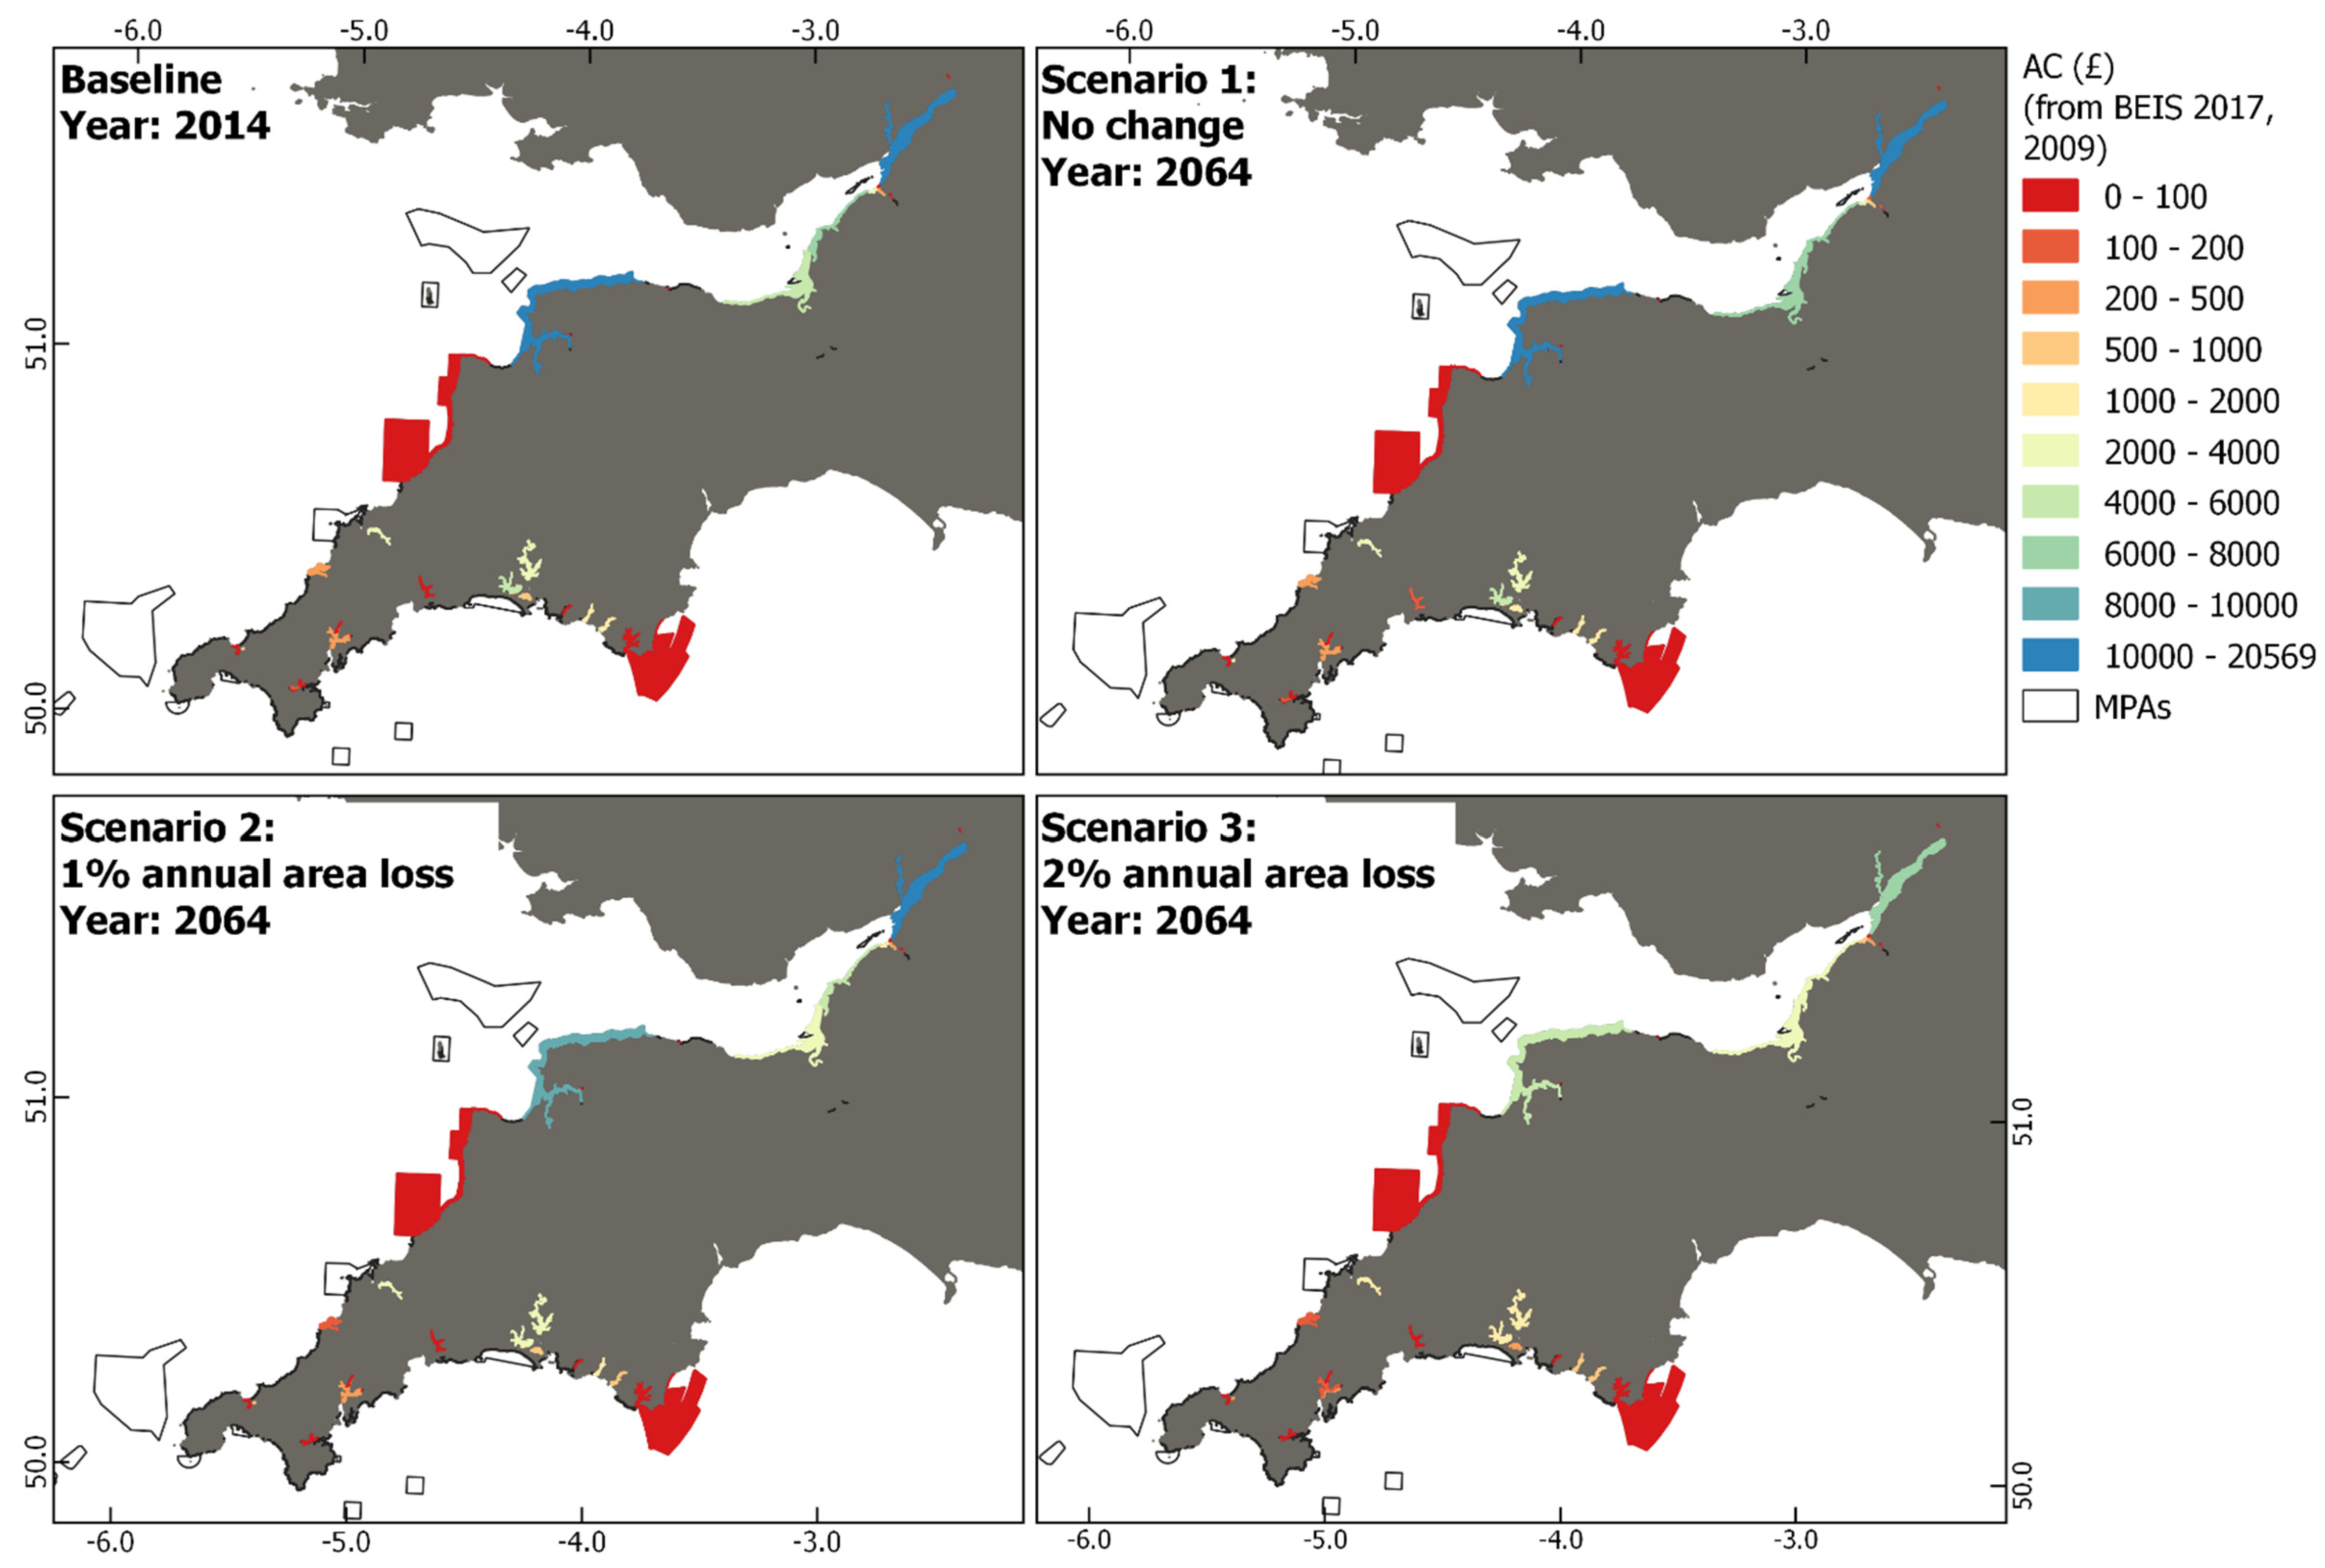
5.3. Carbon Sequestration and Storage Benefits
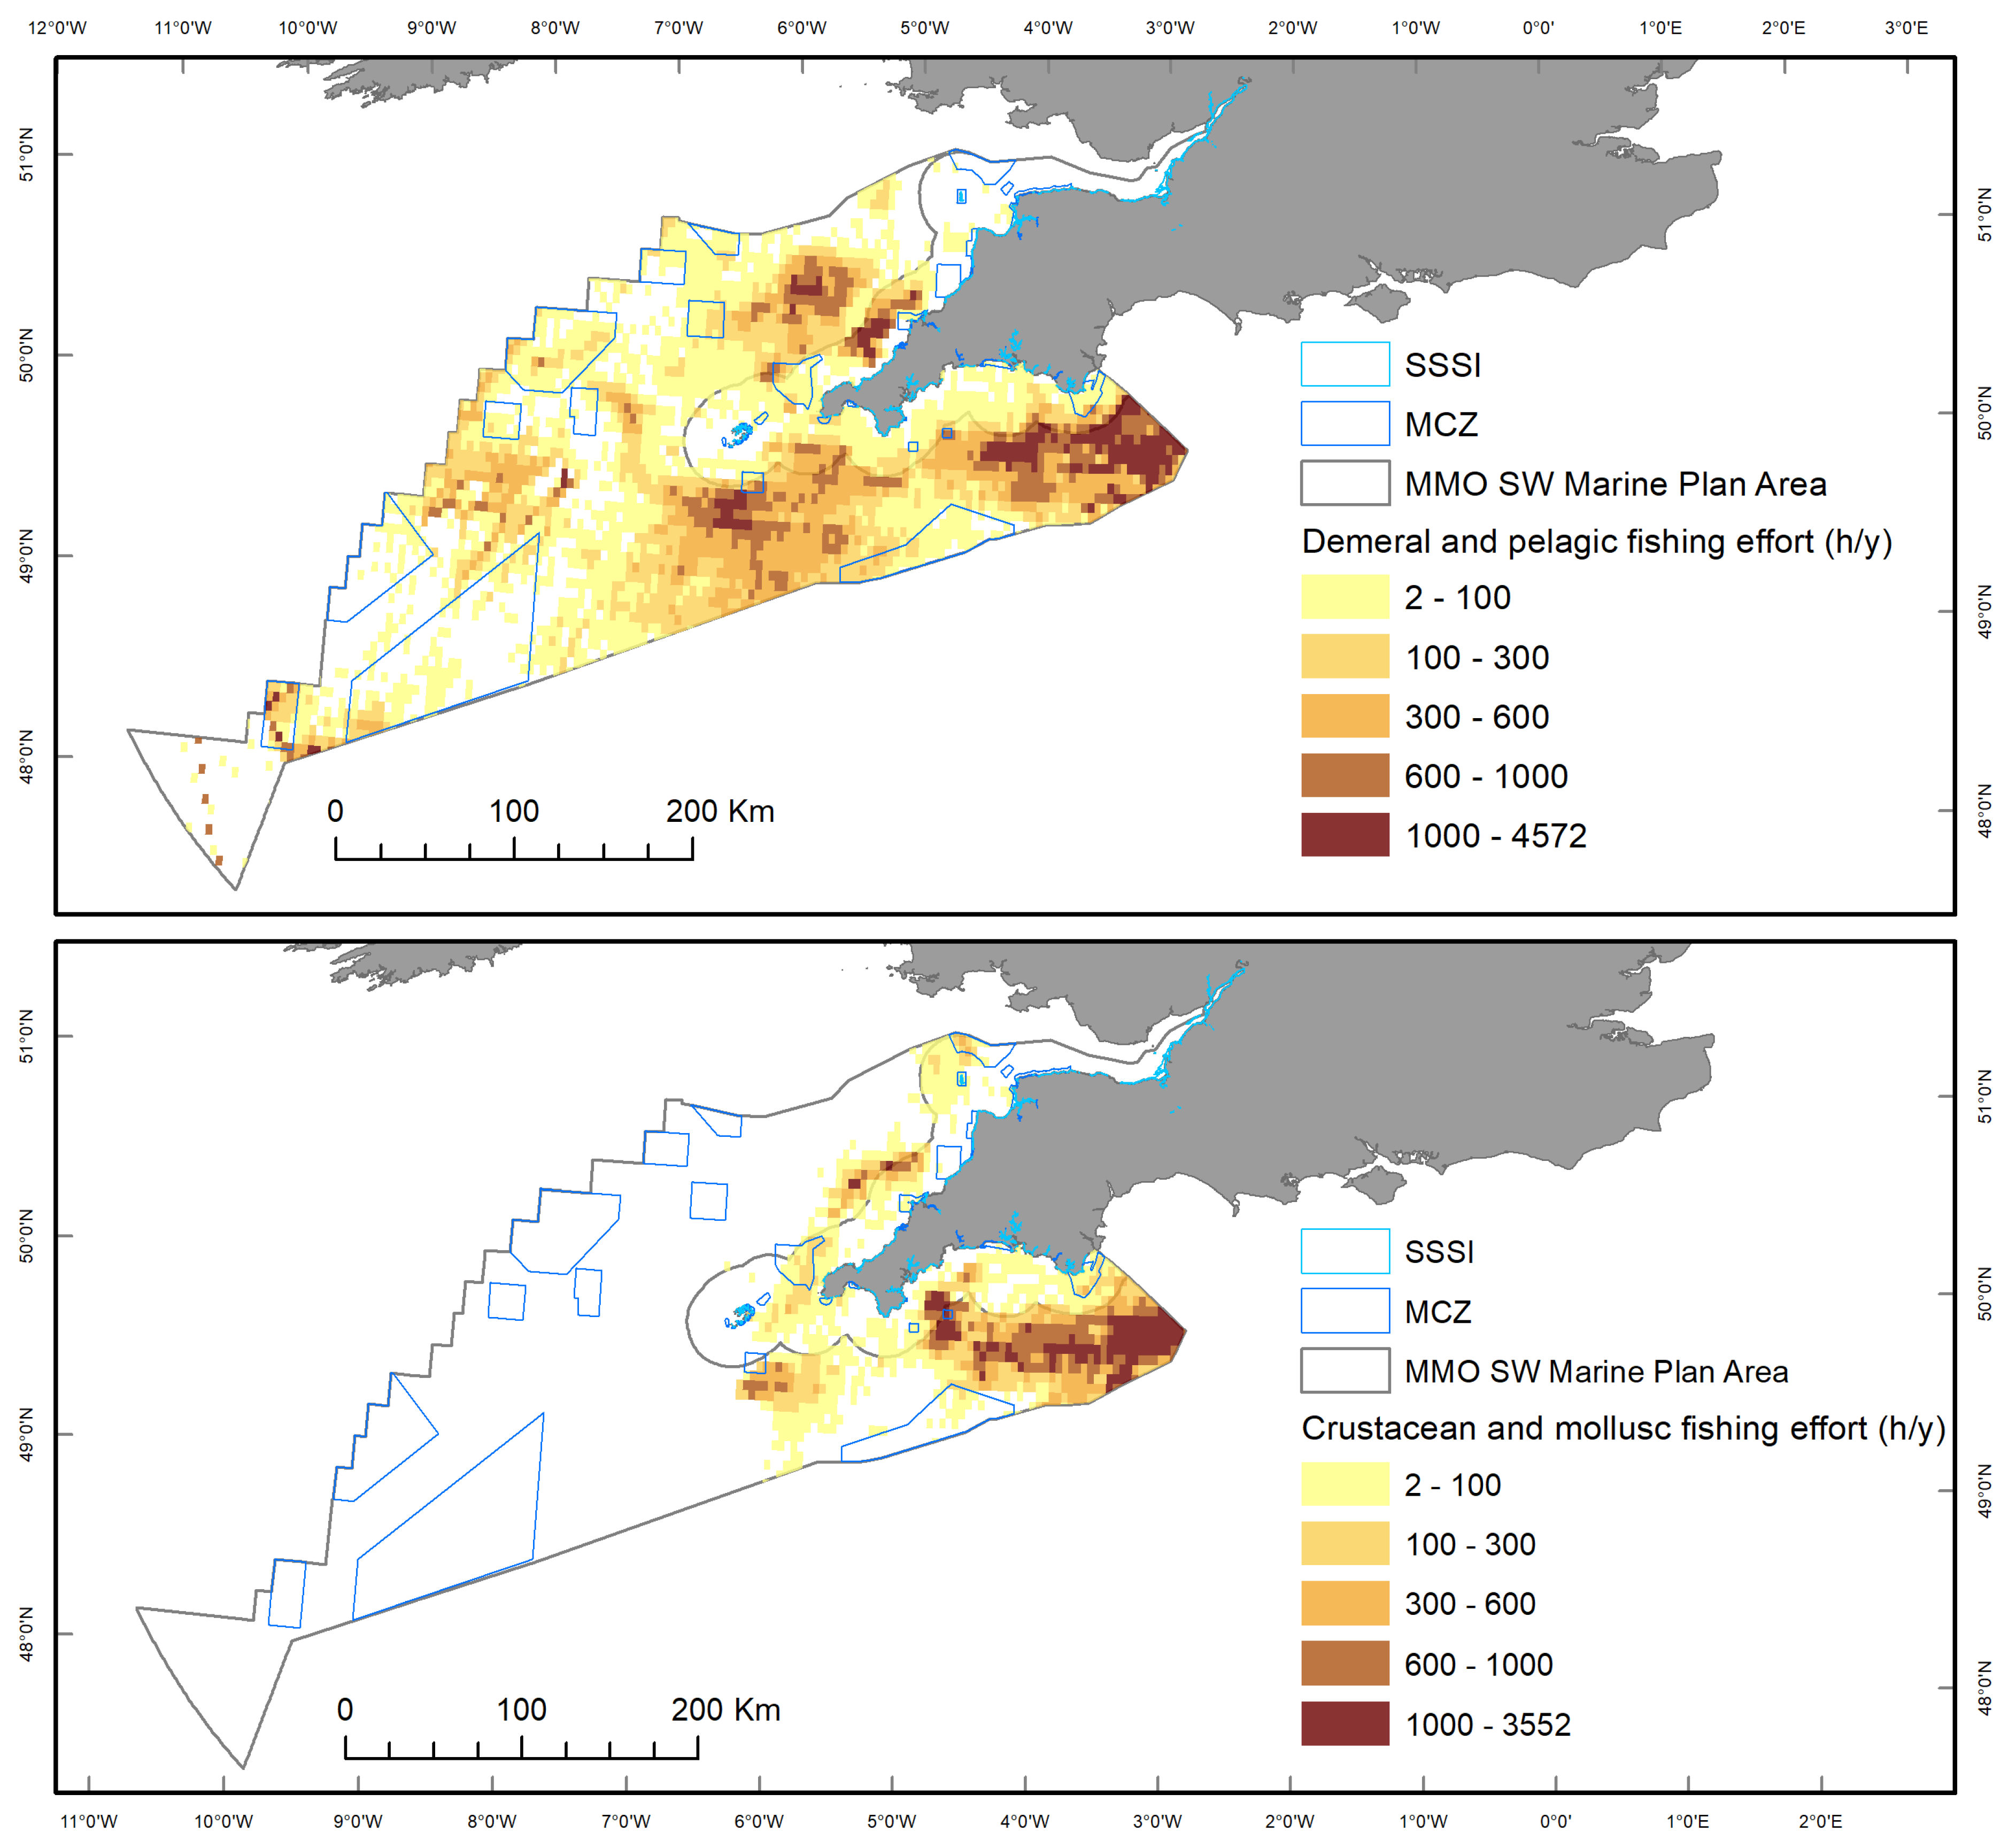
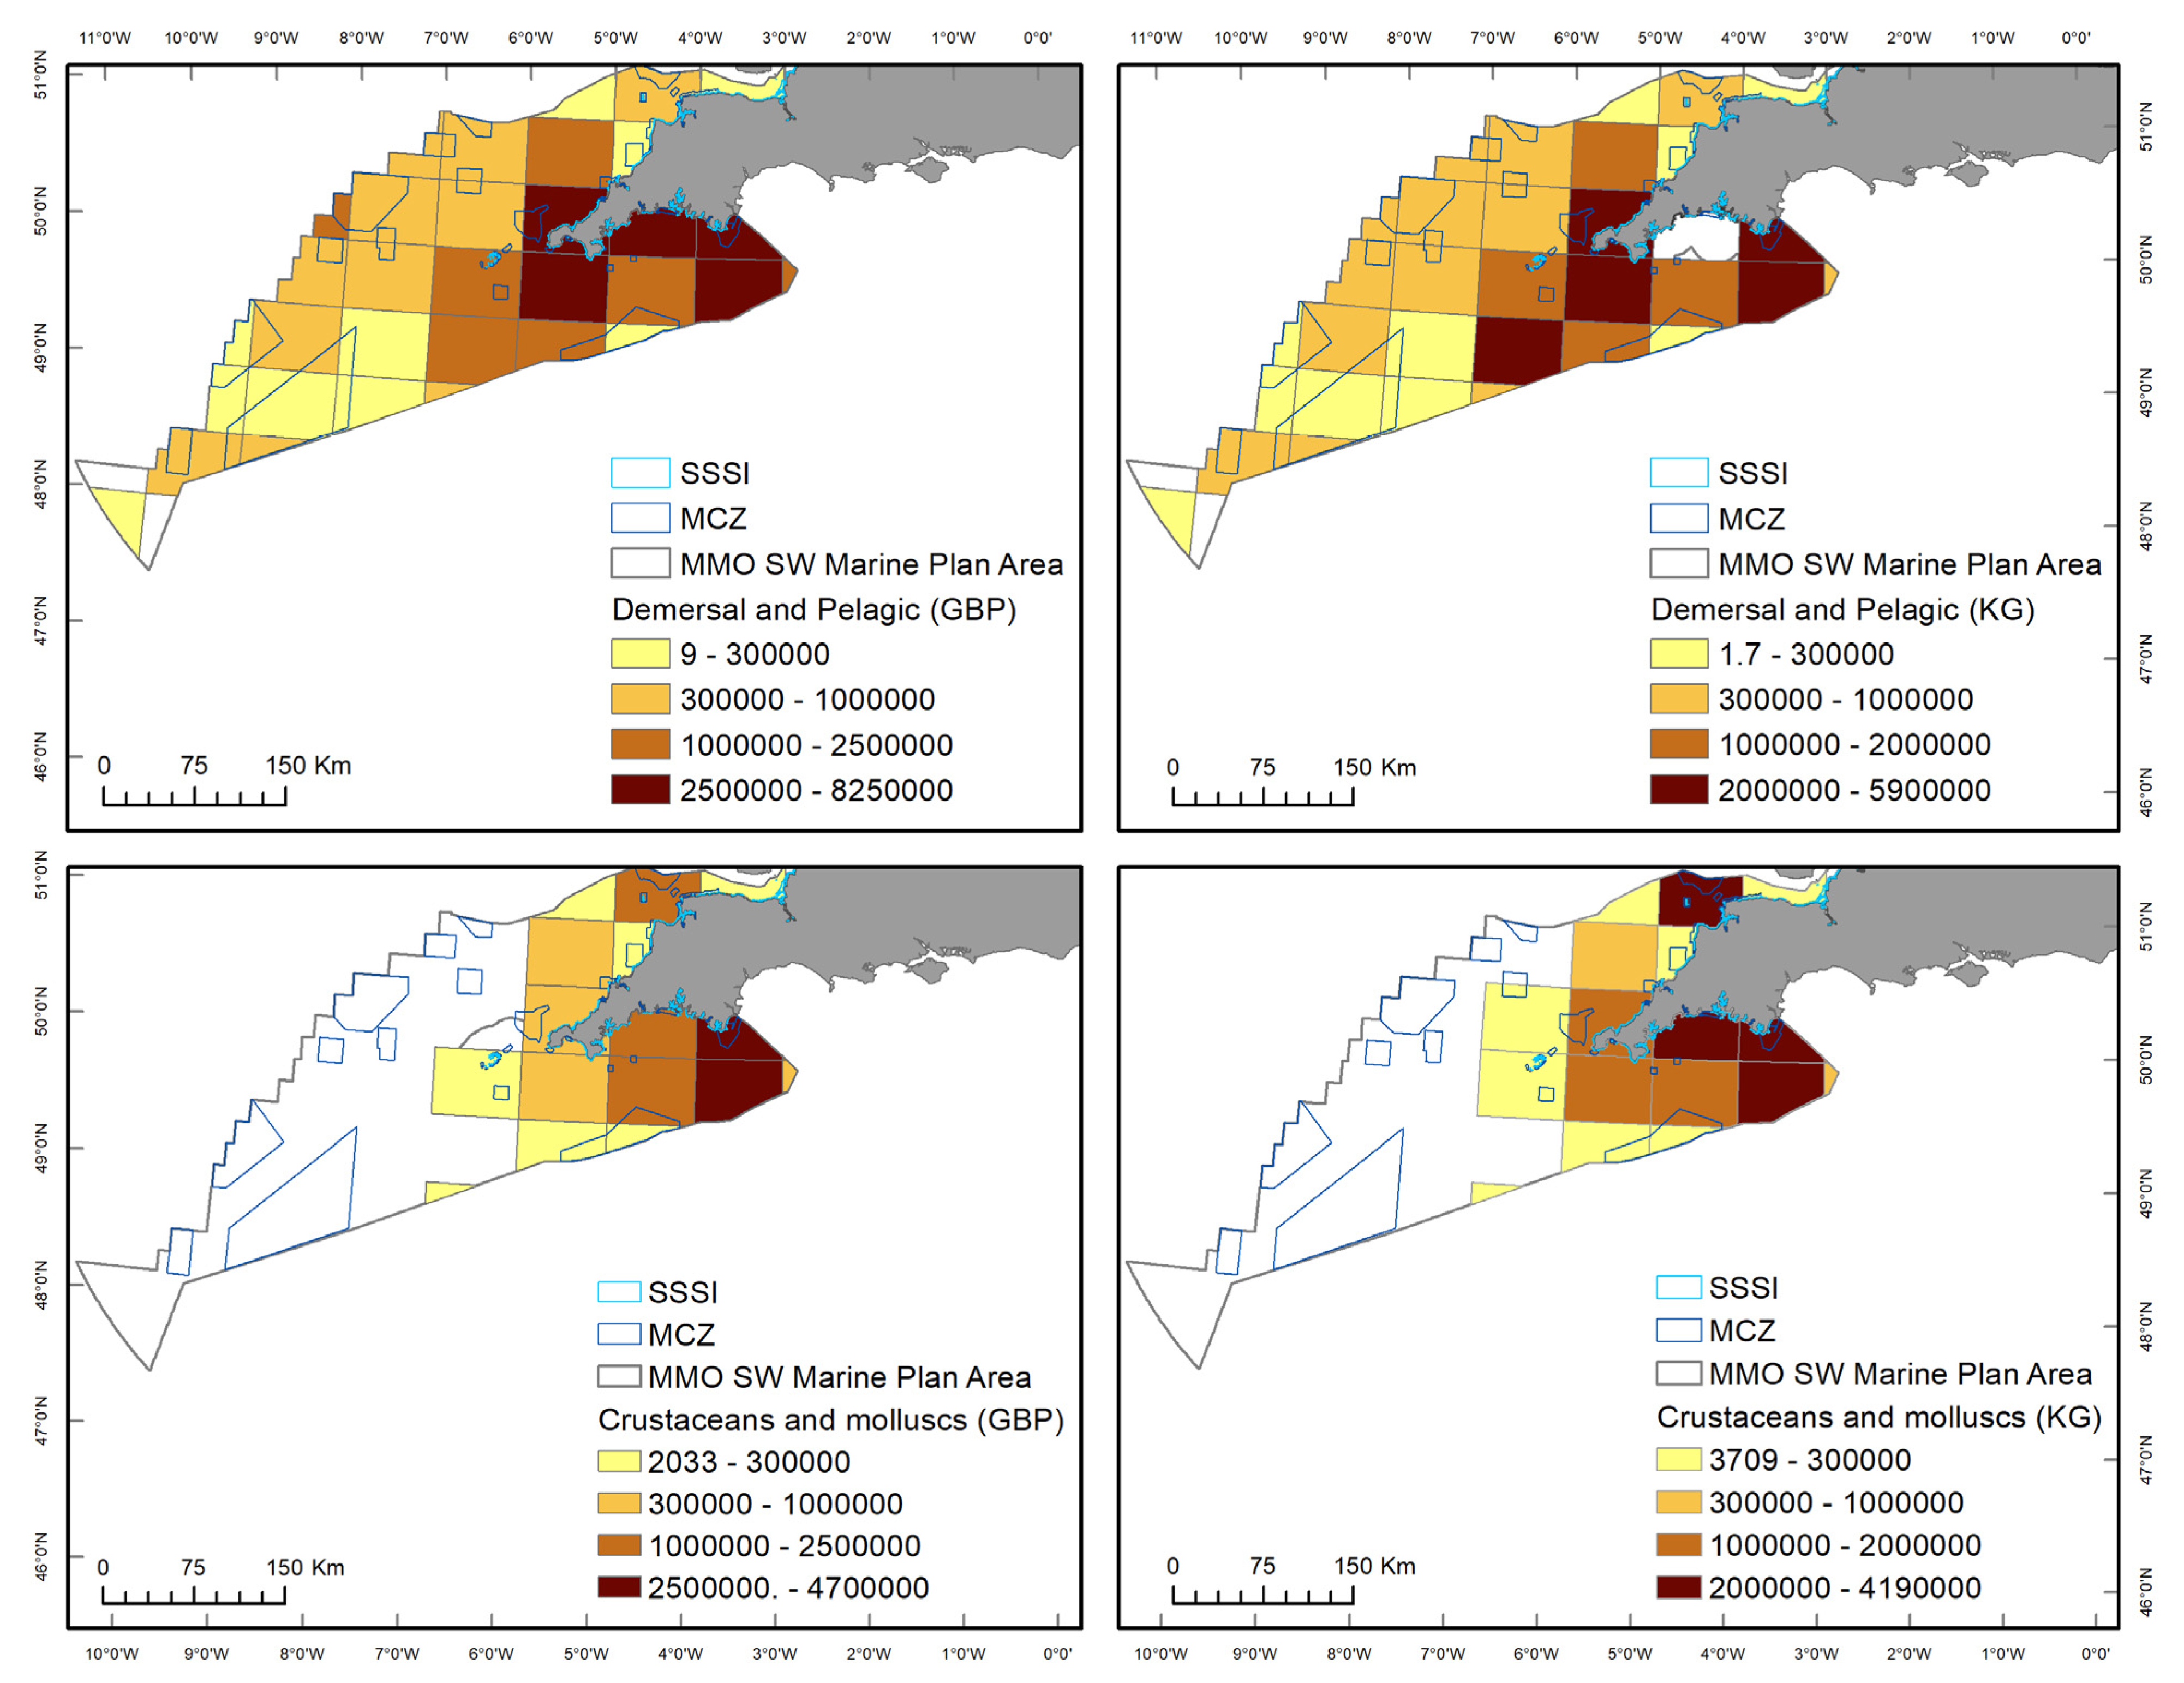
5.4. Food Provision
6. Discussion
7. Conclusions
Author Contributions
Funding
Acknowledgments
Conflicts of Interest
References
- Millennium Ecosystem Assessment. Ecosystems and Human Well-Being—Synthesis; Island Press: Washington, DC, USA, 2005. [Google Scholar]
- Fisher, B.; Turner, R.K.; Morling, P. Defining and classifying ecosystem services for decision making. Ecol. Econ. 2009, 68, 643–653. [Google Scholar] [CrossRef]
- Maes, J.; Egoh, B.; Willemen, L.; Liquete, C.; Vihervaara, P.; Schägner, J.P.; Grizzetti, B.; Drakou, E.G.; La Notte, A.; Zulian, G.; et al. Mapping ecosystem services for policy support and decision making in the European Union. Ecosyst. Serv. 2012, 1, 31–39. [Google Scholar] [CrossRef]
- Khan, J.; Din, F. UK Natural Capital–Freshwater Ecosystem Assets and Services Accounts; UK Statistics Authority: London, UK, 2015.
- Nordhaus, W.D. Climate Change Casino; Yale University Press: London, UK, 2014; Chapter 9; pp. 114–115. [Google Scholar]
- Burkhard, B.; Santos-Martin, F.; Nedkov, S.; Maes, J. An operational framework for integrated Mapping and Assessment of Ecosystems and their Services (MAES). One Ecosyst. 2018, 3, e22831. [Google Scholar] [CrossRef]
- Grêt-Regamey, A.; Sirén, E.; Brunner, S.H.; Weibel, B. Review of decision support tools to operationalize the ecosystem services concept. Ecosyst. Serv. 2017, 26, 306–315. [Google Scholar] [CrossRef]
- Kong, L.; Zheng, H.; Rao, E.; Xiao, Y.; Ouyang, Z.; Li, C. Evaluating indirect and direct effects of eco-restoration policy on soil conservation service in Yangtze River Basin. Sci. Total Environ. 2018, 631, 887–894. [Google Scholar] [CrossRef] [PubMed]
- Loc, H.H.; Diep, N.T.H.; Tuan, V.T.; Shimizu, Y. An analytical approach in accounting for social values of ecosystem services in a Ramsar site: A case study in the Mekong Delta, Vietnam. Ecol. Indic. 2018, 89, 118–129. [Google Scholar] [CrossRef]
- UK National Ecosystem Assessment. The UK National Ecosystem Assessment: Synthesis of the Key Findings; UNEP-WCMC; LWEC: UK, 2014; ISBN 978-92-807-3394-5. Available online: http://uknea.unep-wcmc.org/Resources/tabid/82/Default.aspx (accessed on 10 April 2020).
- Daily, G.C.; Polasky, S.; Goldstein, J.; Kareiva, P.M.; Mooney, H.A.; Pejchar, L.; Ricketts, T.H.; Salzman, J.; Shallenberger, R. Ecosystem services in decision making: Time to deliver. Front. Ecol. Environ. 2009, 7, 21–28. [Google Scholar] [CrossRef]
- Verutes, G.M.; Rosenthal, A. Using simulation games to teach ecosystem service synergies and trade-offs. Environ. Pract. 2014, 16, 194–204. [Google Scholar] [CrossRef]
- Chang, Y.C.; Hong, F.W.; Lee, M.T. A system dynamic based DSS for sustainable coral reef management in Kenting coastal zone, Taiwan. Ecol. Model. 2008, 211, 153–168. [Google Scholar] [CrossRef]
- Adame, M.F.; Hermoso, V.; Perhans, K.; Lovelock, C.E.; Herrera-Silveira, J.A. Selecting cost-effective areas for restoration of ecosystem services. Conserv. Biol. 2015, 29, 493–502. [Google Scholar] [CrossRef]
- Plantier-Santos, C.; Carollo, C.; Yoskowitz, D.W. Gulf of Mexico Ecosystem Service Valuation Database (GecoServ): Gathering ecosystem services valuation studies to promote their inclusion in the decision-making process. Mar. Policy 2012, 36, 214–217. [Google Scholar] [CrossRef]
- Yee, S.H.; Dittmar, J.A.; Oliver, L.M. Comparison of methods for quantifying reef ecosystem services: A case study mapping services for St. Croix, USVI. Ecosyst. Serv. 2014, 8, 1–15. [Google Scholar] [CrossRef]
- Turner, R.K.; Bateman, I.J.; Adger, W.N. Economics of Coastal and Water Resources: Valuing Environmental Functions; Springer: Dordrecht, The Netherlands, 2013. [Google Scholar]
- Can, Ö.; Alp, E. Valuation of environmental improvements in a specially protected marine area: A choice experiment approach in Göcek Bay, Turkey. Sci. Total Environ. 2012, 439, 291–298. [Google Scholar] [CrossRef] [PubMed]
- Wattage, P.; Glenn, H.; Mardle, S.; Van Rensburg, T.; Grehan, A.; Foley, N. Economic value of conserving deep-sea corals in Irish waters: A choice experiment study on marine protected areas. Fish. Res. 2011, 107, 59–67. [Google Scholar] [CrossRef]
- Nunes, P.A.; Van Den Bergh, J.C. Can people value protection against invasive marine species? Evidence from a joint TC-CV survey in the Netherlands. Environ. Resour. Econ. 2004, 28, 517–532. [Google Scholar] [CrossRef]
- Samples, K.C.; Bishop, R.C. Estimating the Value of Variations in Anglers’ Success Rates: An Application of the Multiple-Site Travel Cost Method. Mar. Resour. Econ. 1985, 2, 55–74. [Google Scholar] [CrossRef]
- Arin, T.; Kramer, R.A. Divers’ willingness to pay to visit marine sanctuaries: An exploratory study. Ocean Coast. Manag. 2002, 45, 171–183. [Google Scholar] [CrossRef]
- Gopalakrishnan, S.; Smith, M.D.; Slott, J.M.; Murray, A.B. The value of disappearing beaches: A hedonic pricing model with endogenous beach width. J. Environ. Econ. Manag. 2011, 61, 297–310. [Google Scholar] [CrossRef]
- Fleming, C.M.; Cook, A. The recreational value of Lake McKenzie, Fraser Island: An application of the travel cost method. Tour. Manag. 2008, 29, 1197–1205. [Google Scholar] [CrossRef]
- Ruiz-Frau, A.; Hinz, H.; Edwards-Jones, G.; Kaiser, M.J. Spatially explicit economic assessment of cultural ecosystem services: Non-extractive recreational uses of the coastal environment related to marine biodiversity. Mar. Policy 2013, 38, 90–98. [Google Scholar] [CrossRef]
- Lawrence, K.S. Assessing the value of recreational sea angling in South West England. Fish. Manag. Ecol. 2005, 12, 369–375. [Google Scholar] [CrossRef]
- Rees, S.E.; Rodwell, L.D.; Attrill, M.J.; Austen, M.C.; Mangi, S.C. The value of marine biodiversity to the leisure and recreation industry and its application to marine spatial planning. Mar. Policy 2010, 34, 868–875. [Google Scholar] [CrossRef]
- Chae, D.R.; Wattage, P.; Pascoe, S. Recreational benefits from a marine protected area: A travel cost analysis of Lundy. Tour. Manag. 2012, 33, 971–977. [Google Scholar] [CrossRef]
- Tyllianakis, E.; Grilli, G.; Gibson, D.; Ferrini, S.; Conejo-Watt, H.; Luisetti, T. Policy options to achieve culturally-aware and environmentally-sustainable tourism in Fiji. Mar. Pollut. Bull. 2019, 148, 107–115. [Google Scholar] [CrossRef] [PubMed]
- Armstrong, M.; Hyder, K. Sea Angling 2012—A Survey of Recreational Sea Angling Activity and Economic Value in England; Department for Environment Food and Rural Affairs: London, UK, 2013; p. 13.
- Jennings, S.; Lee, J. Defining fishing grounds with vessel monitoring system data. ICES J. Mar. Sci. 2012, 69, 51–63. [Google Scholar] [CrossRef]
- Lee, J.; South, A.B.; Jennings, S. Developing reliable, repeatable, and accessible methods to provide high-resolution estimates of fishing-effort distributions from vessel monitoring system (VMS) data. ICES J. Mar. Sci. 2010, 67, 1260–1271. [Google Scholar] [CrossRef]
- OSPAR. Eutrophication Status of the OSPAR Maritime Area. Second OSPAR Integrated ReportOSPAR: Publication 372. 2009. Available online: https://www.ospar.org/documents?v=7107 (accessed on 10 April 2020).
- Ekholm, P. N:P Ratios in Estimating Nutrient Limitation in Aquatic Systems; Finnish Environment Institute: 2008. Available online: https://www.cost869.alterra.nl/FS/FS_NPratio.pdf (accessed on 10 April 2020).
- Tol, R.S.J. The marginal damage costs of carbon dioxide emissions: An assessment of the uncertainties. Energy Policy 2005, 33, 2064–2074. [Google Scholar] [CrossRef]
- Nordhaus, W.D. Revisiting the social cost of carbon. Proc. Natl. Acad. Sci. USA 2017. [Google Scholar] [CrossRef]
- Department for Business Energy and Industrial Strategy. Valuation of Energy Use and Greenhouse Gas; Department for Business Energy and Industrial Strategy: London, UK, 2017.
- Mcleod, E.; Chmura, G.L.; Bouillon, S.; Salm, R.; Björk, M.; Duarte, C.M.; Lovelock, C.E.; Schlesinger, W.H.; Silliman, B.R. A blueprint for blue carbon: Toward an improved understanding of the role of vegetated coastal habitats in sequestering CO2. Front. Ecol. Environ. 2011, 9, 552–560. [Google Scholar] [CrossRef]
- Treasury, H.M. The Green Book: Appraisal and Evaluation in Central Government; OGL: London, UK, 2018. [Google Scholar]
- Beaumont, N.J.; Jones, L.; Garbutt, A.; Hansom, J.D.; Toberman, M. The value of carbon sequestration and storage in coastal habitats. Estuar. Coast. Shelf Sci. 2014, 137, 32–40. [Google Scholar] [CrossRef]
- Kenter, J.O.; Bryce, R.; Davies, A.; Jobstvogt, N.; Watson, V.; Ranger, S.; Solandt, J.L.; Duncan, C.; Christie, M.; Crump, H.; et al. The Value of Potential Marine Protected Areas in the UK to Divers and Sea Anglers; UNEP-WCMC: Cambridge, UK, 2013. [Google Scholar]
- Russ, G.R.; Cheal, A.J.; Dolman, A.M.; Emslie, M.J.; Evans, R.D.; Miller, I.; Sweatman, H.; Williamson, D.H. Rapid increase in fish numbers follows creation of world’s largest marine reserve network. Curr. Biol. 2008, 18, R514–R515. [Google Scholar] [CrossRef] [PubMed]
- Goñi, R.; Adlerstein, S.; Alvarez-Berastegui, D.; Forcada, A.; Reñones, O.; Criquet, G.; Valle, C.; Lenfant, P.; Bonhomme, P. Spillover from six western Mediterranean marine protected areas: Evidence from artisanal fisheries. Mar. Ecol. Prog. Ser. 2008, 366, 159–174. [Google Scholar] [CrossRef]
- Hoskin, M.G.; Coleman, R.A.; von Carlshausen, L. Ecological Effects of the Lundy No-Take Zone: The First Five Years (2003–2007). Report to Natural England, Defra and WWF-UK. 2009. Available online: https://www.landmarktrust.org.uk/globalassets/1-aa-new-responsive-site-images/website/lundy/discover-lundy/conservation/lundy-ntz.pdf (accessed on 10 April 2020).
- Giakoumi, S.; Scianna, C.; Plass-Johnson, J.; Micheli, F.; Grorud-Colvert, K.; Thiriet, P.; Claudet, J.; Di Carlo, G.; Di Franco, A.; Gaines, S.D.; et al. Ecological effects of full and partial protection in the crowded Mediterranean Sea: A regional meta-analysis. Sci. Rep. 2017, 7, 8940. [Google Scholar] [CrossRef] [PubMed]
- Mangi, S.C.; Rodwell, L.D.; Hattam, C. Assessing the impacts of establishing MPAs on fishermen and fish merchants: The case of Lyme Bay, UK. Ambio 2011, 40, 457. [Google Scholar] [CrossRef] [PubMed]
- Marine Management Organisation. South Inshore and South Offshore Marine Plan Areas: South Plans Analytical Report; Marine Management Organisation: Newcastle upon Tyne, UK, 2014. [Google Scholar]
- Institute of Fisheries Management. Sustainable Management of Sea Bass A Vulnerable Species in a Changing and Dynamic Climate; Technical Report; Institute of Fisheries Management: Hull, UK, 2014. [Google Scholar]
- Foster, N.M.; Hudson, M.D.; Bray, S.; Nicholls, R.J. Intertidal mudflat and saltmarsh conservation and sustainable use in the UK: A review. J. Environ. Manag. 2013, 126, 96–104. [Google Scholar] [CrossRef] [PubMed]
- Tyllianakis, E.; Callaway, A.; Vanstaen, K.; Luisetti, T. The value of information: Realising the economic benefits of mapping seagrass meadows in the British Virgin Islands. Sci. Total Environ. 2019, 650, 2107–2116. [Google Scholar] [CrossRef]
- Luisetti, T.; Turner, R.K.; Andrews, J.E.; Jickells, T.D.; Kröger, S.; Diesing, M.; Paltriguera, L.; Johnson, M.T.; Parker, E.R.; Bakker, D.C.; et al. Quantifying and valuing carbon flows and stores in coastal and shelf ecosystems in the UK. Ecosyst. Serv. 2019, 35, 67–76. [Google Scholar] [CrossRef]
- Maes, J.; Teller, A.; Erhard, M.; Grizzetti, B.; Barredo, J.I.; Paracchini, M.L.; Condé, S.; Somma, F.; Orgiazzi, A.; Jones, A.; et al. Mapping and Assessment of Ecosystems and Their Services: An Analytical Framework for Ecosystem Condition; Publications office of the European Union: Luxembourg, 2018. [Google Scholar]
- Hynes, S.; Tinch, D.; Hanley, N. Valuing improvements to coastal waters using choice experiments: An application to revisions of the EU Bathing Waters Directive. Mar. Policy 2013, 40, 137–144. [Google Scholar] [CrossRef]
- Johnston, R.J.; Besedin, E.Y.; Stapler, R. Enhanced geospatial validity for meta-analysis and environmental benefit transfer: An application to water quality improvements. Environ. Resour. Econ. 2017, 68, 343–375. [Google Scholar] [CrossRef]
- Tyllianakis, E.; Skuras, D. The income elasticity of Willingness-To-Pay (WTP) revisited: A meta-analysis of studies for restoring Good Ecological Status (GES) of water bodies under the Water Framework Directive (WFD). J. Environ. Manag. 2016, 182, 531–541. [Google Scholar] [CrossRef]


| Layer Name | Date | Description | Source |
|---|---|---|---|
| MCZ | 2016 | Polygon layers | Defra (https://data.gov.uk/) |
| SSSI | 2016 | Polygon layers | Defra (https://data.gov.uk/) |
| Sea anglers | 2012 | Sea anglers survey | Armstrong and Hyder [30] |
| Seabird nesting sites | 2010 | Point layer | JNCC (http://magic.defra.gov.uk/) |
| Protected wrecks | 2015 | Point and polygon layers | Historic England https://historicengland.org.uk/listing/what-is-designation/protected-wreck-sites/ |
| Saltmarsh | 2014 | Polygon layer | Environment Agency: https://data.gov.uk/dataset/saltmarsh-extents1 |
| VMS data and landings | 2013 | Polygon layer | CEDER database (hosted at Cefas, data owner MMO- IFISH database) |
| Biochemical layers (volume beam attenuation coefficient of radiative flux in sea water; mole concentration of dissolved oxygen in sea water; mole concentration of nitrate in sea water; mole concentration of phosphate in sea water; net primary productivity of carbon; concentration of chlorophyll in sea water) | 2003–2013 | Point layer | Model output from MyOcean http://www.copernicus.eu/projects/myocean |
| Initial Values | Value, Converted from Tonnes of CO2 (tCO2)) to tC | Source | Original Study Information | |
|---|---|---|---|---|
| Social Cost of Carbon | $93.00 | $93.00 | Tol, 2005 [35] | Mean estimate of all studies, tC |
| Social Cost of Carbon with Abatement Cost * | $31.20–101.20 | $114.50–371.40 | Nordhaus, 2017 [36] | tCO2, 2015 |
| Abatement cost * | £55.00–284.00 | £201.85–1042.28 | BEIS, 2017 [37] | Central, non-traded values, in 2009 GBP values, tCO2 equivalent (tCO2e) |
| MPA Number | MPA Name and Type |
|---|---|
| 1 | Aust Cliff (SSSI),Berrow Dunes (SSSI),Blue Anchor to Lilstock Coast (SSSI), Brean Down (SSSI), Bridgwater Bay (SSSI), Clevedon Shore (SSSI), Lower Cliff (SSSI), Lydney Cliff (SSSI), Middle Hope (SSSI), Pennsylvania Fields (SSSI), Portishead Pier to Black Nore (SSSI), Purton Passage (SSSI), River Wye (SSSI), Severn Estuary (Ramsar, SSSI), Shorn Cliff and Caswell Woods (SSSI), Spring Cove Cliffs (SSSI), Upper Severn Estuary (SSSI) |
| 2 | Skerries Band and Surrounds (MCZ), Bol Head to Bol Tail (SSSI), Hallsands- Beesands (SSI), Prawle Point and Start Point (SSSI), Salcombe Kingsbridge Estuary (SSSI) |
| 3 | Loe Pool (SSSI), Porthleven Cliffs (East) (SSSI), Tremearne Par (SSSI) |
| 4 | Wembury Point (SSSI), Yealm Estuary (SSSI), Plymouth Sound Shores and Cliffs (SSSI) |
| 5 | Upper Fower and Pont Pill (MCZ), Polruan to Polperro SSSI |
| 6 | Whitsand and Looe Bay (MCZ), Eglarooze Cliff (SSI), Rame head & Whitsand Bay (SSSI) |
| 7 | Bideford to Foreland Point (MCZ), Taw Torridge Estuary (MCZ), Hartland Point to Tintagel (MCZ), Barricane Beach (SSSI), Boscastle to Widemouth (SSSI), Braunton Burrows (SSSI), Bude Coast (SSSI), Duckpool to Furzey Cove (SSSI), Exmoor Coastal Heaths (SSSI), Fremington Quay Cliffs (SSSI), Hele, Samson’s and Combe Martin Bays (SSSI), Hobby to Peppercombe (SSSI), Marsland to Clovelly Coast (SSSI), Mermaid’s Pool to Rowden Gut (SSSI), Mill Rock (SSSI), Morte Point (SSSI), Northam Burrows (SSSI), Saunton to Baggy Point Coast (SSSI), Steeple Point to Marsland Mouth (SSSI), Taw-Torridge Estuary (SSSI), Tintagel Cliffs (SSSI), West Exmoor Coast and Woods (SSSI) |
| 8 | Newquay and The Gannel (MCZ), Cligga Head (SSSI), Godrevy Head to St Agnes (SSSI), Gwithian to Mexico Towans (SSSI), Hayle Estuary & Carrack Gladden (SSSI), Kelsey Head (SSSI), Penhale Dunes (SSSI), Trevaunance Cove (SSSI) |
| 9 | Padstow Bay and Surrounds (MCZ), Bedruthan Steps and Park Head (SSSI), Harbour Cove (SSSI), Pentire Peninsula (SSSI), Rock Dunes (SSSI), Stepper Point (SSSI), Trebetherick Point (SSSI), Trevone Bay (SSSI), Trevose Head and Constantine Bay (SSSI) |
| MPA Number | WTPuse | WTPuse Aggregated | WTP Normalised | TOTAL WTP |
|---|---|---|---|---|
| 1 | −2.9 | −96.4 | 178.1 | 5875.6 |
| 2 | −1.5 | −15.3 | 179.4 | 1794.4 |
| 3 | 0.1 | 0.2 | 181.0 | 543.1 |
| 4 | −0.2 | −0.6 | 180.8 | 542.3 |
| 5 | −0.6 | −1.1 | 180.4 | 360.8 |
| 6 | −0.8 | −1.5 | 180.2 | 360.4 |
| 7 | −1.4 | −2.8 | 179.6 | 359.1 |
| 8 | −0.4 | −0.4 | 180.6 | 180.6 |
| 9 | −8.5 | −8.5 | 172.5 | 172.5 |
| Valuation Method | Value, £ | 2014 Only | Cumulative for 25 Years | Cumulative for 50 Years | |
|---|---|---|---|---|---|
| Scenario 1: nothing changes at all | SCC (Tol [35]) | 54.0 | £16,446 | £287,493 | £419,712 |
| SCC (Nordhaus [36]) | 55.0–284.0 | £23,491 | £546,076 | £1,034,642 | |
| AC (BEIS [37]) | 21.0–68.2 | £61,483 | £1,395,527 | £3,240,355 | |
| Scenario 2: saltmarsh area is lost mostly because of sea-level rise, coastal erosion, and reduced sediment supply (i.e., 1% annual loss of saltmarsh habitat area) | SCC (Tol [35]) | 54.0 | £16,446 | £259,166 | £350,766 |
| SCC (Nordhaus [36]) | 55.0–284.0 | £23,491 | £485,517 | £817,715 | |
| AC (BEIS [37]) | 21.0–68.2 | £61,483 | £1,235,749 | £2,493,931 | |
| Scenario 3: Continuous population growth claiming saltmarsh areas coupled with climate change (i.e., 2% annual loss of saltmarsh habitat area) | SCC (Tol [35]) | 54.0 | £16,446 | £234,649 | £298,189 |
| SCC (Nordhaus [36]) | 55.0–284.0 | £23,491 | £433,530 | £659,579 | |
| AC (BEIS [37]) | 21.0–68.2 | £61,483 | £1,099,669 | £1,958,767 |
© 2020 by the authors. Licensee MDPI, Basel, Switzerland. This article is an open access article distributed under the terms and conditions of the Creative Commons Attribution (CC BY) license (http://creativecommons.org/licenses/by/4.0/).
Share and Cite
Tyllianakis, E.; Fronkova, L.; Posen, P.; Luisetti, T.; Chai, S.M. Mapping Ecosystem Services for Marine Planning: A UK Case Study. Resources 2020, 9, 40. https://doi.org/10.3390/resources9040040
Tyllianakis E, Fronkova L, Posen P, Luisetti T, Chai SM. Mapping Ecosystem Services for Marine Planning: A UK Case Study. Resources. 2020; 9(4):40. https://doi.org/10.3390/resources9040040
Chicago/Turabian StyleTyllianakis, Emmanouil, Lenka Fronkova, Paulette Posen, Tiziana Luisetti, and Stephen Mangi Chai. 2020. "Mapping Ecosystem Services for Marine Planning: A UK Case Study" Resources 9, no. 4: 40. https://doi.org/10.3390/resources9040040
APA StyleTyllianakis, E., Fronkova, L., Posen, P., Luisetti, T., & Chai, S. M. (2020). Mapping Ecosystem Services for Marine Planning: A UK Case Study. Resources, 9(4), 40. https://doi.org/10.3390/resources9040040