Dominant Consumer Attitudes in the Sharing Economy—A Representative Study in Hungary

1
Faculty of Economics and Social Sciences, Szent István University, H-2100 Gödöllő, Hungary
2
Department of Marketing, Corvinus University of Budapest, H-1093 Budapest, Hungary
*
Author to whom correspondence should be addressed.
Resources 2020, 9(1), 1; https://doi.org/10.3390/resources9010001
Submission received: 24 November 2019
/
Revised: 19 December 2019
/
Accepted: 23 December 2019
/
Published: 27 December 2019
(This article belongs to the Special Issue Circular Use of Resources - Theoretical and Practical Approaches of Sustainable Technologies, Business Models and Organizational Innovations)
Abstract
:As a result of the digital revolution, new business models are emerging, and one of the most dynamic is the sharing economy. In many cases, the strategic communication of sharing economy firms is linked to current socio-economic trends, such as digital innovation, consumers’ empowerment, experience gaining (instead of stock), environmental awareness, and community building. In our research (a nationwide representative sample of 3520), we aimed to determine how open the Hungarian population is toward sharing economy services. Furthermore, we explored the relationship between openness and consumers’ socio-demographic factors, attitudes related to the current consumer trends and Internet usage habits. As a result, we found that 38.4% of the Hungarian population is open toward sharing economy services. From a socio-demographic point of view, wealthy, metropolitan, family-oriented, educated, and younger people are more open toward sharing activities. In terms of consumer attitudes, people who take risks, like having a social life, are environmentally and health conscious, spend their leisure time actively, enjoy quality things, and have a positive attitude toward digitalization are more open to using the sharing economy services. As a final result of the regression modeling, we found that the examined consumer attitudes and Internet usage habits determine openness, but socio-demographic factors largely lose their significant effect, except for generation and wealth, in the case of the integrated model. Our results show that a well-defined and relatively large segment is open to the sharing economy, and sharing economy companies could target them directly to achieve a more sustainable environment.
1. Introduction
The sharing economy is playing an increasingly important role in our daily lives, and there is a blurring of lines between the personal and commercial assets, consumers and producers [1]. Centuries ago, sharing activities could be found in society [2], and the question now is why this phenomenon began to grow dynamically. Many factors are contributing to this growth, but the development of digital technologies must be emphasized [3,4]. As a result of the digital revolution, people in the online space can find, pay for, and value each other’s activities easily and quickly.
The sharing economy is present in every part of our lives, be it work or leisure. About a decade ago, sharing activities emerged that were later classified by the literature as part of new business activity. The best-known examples are Airbnb [5], which appears in the accommodation market, Uber in the passenger transport market [6], crowd-funding in the financing area [7], and TaskRabbit in the labor hire sector [8]. The phenomenon of the sharing economy or collaborative consumption can support sustainable consumption [8,9,10,11,12] which could have also long-term impacts. One of the benefits of sustainable consumption is the reduction of waste, and this is one way of effectively feeding back to consumers the direct relationship between consumption and waste production [13].
Many factors must contribute to the success of a new business model. In this study, we are looking for the reasons why consumers are increasingly choosing these types of services, and the factors that influence the consumers’ openness to these new, alternative business models. Consumer behavior is most influenced by external impacts. These are part of marketing origin and are determined by the company’s strategy. On the other hand, the wider environment also influences consumer decisions, such as cultural and social factors, reference groups, and personal factors. Thirdly, there are socio-economic trends related to as sustainability, social networks, digitalization, and globalization that also influence consumer behavior [14,15,16].
In our research, we looked for the consumer segments that are open toward sharing-based services. We analyzed openness in socio-demographic terms, consumer attitudes, and Internet usage habits. We assumed that the more sensitive segments of the socio-demographic trends would be more open toward sharing economy services, and we aimed to prove this hypothesis.
2. Literature Background
A few years ago, the sharing economy was defined the following way: “In the sharing economy users share with each other their idle capacities and resources (e.g., fixed assets, services, money), on an on-demand basis (as and when the consumer need arises), usually via an IT platform, on the basis of trust, ascribing particular importance to personal interaction and the community experience, with an eye on sustainability” [17].
In recent years, new elements or expressions of the sharing economy have emerged, highlighting different dimensions or major features of the phenomenon. It was written about by Botsman and Rogers firstly in a widespread book in 2010 called ‘Collaborative Consumption’ [18]. They wrote about sharing and redistribution activities among individuals. In 2011, Gansky wrote about a new corporate model called the ‘mesh economy’, in which he encouraged companies to share instead of selling (for example, in the automotive industry) [19]. Bardhi and Ekhard [20] formulated the spread of ‘access-based consumption’, where consumers prefer access to goods and are willing to pay for the possibility of temporary access rather than buying and owning the good. The term ‘sharing economy’ was first used by Friedman in 2013 [21]. Curtis and Lehner concluded the following characteristics, or semantic properties, of the sharing economy for sustainability: “ICT-mediated, non-pecuniary motivation for ownership, temporary access, rivalrous and tangible goods” [22]. Since 2015, the concept of the circular economy has come to the attention of European Union policymakers, and one of the model solutions to achieving this could be the sharing economy. Models of western Europe and east-central Europe may differ in several factors, but the size of the EU provides an opportunity to revise circular processes [23]. The phenomenon is constantly evolving and changing and therefore different dimensions can be distinguished. The first dimension is the subject of sharing, which could be physical goods (car, apartment) or non-physical goods (time, knowledge, money). The second dimension: differentiate between C2C (or peer to peer), B2C, or C2B models. The third dimension states that from monetization’s point of view, we can observe, barter, or use business models in financial exchange [8]. In various combinations of these dimensions, we can find businesses that place themselves under the auspices of the sharing economy.
The sharing economy can be analyzed from a variety of scientific perspectives. From an economics’ point of view, the sharing economy has a stimulating effect on competition and can be seen as a form of economic innovation [24,25]. From a business economics’ point of view, the phenomenon is mentioned as a new business model [26,27], which is a kind of competitor to the enterprises operating in the traditional business model. In the new business model, the value proposition of the company who is operating the platform is to effectively combine supply and demand (a peer-to-peer business model). The value proposition is one of the main elements of the business models, next to the partner network, resources, distribution network, market segment, and value configuration [28]. Further studies have referred to the sharing economy as a new innovative business model that could be used as a potential tool for corporate sustainability [11,29] or as a resource-saving potential that which can change consumer patterns [12]. Most of the criticisms of the sharing economy come from the tax and legal perspective. Most experts agree that new, innovative activities should also be regulated, but there are differences of opinion regarding the depth of regulation. Some experts favor unified regulation for companies in a similar industry [30], while others argue that regulation should distinguish between traditional and new models [31,32,33]. From a human resource management perspective, we are also seeing a new phenomenon that is increasingly being called the ‘gig economy’ [34]. Within the gig economy, employees are not employing full-time (or even part-time) employees in the traditional, long-term contracted way, but are engaging freelancers, typically through an online platform, occasionally. Freelancers typically share their knowledge and/or time (as a graphic designer, web-designer, etc.). The advantages include flexible working hours and the possibility of working from home. [35,36], while the disadvantages are a lack of advocacy and social networking [37]. Kallenberg and Dunn [38] make the points that the gig economy opens up new opportunities. It is thought that casual workers still make up only a small percentage of the total workforce, but the gig economy may have important implications for the future. In a knowledge-based economy, intellectual capital is one of the most important factors that can help a company grow and be a success [39], and the gig economy supports the free flow of intellectual capital. Additionally, many experts believe the basic elements of social security (minimum wage, health care, retirement, and unemployment insurance) should be also available to gig economy workers. In many countries, there are critical issues of human resource management in the central and non-central regions [40], and the gig economy can potentially solve at least one part of the problem. From a sociological point of view, the changing behavior of consumers can be analyzed [24], and there is already a proposal for transformation towards sustainable consumption, called the sustainable consumption and production (SCP) transformation model [41]. A further suggestion is to engage users in innovation to develop a user integrated sustainable product service system (PSS) [42]. One of the biggest challenges today is to convince society to change its habits, to achieve growth to be sustainable, from an economic, social, and environmental point of view. This is an interesting challenge from a marketing point of view as well. Several marketing studies have identified the preferences and motivation of consumers who participate in the sharing economy, which include, among others, economic gains, enjoyment of the activity, sustainability, utility, familiarity [43,44].
Schor’s study summarizes the critiques areas of the sharing economy, including sustainability, building a social community, taxation, insurance, and labor conditions, but she also notes that critics are too cynical sometimes and there are many opportunities in this new business model that are gaining ground [45].
2.1. The Relationship between Consumer Behavior and the Sharing Economy
This study aimed to investigate the extent to which the sharing economy affects consumer behavior and/or how expectations arising from changing consumer behavior meet the perceived or real characteristics of the sharing economy. In several cases, companies in the sharing economy have used communication keywords that are in line with current socio-economic trends (local space, environmental protection, experience, community, sustainability, etc.). We assume that companies in the sharing economy can succeed, among other things, because related services support current consumer expectations that are driven by megatrends. We assume that those people who are more open to using sharing economy services are also more sensitive to megatrends. Megatrends are trends related to global phenomena that have a significant impact on our daily lives over a long time horizon of 10–15 years [46]. Trends could be related to social, technology, and economy changes. From the perspective of the research topic, the following trends can influence consumer behavior: ICT (Information and Communication Technology) trends (empowering consumers), well-being society (consuming experiences instead of materials, need for self-realization), the eco-paradigm and sustainability (environmental sensitivity), globalization and urbanization.
2.1.1. ICT Trends
The information revolution enabled the rapid flow of information and ideas. The number of digital platforms and devices is exponentially growing [17]. There is not only one-way communication between companies and consumers anymore, but also two-way communication (more interactivity from the consumers side), and furthermore, consumers can communicate with each other on social networking sites [47]. According to Prahalad and Ramaswamy [48], several aspects can be observed in terms of the spread of the Internet and these also influence consumer behavior, for example, wide access to information, global vision, networking, and experimentation (product development, knowledge sharing). The progression of the sharing economy is based on the existence of the digital platforms and, within that, both on the demand and supply side, consumers can easily interact with each other. Due to the digital revolution, people are operating both in real and virtual space: consumer participation is growing, and consumer collaboration is gaining ground [49,50]. The possibility of virtual connection leads to the creation of new communities, allowing them to think together without face-to-face meetings. This growth in consumer power is also important from the sharing economy’s point of view, and the digital community is gaining strength. A good example is crowd-funding, which is a new form of financing. In these cases, the implementation of a start-up company is not funded by a financial institution but by individuals. Furthermore, we can highlight another aspect of community power by developing open-source software and/or products. In the case of this activity, individuals share their knowledge. Knowledge and money sharing are usually classified as a sharing economy if there is an economic interest in the activity.
2.1.2. Impact of the Well-Being Society
To understand consumer behavior, it is important to recognize the level of the target groups using Maslow’s pyramid (physiological needs, safety and security, love and belonging, self-esteem, and self-realization). Experiences lie at the top of Maslow’s pyramid of need [51,52]. Due to the ever-changing environmental, technological, and sociological conditions, the significance of experiences is changing; the experience is becoming more and more important in the lives of consumers [53]. We can identify different areas of experience: entertainment, education, desire to escape, and esthetic experience [54] Furthermore, Uriely [55] notes the blurring of the perception of the differences between work and leisure. Typical motivational factors for traveling in a welfare society are: widening horizons, learning something new, enjoying communication with others, promoting creativity and openness, individual risk-taking, and experimentation [32]. Interpersonal sharing activities can be a new experience for many consumers, and this is something we are exploring in our research.
2.1.3. Eco-Trends and Sustainability
The focus was on sustainable development in 1987, when the United Nations World Commission on the Environment and Development published their work entitled ‘Our Common Future’ [56]. Here we find the definition that is still used today by many: “Sustainable development is development that meets the needs of the present without compromising the ability of future generations to meet their own needs”. There are three pillars to sustainable development, namely the economic, environmental, and social pillars. [57] Consumers sensitive to sustainable development are striving to become sustainable consumers, which has created the concept of conscious consumption. This may be related to the consumer’s self-interest (price awareness, quality awareness, health awareness), or the interests of the public and society (environmental awareness, social awareness). Within this, we can identify the LOHAS target group, which is an environmentally and health conscious group (LOHAS = lifestyle of health and sustainability) [58], they are playing an increasingly dominant segment in many markets [59]. Sustainable consumption is increasingly important, including understanding the needs of consumers and persuading consumers. In the case of a vehicles’ purchase, for example, it is an important factor that the consumer centric total cost of ownership could be cheaper compared to internal combustion engine vehicles and hybrid electric vehicles. [60] It is important to point out that several studies have confirmed that there is a difference between an eco-friendly attitude and real action [43,61]. Activities in the sharing economy basically might be a solution that can both support the right business model towards eco-friendly activities, and support the prevention of overproduction and/or overconsumption. We assume there is a connection between the conscious consumer’s behavior, and the same consumer’s openness toward the sharing economy.
2.1.4. Globalization and Urbanization
The globalization of markets has now become a reality including for standardized consumer products, multinational commercial cooperation, and distribution [62]. It has also impacted the tourism industry; tourists receive standardized services at the hotels in most places, and standardized products in many cities [63]. It affects consumer behavior as a counter-trend; sooner or later consumers will need individual, non-standardized products and services, and they will want to learn about local culture and local customs.
To sum up, there are some typical characteristics of consumers who have more of an affinity for social, technology, and economic trends: they like to be broadly informed, to be in the community (even virtually), focused on experiences, to be environmentally aware, and they prefer uniqueness and local characteristics.
2.2. Strategies and Communication Messages of Companies Operating in the Sharing Economy
In the following, we present the activities of some companies involved in the sharing economy and their communication strategies. Our aim is to show that companies in the sharing economy emphasize features in their marketing strategy and, consequently, in their communication that attract the attention of trend-sensitive consumers and thus make them more open to trying out new/alternative services. In recent years, there has been intense competition between companies in the sharing economy and those who are operating in the traditional industry. Typical examples could be the hotels versus Airbnb competition in the accommodation market, and the taxi companies versus Uber in the passenger carrier market. It has to be emphasized because, due to the reduction in transaction costs, a significant number of companies in the sharing economy are able to provide their services at a more affordable price (versus companies in the same industry), and this is the primary consumer motivation to use them [43,64], however communication strategy typically does not call attention to discount pricing, but to other attributes that fit consumer trends. Because of the combined effect of many factors, the sharing economy can be very successful, and technology-driven development is only one of many factors.
Airbnb is focusing on an authentic, local experience. Adventure tourism is becoming more widespread, and tourists, more and more, are seeking unique impressions. In 2015, a survey confirmed the fact, with 86% of Airbnb users saying they had used Airbnb because of encounters with locals [65]. Uber is focusing on human relations, personal stories, and trying to influence people’s emotions. Lime is a vehicle sharing company in many countries, and their communication message is “sustainable—spanning countries & communities”. In one sentence, they target three different trends: the environment, community, and globalization. Starterkit is a crowd-funding association, but they never explain that they lend money to start-up companies. Their stated mission is to help bring creative projects to life. Kaptár is a co-working place for freelancers in the capital of Hungary. They use the following keywords: community, inspiration and freedom, and central location. They do not rent offices, but rather an opportunity to build relationships, experiences, and inspiration.
3. Material and Methods
We had multiple aims for this study: firstly, we examined the openness of Hungarian residents towards sharing economy services and how customers’ openness is affected by socio-demographic factors, different consumer attitudes (in particular, attitudes related to megatrends), and Internet usage habits. Based on our definition, those consumers who would use or definitely use or have already used sharing economy services are open toward sharing economy services; openness is willingness to participate. Secondly, we aimed to construct a logistic regression model, taking into account the factors identified above, to determine which attributes most influence openness toward sharing economy services, if we examine the effect of factors in a common model.
3.1. Consumers’ Openness; Correlation between Openness and Different Socio-Demographic, Attitudinal, and Internet Usage Patterns
The survey was conducted on a nationwide representative sample of 3520 people in December 2017 in Hungary. Data were collected through personal interviews with interviewers. Key examined demographic factors that were asked were gender, economic status, marital status, age (generation), education level of the respondents, place of residence, and financial status. A total of 47.1% of respondents were male and 52.9% were women. According to the economic status of respondents, 56.2% were active workers, 27.9% were retired, 8.5% were students, and 7.4% had an inactive and unemployed economic status. A total of 17.1% of respondents have lived in capital city (Budapest), 21% of the respondents live in the county seat or county town, 33.1% live in another town, and 28.8% of the respondents live in the municipality. The respondents’ financial situation was identified based on their assets and income. According to the classification, respondents were examined along with the following lines: lower (19.6%), lower-middle (20.7%), upper-middle (39.4%), and upper (20.2%). We also looked at the marital status of respondents. Here we have distinguished two categories, family and non-family status. Namely, the respondents with a child (ren) under 18 years were of family status. Based on this, 35.2% of respondents were the family category, while 64.8% of respondents fell into the non-family category. We also investigated the age of respondents: 3% of the respondents belonged to the Z generation (age 14–25), 37% to the Y generation (age 26–39), 31% to the X generation (age 40–59), and 28% to the Baby Boomers (age above 60). In terms of respondents’ educational qualifications: 21.5% of them had a maximum primary school education, 26.9% had vocational qualifications, 31.7% had graduated from grammar school, and 19.9% had a university or college diploma (see in Table A1 in Appendix A).
Openness towards the sharing economy was examined as follows. We listed six different sharing economy services, and since the familiarity with these types of services is not necessarily specific, we described for each service what and under what conditions the service is provided, and then named the most typical companies for that activity. We then asked if he/she had ever heard of the service or considered using it if it was available to them. The detailed questionnaire is attached in Appendix B.
Services in the questionnaire:
- Hotel reservation/accommodation (e.g., Airbnb, San Francisco, CA, USA).
- Intra-urban passenger transport (e.g., Uber, San Francisco, CA, USA).
- Ridesharing service between cities and/or countries (e.g., BlaBlaCar, Paris, France).
- Sharing an electric car within the city (e.g., GreenGo, Budapest, Hungary).
- Bike-sharing (e.g., MOL BUBI, Budapest, Hungary).
- Sharing household items within a local community (e.g., miutcank.hu, a virtual community, Budapest, Hungary).
The services were chosen arbitrarily, but we also relied on the results of our previous, non-representative study [43], in which the listed services were relatively well known.
In the next step in the analysis, we combined the responses and focused on how many people in Hungary are generally familiar with sharing economy services and how many would use these services. Based on this aggregated data, we formed two groups: (1) Acceptors; if respondent said ‘considers to use’, or ‘would definitely use’ or ‘have already used’—at least one service. In our study, ‘acceptors’ are those consumers who are open toward sharing economy services. (2) Refusers; who said in the case of each service that they ‘would definitely not use it’ or ‘probably not use it’.
We then examined whether there was a correlation between the respondents’ openness and different socio-demographic, attitudinal, and Internet usage patterns. We analyzed the effect of socio-demographic factors and attitudinal differences on openness to services by using a cross-table method and examined the effect of different Internet usage patterns on openness. The data were analyzed using SPSS software, version 23 (IBM Corp., Armonk, NY, USA).
Hypothesis 1 (H1).
From the socio-demographic data point of view, we assumed was that there is a correlation between examined socio-demographic factors and consumers’ openness toward sharing economy services.
From the consumer attitudes point of view, we assumed that those people who are more sensitive to current trends that impact consumer behavior are more open toward sharing economy services.
Hypothesis 2 (H2).
Environmentally and health conscious persons are more open toward sharing economy services.
Hypothesis 3 (H3).
Those people—who like to be in the community—are more open toward sharing economy services.
Hypothesis 4 (H4).
Those people who enjoy traveling while gathering experience are more open toward sharing services.
Hypothesis 5 (H5).
Those people who are willing to pay for quality things are more open toward sharing economy services.
Hypothesis 6 (H6).
Those people who believe that the digital world is a positive thing are more open to sharing economy services.
Hypothesis 7 (H7).
Finally, we examined the habits of Internet users more narrowly. Our hypothesis was that those people who use the Internet more often are more open to sharing economy services.
3.2. Logistic Regression Model
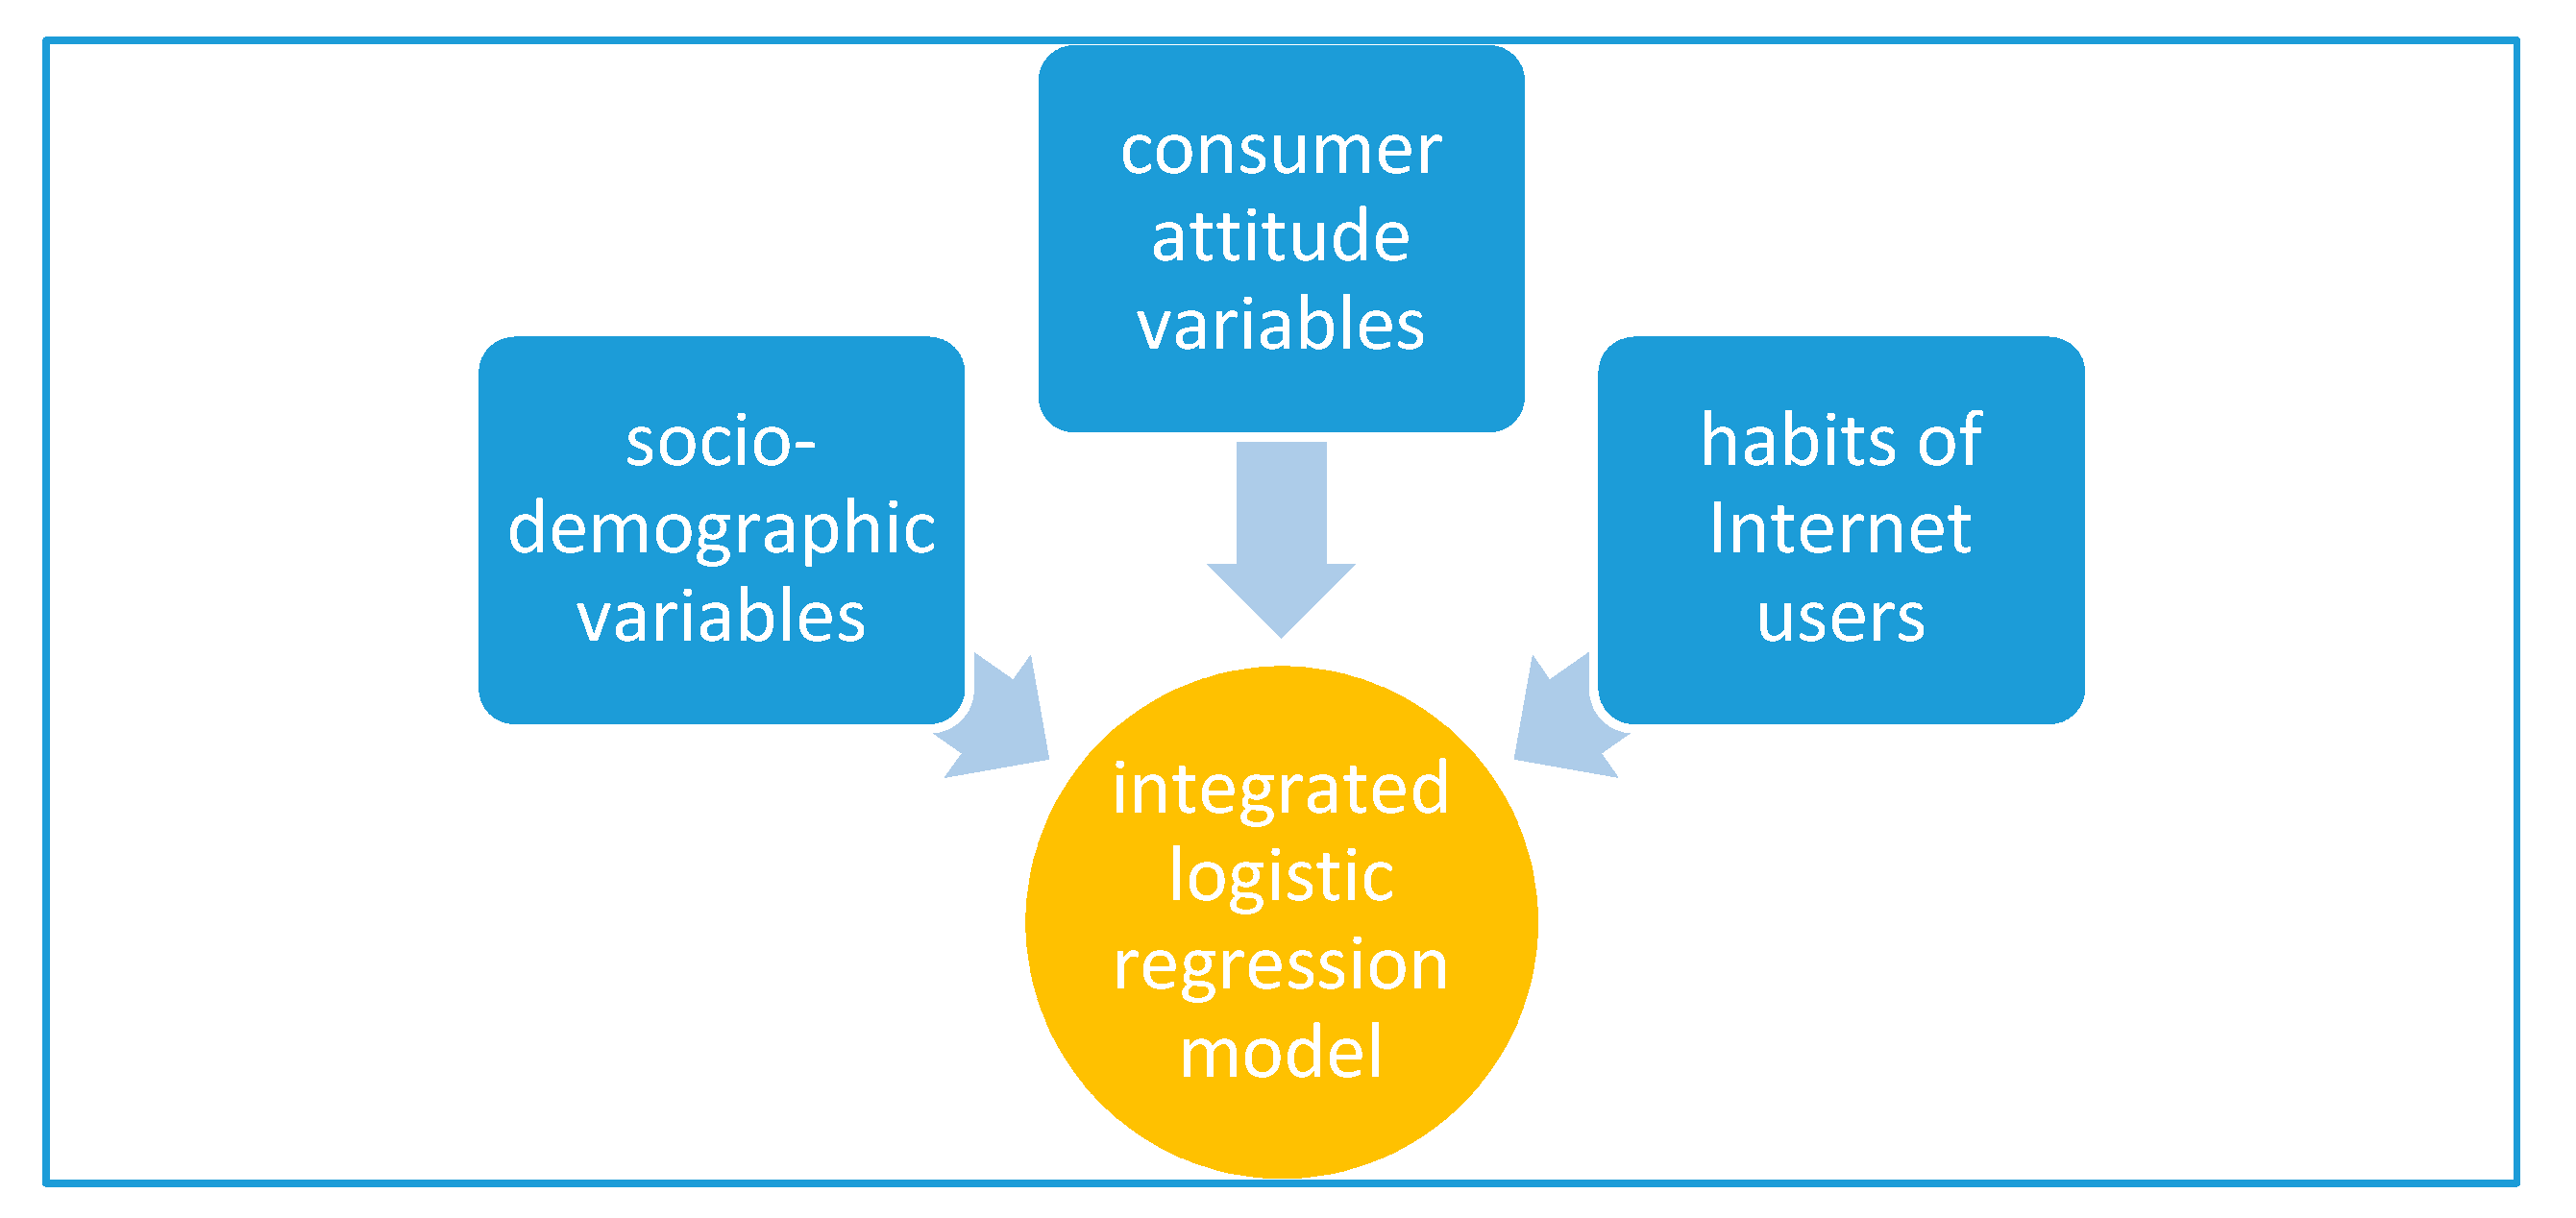
We constructed a logistic regression model. In this model, the dependent variable was openness. This assumes two values, that is, we classified people according to whether they are open (acceptor) or not. The explanatory variables (independent variables) were divided into three broad groups of the Internet user population: socio-demographic variables, attitude type variables, and a group describing Internet usage habits. We assumed that these various factors each have a significant effect on openness. At the current status, we did not test the correlation among the independent variable. In the final model, we examined if when these factors were taken into account together, which factors remained significant. This approach may, however, exclude potentially irrelevant factors from the model. The result will be a reduced version of the explanatory variables, which are the most important features of openness (Figure 1).
The national representative sample was reduced to the population using the Internet during the construction of the logistic regression model, because in most cases, sharing economy services can only be accessed using the Internet. The sample of Internet users is also representative of Hungarian Internet users. Within the total population, 49% of Internet users and only 11% of non-Internet users are open to this new type of service. If we had undertaken regression modeling for the entire population, then Internet users would have been most open to services and other attitudes would be been pushed into the background. Based on this, the demographic pattern of the Internet population was as follows: 2513 responded that they were engaged in activities on the Internet. Respondents were 48% male and 52% female. According to the economic status of the respondents, 70% were active workers, 11% were retired, 11% were students, and 7% had an inactive economic status (e.g., unemployed). A total of 35% of the respondents belong to the family category and 65% to the non-family category. We also looked at the age of the respondents; 24% of respondents belonged to Generation Z, 29% to Generation Y, 35% to Generation X, and 13% to the Baby Boomers. We also asked about the education of the respondents, according to which 12% of the respondents had primary education qualifications, 27% had a vocational education, 46% had graduated from grammar school, and 15% had a university or college diploma. A total of 19% of the respondents lived in Budapest, 23% in the county seat, 32% in the city, and 27% in the village. Their financial situation, based on their assets or their income, classified the respondents into four categories (lower, lower-middle, upper-middle, and upper). According to the classification, respondents were surveyed according to the following ratios: lower (16%), lower-middle (18%), upper-middle (43%), and upper (23%). This data is also available in Appendix A.
During the regression modeling, we distinguished two phases. In the first phase, three separate models were constructed: one examining demographic factors exclusively, one examining consumer attitudes, and one examining Internet usage habits. Throughout the modeling, we worked with the ENTER method (all independent variables are entered into the equation in (one step), also called “forced entry”), so we did not filter for significant factors. Finally, in the second phase, to compare the effect of each group of independent variables, we constructed a complex final logistic regression model involving all independent variables, the results of which are presented below.
4. Results
4.1. Openness
Analyzing the responses of the Hungarian nationally representative sample, we found that at least 12% of people are open to one of the sharing economy services. A total of 12.3% of respondents said they were open to borrowing and lending household appliances. The ratio of the respondents who are open toward different sharing economy services (respondents who said ‘would use’, or ‘would definitely use’, or ‘have already used’) is: 12.3% for borrowing or lending household appliances; 15.8% for public car-sharing (e.g., DriveNow, Munich, Germany); 23.7% for public car ride-sharing (e.g., BlaBlaCar, Paris, France); 21.5% for private car-sharing within the city (e.g., Uber, San Francisco, CA, USA); 23.2% for public bike-sharing; and 20.1% for private flat-sharing (e.g., Airbnb, San Francisco, CA, USA).
We then aggregated the data according to the methodology described above, into the ‘group of acceptors’ and ‘group of refusers’. Those who, for each question, answered that they would not use the service or may not use it, fell into the group of ‘refusers’. Everyone else fell into the ‘acceptors’ group. Based on this, 38.4% of the Hungarian population is open toward sharing economy services (11.3% open to one thing, 8.5% open to two things, 6% open to three things, 12.6% open to at least four), while 61.6% of the respondents are not open to sharing economy services.
4.1.1. Socio-Demographic Data versus Openness
The following socio-demographic features were examined: gender, economic status, marital status, age (generation), education, settlement type, and financial status of the respondent. Cross-table and pairwise correlation analyses were performed to determine whether socio-demographic factors influence openness (tested based on groups of acceptors and refusers).
Gender: the gender of respondents did not influence openness towards shared services. A total of 38.4% of the total sample was open toward sharing economy services (as acceptors), this included 39.8% of the men, and 37.1% of the women. The effect of gender is not significant (p = 0.095).
Economic status: Openness is overrepresented among active workers and students, with a significant relationship (p = 0.000, Chi2 = 318.4 df = 3, Cramer’s V = 0.301). While 38.4% of the total sample was open to sharing economy services, 46.7% of active employees and 56.8% of students were open to sharing economy services, meaning they were proportionally over-represented compared to the total sample. By contrast, only 15.5% of retirees were open to sharing economy services. Among the demographic factors examined in this study, the impact of this economic status was one of the strongest elements.
Family status: The family status of the respondent influences openness. Here, two categories were distinguished, namely, those respondents who had a minor child were considered as family subjects. The relationship is significant (p = 0.000, Chi2 = 48.346 df = 1, Cramer’s V = 0.117). We found that families are more open toward sharing economy services. While 38.4% of respondents in the full sample were open to the sharing economy services, 46% of respondents with a family were open to these service.
Generation: Belonging to particular generation influences openness. The correlation is significant, and it is the strongest influencing factor among the examined factors (p = 0.000, Chi2 = 361.001 df = 3, Cramer’s V = 0.320). The Baby Boomers is negative, 84% of this generation refuse sharing economy services (significantly overrepresented), compared to a rejection rate of the entire sample of 61.6%. Furthermore, we found that while 38.4% of the population in the total sample is open to shared services, the proportion of those showing openness within the Y and Z generations is higher (Y: 53.9%, Z = 52.4%), which means that these generations are much more open to using sharing economy services.
Education: Educational level influences openness. The effect is significant, though the relationship is weaker than the previous indicators (p = 0.000, Chi2 = 144.715, df = 3, Cramer’s V = 0.203). Within the group who are open to sharing economy services (38.4%), those who have a graduation or university diploma are overrepresented (group with graduation: 45.4%, group with a diploma: 50.8%).
Residence: We found that the type of place of residence of the respondent influences openness; the relationship is significant but weak (p = 0.000, Chi2 = 26.077 df = 3, Cramer’s V = 0.086). A total of 38.4% of respondents were open to shared services, in which 37% of Budapest residents, 45.5% of residents of towns and cities with county seats, 38.9% of residents of smaller towns and villages, and 33.6% of residents of villages are open. Based on this, residents of county seats and cities with county rights are the most open to using the sharing economy services.
Financial situation: We found that the financial situation influences openness. The respondents were classified into four categories (lower, lower-middle, upper-middle and upper) based on their financial position. As a result of the cross-table analysis, we found that the higher the income category of the respondent, the more open they were to sharing economy services. The effect is significant, and the association is moderately strong compared to the other demographic factors examined in the study (p = 0.000, Chi2 = 227.786 df = 3, Cramer’s V = 0.254). More than half (56.3%) of those in the upper class, 43% of the upper-middle class, 28.9% of the lower-middle income group, and only 20.8% of the lower income group were open to sharing economy services.
In conclusion, the socio-demographic factors examined (economic status, marital status, age (generation), educational attainment, type of settlement, and financial status) do indeed influence openness to shared services, and only the gender of the respondent (male/female) does not affect openness. Based on this, our original Hypothesis 1 was rejected because we assumed that all the examined socio-demographic data would influence the openness.
4.1.2. Consumer Attitudes versus Openness
Nearly forty questions related to consumers’ attitude were asked on the following topics: socio-relationships (extrovert vs. introvert, health and/or environmental awareness, risk-taking), leisure activities (frequency and type), product/service purchase attitude (price vs. quality), and attitudes toward the digital world. Factor analysis was performed on each of these four topics.
(1) Social Behaviors
The factor analysis resulted in thirteen observed variables aggregated into four factors. We identified the following factors: risk-taking factor, social factor, conscious factor, and recycling factor (Table 1).
In future analyses, we will use these factors in relation to social behavior.
(2) Leisure Activity
We identified the following factors: the simpler daily leisure factor (friends, entertainment, computer games), and the higher quality leisure factor (e.g., museums, traveling, wellness programs, gastronomy tours). The results are shown in Table 2.
(3) Attitudes Related to Willingness to Pay
We identified the following factors: the quality-sensitive factor and price-sensitive factor (Table 3). Quality-sensitive factor means that people are willing to pay for quality, while the price-sensitive factor means that people compare the prices of products and the possibilities, and may not always choose the better quality.
(4) Openness to the Internet
Finally, we looked at how people relate to the digital world and computers. Five questions were asked and only one factor was obtained using the factor analysis method. Related variables are presented in Table 4; we named this the digital factor.
After dimension reduction, the factors were specified, and we examined the relationship between factors and openness to the sharing economy using an independent sample t-test. After generating and naming the factors, we examined whether there was a difference in factor scores between acceptors versus refusers. To do this, we measured the average of each group and looked for significant differences. In the case of the original variables, a higher numerical value means that someone was using the given function and a lower numerical value means that someone does not use that function. In this case, a lower average value indicates that the given factor is less typical for the group. Similarly, a high average value in a group indicates that the group is characterized by the use of elements belonging to that factor. The openness variable classifies people into two categories, so we tested the significance of the difference in means with two-sample t-tests. When presenting the results, we indicate the average of the factors in parentheses.
From the social relationship point of view, those people who are more open toward sharing economy services are:
- -
- taking more risks (average of acceptors’ group: 0.2; average of refusers’ group: −0.13);
- -
- those who prefer social events and meeting unknown people (average of acceptors’ group: 0.07; average of refusers’ group: −0.05);
- -
- who are more health and environmentally conscious (average of acceptors’ group: 0.35; average of refusers’ group: 0.01).
We obtained a special result in terms of the recycling factor: average of acceptors’ group: −0.01; average of refusers’ group: −0.05. This means that the attitude toward recycling is similar for both groups. Here, we have to highlight that recycling attitude is only one element of environmentally and health conscious people’s attitudes.
Taking into consideration all the results Hypothesis 2 was accepted, environmentally and health conscious persons are more open toward sharing economy services.
From the point of view of leisure activity, those people who are more open toward sharing economy services are:
- -
- participating more often in a quality, active leisure activities, (average of acceptors’ group: 0.35; average of refusers’ group: −0.22);
- -
- likely to be off during the week (average of acceptors’ group: 0.47; average of refusers’ group: −0.3).
Based on the results, Hypothesis 3 was accepted: those people—who like to be in the community and relax with friends—are more open toward sharing economy services. Furthermore, Hypothesis 4 was also accepted: those people who enjoy traveling and collecting experiences are more open toward sharing services.
Concerning the pricing of products/services, those people who are more open toward sharing economy services are:
- -
- those who can and do pay for branded and/or quality and/or environmentally friendly products, (average of acceptors’ group: 0.46; average of refusers’ group: −0.28);
- -
- who are not price-sensitive, do not search through promotional ads, (average of acceptors’ group: 0.07; average of refusers’ group: −0.04).
Based on these results, Hypothesis 5 was accepted: those people—who are willing to pay for quality things—are more open toward sharing economy services.
Regarding the perception of the digital world, those people who are more open toward sharing economy services (among Internet users) are:
- -
- those who use the Internet, consider it as a part of their daily life, and buy online (average of acceptors’ group: 0.5; average of refusers’ group: −0.33).
Based on the results, Hypothesis 6 was accepted: those people—who believe that the digital world is a positive thing—are more open to sharing economy services.
Taking into consideration all the consumers’ attitudes which were examined in the questionnaire, we identified that the characteristics of the group of acceptors are similar and parallel to the specific features of current megatrends. There is one interesting exception: the attitude toward recycling is similar for both groups. The price sensitivity attitude is more typical of the refuser group, but this does not contradict our basic hypothesis, price sensitivity is not a feature of current megatrends. The summary diagram is shown in Figure 2.
4.1.3. Different Types of Internet Activities versus Openness (Subgroup, Analysis among Internet Users)
Internet activities could include simpler or more complex activities. We looked at the relationship between different Internet activities and openness (within the same two groups of acceptors and refusers). Of the total sample, 2534 used the Internet, and their answers were considered in the factor analysis.
In the questionnaire, 23 questions were asked about Internet activity. From these 23 variables, we created factors, by exploration, and there was no specified factor structure that we could confirm. Four factors were generated and the following indices were obtained: KMO (Kaiser-Meyer-Olkin) value is 0.909, which is above the expected value of 0.7, so the result is acceptable. The next item to consider was communality, where the value of each variable was above the threshold of 0.25, so no variables needed to be subtracted from the initial set of variables. The combined explanatory power is 49.36%, well above the expected level of 30%, so we consider the result acceptable.
The following names were given to the resulting factors:
Internet activities for entertainment—Related to the following Internet activities: on-line movie, streaming of films and series; downloading of films and series; downloading music; online radio listening; games; posts in forums.
Complex Internet activities—Related to the following Internet activities: on editing own blog; designing your website; home-based work; online photo hosting; on-line web hosting; e-learning.
Social Internet activities—Related to the following Internet activities: on online social sites; Internet chat, instant messaging programs; on-line video sharing; Internet phones, videophone.
Browsing, e-mail, purchase—Related to the following Internet activities: on work-related or private; browsing of websites (for information, entertainment); purchasing.
The results of the T-tests for the factors of Internet activity:
- entertainment factor (t = −10.116, df = 2112.266, p = 0.000);
- complex factor (t = −3.485, df = 2152.96, p = 0.001);
- social factor (t = −8.633, df = 2356.336, p = 0.000);
- browse—email–purchases (t = −8.843, df = 2360, p = 0.000).
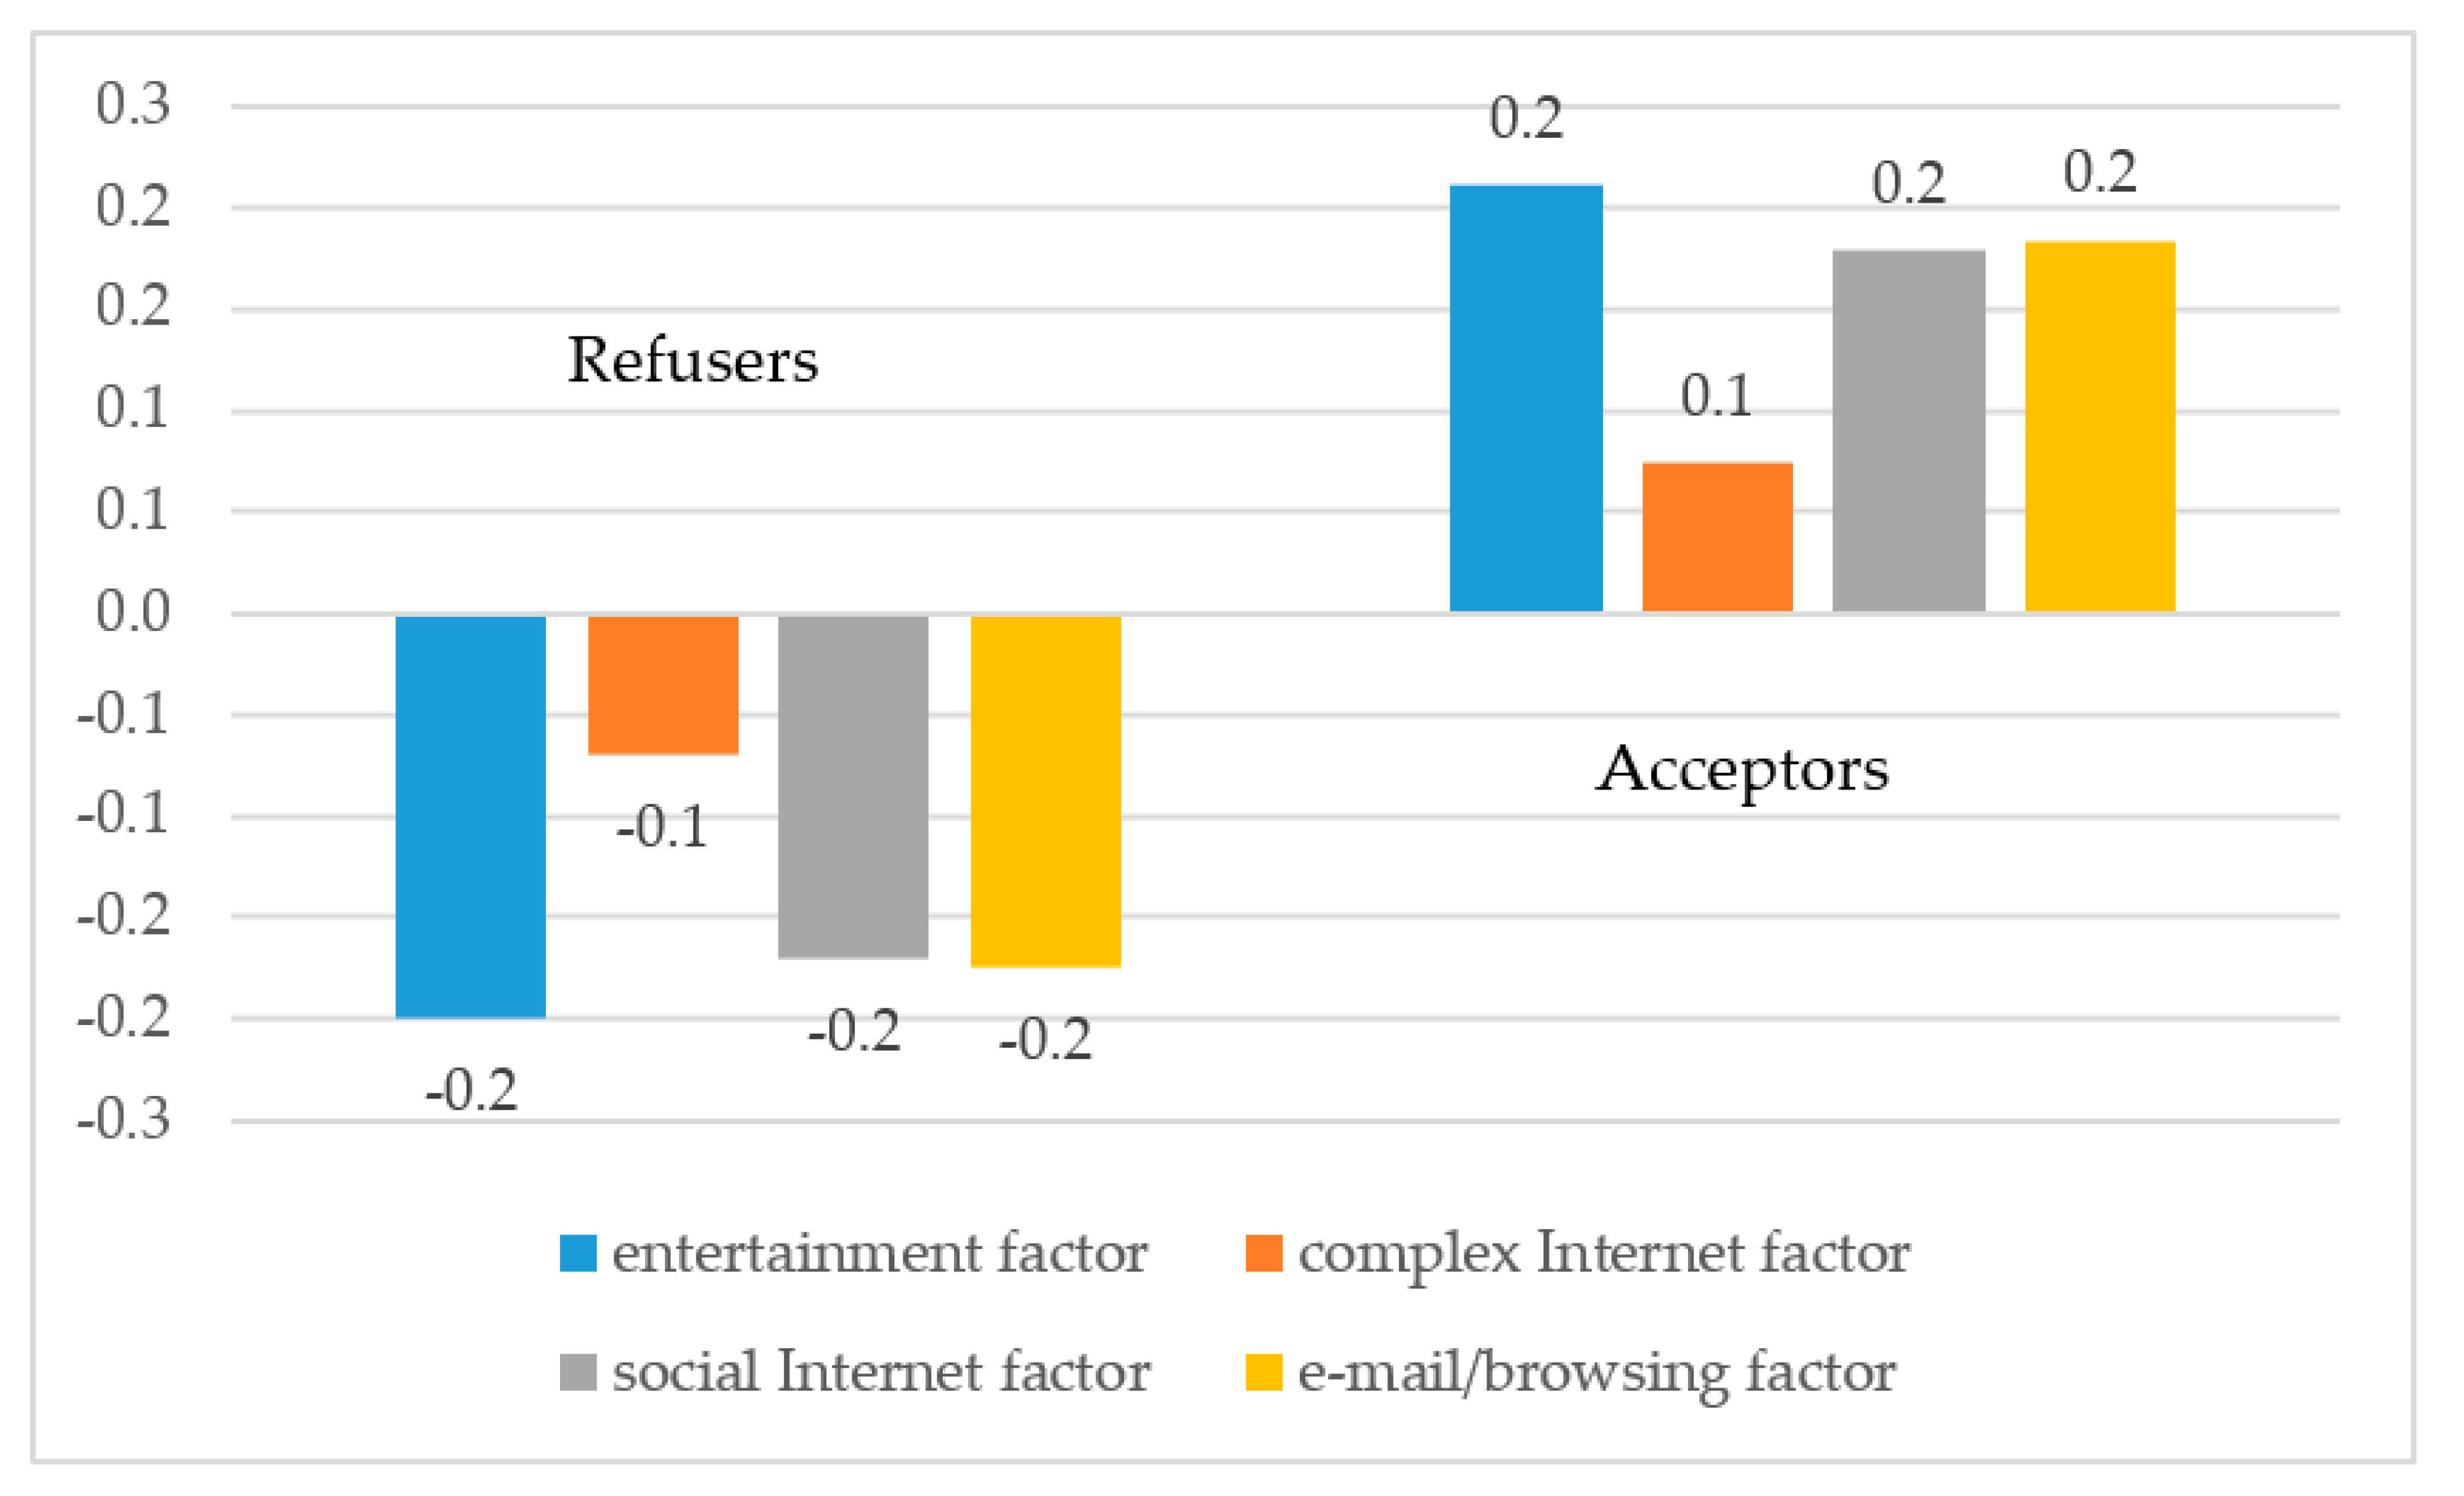
After generating and naming the factors, we examined whether there was a difference in factor scores between acceptors and refusers. To do this, we measured the mean of each group, as before, and looked for significant differences. The results are presented in Figure 3.
- entertainment factor (average of acceptors’ group: 0.2; average of refusers’ group: −0.2);
- complex factor (average of acceptors’ group: 0.1; average of refusers’ group: −0.1);
- social factor (average of acceptors’ group: 0.2; average of refusers’ group: −0.2);
- browse–email–purchase (average of acceptors’ group: 0.2; average of refusers’ group: −0.2).
There is a significant difference in the means for all four variables. In each of the four cases, it can be seen that the acceptors’ groups achieves a higher average, that is, all four activities are more typical for the acceptors’ group. Observing the averages, it is worth pointing out that there is the smallest difference between groups in the case of complex Internet activities. Based on these results, Hypothesis 7 was accepted.
4.2. Logistic Regression Model
Finally, regression modeling was used to determine which of the various socio-demographic, attitudinal, and Internet activity characteristics had the greatest impact on openness. The use of the Internet greatly influences the openness towards the sharing economy, therefore we used only the population using the Internet in the regression model study.
First, we constructed the regression models one by one in the following order: socio-demographic, consumer attitudes, and Internet usage patterns.
4.2.1. Socio-Demographic Regression Model
We looked at gender, economic status, generational affiliation, settlement type, wealth segment, education, and family status. Based on this, generational affiliation, financial status, and educational qualification have a significant effect on openness, the results of which are also shown in Appendix C.1. The regression model, which is based on socio-demographic factors, has 60% explanatory power. That is, if we know the generational affiliation, income level, and educational background, we can determine with 60% good faith whether or not a person is open to sharing economy services. Within the generation factor, the Baby Boomers is the least open, and the X generation twice as open (exp (B): 2.048), the Y generation three times as open (W: 28.5, exp (B): 2.929), and the Z generation four times as open (exp (B): 4.121) towards sharing economy services, relative to the Baby Boomers. In terms of income level, respondents in the lowest income category are the least open, with the lower-middle 1.7 times, upper-middle 1.8 times, and upper income respondents 2.6 times more open. The third independent variable in the case of socio-demographic factors is education, which has a significant impact on openness. People with a primary education level are the least open, followed by vocational graduates (exp (B): 1.532), high school graduates (exp (B): 1.986), and university or college graduates (exp (B): 2.155). All the results are linked in Appendix C.1.
The aim of the regression model, in this case, was to find the most open target population along with socio-demographic factors. The results show that Generation Z people with a high income and college education are the most open, meaning they should be targeted by various marketing tools.
4.2.2. Regression Model Based on Consumer Attitudes
In our basic research, we investigated different consumer attitudes and, from the answers given to a significant number of behavioral questions, we identified the following factors: (1) social behaviors: risk-taking factor, social factor, conscious factor, recycling factor; (2) leisure activity: daily leisure factor and quality leisure factor; (3) attitudes related to willingness to pay: quality-sensitive factor and price-sensitive factor; and (4) openness to the Internet: we have only one factor. Examined individually, these factors showed a significant association with openness, and we now present the results of regression modeling. The aim was to determine which factor has an effect and how strong it is in this model. The regression model, which is based on consumer attitude factors, has 67.9% explanatory power.
Taking into consideration all the factors, in the case of regression modeling, the following factors show significant correlation with openness: social factor (exp (B): 1.256), product quality sensitive factor (exp (B): 1.271), both leisure factors (higher quality activities: exp (B): 1.738, and simpler activities: exp (B): 1.615), and Internet usage factor (exp (B): 1.514). This means that people who engage in more leisure time activities (travel, cultural programs, meeting friend, etc.) are more open to sharing economy services, and this is an even more important indicator than the frequency of Internet usage. The results are linked in Appendix C.2.
4.2.3. Regression Model Based on Internet Usage Patterns
In the previous factor analysis, we obtained four different factors for analyzing Internet use activities: (1) entertainment factor (watching movies online, downloading music, playing games); (2) complex activity factor (own blog, website editing, e-learning); (3) social factor (social networking sites, video sharing); (4) email, browsing, and shopping. Based on these factors, we have found that the more frequently respondents conduct these Internet activities, the more open they are to using sharing economy services. According to the results of the regression model, all four factors show a significant correlation with openness. Entertainment factor (exp (B)): 1.575), social factor (exp (B)): 1.457), and e-mail/browsing factor (exp (B)): 1.477) show similar strong openness. The regression model, which is based on Internet usage patterns factors, has 65% explanatory power. The detailed results are linked in Appendix C.3.
4.2.4. Integrated Regression Model
After examining separately the socio-demographic, consumer attitudes, and Internet usage patterns, we investigated which factors have the strongest effect in consideration towards sharing economy services. The explanatory power of all three models was above 60%, and several independent variables were significant in each model. To compare the effect of each group of independent variables, we built a large final model involving all the independent variables. The explanatory power of the integrated regression model is 69%.
Although in the first phase, many demographic factors and almost all attitude-type factors significantly explained openness, by putting all variables into one model, we can see that demographic factors lose most of their effect, whereas attitude-type independent variables retain it. Overall, it is more important to know people’s attitudes and Internet habits if we would like to estimate openness, than to know their socio-demographic data. However, it is important to note that the two demographic factors (generation and financial status) that remain in the final model have a stronger impact than attitudes in general. Based on this, the following factors show a significant correlation with an openness toward the sharing economy: generation, financial status, and attitudes toward social events, quality sensitivity factor, both leisure activities factors and frequency of Internet usage factor. Within this, the most open target group is generation Z. Within generation Z, those who are the more open who like to travel, go to museums, do wellness programs, and enjoy gastronomic tours. The results are presented in Figure 4, and further detailed results are in Appendix C.4.
5. Discussion and Conclusions
Sharing economy is a relatively new phenomena and brings up novelties in many scientific areas. Although we have carefully defined the hypotheses of our research and reviewed the related literature, our study has some limitations. At the time of the survey (end of 2017), some of the respondents had not even heard of these type of activities. In the questionnaire, we explained the different type of services in details, but it is still possible that someone responded to their intention to participate in sharing economy without fully understanding the nature of the services. Furthermore, to our knowledge, there is no uniformly accepted list of consumer trends, there are many changes that may become trends over time. The presented trends and the related attitudes have been arbitrarily selected. We have selected the trends that we believe are currently the most influential on consumer behavior.
Taking into consideration the limitation, in conclusion, there is a relatively high degree of openness among consumers around the use of sharing economy activities (38.4% of the Hungarian population). Among the motivations of consumers, preference is given to low prices, which would suggest that price-sensitive, less well-off consumers are the primary target group, and that they are more open to this type of service. However, the following elements appeared among the users as secondary motivational factors: experience gathering, digital payment opportunity, personal human relations, and sustainability aspects. These elements drew our attention to the fact that future users will not necessarily choose the service because of the price, but because they are more receptive to the present megatrends. In our national representative research, we wanted to support this hypothesis, which we succeeded in doing. Cross-table methods were used to investigate the correlation between openness and different socio-demographic and attitudinal correlations. Among other things, we found that it is not the price-sensitive and less affluent consumers who are most open to shared services, but rather well-off people. We also found that consumers who are more sensitive to megatrends are more open to sharing economy services. Further, people who are more environmentally conscious, like to spend leisure time with friends, for whom traveling is important to them, who like to gather experience in the local community, are willing to pay for quality things, and consider the opportunities offered by the digital world to be positive are more likely to be open to sharing economy services. Finally, we were curious as to which of the many socio-demographic, attitudinal, and Internet usage habits are the key elements that truly determine who are the most open to the sharing economy. The result of a logistic regression model showed that the strongest determinant is the consumer’s attitude towards spending leisure time. The most open consumers are those who spend their free time in active recreation. We distinguished between quality and simpler forms of recreation that can be done daily. Both factors show a very strong correlation with openness. Additionally, generational affiliation, financial status, and Internet use frequency have become the most important determinants. That is, people of generation Z who are otherwise well-off and who like to spend their free time actively, and also who use the Internet more often than their peers, are the most open segment.
In recent years, some research has been looking for which factors may influence participation in sharing economy. Important statement that there is a gap between attitude and behavior related to participation in collaborative consumption [43]. Hamari et al. identified that participation in collaborative consumption is motivated by many factors such as its sustainability, enjoyment of activity, and economic gains [43]. Albinson et al. identified respondents’ perceived sustainability as the strongest predictor of participation in collaborative consumption. Further factors are “trust, generosity, risk-seeking, materialism, power distance, long-term orientation, and collectivism” [66]. We have confirmed that perceived sustainability and the risk-seeking factor are relevant, and completed several factors related to leisure activities’, social relationship’s, price- and qualitative sensitive’s, and digital behavior’s attitudes.
Recognizing changes in consumer behavior is one of the most important factors in the long-term success of a company. The success of the sharing economy, among other things, can be achieved by offering opportunities and/or solutions that attract the consumer. With Airbnb, it is worth offering travel experiences instead of just accommodation, and sharing a community bike should be promoted not as a means of transport, but as an opportunity to protect the environment. Our results can also be used by companies operating in the traditional business model. There are some industries where traditional companies are threatened by the sharing economy firms (accommodation, travelling, creative agencies, financial sector, etc.). From one side, based on our results, they can identify the most endangered segments, from the other side, they can also use some elements of the mentioned success factors. There are already examples where traditional companies are taking over an innovation from a sharing economy company. Evaluation of the services from the users’ side is already available not only at Airbnb and Uber, but currently several hotels are evaluated at least in some market places. This is related to consumers’ empowering. Application was used firstly by Uber, where passenger could follow the ordered car, now a lot of taxi companies also use a similar application. This is related to the digital innovation.
In addition, one of the most important trends today is to do more to achieve a sustainable world. Several elements of the sharing economy offer opportunities for this, and it is our responsibility to make the most of this opportunity.
Author Contributions
Conceptualization, G.B.; data curation, G.B.; methodology G.B.; validation, G.B.; funding acquisition, G.B.; formal analysis, G.B. and B.P.; investigation, G.B.; writing—Original draft preparation G.B.; writing—Review and editing, G.B. and B.P.; visualization, G.B.; supervision, J.L. All authors have read and agreed to the published version of the manuscript.
Funding
This research received no external funding.
Acknowledgments
The authors wish to express their gratitude to the Szent István University for providing access to the necessary databases (e.g., Scopus). The authors are grateful to Manolisz Karajánnisz for valuable contributions to the questionnaire. The authors are grateful to Magyar Telekom Ltd. for the contribution of the questionnaire.
Conflicts of Interest
The authors declare no conflict of interest.
Appendix A

Table A1.
Socio-Demographic Data of Representative Sample, Total Base, 3520 and Internet User Base, 2513.
Table A1.
Socio-Demographic Data of Representative Sample, Total Base, 3520 and Internet User Base, 2513.
| Total Base (3520) | Internet Users (2513) | |||
|---|---|---|---|---|
| Gender | Frequency | Percent | Frequency | Percent |
| Man | 1660 | 47.1 | 1225 | 48.7 |
| Woman | 1860 | 52.9 | 1289 | 51.3 |
| Total | 3520 | 100 | 2513 | 100 |
| Family | Frequency | Percent | Frequency | Percent |
| Family | 1259 | 35.8 | 1112 | 44.2 |
| Non-family | 2261 | 64.2 | 1402 | 55.8 |
| Total | 3520 | 100 | 2513 | 100 |
| Economic Status | Frequency | Percent | Frequency | Percent |
| Active workers | 1977 | 56.2 | 1742 | 69.3 |
| Retired | 981 | 27.9 | 296 | 11.8 |
| Students | 301 | 8.6 | 300 | 11.9 |
| Inactive | 261 | 7.4 | 176 | 7.0 |
| Total | 3520 | 100 | 2513 | 100 |
| Education Level | Frequency | Percent | Frequency | Percent |
| Primary school | 750 | 21.3 | 333 | 13.2 |
| Secondary school | 937 | 26.6 | 604 | 24.0 |
| High school | 1120 | 31.8 | 942 | 37.5 |
| University | 712 | 20.2 | 635 | 25.2 |
| Total | 3520 | 100 | 2513 | 100 |
| Residence | Frequency | Percent | Frequency | Percent |
| Capital (Budapest) | 750 | 21.3 | 469 | 18.6 |
| County seats | 937 | 26.6 | 563 | 22.4 |
| Other towns | 1120 | 31.8 | 819 | 32.6 |
| Municipality | 712 | 20.2 | 662 | 26.4 |
| Total | 3520 | 100 | 2513 | 100 |
| Financial Status | Frequency | Percent | Frequency | Percent |
| Lower | 705 | 20.0 | 324 | 12.9 |
| Lower-middle | 719 | 20.4 | 392 | 15.6 |
| Upper-middle | 1387 | 39.4 | 1158 | 46.1 |
| Upper | 710 | 20.2 | 639 | 25.4 |
| Total | 3520 | 100 | 2513 | 100 |
| Generation | Frequency | Percent | Frequency | Percent |
| Z (14–25) | 550 | 15.6 | 529 | 21.1 |
| Y (26–39) | 776 | 22.0 | 713 | 28.4 |
| X (40–59) | 1135 | 32.3 | 922 | 36.7 |
| Baby Boomers (60+ | 1059 | 30.1 | 349 | 13.9 |
| Total | 3520 | 100 | 2513 | 100 |
Appendix B. Questionnaire
| Q1 | In the Following, I Would Like to Ask if You Have Heard of Certain Types of Services. So, Have You Heard of the Possibility that…? | |||||||||
|---|---|---|---|---|---|---|---|---|---|---|
| Q2 | What Do You Think, if You Needed such a Service and It Was Available to You, Would You Use It? Or Have You Already Used such a Service? | |||||||||
| Q1 Have you heard of it? | Q2 Would you use it? | |||||||||
| Yes | No | NA | definitely yes | may be yes | may be no | definitely no | NA | Already used it | ||
| 1 | … Instead of a hotel room you can take a private apartment/room directly from the owner (e.g., Airbnb, San Francisco, CA, USA) | 2 | 1 | 9 | 4 | 3 | 2 | 1 | 9 | 8 |
| 2 | …transported within the city by a private individual instead of a taxi for a favorable pricing (e.g., Uber, San Francisco, CA, USA) | 2 | 1 | 9 | 4 | 3 | 2 | 1 | 9 | 8 |
| 3 | …carpooling allows you to enter empty spaces of others while traveling from one to another city for an agreed fee. (e.g., Oszkar, Budapest, Hungary; BlaBlaCar, Paris, France) | 2 | 1 | 9 | 4 | 3 | 2 | 1 | 9 | 8 |
| 4 | ….renting an electric car, using the system’s own cars for a fee, then parking it and leaving it to someone else (e.g., GreenGo, Budapest, Hungary); | 2 | 1 | 9 | 4 | 3 | 2 | 1 | 9 | 8 |
| 5 | …possibility to use shared bike within the city” (e.g., MOL BUBI, Budapest, Hungary) | 2 | 1 | 9 | 4 | 3 | 2 | 1 | 9 | 8 |
| 6 | …Lending or borrowing household items (lawn mowers, bicycles, toys, etc.) to members of an on-line community (e.g., miutcank.hu, Budapest, Hungary) | 2 | 1 | 9 | 4 | 3 | 2 | 1 | 9 | 8 |
| Q3 | Now I Read Statements that Others Have Made about Themselves. To What Extent Do You Agree with These Statements? There Is No Good Answer or Bad Answer, We Are Curious about Your Opinion. Please Respond Using the Statements on the Card. | |||||
|---|---|---|---|---|---|---|
| I Completely Agree | I’d Rather Agree | I Agree and Disagree | I rather Disagree | I totally Disagree | Don’t Know/No Answer | |
| I always want to feel myself in safe. | 5 | 4 | 3 | 2 | 1 | 9 |
| I like to take risks. | 5 | 4 | 3 | 2 | 1 | 9 |
| It is important for me to stand out from the crowd and get noticed. | 5 | 4 | 3 | 2 | 1 | 9 |
| I’m conscious of my health. | 5 | 4 | 3 | 2 | 1 | 9 |
| I am willing to pay for home cleaning to make my life more comfortable. | 5 | 4 | 3 | 2 | 1 | 9 |
| I have to be very sick to go to a doctor. | 5 | 4 | 3 | 2 | 1 | 9 |
| I like to spend most of my free time at home. | 5 | 4 | 3 | 2 | 1 | 9 |
| It’s important for me to fit in with my friends. | 5 | 4 | 3 | 2 | 1 | 9 |
| I can’t stand the mess at home. | 5 | 4 | 3 | 2 | 1 | 9 |
| It is worth the extra effort to be environmentally conscious. | 5 | 4 | 3 | 2 | 1 | 9 |
| I like meeting new people. | 5 | 4 | 3 | 2 | 1 | 9 |
| I do not always want new things, many times buying used product. | 5 | 4 | 3 | 2 | 1 | 9 |
| What I no longer need, but still usable, I sell or give away. | 5 | 4 | 3 | 2 | 1 | 9 |
| I like to help other people, even unknown people. | 5 | 4 | 3 | 2 | 1 | 9 |
| Q4 | How often Do You Do These Leisure Activities? | Several Times a Week | Once a Week | 1–3 Times per Month | Several Times per Half a Year | Once per Half Year | Yearly or Less Frequently | Never | Don’t Know/No Answer |
|---|---|---|---|---|---|---|---|---|---|
| 1 | party in club, disco, etc. | 1 | 2 | 3 | 4 | 5 | 6 | 7 | 9 |
| 2 | Travel or vacation abroad | 1 | 2 | 3 | 4 | 5 | 6 | 7 | 9 |
| 3 | Visit to a museum, exhibition | 1 | 2 | 3 | 4 | 5 | 6 | 7 | 9 |
| 4 | Meeting, chatting with friends | 1 | 2 | 3 | 4 | 5 | 6 | 7 | 9 |
| 5 | Wellness programs (e.g., sauna, massage) | 1 | 2 | 3 | 4 | 5 | 6 | 7 | 9 |
| 6 | Cooking for gastronomic purposes (so no housework!) | 1 | 2 | 3 | 4 | 5 | 6 | 7 | 9 |
| 7 | Computer activity (games, social networking on Internet, viewing emails, browsing) | 1 | 2 | 3 | 4 | 5 | 6 | 7 | 9 |
| 8 | E-book reading | 1 | 2 | 3 | 4 | 5 | 6 | 7 | 9 |
| Q5 | Now I Read Statements that Others Have Made about Brands and Products. How Much Do You Agree with the Following Statement? | I Completely Agree | I’d rather Agree | I Agree and Disagree | I rather Disagree | I totally Disagree | Don’t Know/No Answer |
|---|---|---|---|---|---|---|---|
| 1 | I am willing to pay more for a product that is specifically tailored to my needs. | 5 | 4 | 3 | 2 | 1 | 9 |
| 2 | I always know what’s new and cool. | 5 | 4 | 3 | 2 | 1 | 9 |
| 3 | I’m happy to pay more for environmentally friendly products. | 5 | 4 | 3 | 2 | 1 | 9 |
| 4 | When shopping, I compare product prices and look for a really good deal. | 5 | 4 | 3 | 2 | 1 | 9 |
| 5 | I always choose the cheaper product. | 5 | 4 | 3 | 2 | 1 | 9 |
| 6 | Price is more important than brand name. | 5 | 4 | 3 | 2 | 1 | 9 |
| 7 | A brand name alone tells a lot about a product or service. | 5 | 4 | 3 | 2 | 1 | 9 |
| 8 | When shopping, I compare product prices and look for a really good deal. | 5 | 4 | 3 | 2 | 1 | 9 |
| 9 | I’d love to pay more for better quality. | 5 | 4 | 3 | 2 | 1 | 9 |
| 10 | I can only trust the leading brands. | 5 | 4 | 3 | 2 | 1 | 9 |
| Q6 | Now I Read Statements that Others Have Made about Themselves. To What Extent Do You Agree with These Statements? There Is No Good Answer or Bad Answer, We Are Curious about Your Opinion. Please Respond Using the Statements on the Card | I Completely Agree | I’d rather Agree | I Agree and Disagree | I rather Disagree | I totally Disagree | Don’t Know/No Answer |
|---|---|---|---|---|---|---|---|
| 1 | I try to be the first to try the latest developments. | 5 | 4 | 3 | 2 | 1 | 9 |
| 2 | The computer is not for me. | 5 | 4 | 3 | 2 | 1 | 9 |
| 3 | I can’t even imagine life without the Internet. | 5 | 4 | 3 | 2 | 1 | 9 |
| 4 | On the Internet, one expresses himself more easily than in reality. | 5 | 4 | 3 | 2 | 1 | 9 |
| 5 | I always prefer online shopping. | 5 | 4 | 3 | 2 | 1 | 9 |
| Q7 | In the Following, I Ask about Internet Usage Habits, Regardless of the Device (Computer, Smartphone, Tablet) or Where the Internet Is. How often Have You Been Online in the Last Month? |
|---|---|
| 1 | every day |
| 2 | several times a week |
| 3 | once a week |
| 4 | once or twice a month |
| 5 | did not use the Internet |
| 9 | don’t know/no answer |
| Q8 | Do You Use the Internet for Any of the Following Purposes on a Regular Basis? | Yes | No | Don’t Know/No Answer |
|---|---|---|---|---|
| 1 | Browse websites (for information, entertainment) | 2 | 1 | 9 |
| 2 | Internet chat, instant messaging programs | 2 | 1 | 9 |
| 3 | Internet telephony/video telephone | 2 | 1 | 9 |
| 4 | Online Video Share Platforms (e.g., YouTube, San Bruno, CA, USA) | 2 | 1 | 9 |
| 5 | Online social networking sites (Facebook, Snapchat) | 2 | 1 | 9 |
| 6 | Watching Online TV | 2 | 1 | 9 |
| 7 | Watching movies online, watching episodes when you don’t have to download a movie | 2 | 1 | 9 |
| 8 | Online watching/streaming of movies, series | 2 | 1 | 9 |
| 9 | Private e-mail | 2 | 1 | 9 |
| 10 | Work-related e-mail | 2 | 1 | 9 |
| 11 | E-learning | 2 | 1 | 9 |
| 12 | download of movies, series | 2 | 1 | 9 |
| 13 | download music | 2 | 1 | 9 |
| 14 | posts in forums | 2 | 1 | 9 |
| 15 | editing your own website | 2 | 1 | 9 |
| 16 | edit your own blog | 2 | 1 | 9 |
| 17 | online web storage (e.g., Google drive, Dropbox, OneDrive) | 2 | 1 | 9 |
| 18 | Online photo storage | 2 | 1 | 9 |
| 19 | Homeworking | 2 | 1 | 9 |
| 20 | Participation in distance learning | 2 | 1 | 9 |
| 21 | Online shopping | 2 | 1 | 9 |
| 22 | Listening online radio | 2 | 1 | 9 |
| 23 | Game | 2 | 1 | 9 |
| Respondents Data | |
|---|---|
| 1 | What is your gender? |
| Man | |
| Woman | |
| 2 | Date of birth |
| 3/1 | Family status |
| Unmarried | |
| Married | |
| Divorced | |
| Widow | |
| 3/2 | Do you have a child? |
| Yes, under 18 | |
| Yes, above 18 | |
| No | |
| 4 | Educational level |
| Primary school | |
| Vocational school | |
| Grammar school | |
| College or university | |
| Don’t know/no answer | |
| 5 | Economic status |
| Active workers | |
| Students | |
| Retired | |
| Inactive | |
| Don’t know/no answer | |
| 6 | Place of residence |
| Capital (Budapest) | |
| County seats | |
| Other town | |
| Municipality | |
| Other | |
| 7 | Financial income |
| 7/1 | Net income |
| Amount | |
| Don’t know/no answer | |
| 7/2 | How do you feel financially? |
| They live without problems | |
| They have to split the salary, but you get along well | |
| They are coming out of their monthly income | |
| Month after month they have financial problems | |
| Don’t know/no answer | |
| 7/3 | Do you have car? |
| Yes | |
| No | |
| Don’t know/no answer | |
Appendix C
Appendix C.1. Results of Regression Modeling of Socio-Demographic Characteristics versus Openness to the Sharing Economy, Own Editing
| Regression Model of Socio-Demographic Data | B | S.E. | Wald | df | Sig. | Exp (B) |
|---|---|---|---|---|---|---|
| Baby Boomers | 34.58 | 3.00 | 0.00 | |||
| X generation | 0.72 | 0.20 | 13.35 | 1.00 | 0.00 | 2.05 |
| Y generation | 1.07 | 0.20 | 28.56 | 1.00 | 0.00 | 2.93 |
| Z generation | 1.42 | 0.35 | 15.95 | 1.00 | 0.00 | 4.12 |
| Capital | 12.04 | 3.00 | 0.01 | |||
| County seats | 0.28 | 0.13 | 4.40 | 1.00 | 0.04 | 1.32 |
| Other towns | 0.08 | 0.12 | 0.39 | 1.00 | 0.53 | 1.08 |
| Municipality | −0.14 | 0.13 | 1.12 | 1.00 | 0.29 | 0.87 |
| Lower | 40.66 | 3.00 | 0.00 | |||
| Lower-middle | 0.53 | 0.16 | 11.18 | 1.00 | 0.00 | 1.71 |
| Upper-middle | 0.64 | 0.14 | 21.07 | 1.00 | 0.00 | 1.89 |
| Upper | 0.96 | 0.15 | 40.22 | 1.00 | 0.00 | 2.61 |
| Gender | 0.00 | 0.08 | 0.00 | 1.00 | 0.97 | 1.00 |
| Primary school | 19.45 | 3.00 | 0.00 | |||
| Secondary school | 0.43 | 0.20 | 4.68 | 1.00 | 0.03 | 1.53 |
| High school | 0.69 | 0.19 | 12.82 | 1.00 | 0.00 | 1.99 |
| University | 0.77 | 0.20 | 14.47 | 1.00 | 0.00 | 2.15 |
| Family | 0.15 | 0.09 | 2.69 | 1.00 | 0.10 | 1.17 |
| Active workers | 2.69 | 3.00 | 0.44 | |||
| Retired | 0.00 | 0.20 | 0.00 | 1.00 | 0.98 | 1.00 |
| Students | 0.33 | 0.20 | 2.69 | 1.00 | 0.10 | 1.39 |
| Unemployment | 0.04 | 0.17 | 0.04 | 1.00 | 0.84 | 1.04 |
Appendix C.2. Results of Regression Modeling of Consumer Attitudes versus Openness to the Sharing Economy, Own Editing
| Factors | B | S.E. | Wald | df | Sig. | Exp (B) |
|---|---|---|---|---|---|---|
| Risk taking | −0.06 | 0.06 | 1.31 | 1.00 | 0.25 | 0.94 |
| Social | 0.23 | 0.06 | 14.04 | 1.00 | 0.00 | 1.26 |
| Conscious | 0.05 | 0.05 | 0.99 | 1.00 | 0.32 | 1.06 |
| Recycling | 0.09 | 0.05 | 3.13 | 1.00 | 0.08 | 1.09 |
| Daily leisure | −0.55 | 0.06 | 96.34 | 1.00 | 0.00 | 0.58 |
| Quality leisure | −0.48 | 0.07 | 47.41 | 1.00 | 0.00 | 0.62 |
| Quality sensitive | 0.24 | 0.07 | 10.66 | 1.00 | 0.00 | 1.27 |
| Price sensitive | −0.09 | 0.06 | 2.80 | 1.00 | 0.09 | 0.91 |
| Digital attitude | 0.41 | 0.08 | 26.29 | 1.00 | 0.00 | 1.51 |
Appendix C.3. Results of Regression Modeling of Internet Usage Patterns versus Openness to the Sharing Economy, Own Editing
| Factors | B | S.E. | Wald | df | Sig. | Exp (B) |
|---|---|---|---|---|---|---|
| Entertainment | 0.45 | 0.05 | 97.22 | 1.00 | 0.00 | 1.57 |
| Complex | 0.17 | 0.05 | 12.25 | 1.00 | 0.00 | 1.18 |
| Social | 0.38 | 0.04 | 73.62 | 1.00 | 0.00 | 1.46 |
| E-mail/browsing | 0.39 | 0.04 | 77.42 | 1.00 | 0.00 | 1.48 |
Appendix C.4. Results of Integrated Regression Modeling
| B | S.E. | Wald | df | Sig. | Exp (B) | |||
| Socio-demographic factors | Generation | Baby Boomers | 6.292 | 3.000 | 0.098 | |||
| X | 0.394 | 0.235 | 2.821 | 1.000 | 0.093 | 1483 | ||
| Y | 0.501 | 0.245 | 4.177 | 1.000 | 0.041 | 1651 | ||
| Z | 1.044 | 0.441 | 5.620 | 1.000 | 0.018 | 2842 | ||
| Settlement | Budapest | 4.238 | 3.000 | 0.237 | ||||
| County seat | 0.225 | 0.160 | 1.969 | 1.000 | 0.161 | 1.253 | ||
| Another town | 0.101 | 0.153 | 0.431 | 1.000 | 0.512 | 1.106 | ||
| Municipality | −0.052 | 0.164 | 0.099 | 1.000 | 0.753 | 0.950 | ||
| Financial situation | Lower | 5.692 | 3.000 | 0.128 | ||||
| Lower-middle | 0.392 | 0.193 | 4.115 | 1.000 | 0.043 | 1.480 | ||
| Upper-middle | 0.228 | 0.170 | 1.809 | 1.000 | 0.179 | 1.257 | ||
| Upper | 0.074 | 0.189 | 0.154 | 1.000 | 0.695 | 1.077 | ||
| Gender | Gender | −0.021 | 0.107 | 0.040 | 1.000 | 0.842 | 0.979 | |
| Education | Primary school | 3.759 | 3.000 | 0.289 | ||||
| Secondary school | 0.354 | 0.242 | 2.134 | 1.000 | 0.144 | 1.425 | ||
| High school | 0.465 | 0.243 | 3.668 | 1.000 | 0.055 | 1.592 | ||
| University | 0.406 | 0.259 | 2.458 | 1.000 | 0.117 | 1.501 | ||
| Family status | Family status | 0.002 | 0.113 | 0.000 | 1.000 | 0.988 | 1.002 | |
| Economic status | Active workers | 0.451 | 3.000 | 0.929 | ||||
| Retired | 0.086 | 0.252 | 0.118 | 1.000 | 0.732 | 1.090 | ||
| Students | 0.018 | 0.246 | 0.005 | 1.000 | 0.943 | 1.018 | ||
| Unemployment | 0.124 | 0.204 | 0.367 | 1.000 | 0.545 | 1.132 | ||
| B | S.E. | Wald | df | Sig. | Exp (B) | |||
| Consumers attitude factors | Social behavior | Risk taking | −0.039 | 0.062 | 0.384 | 1.000 | 0.535 | 0.962 |
| Social | 0.229 | 0.065 | 12.428 | 1.000 | 0.000 | 1.257 | ||
| Conscious | −0.003 | 0.060 | 0.002 | 1.000 | 0.961 | 0.997 | ||
| Recycling | 0.066 | 0.054 | 1.466 | 1.000 | 0.226 | 1.068 | ||
| Income | Quality sensitive | 0.252 | 0.078 | 10.324 | 1.000 | 0.001 | 1.287 | |
| Price sensitivity | −0.012 | 0.060 | 0.043 | 1.000 | 0.836 | 0.988 | ||
| Leisure time | Quality | 0.184 | 0.092 | 3.945 | 1.000 | 0.000 | 1.664 | |
| Simpler, daily | 0.509 | 0.064 | 64.180 | 1.000 | 0.000 | 1.358 | ||
| Internet usage | Frequently of Internet usage | 0.306 | 0.078 | 15.417 | 1.000 | 0.047 | 1.202 | |
| B | S.E. | Wald | df | Sig. | Exp (B) | |||
| Internet factors | Internet usage type | Entertainment | 0.283 | 0.056 | 25.832 | 1.000 | 0.000 | 1.327 |
| Complex | 0.008 | 0.057 | 0.020 | 1.000 | 0.888 | 1.008 | ||
| Social | 0.207 | 0.056 | 13.740 | 1.000 | 0.000 | 1.230 | ||
| E-mail, browse, purchase | 0.145 | 0.057 | 6.550 | 1.000 | 0.010 | 1.156 | ||
References
- Sundararajan, A. Commentary: The Twilight of Brand and Consumerism? Digital Trust, Cultural Meaning, and the Quest for Connection in the Sharing Economy. J. Mark. 2019, 83, 32–35. [Google Scholar] [CrossRef]
- Bagozzi, R.P. Marketing as an Organized Behavioral System of Exchange: A comprehensive and analytic structure for interpreting behavior in marketing relationships. J. Mark. 1974, 38, 77–81. [Google Scholar] [CrossRef]
- Eckhardt, G.M.; Houston, M.B.; Jiang, B.; Lamberton, C.; Rindfleisch, A.; Zervas, G. Marketing in the Sharing Economy. J. Mark. 2019, 83, 5–27. [Google Scholar] [CrossRef]
- Chen, Y.; Wang, L. Commentary: Marketing and the Sharing Economy: Digital Economy and Emerging Market Challenges. J. Mark. 2019, 83, 28–31. [Google Scholar] [CrossRef]
- Zervas, G.; Proserpio, D.; Byers, J.W. The Rise of the Sharing Economy: Estimating the Impact of Airbnb on the Hotel Industry. J. Mark. Res. 2017, 54, 687–705. [Google Scholar] [CrossRef] [Green Version]
- Wallsten, S. The Competitive Effects of the Sharing Economy: How is Uber Changing Taxis? Technol. Policy Inst. 2015, 22, 1–21. [Google Scholar]
- Belleflamme, P.; Lambert, T.; Schwienbacher, A. Crowdfunding: Tapping the right crowd. J. Bus. Ventur. 2014, 29, 585–609. [Google Scholar] [CrossRef] [Green Version]
- Reisch, L.A.; Thogersen, J. Handbook of Research on Sustainable Consumption; Edward Elgar Publishing: Cheltenham, UK, 2015; ISBN 978-1-78347-127-0. [Google Scholar]
- Wang, Y.; Xiang, D.; Yang, Z.; Ma, S. Unraveling customer sustainable consumption behaviors in sharing economy: A socio-economic approach based on social exchange theory. J. Clean. Prod. 2019, 208, 869–879. [Google Scholar] [CrossRef]
- Heinrichs, H. Sharing Economy: A Potential New Pathway to Sustainability. Gaia 2013, 22, 228–231. [Google Scholar] [CrossRef]
- Fogarassy, C.; Horvath, B.; Magda, R. Business Model Innovation as a Tool to Establish Corporate Sustainability. Visegr. J. Bioecon. Sustain. Dev. 2017, 6, 50–58. [Google Scholar] [CrossRef] [Green Version]
- Leismann, K.; Schmitt, M.; Rohn, H.; Baedeker, C. Collaborative Consumption: Towards a Resource-Saving Consumption Culture. Resources 2013, 2, 184–203. [Google Scholar] [CrossRef]
- Singh, J.; Laurenti, R.; Rajib, S.; Frostell, B. Progress and challenges to the global waste management system. Waste Manag. Res. 2014, 32, 800–812. [Google Scholar] [CrossRef] [PubMed] [Green Version]
- Kasriel-Alexander, D. Top 10 Global Consumer Trends for 2017; Euromonitor International: London, UK, 2017; p. 50. [Google Scholar]
- Flatters, P.; Willmott, M. Understanding the Post-Recession Consumer. Harv. Bus. Rev. 2009, 87, 106–112. [Google Scholar]
- Ellison, N.B.; Lampe, C.; Steinfield, C. Social Network Sites and Society: Current Trends and Future Possibilities. Interactions 2009, 16, 6. [Google Scholar] [CrossRef]
- Sharing or Paring? Growth of the Sharing Economy. 2015. Available online: https://www.pwc.com/hu/en/kiadvanyok/assets/pdf/sharing-economy-en.pdf (accessed on 1 December 2019).
- Botsman, R.; Rogers, R. What’s Mine Is Yours: How Collaborative Consumption Is Changing the Way We Live; Collins: London, UK, 2011; Volume 5. [Google Scholar]
- Gansky, L. The Mesh—Why the Future of Business Is Sharing; Penguin Group: New York, NY, USA, 2012. [Google Scholar]
- Bardhi, F.; Eckhardt, G.M. Access-Based Consumption: The Case of Car Sharing. J. Consum. Res. 2012, 39, 881–898. [Google Scholar] [CrossRef]
- Friedman, T.L. Opinion|Welcome to the ‘Sharing Economy’. The New York Times, 20 July 2013. [Google Scholar]
- Curtis, S.K.; Lehner, M. Defining the Sharing Economy for Sustainability. Sustainability 2019, 11, 567. [Google Scholar] [CrossRef] [Green Version]
- Fogarassy, C.; Horvath, B.; Borocz, M. The Interpretation of Circular Priorities to Central European Business Environment with Focus on Hungary. Visegr. J. Bioecon. Sustain. Dev. 2017, 6, 2–9. [Google Scholar] [CrossRef] [Green Version]
- Codagnone, C.; Martens, B. Scoping the Sharing Economy: Origins, Definitions, Impact and Regulatory Issues; Social Science Research Network: Rochester, NY, USA, 2016. [Google Scholar]
- Frenken, K.; Schor, J. Putting the sharing economy into perspective. Environ. Innov. Soc. Transit. 2017, 23, 3–10. [Google Scholar] [CrossRef]
- Lombardi, P.; Schwabe, F. Sharing economy as a new business model for energy storage systems. Appl. Energy 2017, 188, 485–496. [Google Scholar] [CrossRef]
- Piscicelli, L.; Ludden, G.D.S.; Cooper, T. What makes a sustainable business model successful? An empirical comparison of two peer-to-peer goods-sharing platforms. J. Clean. Prod. 2018, 172, 4580–4591. [Google Scholar] [CrossRef]
- Illés, C.; Nosratabadi, S.; Dunay, A. Business models in theory and practice. In Proceedings of the ICUBERD, Book of Papers, Pécs, Hungary, 30 November–1 December 2017. [Google Scholar]
- Horvath, B.; Khazami, N.; Ymeri, P.; Fogarassy, C. Investigating the current business model innovation trends in the biotechnology industry. J. Bus. Econ. Manag. 2019, 20, 63–85. [Google Scholar] [CrossRef] [Green Version]
- Interian, J. Up in the Air: Harmonizing the Sharing Economy through Airbnb Regulations. Int’l Comp. L. Rev. 2016, 39, 35. [Google Scholar]
- Allen, D.; Berg, C. The Sharing Economy, How Over-Regulation Could Destroy an Economic Revolution. Available online: https://collaborativeeconomy.com/research/the-sharing-economy-how-over-regulation-could-destroy-an-economic-revolution/ (accessed on 16 October 2019).
- Koopman, C.; Mitchell, M.; Thierer, A. The Sharing Economy and Consumer Protection Regulation: The Case for Policy Change. SSRN Electron. J. 2014, 8, 529. [Google Scholar] [CrossRef] [Green Version]
- Ranchordas, S. Does Sharing Mean Caring? Regulating Innovation in the Sharing Economy. Minn. J. L. Sci. Tech. 2015, 16, 413. [Google Scholar]
- Friedman, G. Workers without employers: Shadow corporations and the rise of the gig economy. Rev. Keynes. Econ. 2014, 2, 171–188. [Google Scholar] [CrossRef]
- Green, D.; Walker, C.; Alabulththim, A.; Smith, D.; Phillips, M. Fueling the Gig Economy: A Case Study Evaluation of Upwork.com. Manag. Econ. Res. J. 2018, 4, 104. [Google Scholar] [CrossRef]
- Lehdonvirta, V. Flexibility in the Gig Economy: Managing Time on Three Online Piecework Platforms. New Technol. Work Employ. 2018, 33, 13–29. [Google Scholar] [CrossRef]
- Garben, S.; European Agency for Safety and Health at Work. Protecting Workers in the Online Platform Economy: An Overview of Regulatory and Policy Developments in the EU; EU-OSHA: Bilbao, Spain, 2017; ISBN 978-92-9496-642-1.
- Kalleberg, A.L.; Dunn, M. Good Jobs, Bad Jobs in the Gig Economy. Available online: http://michael-dunn.org/wp-content/uploads/2017/05/ALK-MD.-JQ-in-Gig-Economy.pdf (accessed on 16 October 2019).
- Bahrami, P.; Nosratabadi, S.; Illés, C. Role of Intellectual Capital in Corporate Entrepreneurship. Calitatea 2016, 17, 111. [Google Scholar]
- Fogarassy, C.; Szabo, K.; Poor, J. Critical issues of human resource planning, performance evaluation and long-term development on the central region and non-central areas: Hungarian case study for investors. Int. J. Eng. Bus. Manag. 2017, 9, 1847979016685338. [Google Scholar] [CrossRef]
- Liedtke, C.; Hasselkuß, M.; Welfens, M.J.; Nordmann, J.; Baedeker, C. Transformation Towards Sustainable Consumption: Changing Consumption Patterns Through Meaning in Social Practices. In Proceedings of the 4th International Conference on Sustainability Transitions (IST 2013), Zürich, Switzerland, 18–21 June 2013; p. 29. [Google Scholar]
- Liedtke, C.; Baedeker, C.; Hasselkuß, M.; Rohn, H.; Grinewitschus, V. User-integrated innovation in Sustainable LivingLabs: An experimental infrastructure for researching and developing sustainable product service systems. J. Clean. Prod. 2015, 97, 106–116. [Google Scholar] [CrossRef] [Green Version]
- Hamari, J.; Sjöklint, M.; Ukkonen, A. The sharing economy: Why people participate in collaborative consumption. J. Assoc. Inf. Sci. Technol. 2016, 67, 2047–2059. [Google Scholar] [CrossRef]
- Möhlmann, M. Collaborative consumption: Determinants of satisfaction and the likelihood of using a sharing economy option again. J. Consum. Behav. 2015, 14, 193–207. [Google Scholar] [CrossRef]
- Schor, J.B. Debating the Sharing Economy. Available online: https://greattransition.org/publication/debating-the-sharing-economy (accessed on 18 November 2019).
- MEGATRENDS. Trend Inspiráció. Available online: https://www.trendinspiracio.hu/megatrends/ (accessed on 14 December 2019).
- Cheng, L.; Counts, S.J.; Fisher, D.A.; Affronti, M.A.; Smith, M.A. Performance of a Social Network; Microsoft Corporation: Redmond, WA, USA, 2010. [Google Scholar]
- Prahalad, C.K.; Ramaswamy, V. Co-creation experiences: The next practice in value creation. J. Interact. Mark. 2004, 18, 5–14. [Google Scholar] [CrossRef] [Green Version]
- Evans, P.; Wurster, T.S. Getting Real About Virtual Commerce. Harv. Bus. Rev. 1999, 77, 84–98. [Google Scholar]
- Lorenzo-Romero, C.; Cordente-Rodríguez, M.; Alarcón-del-Amo, M.-C. Open Collaboration as Marketing Transformation Strategy in Online Markets: The Case of the Fashion Sector. Resources 2019, 8, 167. [Google Scholar] [CrossRef] [Green Version]
- Maslow, A. Self-Actualization and Beyond. Available online: https://eric.ed.gov/?id=ED012056 (accessed on 15 November 2019).
- Maslow, A.H. Motivation and Personality; Harper and Row Publisher Inc.: New York, NY, USA, 1970. [Google Scholar]
- Chang, T.-Y.; Horng, S.-C. Conceptualizing and measuring experience quality: The customer’s perspective. Serv. Ind. J. 2010, 30, 2401–2419. [Google Scholar] [CrossRef]
- Carù, A.; Caru, A.; Cova, B. Consuming Experience; Routledge: Abingdon, UK, 2007; ISBN 978-0-415-38243-4. [Google Scholar]
- Uriely, N. The Tourist Experience: Conceptual Developments. Ann. Tour. Res. 2005, 32, 199–216. [Google Scholar] [CrossRef]
- Report of the World Commission on Environment and Development: Our Common Future. Available online: http://netzwerk-n.org/wp-content/uploads/2017/04/0_Brundtland_Report-1987-Our_Common_Future.pdf (accessed on 22 November 2019).
- Elkington, J. Partnerships from cannibals with forks: The triple bottom line of 21st-century business. Environ. Qual. Manag. 1998, 8, 37–51. [Google Scholar] [CrossRef]
- French, S.; Rogers, G. Understanding the LOHAS Consumer: The Rise of Ethical Consumerism. Available online: http://www.fusbp.com/wp-content/uploads/2010/10/UNDERSTANDING-THE-LOHAS-CONSUMER.pdf (accessed on 17 November 2019).
- Amberg, N.; Fogarassy, C. Green Consumer Behavior in the Cosmetics Market. Resources 2019, 8, 137. [Google Scholar] [CrossRef] [Green Version]
- Hagman, J.; Ritzén, S.; Janhager Stier, J.; Susilo, Y. Total cost of ownership and its potential implications for battery electric vehicle diffusion. Res. Transp. Bus. Manag. 2016, 18, 11–17. [Google Scholar] [CrossRef] [Green Version]
- Pirani, E.; Secondi, L. Eco-Friendly Attitudes: What European Citizens Say and What They Do. Int. J. Environ. Res. 2011, 5, 67–84. [Google Scholar]
- Aliber, R.Z.; Click, R.W. Readings in International Business: A Decision Approach; MIT Press: Cambridge, MA, USA, 1993; ISBN 978-0-262-51066-0. [Google Scholar]
- Theobald, W.F. Global Tourism, 3rd ed.; Elsevier-Science: Amsterdam, The Netherlands, 2004; ISBN 0-7506-7789-9. [Google Scholar]
- Buda, G.; Lehota, J. The spreading of sharing economy and its impact on customers’ behaviour. Acta Carolus Robertus 2016, 6, 44–59. [Google Scholar]
- Roderick, L. Airbnb’s Marketing Boss on Polarising Brands, Mass Tourism and Why It Wants to Offer a “Complete Experiential Proposition”. Available online: https://www.marketingweek.com/airbnb-takes-on-mass-tourism-as-it-expands-to-offer-travellers-more-than-just-a-home/ (accessed on 16 October 2019).
- Albinsson, P.; Perera, B.; Nafees, L.; Burman, B. Collaborative Consumption Usage in the US and India: An Exploratory Study. J. Mark. Theory Pract. 2019, 27, 390–412. [Google Scholar] [CrossRef]
Figure 1.
Structure of the logistic regression model, own editing.

Figure 2.
Different consumer attitudes versus openness toward the sharing economy, Source: Own data collection and processing, 2017.
Figure 2.
Different consumer attitudes versus openness toward the sharing economy, Source: Own data collection and processing, 2017.
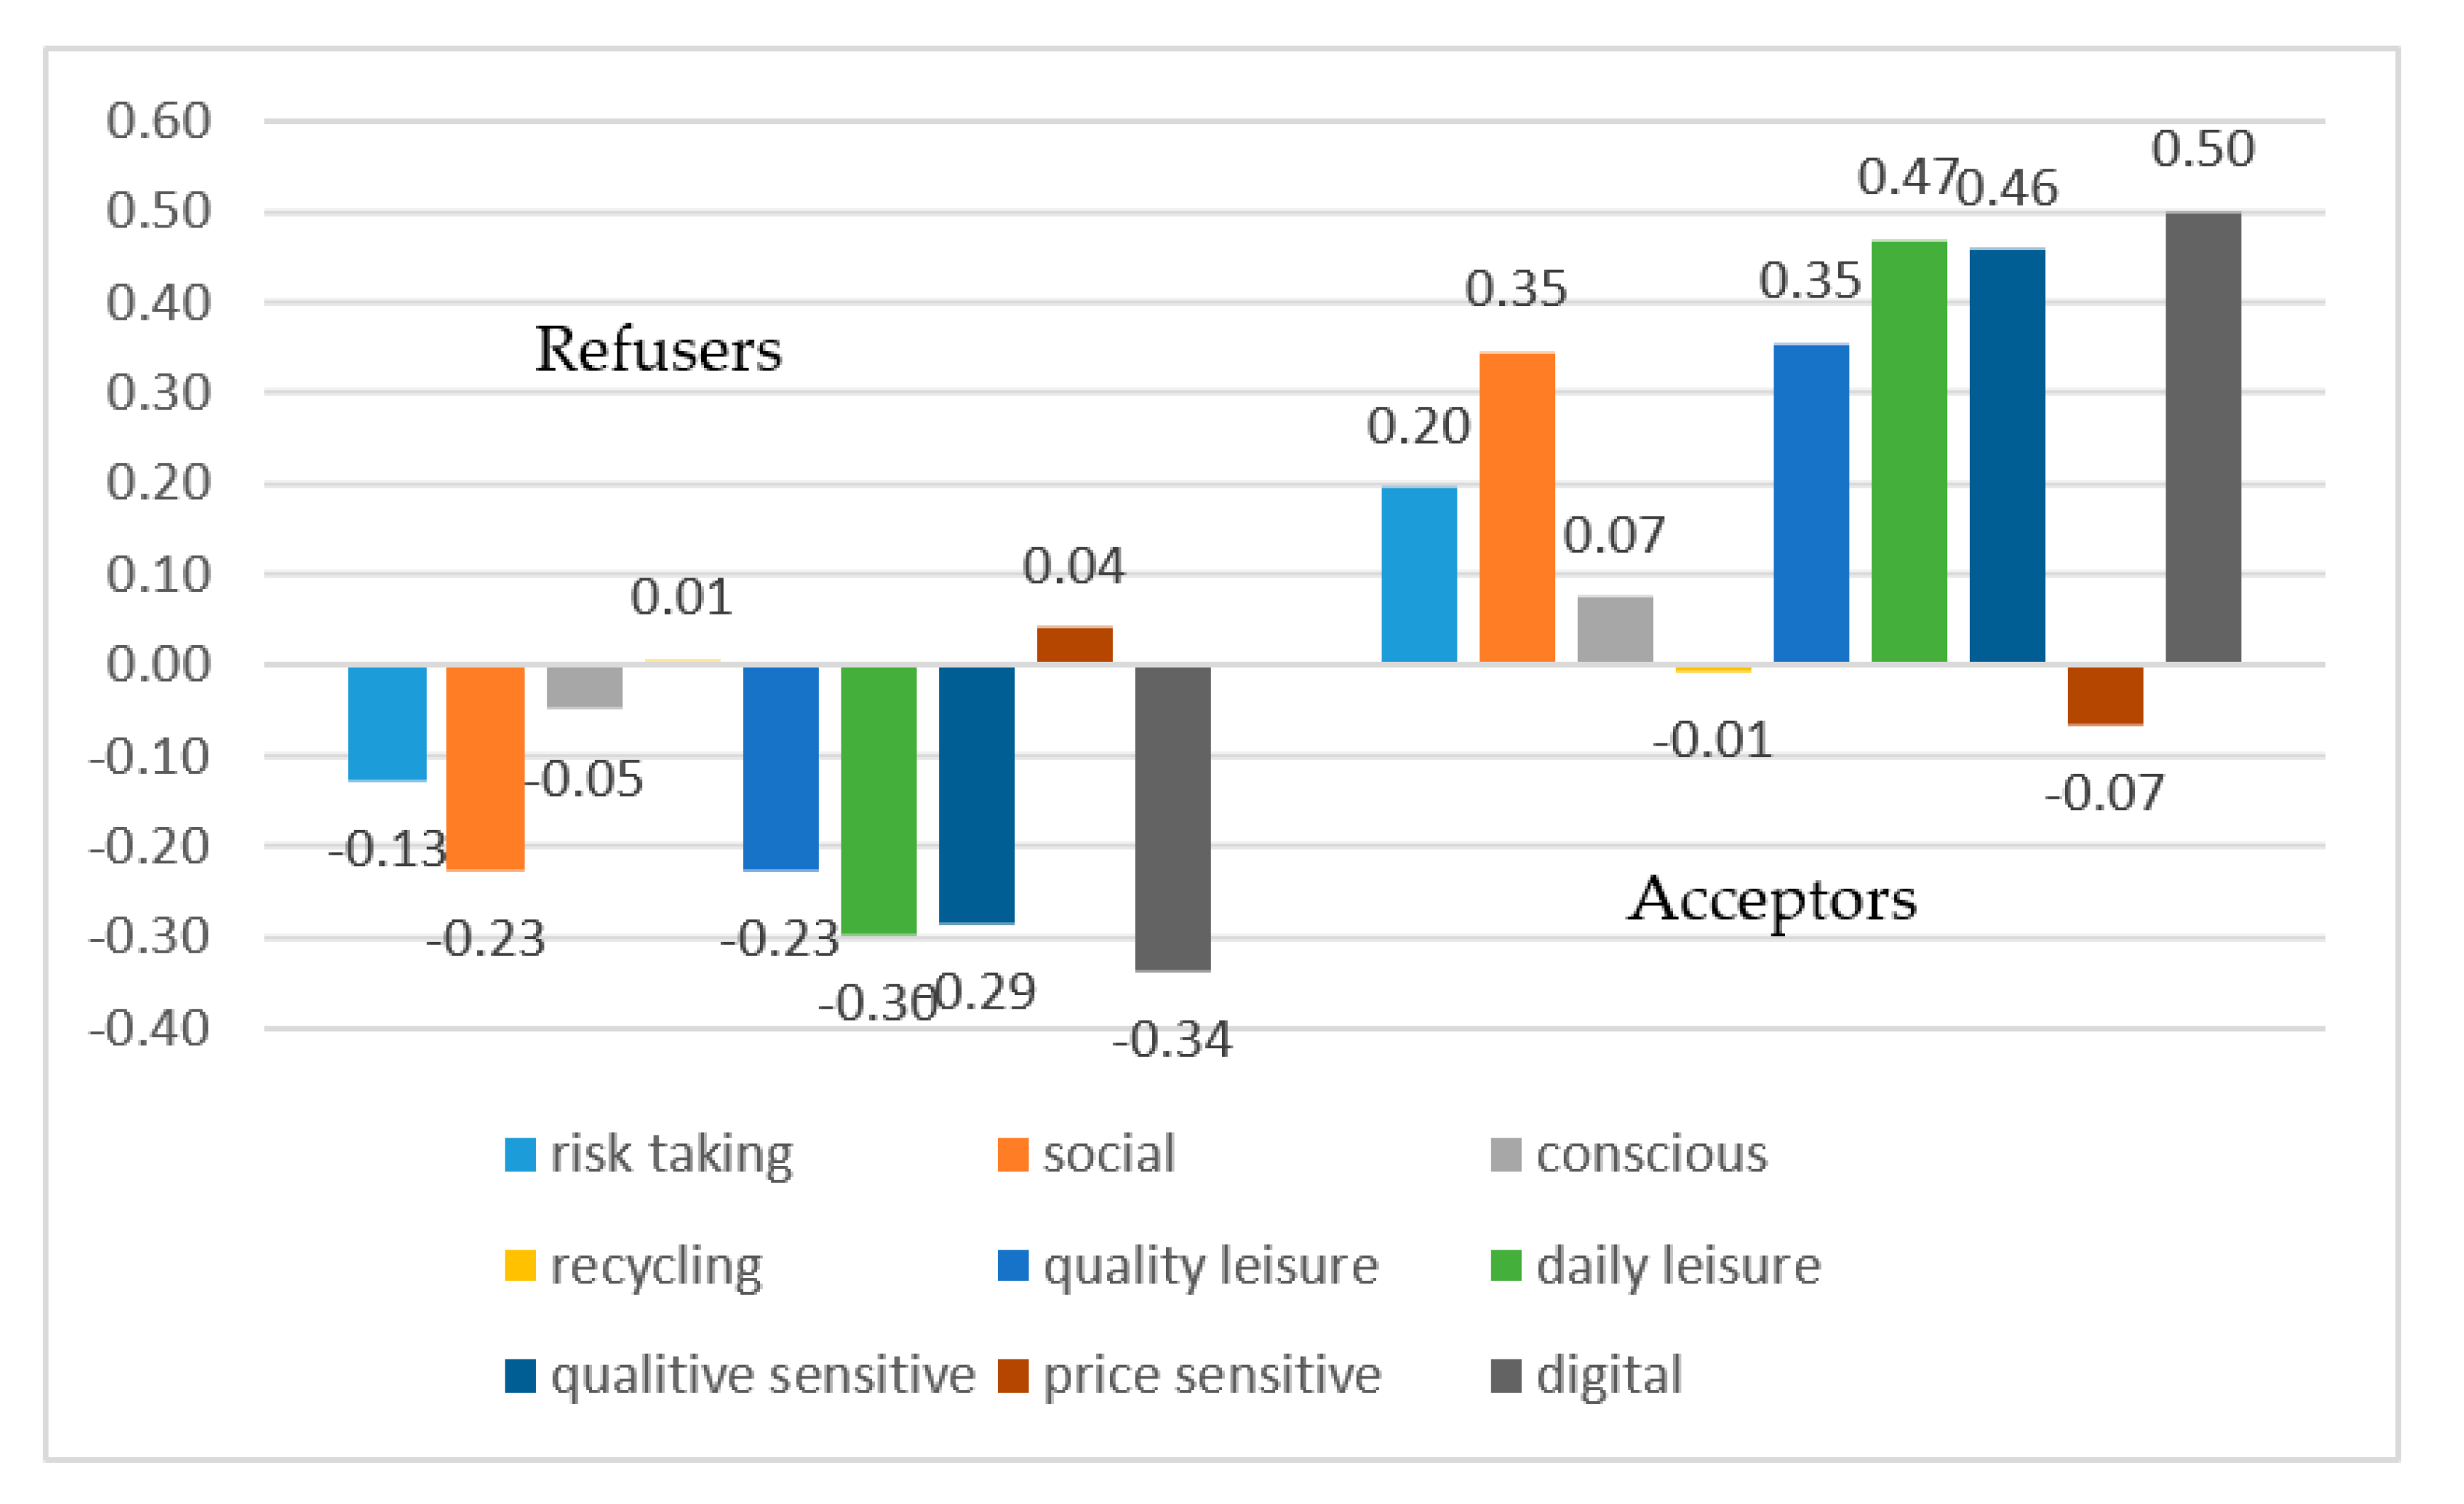
Figure 3.
Internet usage habits versus openness toward sharing economy, Source: Own data collection and processing, 2017.
Figure 3.
Internet usage habits versus openness toward sharing economy, Source: Own data collection and processing, 2017.

Figure 4.
Results of the integrated logistic regression model.
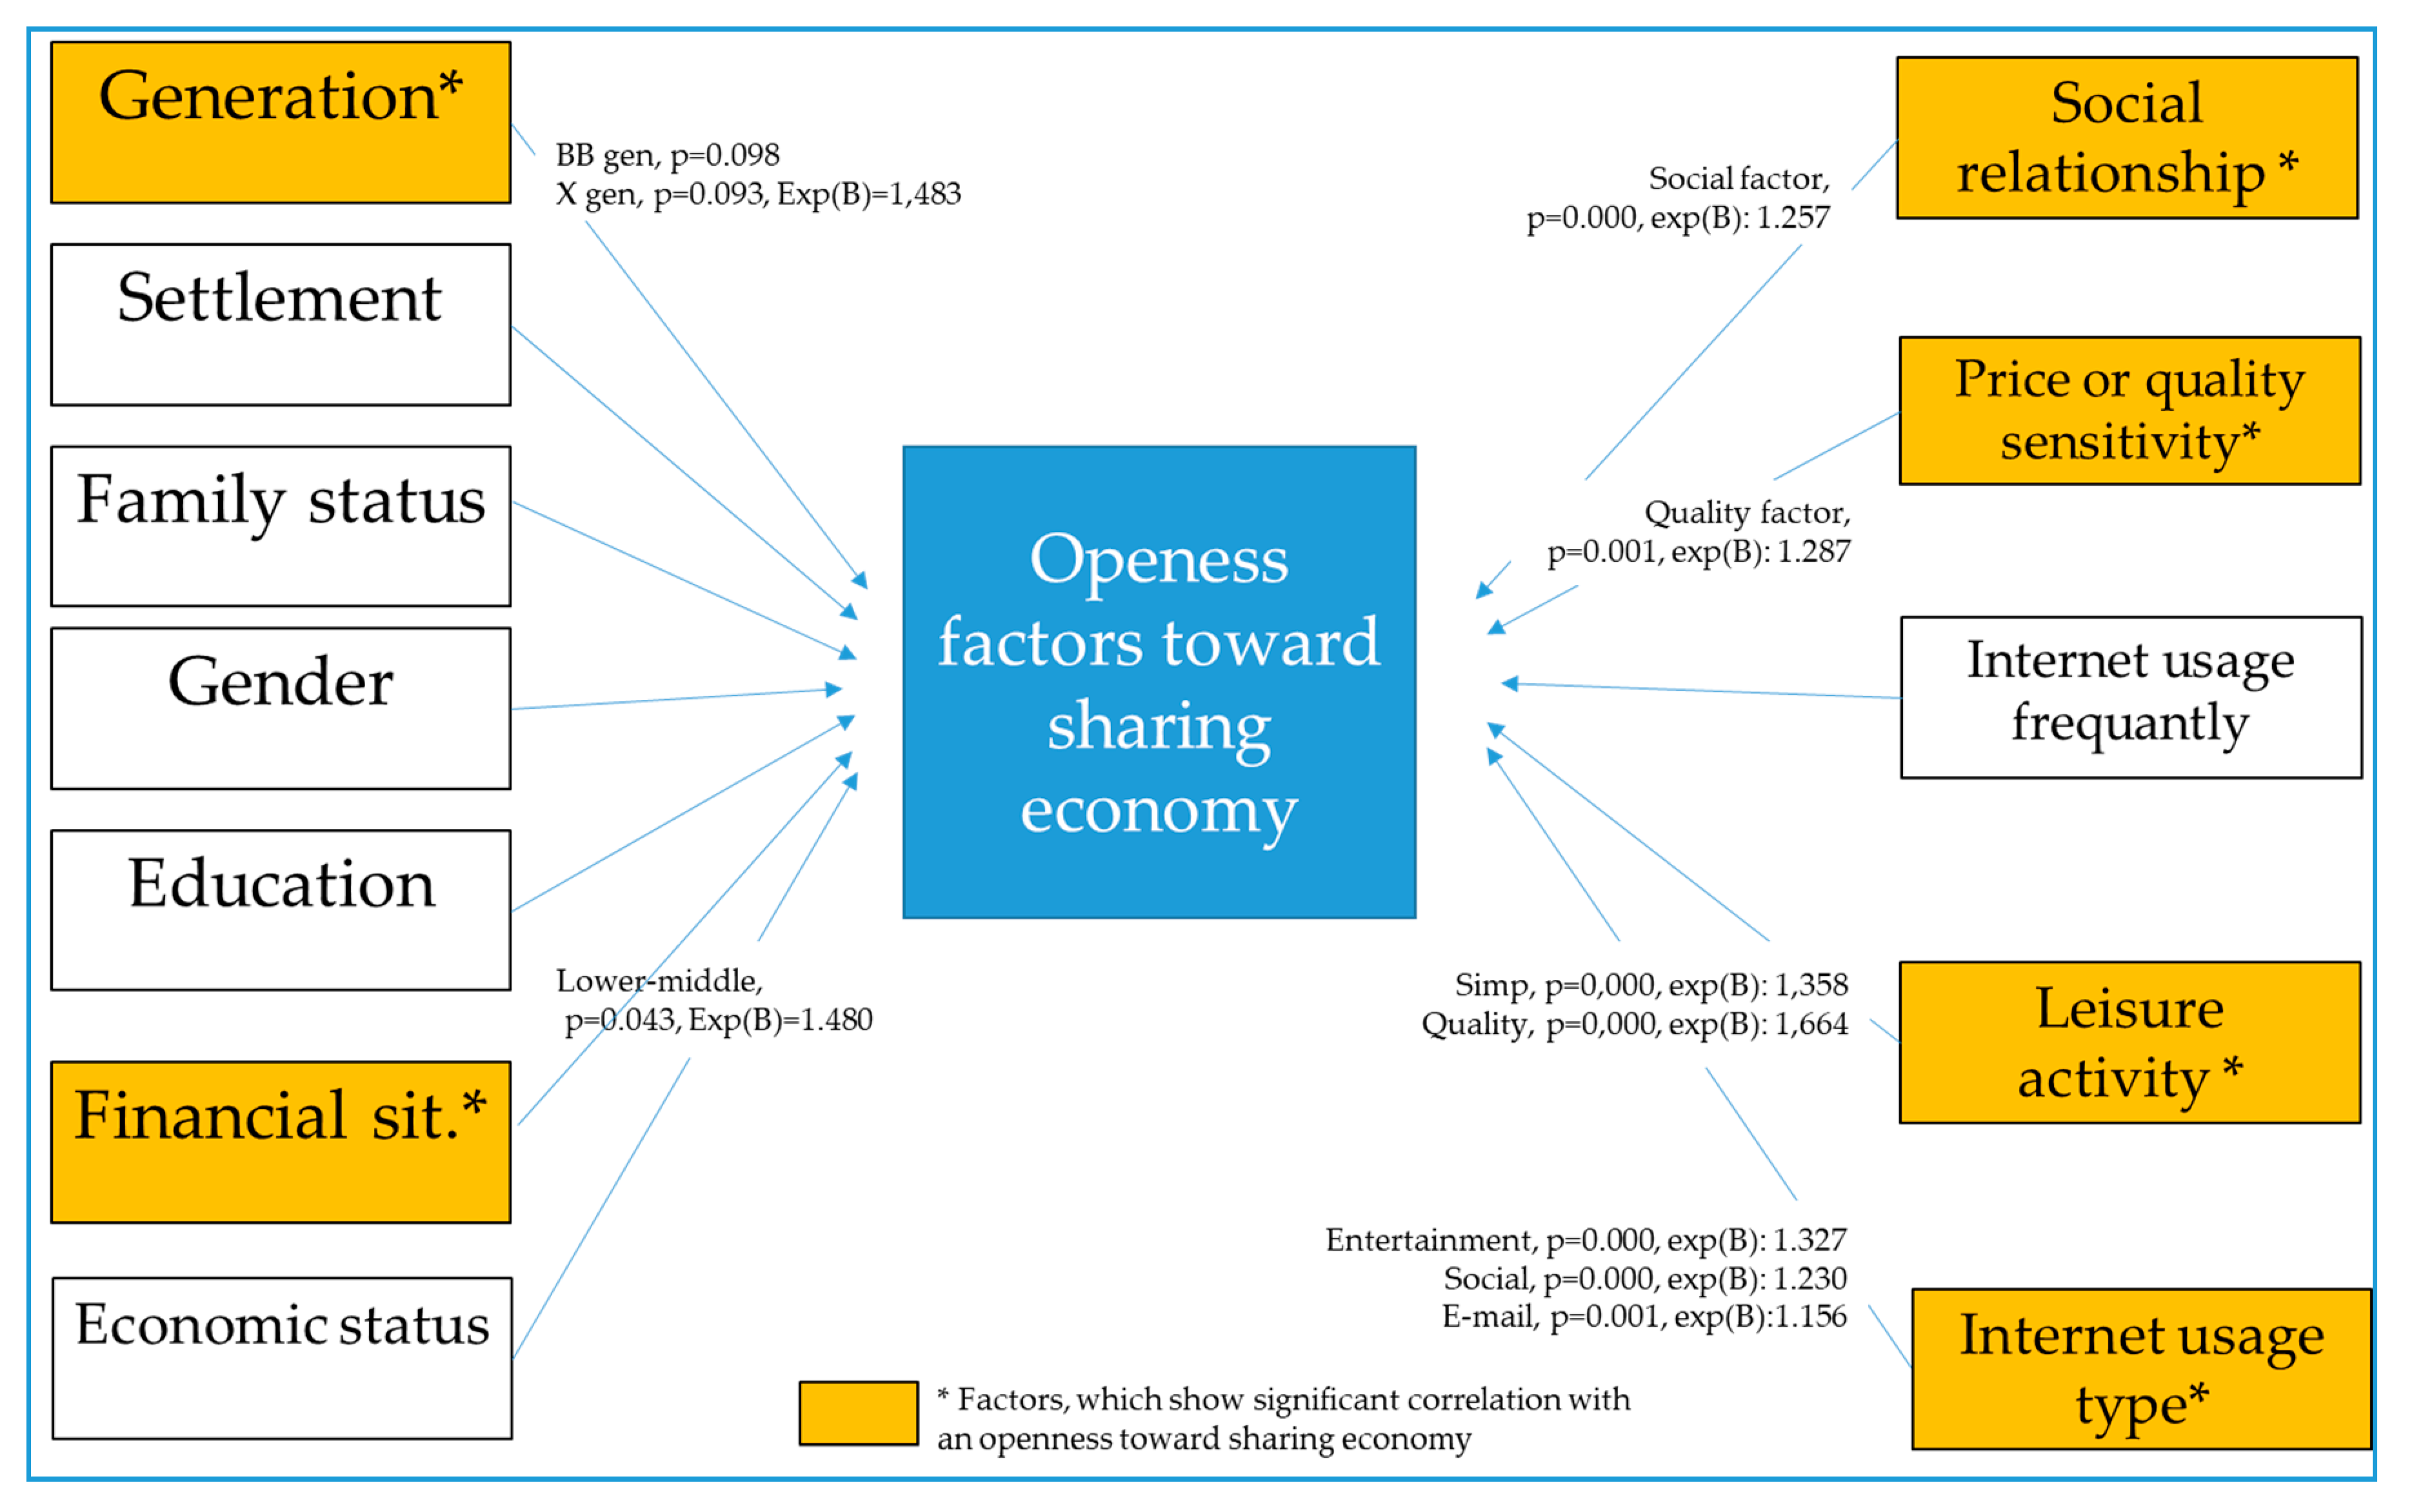
Table 1.
Factors of social behavior attitudes.
| Social Behavior—Factor Analysis | Risk Taking Factor | Social Factor | Conscious Factor | Recycling Factor |
|---|---|---|---|---|
| It is important for me to stand out from the crowd and get noticed. | 0.801 | 0.237 | 0.047 | 0.05 |
| I am willing to pay for home cleaning to make my life more comfortable. | 0.777 | −0.157 | 0.155 | 0.117 |
| I like to take risks. | 0.757 | 0.287 | -0.099 | 0.031 |
| I always want to feel safe in myself. | −0.52 | 0.086 | 0.358 | 0.044 |
| I like meeting new people. | 0.177 | 0.779 | 0.12 | 0.103 |
| It is important for me to fit in with my friends. | 0.036 | 0.77 | 0.116 | 0.001 |
| I like to help other people, even unknown people. | −0.052 | 0.525 | 0.284 | 0.477 |
| I am conscious of my health. | 0.129 | 0.095 | 0.778 | −0.02 |
| It is worth the extra effort to be environmentally conscious. | 0.092 | 0.329 | 0.668 | 0.112 |
| I cannot stand the mess at home. | −0.278 | 0.07 | 0.647 | 0.034 |
| I like to spend most of my free time at home. | −0.401 | −0.291 | 0.418 | 0.274 |
| I do not always want new things, many times buying used products. | 0.057 | −0.091 | −0.095 | 0.844 |
| What I no longer need, but still is usable, I sell or give away. | 0.082 | 0.331 | 0.185 | 0.649 |
Extraction method: rotated component matrix. The bold indicates which variables belong to which factor.
Table 2.
Factors of leisure activity attitudes.
| How Often Do You Do These Leisure Activities? | Quality Leisure Factor | Daily Leisure Factor |
|---|---|---|
| Visit to a museum, exhibition | 0.7 | 0.293 |
| Travel or vacation abroad | 0.694 | 0.365 |
| Wellness programs (e.g., sauna, massage) | 0.69 | 0.307 |
| Cooking for gastronomic purposes (so no housework!) | 0.626 | −0.015 |
| E-book reading | 0.589 | −0.007 |
| Meeting, chatting with friends | −0.01 | 0.772 |
| party in club, disco, etc. | 0.215 | 0.72 |
| Computer activity (games, social networking on Internet, viewing emails, browsing) | 0.196 | 0.685 |
Extraction method: rotated component matrix. The bold indicates which variables belong to which factor.
Table 3.
Factors of attitudes related to willingness to pay.
| How Much Do You Agree with the Following Statement? | Quality Sensitive Factor | Price Sensitive Factor |
|---|---|---|
| I would love to pay more for better quality. | 0.821 | −0.081 |
| I am willing to pay more for a product that is specifically tailored to my needs. | 0.79 | −0.149 |
| I am happy to pay more for environmentally friendly products. | 0.781 | −0.007 |
| I can only trust the leading brands. | 0.691 | −0.149 |
| I always know what’s new and cool. | 0.686 | −0.129 |
| Brand name alone tells a lot about a product or service. | 0.656 | 0.182 |
| When shopping, I compare product prices and look for a really good deal. | 0.143 | 0.761 |
| Before buying, I look through the advertising newspapers and check out the promotions. | 0.082 | 0.757 |
| Price is more important than brand name. | −0.289 | 0.743 |
| I always choose the cheaper product. | −0.393 | 0.665 |
Extraction method: rotated component matrix. The bold indicates which variables belong to which factor.
Table 4.
Attitudes toward the digital world.
| How Much Do You Agree with the Following Statement? | Digital Factor |
|---|---|
| I can’t even imagine life without the Internet. | 0.875 |
| On the Internet, one expresses himself more easily than in reality. | 0.825 |
| The computer is not for me. | −0.731 |
| I try to be the first to try the latest developments. | 0.687 |
| I always prefer online shopping. | 0.612 |
Extraction method: factor analysis, component matrix.
© 2019 by the authors. Licensee MDPI, Basel, Switzerland. This article is an open access article distributed under the terms and conditions of the Creative Commons Attribution (CC BY) license (http://creativecommons.org/licenses/by/4.0/).
Share and Cite
MDPI and ACS Style
Buda, G.; Pethes, B.; Lehota, J. Dominant Consumer Attitudes in the Sharing Economy—A Representative Study in Hungary. Resources 2020, 9, 1. https://doi.org/10.3390/resources9010001
AMA Style
Buda G, Pethes B, Lehota J. Dominant Consumer Attitudes in the Sharing Economy—A Representative Study in Hungary. Resources. 2020; 9(1):1. https://doi.org/10.3390/resources9010001
Chicago/Turabian StyleBuda, Gabriella, Barbara Pethes, and József Lehota. 2020. "Dominant Consumer Attitudes in the Sharing Economy—A Representative Study in Hungary" Resources 9, no. 1: 1. https://doi.org/10.3390/resources9010001
Note that from the first issue of 2016, this journal uses article numbers instead of page numbers. See further details here.