4.1. Openness
Analyzing the responses of the Hungarian nationally representative sample, we found that at least 12% of people are open to one of the sharing economy services. A total of 12.3% of respondents said they were open to borrowing and lending household appliances. The ratio of the respondents who are open toward different sharing economy services (respondents who said ‘would use’, or ‘would definitely use’, or ‘have already used’) is: 12.3% for borrowing or lending household appliances; 15.8% for public car-sharing (e.g., DriveNow, Munich, Germany); 23.7% for public car ride-sharing (e.g., BlaBlaCar, Paris, France); 21.5% for private car-sharing within the city (e.g., Uber, San Francisco, CA, USA); 23.2% for public bike-sharing; and 20.1% for private flat-sharing (e.g., Airbnb, San Francisco, CA, USA).
We then aggregated the data according to the methodology described above, into the ‘group of acceptors’ and ‘group of refusers’. Those who, for each question, answered that they would not use the service or may not use it, fell into the group of ‘refusers’. Everyone else fell into the ‘acceptors’ group. Based on this, 38.4% of the Hungarian population is open toward sharing economy services (11.3% open to one thing, 8.5% open to two things, 6% open to three things, 12.6% open to at least four), while 61.6% of the respondents are not open to sharing economy services.
4.1.1. Socio-Demographic Data versus Openness
The following socio-demographic features were examined: gender, economic status, marital status, age (generation), education, settlement type, and financial status of the respondent. Cross-table and pairwise correlation analyses were performed to determine whether socio-demographic factors influence openness (tested based on groups of acceptors and refusers).
Gender: the gender of respondents did not influence openness towards shared services. A total of 38.4% of the total sample was open toward sharing economy services (as acceptors), this included 39.8% of the men, and 37.1% of the women. The effect of gender is not significant (p = 0.095).
Economic status: Openness is overrepresented among active workers and students, with a significant relationship (p = 0.000, Chi2 = 318.4 df = 3, Cramer’s V = 0.301). While 38.4% of the total sample was open to sharing economy services, 46.7% of active employees and 56.8% of students were open to sharing economy services, meaning they were proportionally over-represented compared to the total sample. By contrast, only 15.5% of retirees were open to sharing economy services. Among the demographic factors examined in this study, the impact of this economic status was one of the strongest elements.
Family status: The family status of the respondent influences openness. Here, two categories were distinguished, namely, those respondents who had a minor child were considered as family subjects. The relationship is significant (p = 0.000, Chi2 = 48.346 df = 1, Cramer’s V = 0.117). We found that families are more open toward sharing economy services. While 38.4% of respondents in the full sample were open to the sharing economy services, 46% of respondents with a family were open to these service.
Generation: Belonging to particular generation influences openness. The correlation is significant, and it is the strongest influencing factor among the examined factors (p = 0.000, Chi2 = 361.001 df = 3, Cramer’s V = 0.320). The Baby Boomers is negative, 84% of this generation refuse sharing economy services (significantly overrepresented), compared to a rejection rate of the entire sample of 61.6%. Furthermore, we found that while 38.4% of the population in the total sample is open to shared services, the proportion of those showing openness within the Y and Z generations is higher (Y: 53.9%, Z = 52.4%), which means that these generations are much more open to using sharing economy services.
Education: Educational level influences openness. The effect is significant, though the relationship is weaker than the previous indicators (p = 0.000, Chi2 = 144.715, df = 3, Cramer’s V = 0.203). Within the group who are open to sharing economy services (38.4%), those who have a graduation or university diploma are overrepresented (group with graduation: 45.4%, group with a diploma: 50.8%).
Residence: We found that the type of place of residence of the respondent influences openness; the relationship is significant but weak (p = 0.000, Chi2 = 26.077 df = 3, Cramer’s V = 0.086). A total of 38.4% of respondents were open to shared services, in which 37% of Budapest residents, 45.5% of residents of towns and cities with county seats, 38.9% of residents of smaller towns and villages, and 33.6% of residents of villages are open. Based on this, residents of county seats and cities with county rights are the most open to using the sharing economy services.
Financial situation: We found that the financial situation influences openness. The respondents were classified into four categories (lower, lower-middle, upper-middle and upper) based on their financial position. As a result of the cross-table analysis, we found that the higher the income category of the respondent, the more open they were to sharing economy services. The effect is significant, and the association is moderately strong compared to the other demographic factors examined in the study (p = 0.000, Chi2 = 227.786 df = 3, Cramer’s V = 0.254). More than half (56.3%) of those in the upper class, 43% of the upper-middle class, 28.9% of the lower-middle income group, and only 20.8% of the lower income group were open to sharing economy services.
In conclusion, the socio-demographic factors examined (economic status, marital status, age (generation), educational attainment, type of settlement, and financial status) do indeed influence openness to shared services, and only the gender of the respondent (male/female) does not affect openness. Based on this, our original Hypothesis 1 was rejected because we assumed that all the examined socio-demographic data would influence the openness.
4.1.2. Consumer Attitudes versus Openness
Nearly forty questions related to consumers’ attitude were asked on the following topics: socio-relationships (extrovert vs. introvert, health and/or environmental awareness, risk-taking), leisure activities (frequency and type), product/service purchase attitude (price vs. quality), and attitudes toward the digital world. Factor analysis was performed on each of these four topics.
(1) Social Behaviors
The factor analysis resulted in thirteen observed variables aggregated into four factors. We identified the following factors: risk-taking factor, social factor, conscious factor, and recycling factor (
Table 1).
In future analyses, we will use these factors in relation to social behavior.
(2) Leisure Activity
We identified the following factors: the simpler daily leisure factor (friends, entertainment, computer games), and the higher quality leisure factor (e.g., museums, traveling, wellness programs, gastronomy tours). The results are shown in
Table 2.
(3) Attitudes Related to Willingness to Pay
We identified the following factors: the quality-sensitive factor and price-sensitive factor (
Table 3). Quality-sensitive factor means that people are willing to pay for quality, while the price-sensitive factor means that people compare the prices of products and the possibilities, and may not always choose the better quality.
(4) Openness to the Internet
Finally, we looked at how people relate to the digital world and computers. Five questions were asked and only one factor was obtained using the factor analysis method. Related variables are presented in
Table 4; we named this the digital factor.
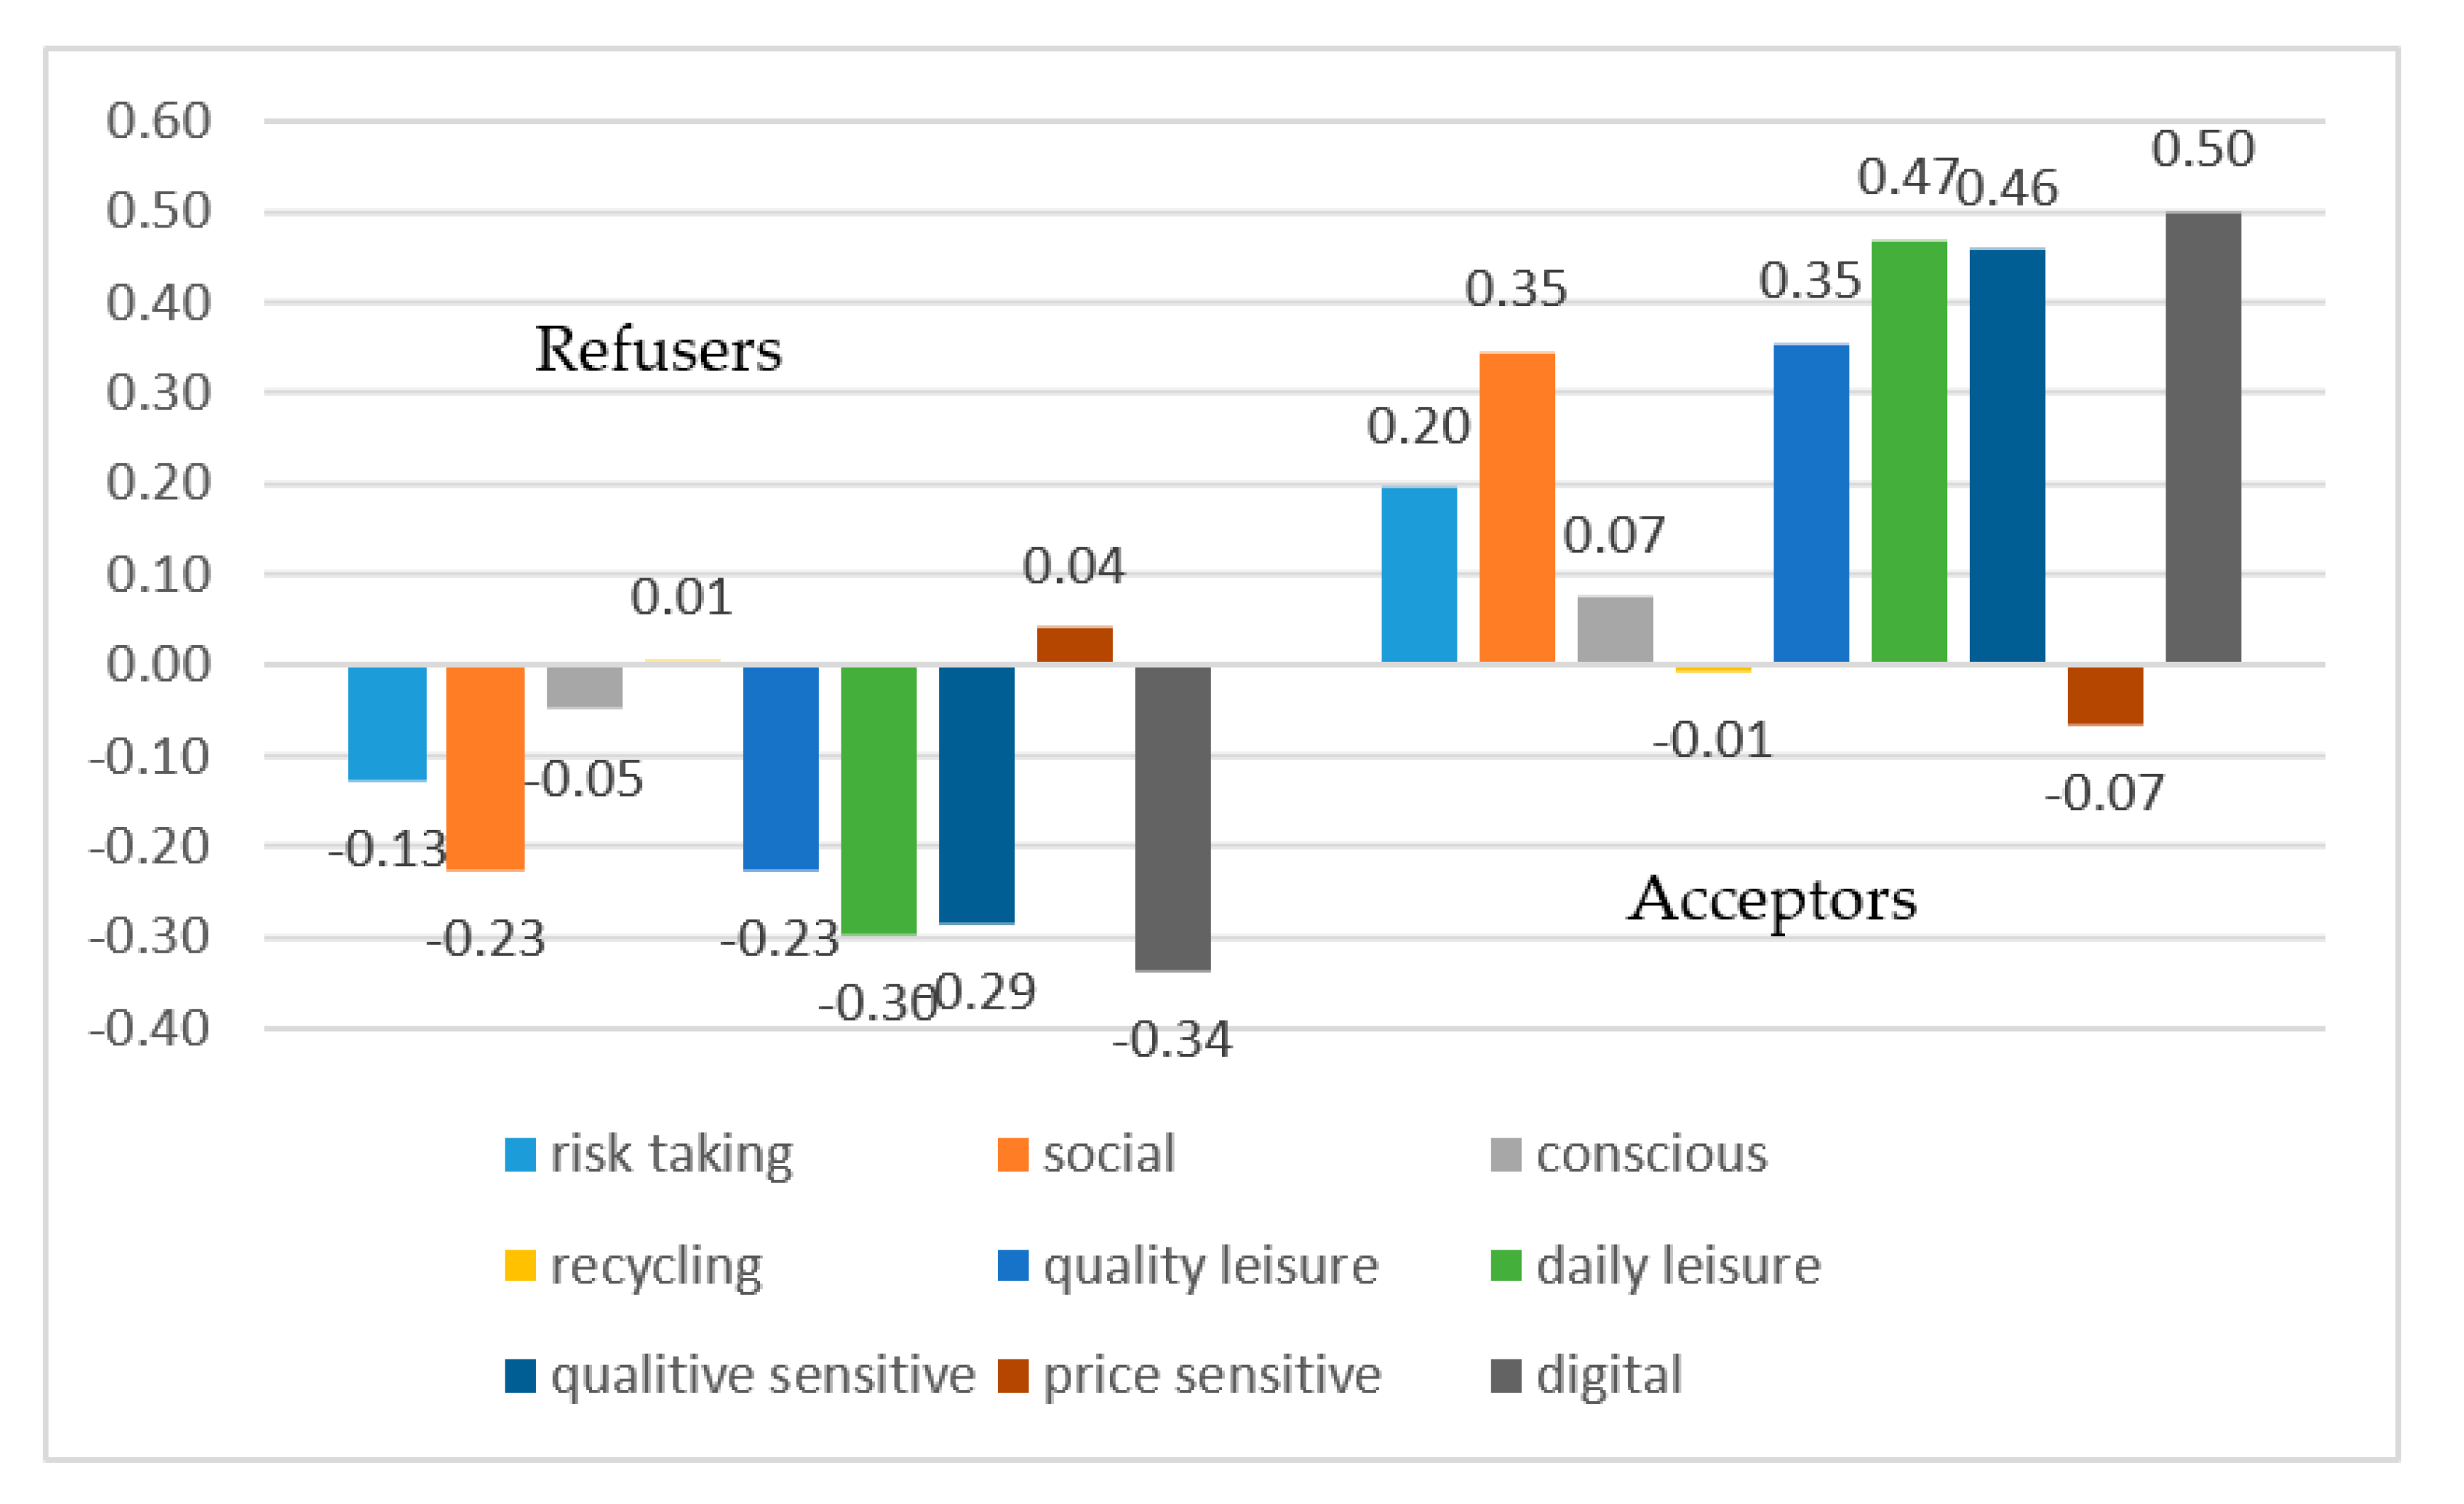
After dimension reduction, the factors were specified, and we examined the relationship between factors and openness to the sharing economy using an independent sample t-test. After generating and naming the factors, we examined whether there was a difference in factor scores between acceptors versus refusers. To do this, we measured the average of each group and looked for significant differences. In the case of the original variables, a higher numerical value means that someone was using the given function and a lower numerical value means that someone does not use that function. In this case, a lower average value indicates that the given factor is less typical for the group. Similarly, a high average value in a group indicates that the group is characterized by the use of elements belonging to that factor. The openness variable classifies people into two categories, so we tested the significance of the difference in means with two-sample t-tests. When presenting the results, we indicate the average of the factors in parentheses.
From the social relationship point of view, those people who are more open toward sharing economy services are:
- -
taking more risks (average of acceptors’ group: 0.2; average of refusers’ group: −0.13);
- -
those who prefer social events and meeting unknown people (average of acceptors’ group: 0.07; average of refusers’ group: −0.05);
- -
who are more health and environmentally conscious (average of acceptors’ group: 0.35; average of refusers’ group: 0.01).
We obtained a special result in terms of the recycling factor: average of acceptors’ group: −0.01; average of refusers’ group: −0.05. This means that the attitude toward recycling is similar for both groups. Here, we have to highlight that recycling attitude is only one element of environmentally and health conscious people’s attitudes.
Taking into consideration all the results Hypothesis 2 was accepted, environmentally and health conscious persons are more open toward sharing economy services.
From the point of view of leisure activity, those people who are more open toward sharing economy services are:
- -
participating more often in a quality, active leisure activities, (average of acceptors’ group: 0.35; average of refusers’ group: −0.22);
- -
likely to be off during the week (average of acceptors’ group: 0.47; average of refusers’ group: −0.3).
Based on the results, Hypothesis 3 was accepted: those people—who like to be in the community and relax with friends—are more open toward sharing economy services. Furthermore, Hypothesis 4 was also accepted: those people who enjoy traveling and collecting experiences are more open toward sharing services.
Concerning the pricing of products/services, those people who are more open toward sharing economy services are:
- -
those who can and do pay for branded and/or quality and/or environmentally friendly products, (average of acceptors’ group: 0.46; average of refusers’ group: −0.28);
- -
who are not price-sensitive, do not search through promotional ads, (average of acceptors’ group: 0.07; average of refusers’ group: −0.04).
Based on these results, Hypothesis 5 was accepted: those people—who are willing to pay for quality things—are more open toward sharing economy services.
Regarding the perception of the digital world, those people who are more open toward sharing economy services (among Internet users) are:
- -
those who use the Internet, consider it as a part of their daily life, and buy online (average of acceptors’ group: 0.5; average of refusers’ group: −0.33).
Based on the results, Hypothesis 6 was accepted: those people—who believe that the digital world is a positive thing—are more open to sharing economy services.
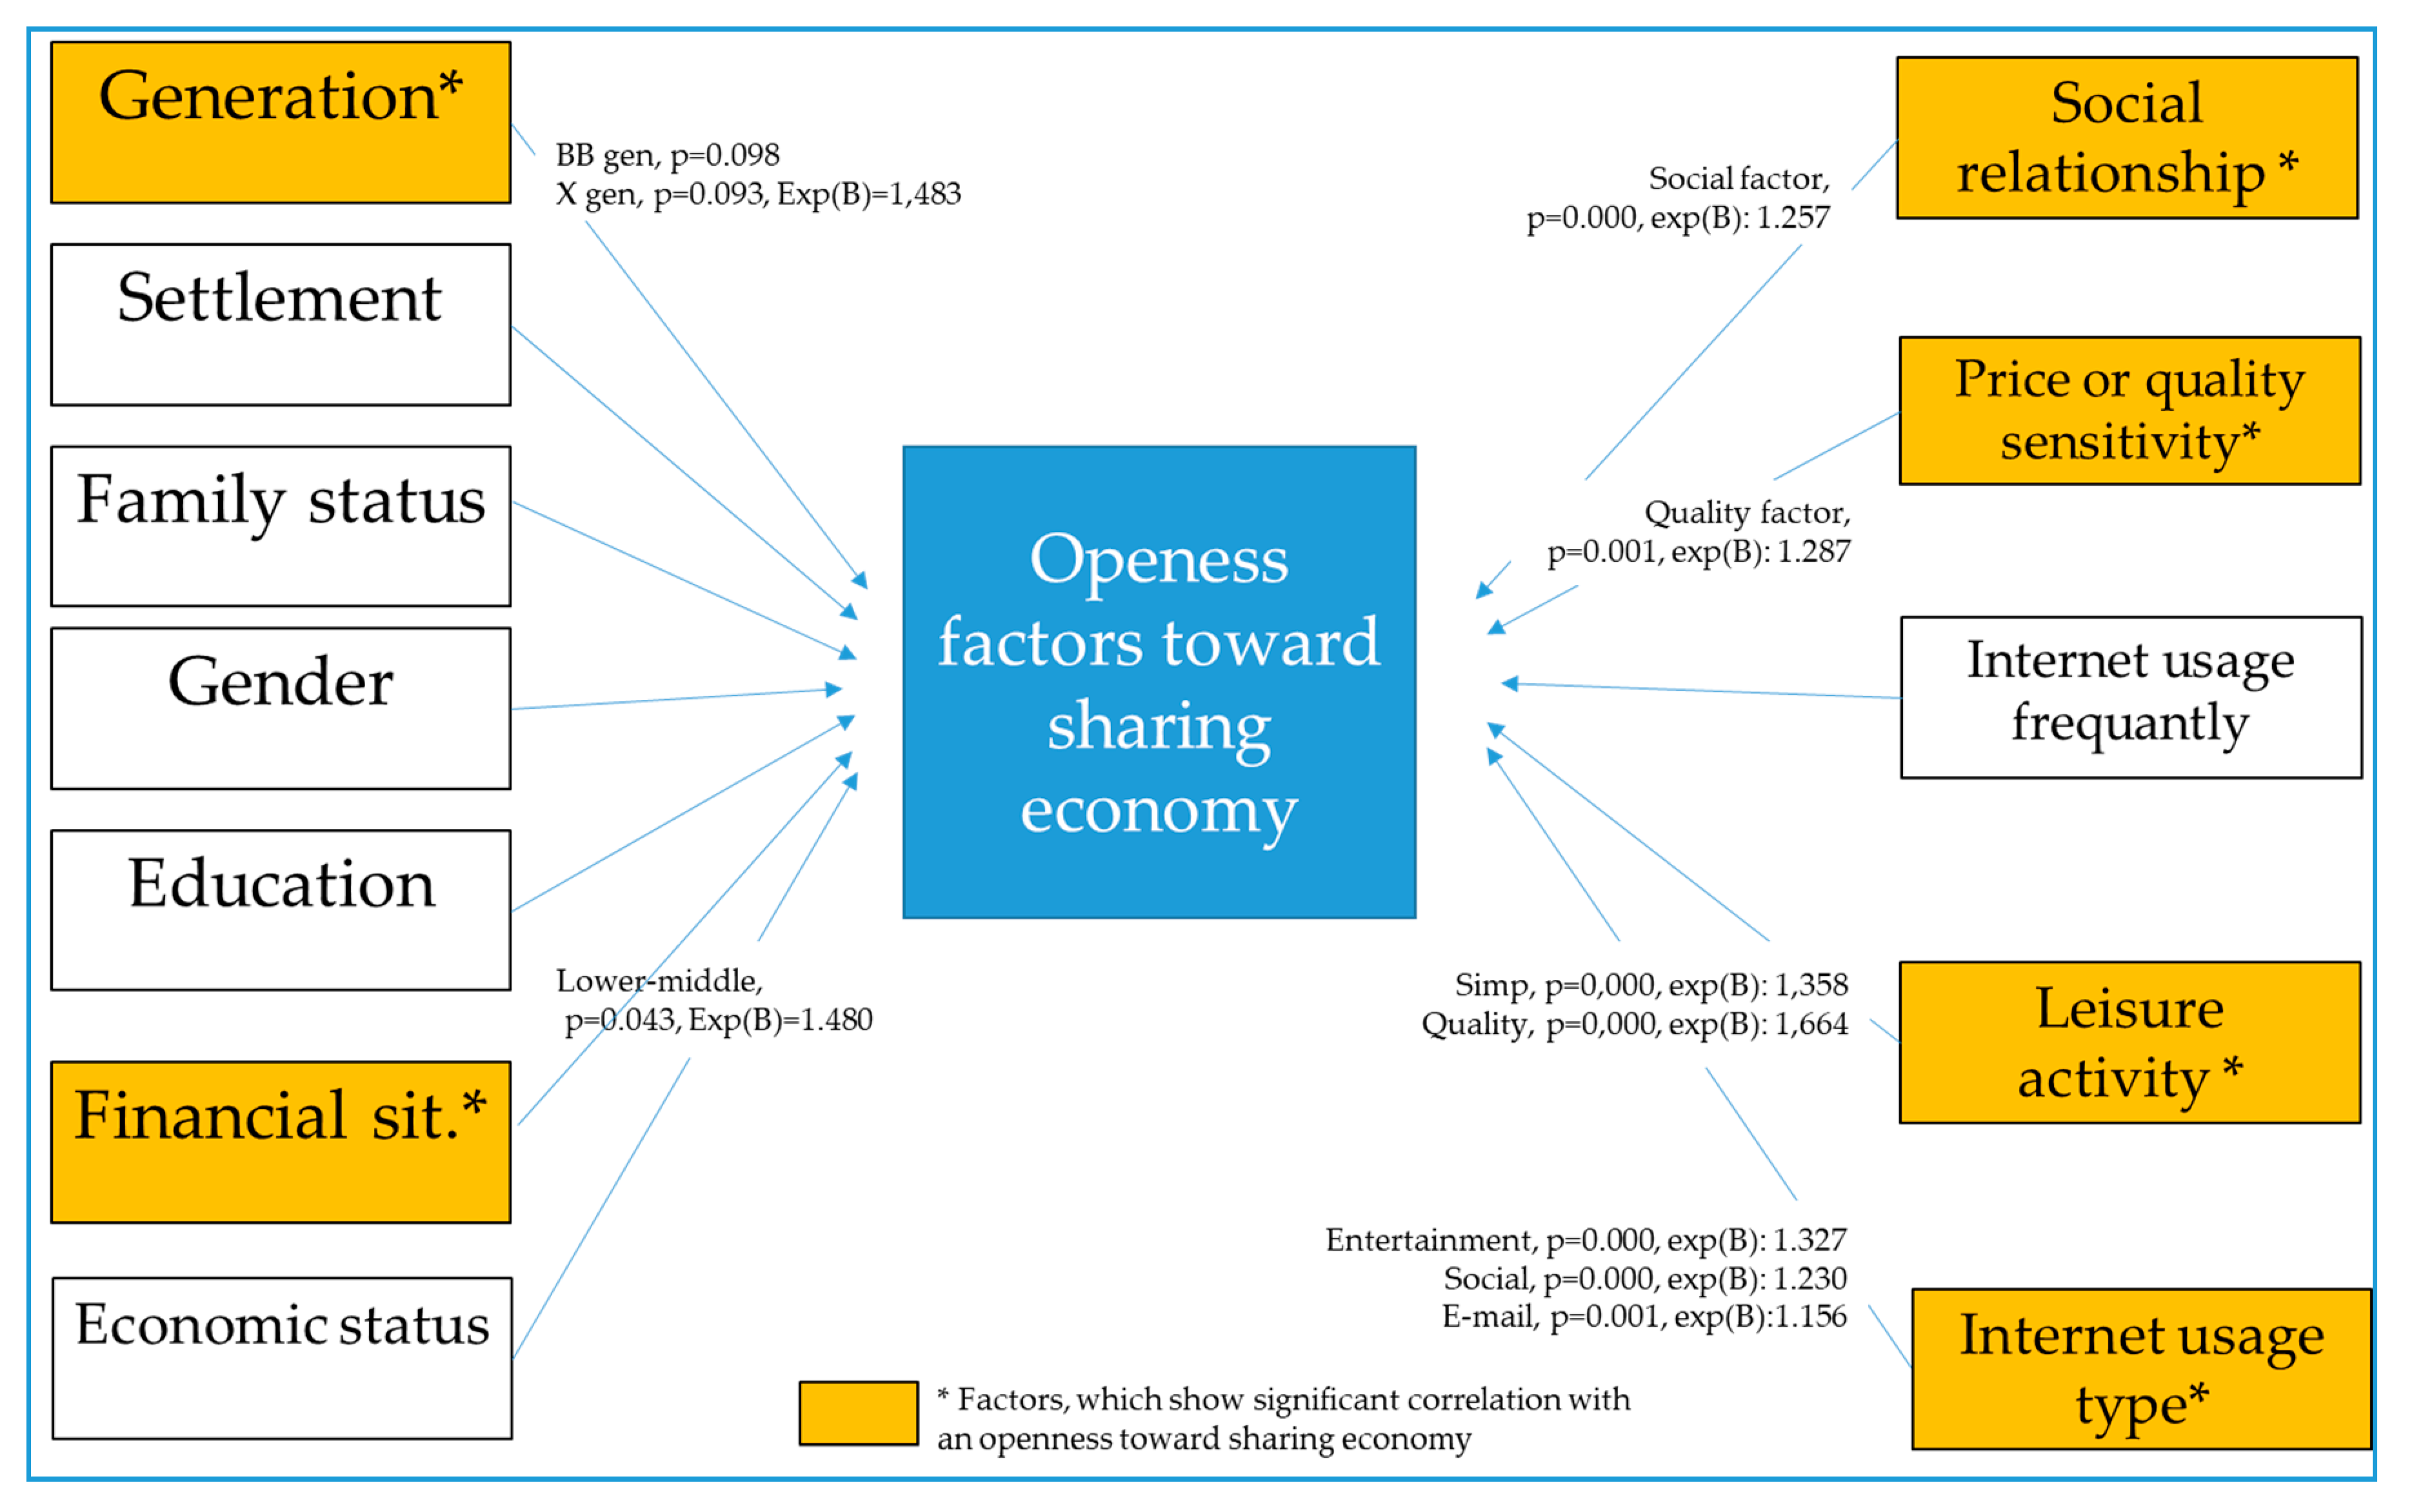
Taking into consideration all the consumers’ attitudes which were examined in the questionnaire, we identified that the characteristics of the group of acceptors are similar and parallel to the specific features of current megatrends. There is one interesting exception: the attitude toward recycling is similar for both groups. The price sensitivity attitude is more typical of the refuser group, but this does not contradict our basic hypothesis, price sensitivity is not a feature of current megatrends. The summary diagram is shown in
Figure 2.
4.1.3. Different Types of Internet Activities versus Openness (Subgroup, Analysis among Internet Users)
Internet activities could include simpler or more complex activities. We looked at the relationship between different Internet activities and openness (within the same two groups of acceptors and refusers). Of the total sample, 2534 used the Internet, and their answers were considered in the factor analysis.
In the questionnaire, 23 questions were asked about Internet activity. From these 23 variables, we created factors, by exploration, and there was no specified factor structure that we could confirm. Four factors were generated and the following indices were obtained: KMO (Kaiser-Meyer-Olkin) value is 0.909, which is above the expected value of 0.7, so the result is acceptable. The next item to consider was communality, where the value of each variable was above the threshold of 0.25, so no variables needed to be subtracted from the initial set of variables. The combined explanatory power is 49.36%, well above the expected level of 30%, so we consider the result acceptable.
The following names were given to the resulting factors:
Internet activities for entertainment—Related to the following Internet activities: on-line movie, streaming of films and series; downloading of films and series; downloading music; online radio listening; games; posts in forums.
Complex Internet activities—Related to the following Internet activities: on editing own blog; designing your website; home-based work; online photo hosting; on-line web hosting; e-learning.
Social Internet activities—Related to the following Internet activities: on online social sites; Internet chat, instant messaging programs; on-line video sharing; Internet phones, videophone.
Browsing, e-mail, purchase—Related to the following Internet activities: on work-related or private; browsing of websites (for information, entertainment); purchasing.
The results of the T-tests for the factors of Internet activity:
entertainment factor (t = −10.116, df = 2112.266, p = 0.000);
complex factor (t = −3.485, df = 2152.96, p = 0.001);
social factor (t = −8.633, df = 2356.336, p = 0.000);
browse—email–purchases (t = −8.843, df = 2360, p = 0.000).
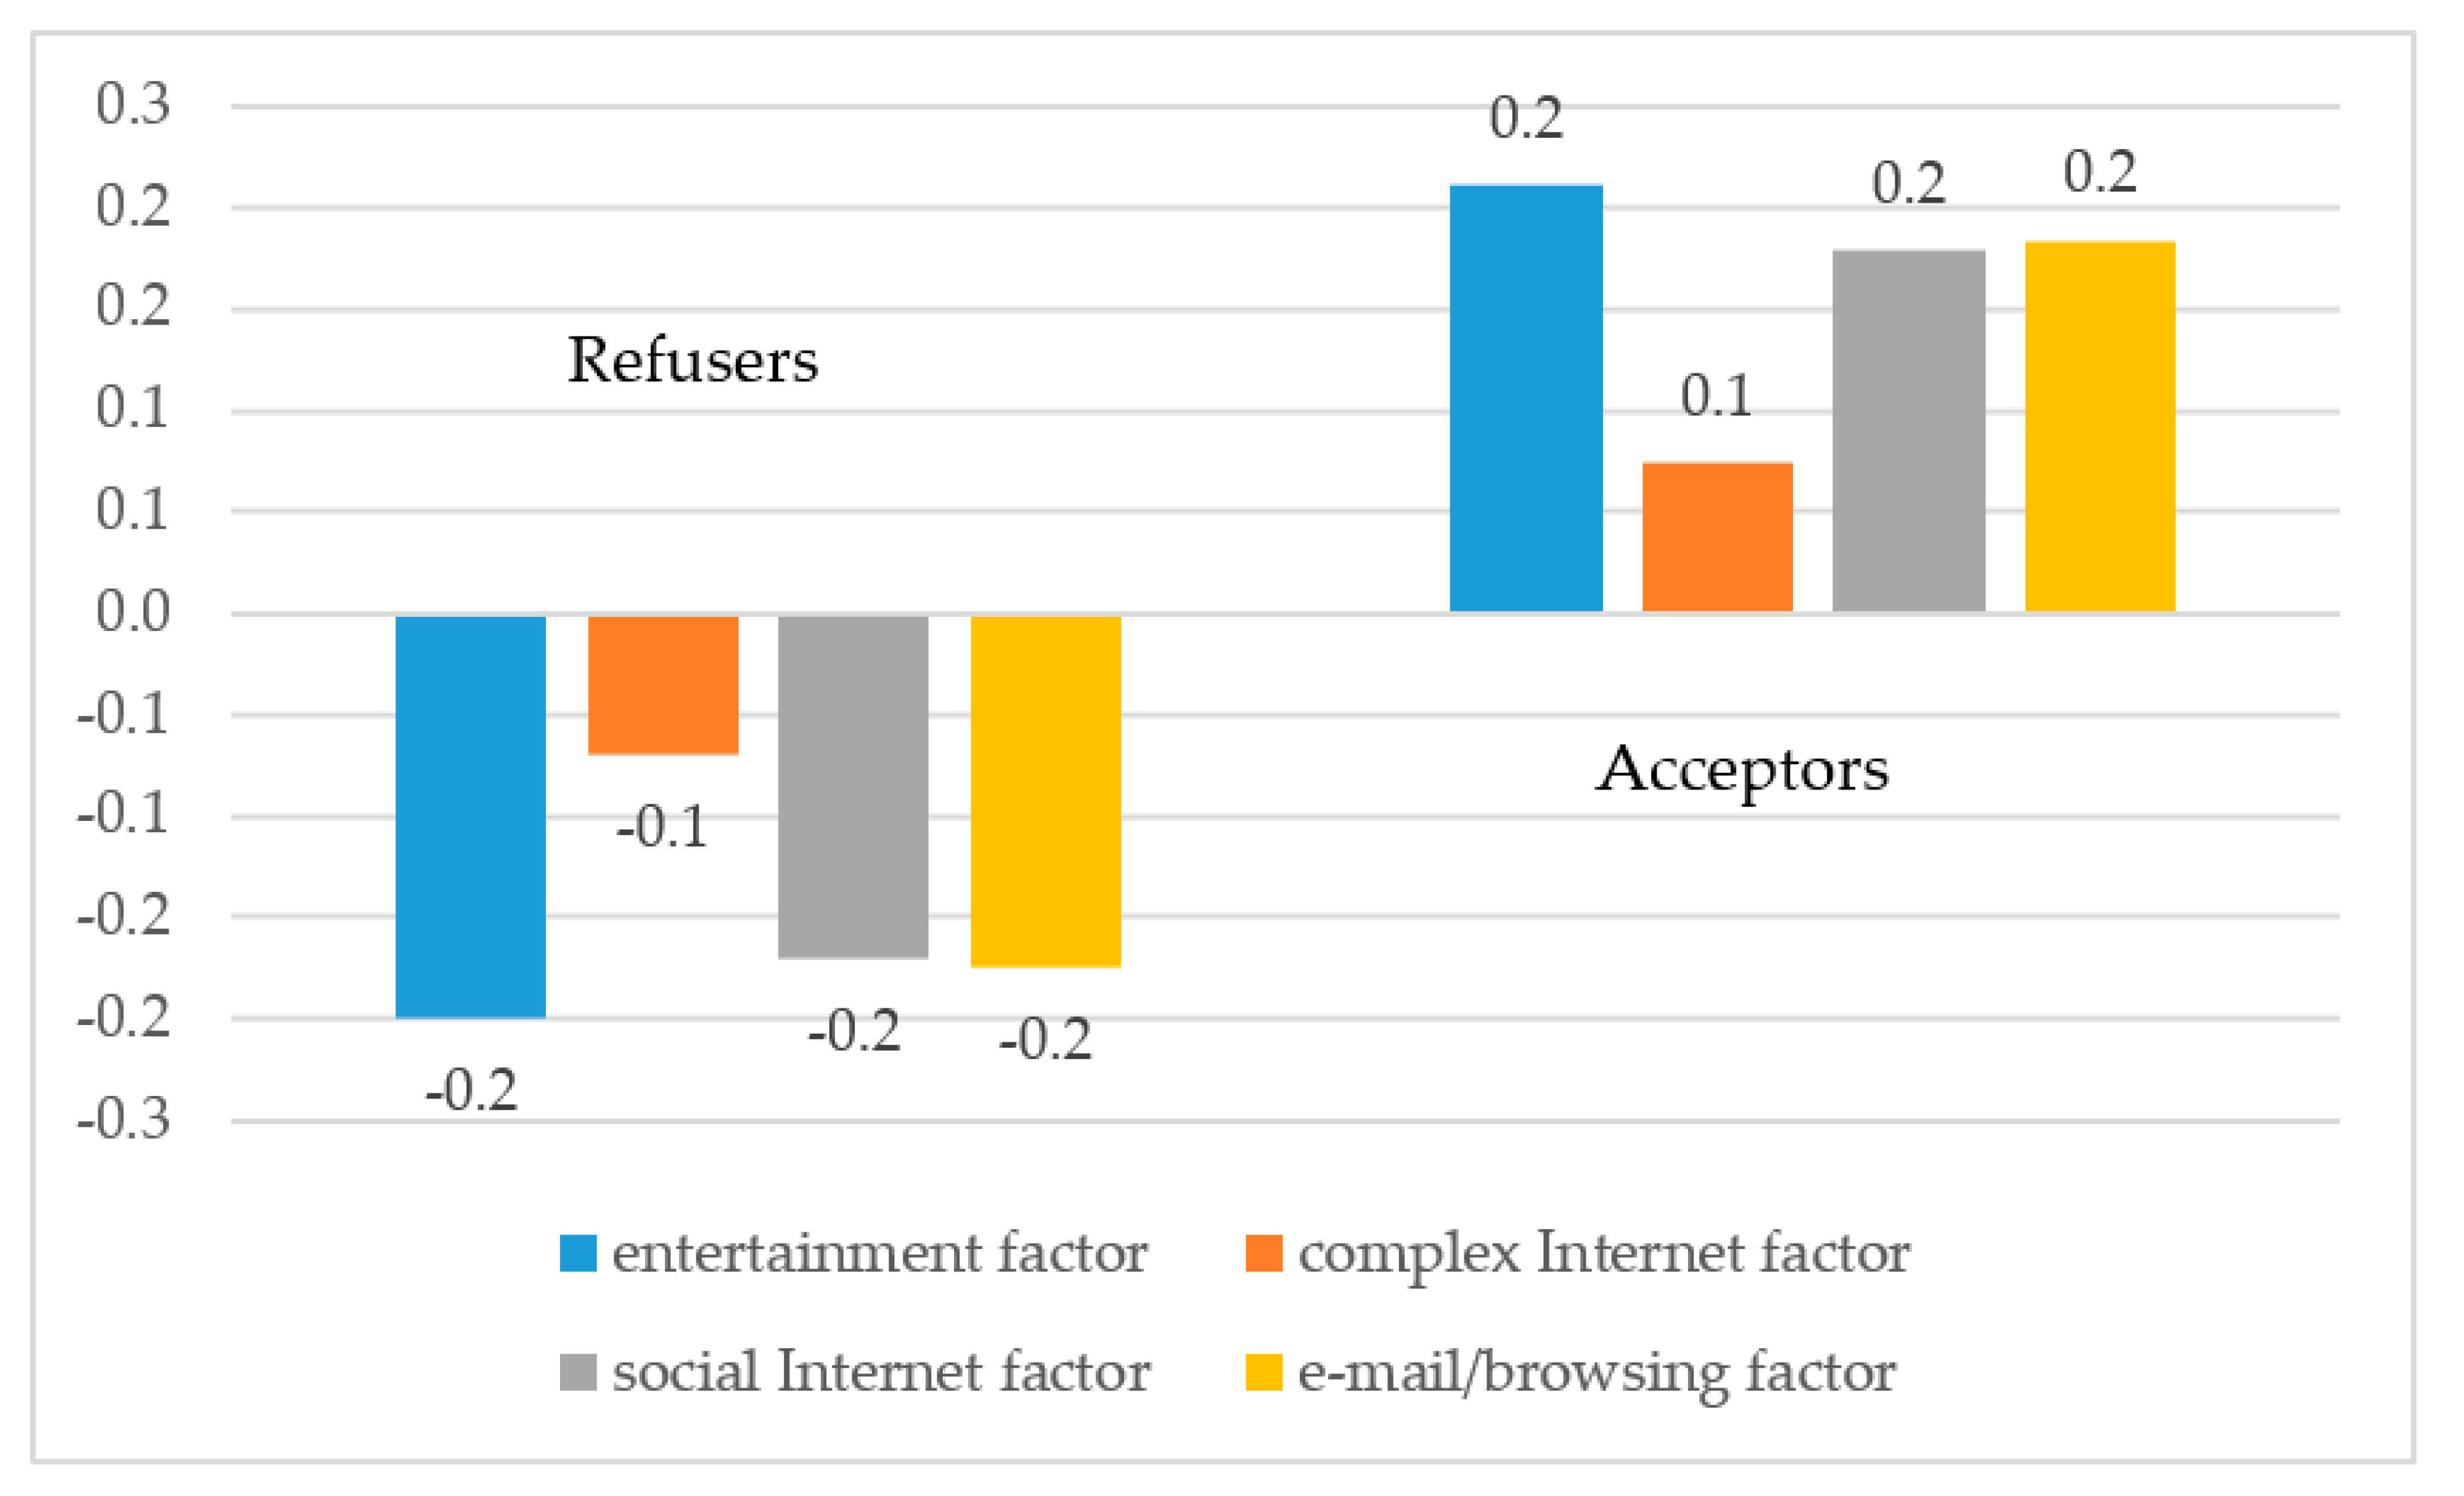
After generating and naming the factors, we examined whether there was a difference in factor scores between acceptors and refusers. To do this, we measured the mean of each group, as before, and looked for significant differences. The results are presented in
Figure 3.
entertainment factor (average of acceptors’ group: 0.2; average of refusers’ group: −0.2);
complex factor (average of acceptors’ group: 0.1; average of refusers’ group: −0.1);
social factor (average of acceptors’ group: 0.2; average of refusers’ group: −0.2);
browse–email–purchase (average of acceptors’ group: 0.2; average of refusers’ group: −0.2).
There is a significant difference in the means for all four variables. In each of the four cases, it can be seen that the acceptors’ groups achieves a higher average, that is, all four activities are more typical for the acceptors’ group. Observing the averages, it is worth pointing out that there is the smallest difference between groups in the case of complex Internet activities. Based on these results, Hypothesis 7 was accepted.
4.2. Logistic Regression Model
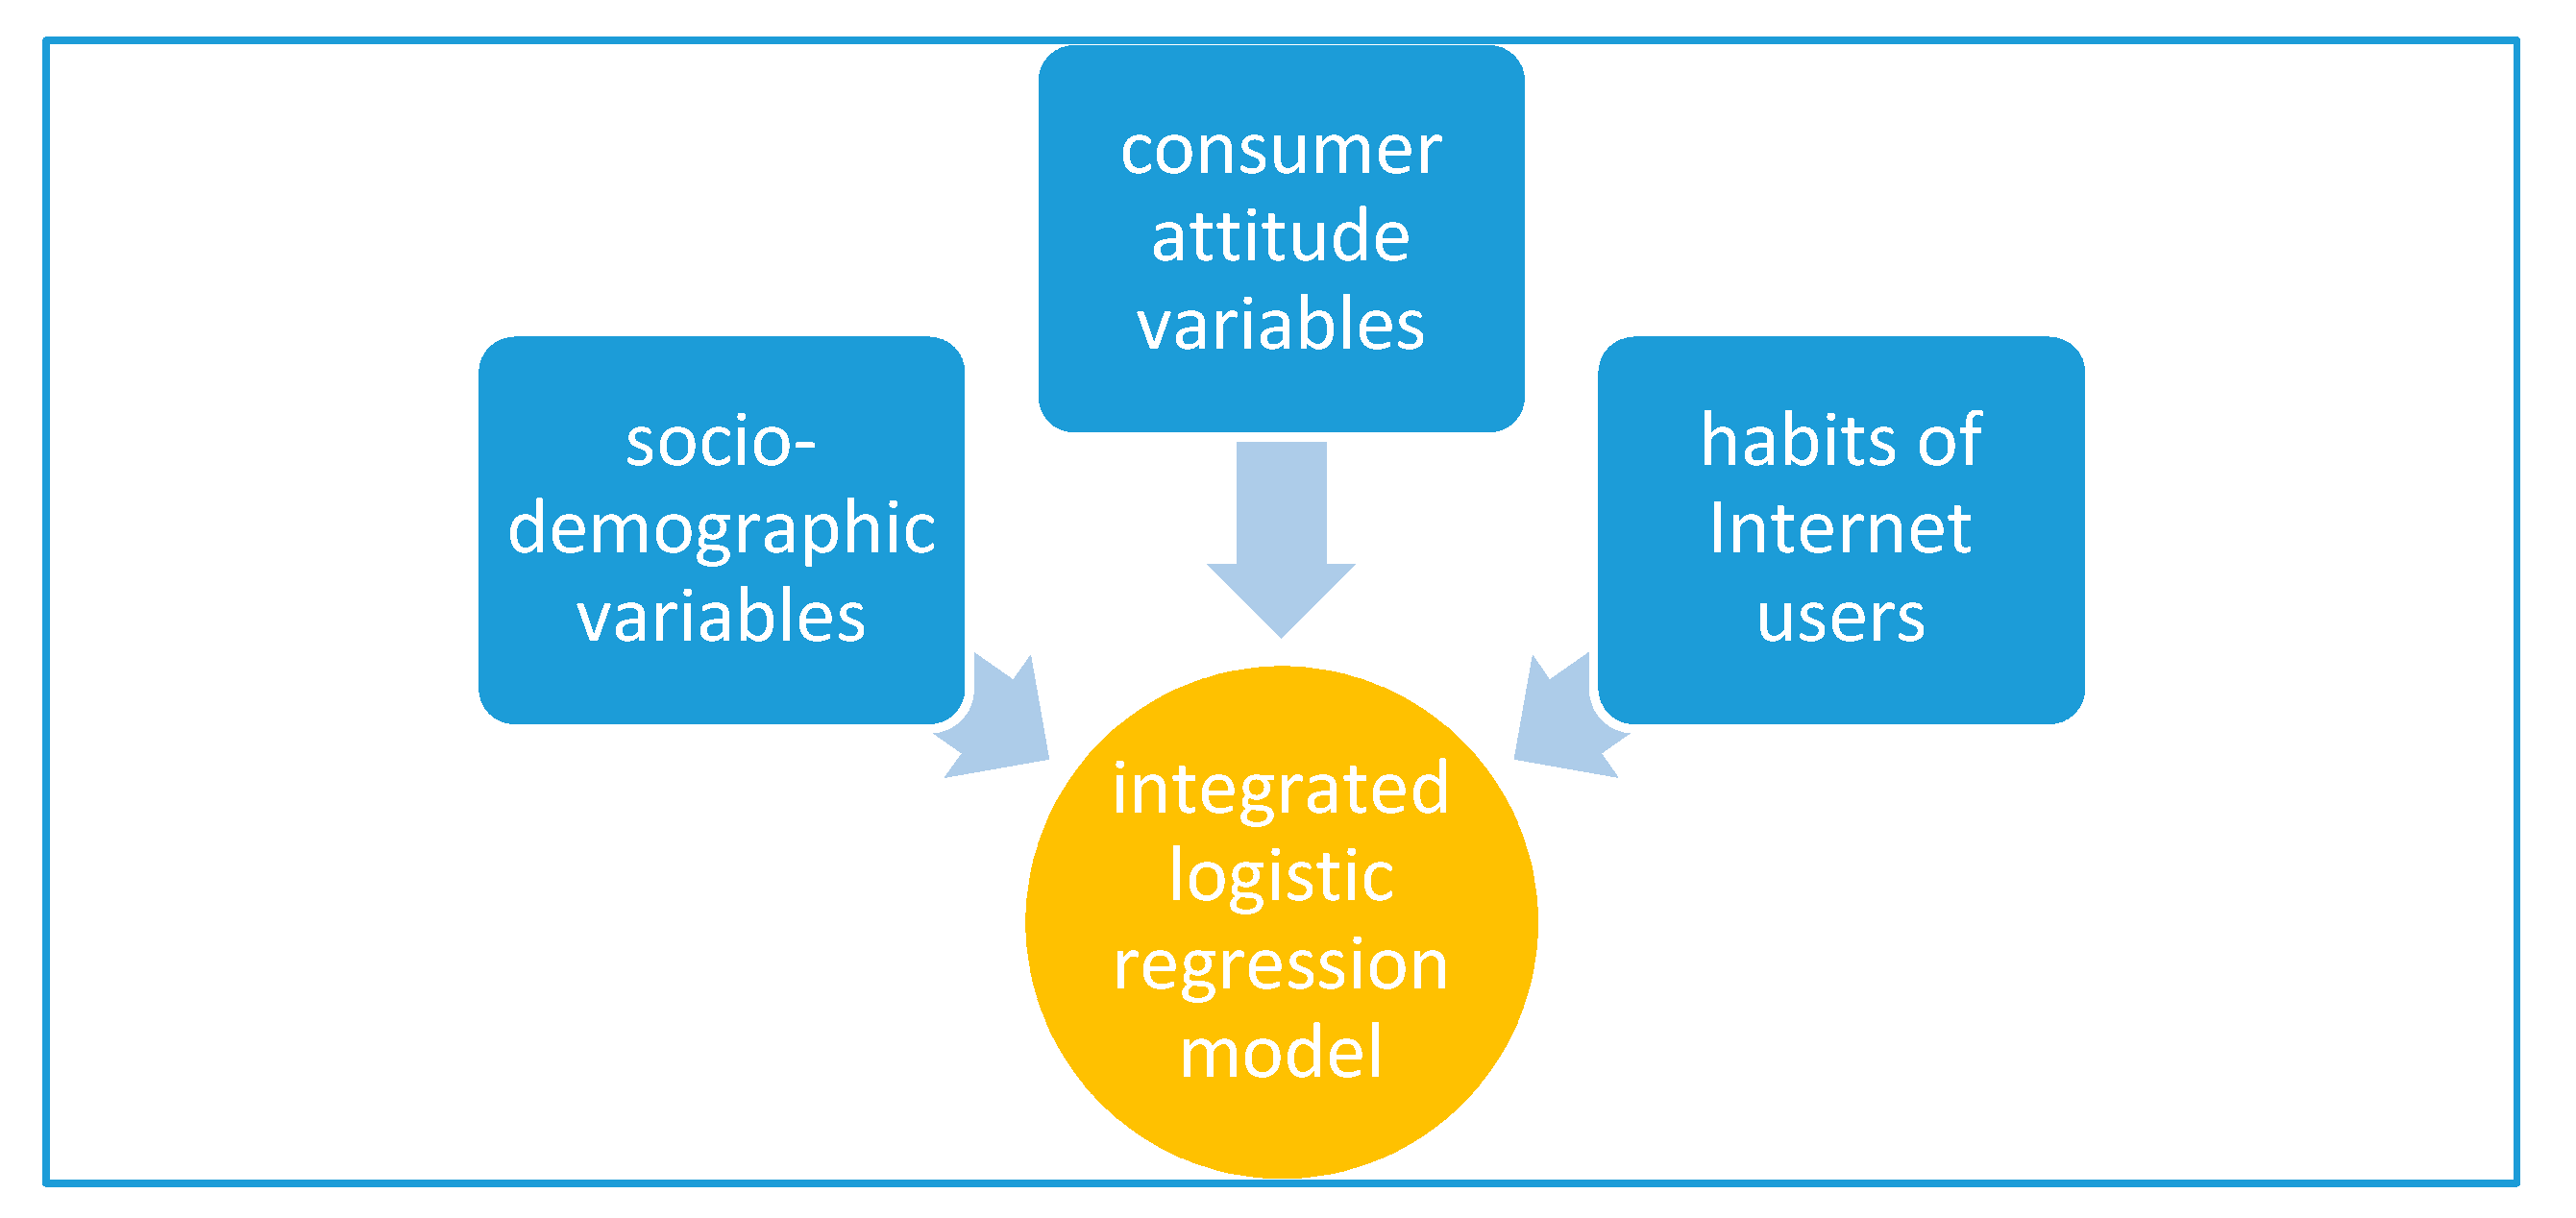
Finally, regression modeling was used to determine which of the various socio-demographic, attitudinal, and Internet activity characteristics had the greatest impact on openness. The use of the Internet greatly influences the openness towards the sharing economy, therefore we used only the population using the Internet in the regression model study.
First, we constructed the regression models one by one in the following order: socio-demographic, consumer attitudes, and Internet usage patterns.
4.2.1. Socio-Demographic Regression Model
We looked at gender, economic status, generational affiliation, settlement type, wealth segment, education, and family status. Based on this,
generational affiliation, financial status, and educational qualification have a significant effect on openness, the results of which are also shown in
Appendix C.1. The regression model, which is based on socio-demographic factors, has 60% explanatory power. That is, if we know the generational affiliation, income level, and educational background, we can determine with 60% good faith whether or not a person is open to sharing economy services. Within the generation factor, the Baby Boomers is the least open, and the X generation twice as open (exp (B): 2.048), the Y generation three times as open (W: 28.5, exp (B): 2.929), and the Z generation four times as open (exp (B): 4.121) towards sharing economy services, relative to the Baby Boomers. In terms of income level, respondents in the lowest income category are the least open, with the lower-middle 1.7 times, upper-middle 1.8 times, and upper income respondents 2.6 times more open. The third independent variable in the case of socio-demographic factors is education, which has a significant impact on openness. People with a primary education level are the least open, followed by vocational graduates (exp (B): 1.532), high school graduates (exp (B): 1.986), and university or college graduates (exp (B): 2.155). All the results are linked in
Appendix C.1.
The aim of the regression model, in this case, was to find the most open target population along with socio-demographic factors. The results show that Generation Z people with a high income and college education are the most open, meaning they should be targeted by various marketing tools.
4.2.2. Regression Model Based on Consumer Attitudes
In our basic research, we investigated different consumer attitudes and, from the answers given to a significant number of behavioral questions, we identified the following factors: (1) social behaviors: risk-taking factor, social factor, conscious factor, recycling factor; (2) leisure activity: daily leisure factor and quality leisure factor; (3) attitudes related to willingness to pay: quality-sensitive factor and price-sensitive factor; and (4) openness to the Internet: we have only one factor. Examined individually, these factors showed a significant association with openness, and we now present the results of regression modeling. The aim was to determine which factor has an effect and how strong it is in this model. The regression model, which is based on consumer attitude factors, has 67.9% explanatory power.
Taking into consideration all the factors, in the case of regression modeling, the following factors show significant correlation with openness: social factor (exp (B): 1.256), product quality sensitive factor (exp (B): 1.271), both leisure factors (higher quality activities: exp (B): 1.738, and simpler activities: exp (B): 1.615), and Internet usage factor (exp (B): 1.514). This means that people who engage in more leisure time activities (travel, cultural programs, meeting friend, etc.) are more open to sharing economy services, and this is an even more important indicator than the frequency of Internet usage. The results are linked in
Appendix C.2.
4.2.3. Regression Model Based on Internet Usage Patterns
In the previous factor analysis, we obtained four different factors for analyzing Internet use activities: (1) entertainment factor (watching movies online, downloading music, playing games); (2) complex activity factor (own blog, website editing, e-learning); (3) social factor (social networking sites, video sharing); (4) email, browsing, and shopping. Based on these factors, we have found that the more frequently respondents conduct these Internet activities, the more open they are to using sharing economy services. According to the results of the regression model, all four factors show a significant correlation with openness. Entertainment factor (exp (B)): 1.575), social factor (exp (B)): 1.457), and e-mail/browsing factor (exp (B)): 1.477) show similar strong openness. The regression model, which is based on Internet usage patterns factors, has 65% explanatory power. The detailed results are linked in
Appendix C.3.
4.2.4. Integrated Regression Model
After examining separately the socio-demographic, consumer attitudes, and Internet usage patterns, we investigated which factors have the strongest effect in consideration towards sharing economy services. The explanatory power of all three models was above 60%, and several independent variables were significant in each model. To compare the effect of each group of independent variables, we built a large final model involving all the independent variables. The explanatory power of the integrated regression model is 69%.
Although in the first phase, many demographic factors and almost all attitude-type factors significantly explained openness, by putting all variables into one model, we can see that demographic factors lose most of their effect, whereas attitude-type independent variables retain it. Overall, it is more important to know people’s attitudes and Internet habits if we would like to estimate openness, than to know their socio-demographic data. However, it is important to note that the two demographic factors (generation and financial status) that remain in the final model have a stronger impact than attitudes in general. Based on this, the following factors show a significant correlation with an openness toward the sharing economy: generation, financial status, and attitudes toward social events, quality sensitivity factor, both leisure activities factors and frequency of Internet usage factor. Within this, the most open target group is generation Z. Within generation Z, those who are the more open who like to travel, go to museums, do wellness programs, and enjoy gastronomic tours. The results are presented in
Figure 4, and further detailed results are in
Appendix C.4.

