Article

An Approach to Estimating Water Quality Changes in Water Distribution Systems Using Fault Tree Analysis

by
Barbara Tchórzewska-Cieślak
1,
Katarzyna Pietrucha-Urbanik
1,* and
Dorota Papciak
2
1
Department of Water Supply and Sewerage Systems, Faculty of Civil, Environmental Engineering and Architecture, Rzeszow University of Technology, Al. Powstancow Warszawy 6, 35-959 Rzeszow, Poland
2
Department of Water Purification and Protection, Faculty of Civil, Environmental Engineering and Architecture, Rzeszow University of Technology, Al. Powstancow Warszawy 6, 35-959 Rzeszow, Poland
*
Author to whom correspondence should be addressed.
Resources 2019, 8(4), 162; https://doi.org/10.3390/resources8040162
Submission received: 13 August 2019 / Revised: 20 September 2019 / Accepted: 24 September 2019 / Published: 27 September 2019
(This article belongs to the Special Issue Ecological Management: Natural Resources and Human Interaction)

Abstract

:
Given that a consequence of a lack of stability of the water in a distribution system is increased susceptibility to secondary contamination and, hence, a threat to consumer health, in the work detailed here we assessed the risk of such a system experiencing quality changes relating to the biological and chemical stability of water intended for drinking. Utilizing real operational data from a water treatment station, the presented analysis of the stability was performed based on the fault tree method. If they are to protect their critical-status water supply infrastructure, water supply companies should redouble their efforts to distribute stable water free of potentially corrosive properties. To that end, suggestions are made on the safeguarding of water distribution systems, with a view to ensuring the safety of operation and the long-term durability of pipes.

1. Introduction

Thanks to the development of treatment technology, the quality of water directed to the supply network can meet strictly defined standards and recommendations. However, the water supply intended for customers must be of an adequate quality not only at the place and time of entry into the network but also at the point of reception [1,2]. This is important as the transfer of water to recipients may often entail a deterioration in quality, e.g., as harmful substances are released by the material from which the network is made [3], as biofilms or other deposits first form and then become detached, and as the release of other compounds take place [4,5]. According to Van der Kooij, to maintain water stability, pressure of a minimum of 2 bar should be provided [6]. In this regard, it is the impact of changes in hydraulic conditions, such as flow and velocity, that is key [7]. In general, irregularity of the water supply may lead to a physicochemical and microbiological destabilization of the pipeline material and result in a growth of deposits [8,9]. The level of secondary pollution is affected by the amount and chemical composition of the sludge, the type and number of microorganisms present in the biofilm, and the degree of corrosive aggressiveness of the water [10,11]. Consequences may then include releases of sediments, substances, or microorganisms accumulating over decades [12,13], with the result that aesthetic problems or even health hazards arise, i.e., in connection with turbidity and color changes, as well as impacts on the tap water taste and smell [14,15]. As has been noted, qualitative changes in the composition of water during transfer reflect not only the technical condition of the network itself, but also the aforementioned lack of stability in physical, biological, and/or chemical terms of the water leaving a waterworks [16,17,18]. Even after treatment, water brings into the distribution system a physical load (of suspended particles in the so-called disperse phase), microorganisms, and organic and inorganic nutrients [19,20]. Under certain circumstances, such water may be prone to secondary pollution sufficient to change parameters in a way that may compromise its safety, thus posing a threat to consumers [21,22].
A water supply system (WSS) is safe when it is able to carry out its functions even in the face of undesirable events of various kinds [23]. The consumer is the primary entity to which the concept of safety applies [24,25].
A risk function is in turn defined as the probability of the occurrence of an undesirable event (the cause) that may result in a real threat to the health or life of water consumers (the effect) [26,27,28]. Thus, as we seek to analyze the functioning of a water distribution subsystem in terms of the safety of consumers, in this paper, we first and foremost consider the resistance to such undesirable events of various types through the fault tree analysis (FTA) method.
The FTA method involves decomposing an event, e.g., object damage, into elements of a cause-and-effect chain. At the base of the damage-tree are the elementary events that may be the cause of the event which is at the top of the tree. The FTA method, according to the International Electrotechnical Commission guidelines, should include a definition of the analysis, the functional characteristics of the system, the tree structure, and logical analysis of the interaction between the elements of the tree [29]. It is important to adopt working assumptions regarding the operating conditions of the system, simplify the description of processes, and adopt indicators to evaluate individual elements or their specific state in the event of an adverse event, as well as their identification. There are two main types: the static FTA, which determines the set of causes of the event at the top; and the probabilistic FTA, which additionally allows us to determine the probability [30]. The advantage of the FTA method is the ability to analyze any path in the tree. It is also a technique that allows us to draw conclusions on the basis of the definition of the problem. In the case of an uncertain knowledge base, it is also possible to use fuzzy FTA analysis. Extensive probabilistic characteristics for FTA, also in fuzzy form, can be found in other works [31]. FTA analyses in dynamic and fuzzy form, are especially useful in the case of complex technical systems, in which the analysis of failure scenarios is a difficult process because it requires the examination of numerous cause–effect relationships. Undoubtedly, a water supply network is such a complex technical system. With very extensive damage trees, especially with dynamic gates [32], it is necessary to use specialized software and in some cases, use simulation techniques, such as the Monte Carlo method [33].
Specifically in this article, we consider factors affecting the biological and chemical stability of supplied water and discuss how secondary pollution may arise within a supply network. The operational data forming the basis for such considerations relate to the functioning of a real-world supply system controlled by a municipal water company. Technical documentation and information obtained from its managers and services were also referred to. Treated water collected from a clean water tank prior to final disinfection was analyzed, while statistical processing involved Statsoft software [34], as supported by the ReliaSoft BlockSim comprehensive platform [35]. Above all, the research described here has sought to present a methodology that may be utilized in assessing the risk of changes in water quality in a distribution subsystem.

2. Materials and Methods

2.1. Characteristics of the Research Object

The city selected for study is supplied by a shore-edge water intake of a capacity of 90,000 m3/day. Water from there is treated at two water treatment plants (WTPs) that are independent, though operating on the basis of the same technology, with pre-ozonization, coagulation supported by a synthetic flocculant (at low temperatures), sedimentation in horizontal settling tanks, and filtration on fast filters. In the case of WTPI, the latter are sand filters, while at WTPII they are of anthracite plus sand, with indirect ozonation and biologically active filtration (BAF). The intermediate ozone chambers are completely separate for WTPI and WTPII. Water after ozonization goes to four chambers with carbon filters, and from there to clean water reservoirs specific to WTPI and WTPII [36].
The treated water meets the quality requirements set for water intended for human consumption [37,38], while the quantity produced each day is around 37,000 m3—enough to meet the customers’ needs in full. More specifically, the system under consideration consists of the following:
  • an emergency downhole shot of a capacity of 240 m3/day;
  • local water intake of a capacity of 450 m3/day;
  • 36 water pumping stations (hydrophores);
  • 11 clean water equalizing tanks of a total capacity of 35,000 m3;
  • 190 public wells.
The water supply network of a total length of ca. 900 km comprises 49 km of the main network, 529 km of the distribution network, and 322 km of household connections. The main network is made of cast iron and steel pipes, while the distribution network is of cast iron, steel, polythene (PE), and polyvinyl chloride (PVC) pipes. Household connections are mainly made of galvanized steel, PE, PVC, and cast iron. The analyzed water supply network consists of four main buses transporting water treated at the second-degree pumping station.

2.2. Methods

2.2.1. The Concept of the Fault Tree Method

Fault Tree Analysis (FTA) presents graphically the relationship between events that affect the occurrence of a specific undesirable event, called the “peak event” [39,40]. The tree makes reference to so-called functors (logic gates), defining the logical product of events and the logical sum of events as shown in Figure 1.
The gates for the assessment of fitness are as follows [41]:
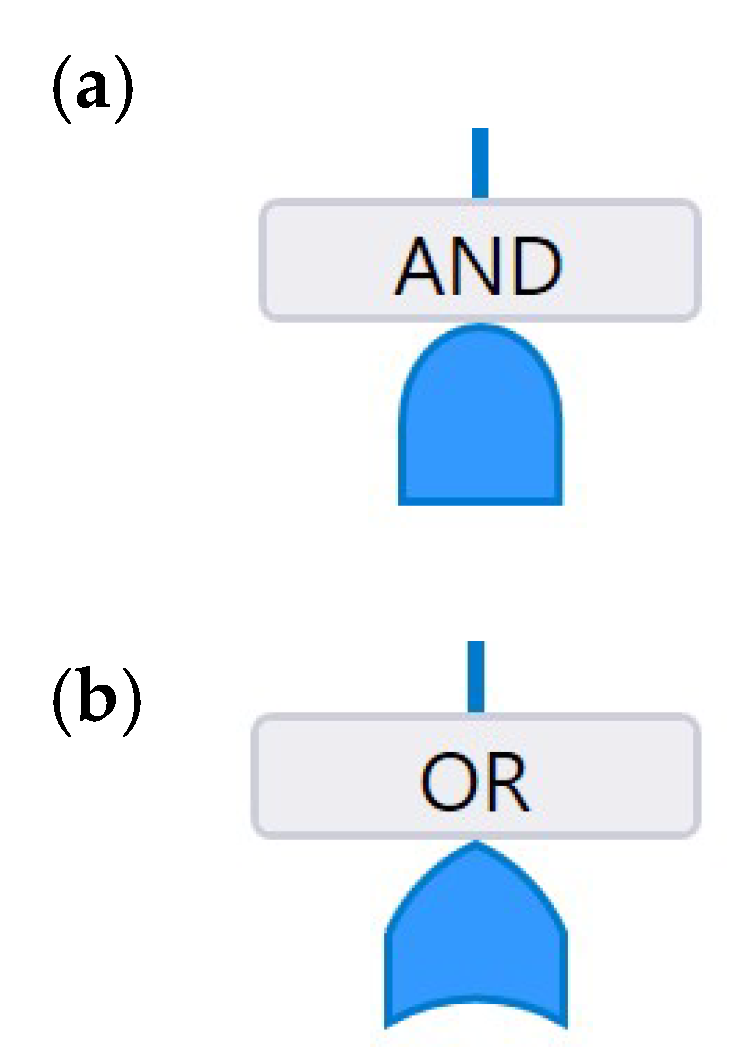
  • OR gate—an event above the gateway occurs if at least one event below occurs (an exit event occurs when any of the input events occur).
  • AND gate—an event above the gateway occurs if all events below occur (an exit event occurs when all input events occur).
If w1, w2,..., wn are the events, the given element is in a state of efficiency or disability and saves with the zero vector of the ones according to EN 61025 [29]:
w 1 ,   w 2 , ,   w n     input   events   =   { 1 w h e n t h e s t r u c t u r e i s o p e r a t i o n a l 0 w h e n t h e s t r u c t u r e i s o u t o f o r d e r ,
W     input   event   =   { 1 w h e n t h e s t r u c t u r e i s o p e r a t i o n a l 0 w h e n t h e s t r u c t u r e i s o u t o f o r d e r .
The logic activities of the gates are presented as follows in accordance with EN 61025 [29]:
a) gate AND:
W = w1 ∧ w2,
b) gate OR:
W = w1 ∨ w2,
c) gate AND-OR
W = w1 ∧ w2 ∨ w3 ∧ w4,
d) gate OR-AND
W = w1 ∨ w2∧ w3 ∨ w4.
Indicator unreliability goals can be determined by reference to the following dependent relationships [29]:
a) gate AND:
U = i = 1 n U i ,
b) gate OR:
U = 1 j = 1 M ( 1 U j ) ,
c) gate AND-OR
U = 1 i = 1 n ( 1 j = 1 M U j ) ,
d) gate OR-AND
U = i = 1 n ( 1 j = 1 M ( 1 U j ) ) ,
while the states of efficiency of particular gates are as presented in Table 1 and Table 2 [29].
On the basis of the above-mentioned basic logical formulae, it is also possible to calculate the reliability of a WSS and its subsystems by referring to the technological scheme and the probability and intensity of failures.
Logical entry values can be replaced in the form of specific probability values; then, w1, w2, …, wn will respond to P(X1), P(X2), …, P(Xn).
The calculation formulae for the probability and intensity of the output events for the gates are as follows [29]:
a) gate AND:
P(X1 × X2) = P(X1) × P(X2),
b) gate OR:
P(X1 + X2) = P(X1) + P(X2) − P(X1) × P(X2),
P(X1+ X2 + X3) = P(X1) + P(X2)+ P(X3) − P(X1) × P(X2) − P(X1) × P(X3) − P(X3) × P(X2) + P(X1) × P(X2) × P(X3).
Additionally, it is possible to use the failure rate instead of probability values, the form assumed in this case is as follows:
a) gate AND:
λ(X1 × X2) = λ(X1) × P(X2) = P(X1) × λ (X2),
b) gate OR:
λ(X1 + X2) = λ(X1) + λ(X2).

2.2.2. Parameters Characterizing the Biological and Chemical Stability of Water

The biological stability of water is conditioned by the content of inorganic nutrients, i.e., nitrogen and phosphorus, which are necessary for the development of all forms of microorganisms, and the content of organic food substrates, creating conditions for the growth of heterotrophs and pathogenic microorganisms [42,43].
The intensity of microbial growth in a water supply network is mainly determined by the presence of organic compounds, particularly biodegradable dissolved organic carbon (BDOC) and assimilable organic carbon (AOC).
The threshold values for parameters conditioning the biological stability of water are as follows [19,44,45]:
  • BDOC: <0.25 mg C/dm3;
  • AOC: for non-chlorinated water 10–20 μg C/dm3 and for chlorinated water 50–100 μg C/dm3;
  • PO43: <0.03 mg PO43/dm3;
  • ΣNinorganic: <0.2 mg N/dm3.
The indices describing the corrosive properties and chemical stability of water (in relation to the carbonate–calcium balance) that were taken into account were the Langelier Saturation Index (IL), the Ryznar Index (IR), and the Strohecker Index (JSt). Although this reference to three indices makes clear the way in which numerous assessments of the corrosiveness of water are possible, due to the complexity of the processes involved, no one index can offer a full assessment of the rate of corrosion in an aquatic environment [46].
Values of the Langelier Index can be calculated using water quality indicators such as pH, dry residue, temperature, calcium content, and alkalinity from the formula:
IL = pH0 − pHs,
where IL is the Saturation Index, pH0 is the pH of the tested water sample, and pHs is the saturation reaction calculated after [47].
When IL is less than 0, the water characterized is able to dissolve calcium compounds and thus, has its corrosive properties strengthened. In turn, when IL is equal to 0, the water is stable; i.e., there is no tendency for calcium carbonate to precipitate out or be dissolved, with the consequence that corrosive properties are weakened. Finally, when IL assumes a value above 0, water may precipitate lime sediments, and its corrosive properties are again compromised.
The tendency of water to create protective layers is better determined by the Ryznar Index (IR), as calculated from the formula:
IR = 2pHs − pH0.
When values of IR are in the 6.2–6.8 range, there are no operational difficulties, while in the case of pH values from 6.0 to 7.0, there are thin accretions or mild corrosion [48].
The corrosiveness of water is also determinable by referring to the Strohecker Index—an indicator frequently used when treatment plants seek to assess the corrosive properties of the water. The formula here is:
JSt = pHn − pH0,
where pHn is the pH of water corresponding to the carbon–calcium balance for water in equilibrium with constant CaCO3. Water is stable when JSt equals 0, so pHn = pH0.

3. Application Example

Probability values were adopted on the basis of the analysis, expert knowledge, and data presented by Wolska in a monograph [34] detailing the percentages of raw and treated water samples, in which limit values for the food substrates adopted for the stability assessment were exceeded. For BDOC, the probability of the limit value of 0.25 gC/m3 not being exceeded is 0.417; for Ninorganic, the probability of the limit value of ≤0.2 gN/m3 not being exceeded is 0.841; and for PO43−, (≤0.03 gPO43−/m3) the corresponding value is 0.99.
The water in the supply system under study had Langelier Index values in the −0.5 to 0.24 range. The Ryznar Index, in turn, had values of 7.2 ≤ IR ≤ 8.2, while the Strohecker Stability Index values ranged from −0.36 to 0.78. Taking the Ryznar Index into account, the results point to the occurrence of water tending to dissolve deposits and contribute to the severity of corrosion processes. However, in the case of the Strohecker Index, the water in 805 of the samples was revealed to be non-aggressive. In turn, the character of the water specified by the Langelier Index corresponds with the probable lack of any need for additional water treatment, and in the majority of tested samples, a mild covering of the pipe surface in case of corrosion. Assessment of the non-exceedance of probabilities regarding the chemical stability of water was performed using a two-dimensional method, in which the probabilities of parameters being exceeded for the assessment of aggressive and corrosive water properties were determined [49], in line with the aforementioned definition in Section 2.2.2.
Figure 2 shows the fault tree analysis prepared for the scenario of events, as a result of which a change in water quality in the supply network may occur due to the loss of chemical stability or biological stability, in line with the logic gate symbols from Figure 1 [36,49].
The individual symbols in the fault tree in Figure 2 assume meanings as follows:
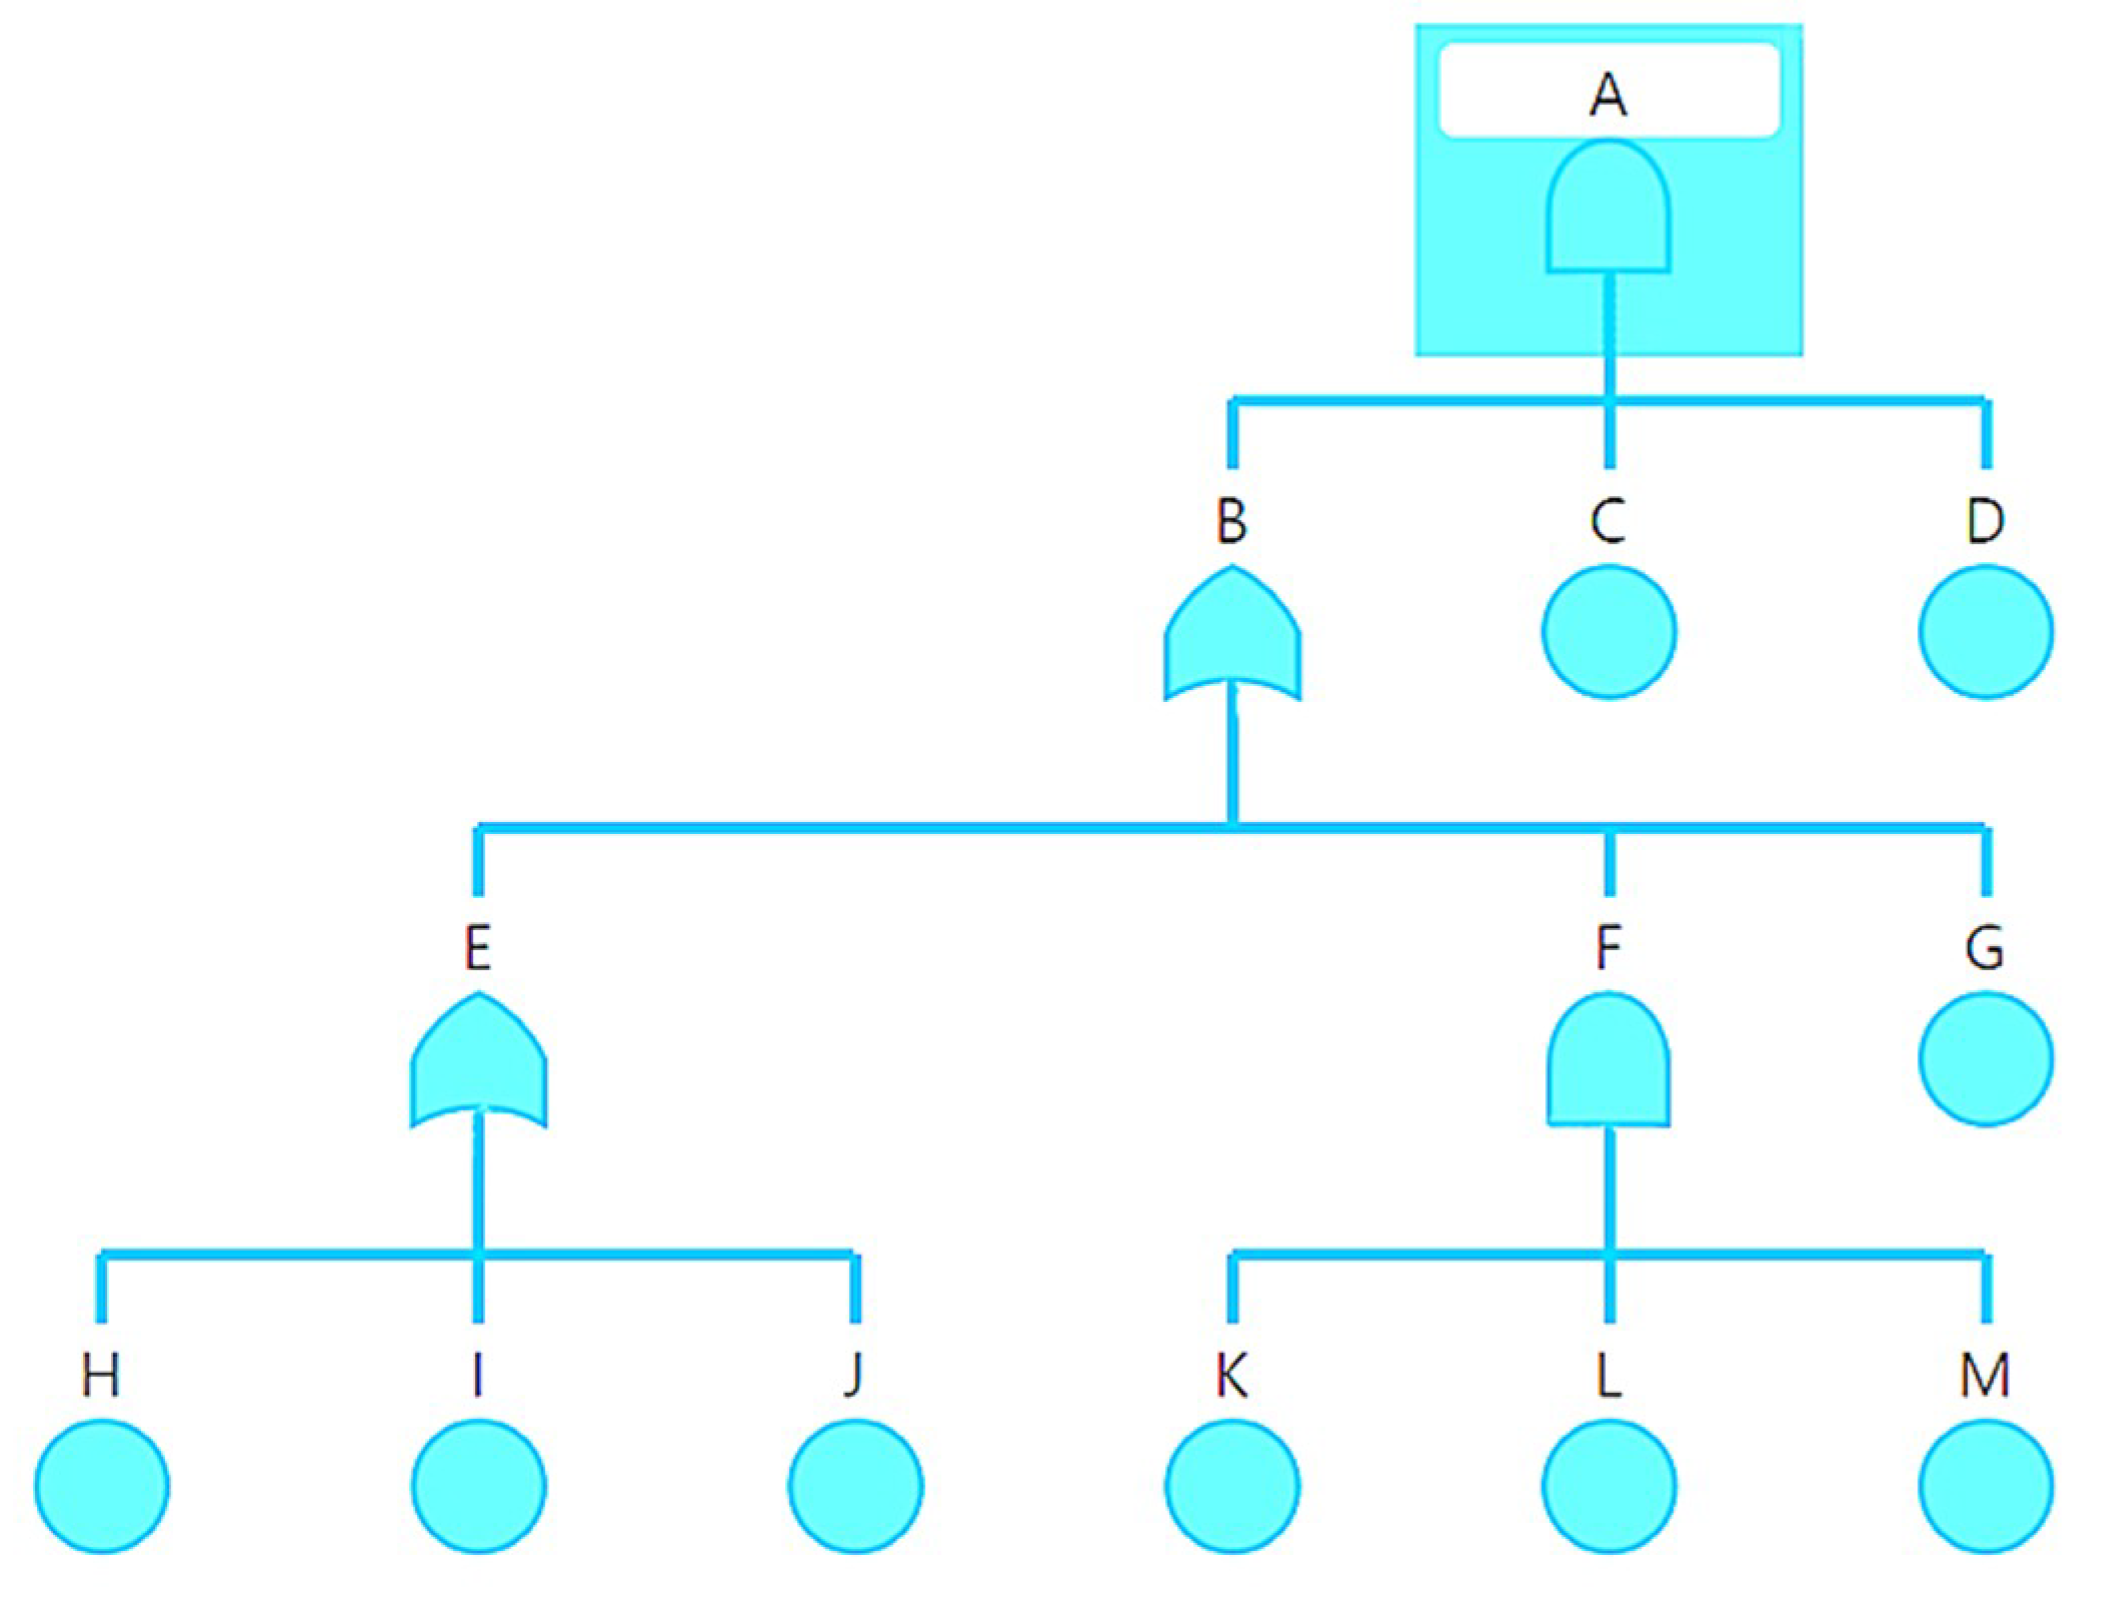
  • A—an event involving secondary water pollution in the water supply network;
  • B—an event involving the accumulation of sediments (growths) or biofilms;
  • C—an event whereby unfavorable hydraulic conditions arise;
  • D—an event involving a sudden change of water quality parameters;
  • E—an event involving the loss of chemical stability in the water;
  • F—an event involving the loss of biological stability in the water;
  • G—an event involving the loss of physical stability in the water given turbidity of ≥0.8 NTU [50];
  • H—an event arising in which Langelier Saturation Index values are of −4 to −5 or 3 to 4;
  • I—an event involving the loss of chemical stability in the water given a Ryznar Index value of >8.5 or <5.5;
  • J—an event involving the loss of chemical stability in the water given a Strohecker Index value of >0.5;
  • K—an event involving the loss of biological stability in the water given a BDOC of >0.25 gC/m3;
  • L—an event involving the loss of biological stability in the water given ΣNinorganic of >0.2 gN/m3;
  • M—an event involving the loss of biological stability in the water given PO43− of >0.03 gPO43−/m3.
The probabilities of the occurrence of individual events were determined on the basis of risk criteria and assumed by referring to information obtained from experts and operational data from Section 2.2.2 and Figure 2.
The probability of peak event occurrence relating to secondary pollution in a water supply network was calculated by reference to Equations (11)–(13) in line with the following formulae [49]:
  • The probability of an event wherein secondary pollution arises in the water supply network:
    P(A) = P(B) × P(C) × P(D),
    where P(B) is the probability of an event wherein sediments are laid down or biofilms formed, P(C) is the probability of an event wherein unfavorable hydraulic conditions arise (P(C) = 0.015), and P(D) is the probability of an event wherein water quality parameters change abruptly (P(D) = 0.0001).
  • The probability of an event wherein sediments are laid down or biofilms formed:
    P(B) = P(E) + P(F) + P(G) − P(E) × P(F) − P(F) × P(G) − P(E) × P(G) + P(E) × P(F) × P(G),
    where P(E) is the probability of an event involving the loss of chemical stability in the water, P(F) is the probability of an event involving the loss of biological stability in the water (P(F) = 0.013), and P(G) is the probability of an event involving the loss of physical stability in the water given turbidity of ≥0.8 NTU.
  • The probability of an event involving the loss of chemical stability in the water:
    P(E) = P(H) + P(I) + P(J) − P(H) × P(I) − P(I) × P(J) − P(H) × P(J) + P(H) × P(I) × P(J),
    where P(H) is the probability of an event involving Langelier Saturation Index values of −4 to −5 or 3 to 4 (P(H) = 0.0001), P(I) is the probability of an event involving the loss of chemical stability in the water given a Ryznar Index value of >8.5 or <5.5 (P(I) = 0.015), and P(J) is the probability of an event involving the loss of chemical stability in the water given a Strohecker Index value of >0.5 (P(J) = 0.0002).
  • The probability of an event involving the loss of biological stability in the water:
    P(F) = P(K) × P(L) × P(M),
    where P(K) is the probability of an event involving the loss of biological stability in the water given a BDOC of >0.25 gC/m3 (P(K) = 0.583), P(L) is the probability of an event involving the loss of biological stability in the water given ΣNinorganic of >0.2 gN/m3 (P(L) = 0.159), and P(M) is the probability of an event involving the loss of biological stability in the water given PO43− of >0.03 gPO43−/m3 (P(M) = 0.01).
The probability that secondary water pollution will appear in the water supply network is 4.3496 × 10⁻⁸. An analysis of the kind performed here will help establish threshold values for the acceptability of probabilities, in turn determining the categories relevant to acceptability, tolerance, or control of risk and allowing for comparisons between water distribution systems. Comparing the probability value obtained with the value regarded as acceptable will help with the effectiveness of evaluations of given treatment stations.

4. Conclusions and Perspectives

The character of water specified relative to the corrosive properties of water corresponds to the probable lack of need for additional water treatment, and in the majority of tested samples, a mild covering of the pipe surface in case of corrosion. The obtained results indicate the occurrence of water with a tendency to dissolve deposits and contribute to the severity of the corrosion process.
Procedures for the proper design, construction, and operation of water supply systems should be supplemented by risk analysis related to the possibility of various adverse events occurring. Such procedures can have a significant impact on the level of water supply security in urban agglomerations, as well as exerting a direct effect on consumer safety.
Modern treatment technologies allow water to enter the supply network with improved quality parameters. However, this does not guarantee that the water that reaches recipients will be characterized by the same quality parameters. While the main reason for deterioration is the condition of water supply networks and installations, it may often happen that water considered of good quality and in accordance with regulations in force, is actually aggressive and unstable, and hence, it is capable of generating major economic losses. Irregularity or change in the quality of water that is supplied may lead to physicochemical and microbiological destabilization of the pipeline material and to resulting growths.
The proposals for probability assessment criteria in the presented work were developed on the basis of the authors’ research and literature studies and can be modified after taking into account the specifics of a given water distribution system.
Biological stability of water is achieved when threshold values for biogenic substances are not exceeded, ensuring that microorganisms do not develop, with the result that safety levels remain adequate from the source through to recipients.
In addition to the water quality status, water pipes are affected by prevailing conditions, hydraulics, and the material and condition of the pipeline. The quality of tap water intended for human consumption can be ensured by using appropriate materials for the construction of the water supply network. Due to the increase in the range of materials used to build water installations, there was a need to create a system for the correct selection of a material by knowing the corrosive aggressiveness of the tap water that will power the installation. These materials should not be susceptible to corrosion, should prevent secondary water pollution, and should ensure adequate stability of the supply to protect water consumers. Currently, it is necessary to adapt the material of the water supply system and the internal installation to the water parameters, not vice versa. A lack of connection between the design stage of the water supply network and the water parameters results in a lack of chemical and biological stability in the water supply.
Prospects for further research revolve around the estimation of the risk of instability. This will entail determinations of criteria and of the types of corrosion that may occur in relation to water quality on the one hand, and the materials used to build a network or installation on the other. This will involve the adaptation of criteria regarding corrosiveness to the specific circumstances of the given water distribution system.

Author Contributions

All authors contributed to the development of this manuscript.

Funding

This research was funded by the Faculty of Civil and Environmental Engineering and Architecture, Rzeszow University of Technology, 35-959 Rzeszow, Poland.

Acknowledgments

We thank the reviewers for their feedback, which helped to improve the manuscript quality.

Conflicts of Interest

The authors declare no conflict of interest.

References

  1. Mlynska, A.; Zielina, M.; Bielski, A. Contamination of drinking water soon after cement mortar lining renovation depending on the disinfectant doses. SN Appl. Sci. 2019, 1, 516. [Google Scholar] [CrossRef] [Green Version]
  2. Kabsch-Korbutowicz, M.; Kutylowska, M. Use of artificial intelligence in predicting the turbidity retention coefficient during ultrafiltration of water. Environ. Prot. Eng. 2011, 2, 75–84. [Google Scholar]
  3. Tchórzewska-Cieślak, B. Water supply system reliability management. Env. Prot. Eng. 2009, 35, 29–35. [Google Scholar]
  4. Kuliczkowska, E. Analysis of defects with a proposal of the method of establishing structural failure probability categories for concrete sewers. Arch. Civ. Mech. Eng. 2015, 4, 1078–1084. [Google Scholar] [CrossRef]
  5. Ondrejka Harbulakova, V.; Estokova, A.; Kovalcikova, M. Correlation Analysis between Different Types of Corrosion of Concrete Containing Sulfate Resisting Cement. Environments 2017, 4, 44. [Google Scholar] [CrossRef]
  6. Van Der Kooij, D.; Van Lieverloo, J.; Hein, M.; Schellart, J.; Hiemstra, P. Maintaining quality without disinfectant residual. J. Am. Water Works Assoc. 1999, 1, 55–64. [Google Scholar] [CrossRef]
  7. Hallam, N.; West, J.; Forster, C.; Simms, J. The potential for biofilm growth in water distribution systems. Water Res. 2001, 35, 4063–4071. [Google Scholar] [CrossRef]
  8. Manuel, C.M.; Nunes, O.C.; Melo, L.F. Dynamics of drinking water biofilm in flow/non-flow conditions. Water Res. 2007, 41, 551–562. [Google Scholar] [CrossRef] [Green Version]
  9. Escobar, I.C.; Randall, A.A. Assimilable organic carbon (AOC) and biodegradable dissolved organic carbon (BDOC). Water Res. 2001, 35, 4444–4454. [Google Scholar] [CrossRef]
  10. Van Der Kooij, D. Biological stability: A multidimensional quality aspect of treated water. Water Air. Soil Pollut. 2000, 123, 25–34. [Google Scholar] [CrossRef]
  11. Simpson, D.R. Biofilm processes in biologically active carbon water purification. Water Res. 2008, 42, 2839–2848. [Google Scholar] [CrossRef] [PubMed]
  12. Lehtola, M.J.; Miettinen, I.T.; Keinänen, M.M.; Kekki, T.K.; Laine, O.; Hirvonen, A.; Vartiainen, T.; Martikainen, P.J. Microbiology, chemistry and biofilm development in a pilot drinking water distribution system with copper and plastic pipes. Water Res. 2004, 38, 3769–3779. [Google Scholar] [CrossRef] [PubMed]
  13. Lehtola, M. Microbially available organic carbon, phosphorus, and microbial growth in ozonated drinking water. Water Res. 2001, 35, 1635–1640. [Google Scholar] [CrossRef]
  14. Wang, Y.H.; Chen, K.C. Removal of Disinfection By-Products from Contaminated Water Using a Synthetic Goethite Catalyst via Catalytic Ozonation and a Biofiltration System. Int. J. Environ. Res. Public Health 2018, 11, 9325. [Google Scholar] [CrossRef] [PubMed]
  15. Tchorzewska-Cieslak, B.; Szpak, D. A proposal of a method for water supply safety analysis and assessment. Ochr. Sr. 2015, 3, 43–47. [Google Scholar]
  16. Volk, C.J.; LeChevallier, M.W. Assessing biodegradable organic matter. Am. Water Works Assoc. 2000, 92, 64–76. [Google Scholar] [CrossRef]
  17. Liu, X.; Wang, J.; Liu, T.; Kong, W.; He, X.; Jin, Y.; Zhang, B. Effects of assimilable organic carbon and free chlorine on bacterial growth in drinking water. PLoS ONE 2015, 10, e0128825. [Google Scholar] [CrossRef] [PubMed]
  18. Chu, C.; Lu, C.; Lee, C. Effects of inorganic nutrients on the regrowth of heterotrophic bacteria in drinking water distribution systems. J. Environ. Manag. 2005, 74, 255–263. [Google Scholar] [CrossRef]
  19. Wolska, M. Nutrient Removal in the Technology of Purifying Water Intended for Human Consumption; Wrocław University of Technology Publishing House: Wrocław, Poland, 2015. [Google Scholar]
  20. Tchorzewska-Cieslak, B. Estimating the acceptance of bearing the cost of the risks associated with the management of water supply system. Ochr. Sr. 2007, 29, 69–72. [Google Scholar]
  21. Nowak, R.; Wisniowska, E.; Wlodarczyk-Makula, M. Effectiveness of degradation and removal of non-steroidal pharmaceuticals which are the most frequently identified in surface water. Desalin. Water Treat. 2018, 134, 211–223. [Google Scholar] [CrossRef]
  22. Srinivasan, S.; Harrington, G.W. Biostability analysis for drinking water distribution systems. Water Res. 2007, 41, 2127–2138. [Google Scholar] [CrossRef] [PubMed]
  23. Estokova, A.; Harbulakova, V.O.; Luptakova, A. Analysis of the Selected Characteristics Changes of Cement Composites Exposed to the Sulphate Environment. Chem. Eng. Trans. 2013, 32, 1597–1602. [Google Scholar]
  24. Rak, J.; Boryczko, K. Assessment of water supply diversification using the Pielou index. Environ. Eng. 2017, 5, 53–58. [Google Scholar]
  25. Kordana, S.; Pochwat, K.; Słyś, D.; Starzec, M. Opportunities and Threats of Implementing Drain Water Heat Recovery Units in Poland. Resources 2019, 8, 88. [Google Scholar] [CrossRef]
  26. Eid, M. Modelling sequential events for risk, safety and maintenance assessments. J. Pol. Saf. Reliab. Assoc. 2010, 1, 83–87. [Google Scholar]
  27. Tchorzewska-Cieslak, B.; Wlodarczyk-Makula, M.; Rak, J. Safety analysis of the wastewater treatment process in the field of organic pollutants including PAHs. Desalin. Water Treat. 2017, 72, 146–155. [Google Scholar] [CrossRef] [Green Version]
  28. Urbanik, M.; Tchórzewska-Cieślak, B.; Pietrucha-Urbanik, K. Analysis of the Safety of Functioning Gas Pipelines in Terms of the Occurrence of Failures. Energies 2019, 12, 3228. [Google Scholar] [CrossRef]
  29. British Standards Institute. BS EN 61025:2007. Fault Tree Analysis (FTA); British Standards Institute: London, UK, 2007. [Google Scholar]
  30. Lindhe, A.; Rosen, L.; Norberg, T. Fault tree analysis for integrated and probabilistic risk analysis of drinking water systems. Water Res. 2009, 43, 1641–1653. [Google Scholar] [CrossRef]
  31. Sadiq, R.; Saint-Martin, E.; Kleiner, Y. Predicting risk of water quality failures in distribution networks under uncertainties using fault-tree analysis. Urban Water J. 2008, 5, 287–304. [Google Scholar] [CrossRef] [Green Version]
  32. Lindhe, A.; Norberg, T.; Rosen, L. Approximate dynamic fault tree calculations for modelling water supply risks. Reliab. Eng. Syst. Saf. 2012, 106, 61–71. [Google Scholar] [CrossRef] [Green Version]
  33. Taheriyoun, M.; Moradinejad, S. Reliability analysis of a wastewater treatment plant using fault tree analysis and Monte Carlo simulation. Environ. Monit. Assess. 2015, 187, 4186. [Google Scholar] [CrossRef] [PubMed]
  34. StatSoft, Inc. STATISTICA. Data Analysis Software System, Version 12. Available online: www.statsoft.com (accessed on 9 June 2019).
  35. ReliaSoft, Inc. BlockSim. Platform for System Reliability, Availability, Maintainability and Related Analyses. Available online: www.reliasoft.com (accessed on 16 June 2019).
  36. Pietrucha-Urbanik, K.; Tchorzewska-Cieslak, B.; Papciak, D.; Skrzypczak, I. Analysis of chemical stability of tap water in terms of required level of technological safety. Arch. Environ. Prot. 2017, 4, 3–12. [Google Scholar] [CrossRef]
  37. Council Directive 98/83/EC of 3 November 1998 on the Quality of Water Intended for Human Consumption. 1998. EUR-Lex Web Site. Available online: https://eur-lex.europa.eu/legal-content/EN/TXT/?uri=CELEX%3A31998L0083 (accessed on 29 June 2019).
  38. World Health Organization. Guidelines for Drinking-Water Quality, 4th ed.; World Health Organization: Geneva, Switzerland, 2011. [Google Scholar]
  39. Boryczko, K.; Tchórzewska-Cieślak, B. Application of Fuzzy Fault Tree in Risk Analysis of Collective Water Supply Systems. J. Konbin 2012, 24, 13–24. [Google Scholar] [CrossRef]
  40. Krolikowska, J.; Krolikowski, A. Applying the treedendrical scheme failure method to evaluate the reliability of sewage collection draining reliability evaluation subsystems. Environ. Eng. 2010, 3, 191–195. [Google Scholar]
  41. Fu, X.; Gu, C.S.; Su, H.Z.; Qin, X.N. Risk Analysis of Earth-Rock Dam Failures Based on Fuzzy Event Tree Method. Int. J. Environ. Res. Public Health 2018, 5, 886. [Google Scholar] [CrossRef]
  42. Tchórzewska-Cieślak, B.; Papciak, D.; Pietrucha-Urbanik, K.; Pietrzyk, A. Safety analysis of tap water biostability. Archit. Civ. Eng. Environ. 2018, 11, 149–154. [Google Scholar] [CrossRef]
  43. Domon, A.; Papciak, D.; Tchorzewska-Cieslak, B.; Pietrucha-Urbanik, K. Biostability of tap water a qualitative analysis of health risk in the example of groundwater treatment (semi-technical scale). Water 2018, 10, 1764. [Google Scholar] [CrossRef]
  44. Keinanen, M.M.; Korhonen, L.K.; Lehtola, M.J.; Miettinen, I.T.; Martikainen, P.J.; Vartiainen, T.; Suutari, M.H. The Microbial Community Structure of Drinking Water Biofilms Can Be Affected by Phosphorus Availability. Appl. Environ. Microbiol. 2002, 68, 434–439. [Google Scholar] [CrossRef] [Green Version]
  45. LeChevallier, M.W.; Shaw, N.E.; Kaplan, L.A.; Bott, T.L. Development of a rapid assimilable organic carbon method for water. Appl. Environ. Microbiol. 1993, 59, 1526–1531. [Google Scholar]
  46. British Standards Institute. BS EN 12502-1-5:2004. Protection of Metallic Materials against Corrosion; British Standards Institute: London, UK, 2004. [Google Scholar]
  47. PN-72 C-04609. Preliminary Qualitative Assessment of the Corrosive Effect of Cold Natural Waters on Pipes Made of Cast Iron, Ordinary Steel or Galvanized Steel; PKN: Warsaw, Poland, 1972; Available online: http://sklep.pkn.pl/pn-c-04609-1972p.html.
  48. Carrier Air Conditioning Company. Handbook of Air Conditioning System Design; McGraw-Hill Books: New York, NY, USA, 1965. [Google Scholar]
  49. Tchórzewska-Cieślak, B.; Papciak, D.; Pietrucha-Urbanik, K. Estimating the Risk of Changes in Water Quality in Water Supply Networks; Rzeszow University of Technology Publishing House: Rzeszow, Poland, 2017. [Google Scholar]
  50. Liu, W.; Wu, H.; Wang, Z.; Ong, S.L.; Hu, J.Y.; Ng, W.J. Investigation of assimilable organic carbon (AOC) and regrowth in drinking water distribution system. Water Res. 2002, 36, 891–898. [Google Scholar] [CrossRef]
Figure 1. Alternative gate designations (a) AND gate (and)—logical product, (b) OR gate (or)—logical sum according to [29].
Resources 08 00162 g001
Figure 2. Fault tree connected with secondary water pollution in the water supply network.
Resources 08 00162 g002
Table 1. Individual states of reliability and unreliability of the AND gate.
w1w2W
111
100
010
000
Table 2. Individual states of reliability and unreliability of the OR gate.
w1w2W
111
101
011
000

