Abstract
The Water Apportionment Accord (WAA) of Pakistan was instituted in 1991 to allocate Indus River water among Pakistan’s provinces. This paper assesses the performance of the WAA in terms of the accord’s ability to meet the barrages’ and environmental demands in the Lower Indus Basin. Use of metrics as assessment tools in water security and climate adaptation is an important field, with the potential to inform sustainable management policy. Reliability, resiliency, and vulnerability are used as indicators to define the system’s performance against supply. The results indicate from the pre-Accord period to the post-Accord period, the reliability of Guddu Barrage (the upstream-most barrage in the study) is not changed. However, at Sukkur and Kotri, the most downstream barrage in the study, reliability has significantly decreased. The Results reveal the high vulnerability of the Indus delta in Rabi season when the flows decline and the majority of the water at the Kotri Barrage is diverted.
1. Introduction
Water insecurity is one of the most pressing challenges of the 21st century [1] and poses a serious threat to ecosystems and human well-being [2]. The Organization for Economic Co-operation and Development (OECD) revealed that by 2050, almost 4 billion people are projected to live in severely water-stressed basins [3]. The UN-Water (2013) defines water security as the “capacity of a population to safeguard sustainable access to adequate quantities of acceptable quality water for sustaining livelihoods, human well-being, and socio-economic development” [4]. Water security is a principal template in environmental resources management to provide safe and equitable access to water supplies [5]. A reliable water supply among all sectors is crucial for economic growth and water availability for agricultural production and energy generation [6,7].
Achieving water sustainability is becoming more challenging. Historically, domestic water requirements have been small worldwide as compared to agricultural, but that is changing as the population grows, people move to cities, and living standards increase [8,9,10]. In addition, climate change is projected to noticeably affects extreme events such as drought and floods. Temperatures have been increased (0.58–2 °C) over the last 150 years [11] and will continue to increase [12] leading to changes in agricultural water demand and human uses. Global climate models project more frequent occurrences of droughts during the twenty-first century [13,14]. A 1% increase in drought-stricken area may reduce GDP growth rate by 2.8% [15]. Overall, achieving water sustainability now requires considering the complexity of the situation, carefully analyzing investments in water infrastructures and building institutional and societal capacity for adaptation [16], all under uncertain conditions.
In Pakistan, increasing water demand has contributed to the failure of the Indus River system to meet human and environmental needs [17,18]. The Indus is the major river in Pakistan and one of the most important in Asia. The 3180 km long river provides water to 121.7 million people for drinking, growing crop, navigation, and economic development [19]. Water management is especially critical in the Lower Indus River Basin. In the Sindh Province, at the tail-end of the Indus, the sustainment of more than 50 million people relies on receiving an amount of water. Water shortages in the past have contributed to extensive damage to arable land [20]. From 1972–1990, the total cultivated area of Sindh declined by 9% [21]. In 2000–2002, drought was responsible for 120 fatalities, for diminished livelihood of 2.2 million people, and for the death of large number of livestock [22]. In the 2002–2004 drought, the Sindh Province lost 4.1% of their total crops during the Rabi season (October to March) and 3.25% in the Kharif (April to September) [23]. Water shortages in Sindh Province also affect the environment. More than 2400 km2 of riverine woodlands alongside the Indus River have been degraded by water shortages [24]. Fish species in connected lakes, such as Manchar, have experienced significant reductions (from 400 to 70 species) and bird species have also been reduced, with only 100 species remaining [20].
The key issue in water resource management is the distribution among multiple users with common river systems. Pakistan instituted the Water Apportionment Accord (WAA) in 1991 to allocate Indus River water among four provinces. When flow exceeds 144.75 km3 per year, the water is distributed according to a designated formula, with Punjab and Sindh Provinces both receiving 37%, Khyber Pakhtunkhwa (KP) receiving 14%, and Baluchistan receiving 12% of 141.05 km3 (with 3.7 km3 for canals above the rim stations/measuring gauges). Although the allocation is straightforward, disputes have continued among the provinces over water sharing, with allegations of the water distribution formula not being enforced properly based on the ten-day (and other) entitlements [17]. Additionally, the claims intensify during extreme conditions, i.e., flood and drought. During dry years, provinces often report receiving less water than their entitlements [25,26,27]. For instance, in Sindh Province, since 1991, excluding flood years, flows below Kotri Barrage have consistently been less than the share established by the accord of 12.33 km3; therefore, the requirements below Kotri cannot be fulfilled [28]. Finally, during flood years, the downstream areas receive most of the excess water, which contains a variety of contaminants from land drainage and wastewater effluents, which causes water quality degradation, public health risk, and ecosystem degradation [29].
An important feature of the WAA is the environmental flow below Kotri to avoid seawater intrusion and sustain the ecosystem. Sindh proposed e-flow requirements of 12.33 km3/year and the decision was deferred for further studies to determine actual environmental water requirements [30]. The Government of Pakistan established an international panel of experts. It reported that a minimum continuous discharge of 141.6 cubic meters per second/day should be maintained [31]. Additionally, with a supplemental flow of 30.84 km3/year released to the sea (over any five-year period). Figure 2c shows the flow delivered to the Arabian Sea. Until 2000, the flow was more than that recommended by an international panel of experts. The period of 1999 to 2003 was critical, as the water availability remained less than what was required amount. The five year sum remained greater than the recommended 30.84 km3/5-year; this is also shown in Figure 2c.
With population growth, urbanization, and limited demand management measures, there will likely be an increase in water demand [32,33], which will make fixed-percentage sharing a continuing challenge [17]. Major weaknesses of the Accord identified by past researchers include lack of consistency with historical agreements (e.g., the Sindh-Punjab Agreement, 1945) and a lack of shortage-management agreements to distribute available water in space and time when a shortage occurs [28]. Climate and flow variability from climate change have been found to affect the productivity of irrigated agriculture in the Indus Basin, with the overall net economic benefit from irrigated agriculture expected to change significantly [34,35]. Studies consequently point to Pakistan experiencing acute shortages of water negatively affecting those dependent on the Indus River and exacerbating conflicts among provinces [18,36,37].
Previous studies of the Indus River system and the WAA in Pakistan have highlighted the shortcomings of the WAA and supporting water-management infrastructure and the potential consequences of future changes in hydroclimate and demand. Less than a decade after the WAA was introduced, it was noted that the allocation among provinces was not formulated to respond to climatic, economic, social, and technological changes in Pakistan [17,18,28,34,38,39,40]. Past studies have not investigated the integrated performance of infrastructure components of the Indus before and after the WAA. The aim of the present study here was to evaluate the historical performance of the WAA of 1991 in terms of reliability, resilience, and vulnerability of Lower Indus Basin water-management infrastructure. This will help identify infrastructure enhancement needs that would be most beneficial.
Section 1 introduces the Water Apportionment Accord of 1991, previous water resources modeling of the Indus Basin, and a brief comparison, the problem statement, and the aims and objectives of the study. Section 2 provides a detailed description of the study area, an overview of the water resource evaluation techniques, an analysis approach, and metrics that are followed in this research. Section 3 presents the results of the performance of the Water Apportionment Accord of 1991. Section 4 concludes and summarizes all the assessments and proposes future water resources’ research to support a sustainable Indus River and Pakistan.
2. Materials and Methods
The statistical indices that are frequently used to assess any change in two periods are standard deviation, the standard error of estimates, the two-tailed t-test, and variance. A detailed review of these performance measures was given by Montgomery and Runger (1994) [41]. Past researchers have used various criteria for performance evaluation of water resource systems [42,43,44,45,46,47,48,49,50,51,52,53], including quantifying severity, duration, and recurrence. Also used have been integrated measures and specialized measures of aspects of performance such as risk, safety, robustness and reliability, resilience, and vulnerability (RRV). This study employs RRV to assess the performance of the Indus River major infrastructure systems in the Sindh Province to determine the efficacy of the WWA.
2.1. Study Area
The 3180 km Indus River originates in Tibet (China) and enters Pakistan at Ladakh, Gilgit-Baltistan. The Indus curves toward the south, enters Peshawar’s hilly region flow quickly through the Hazara, and is controlled at the Tarbela Reservoir. It then enters the Punjab region and travels the entire length of Punjab, where four other rivers, Jhelum, Chenab, Ravi, and Sutlej, drain into the Indus. Ahead of the confluence of these four Rivers, the Indus enters the Sindh Province at Kashmore.
Unlike other provinces in Pakistan, the Sindh has limited alternative water resources; it relies almost entirely on the flow available from the Indus. In Sindh Province, water is distributed from the Guddu Barrage in Kashmore, the Sukkur Barrage in Sukkur, and the Kotri Barrage in Jamshoro. The Kotri Barrage is the last controlling structure on the Indus and below Kotri the Indus discharges into the Arabian Sea near Thatta. The segment of the Indus River under consideration in this research is the Lower Indus River, served by the Guddu, Sukkur, and Kotri Barrages in Sindh Province (see Figure 1 for details). These barrages supply the world’s fourth-largest irrigation system, delivering water to command areas throughout Sindh [54]. The annual entitlements for these barrages and the environmental water demands are shown in Figure 2a,c.
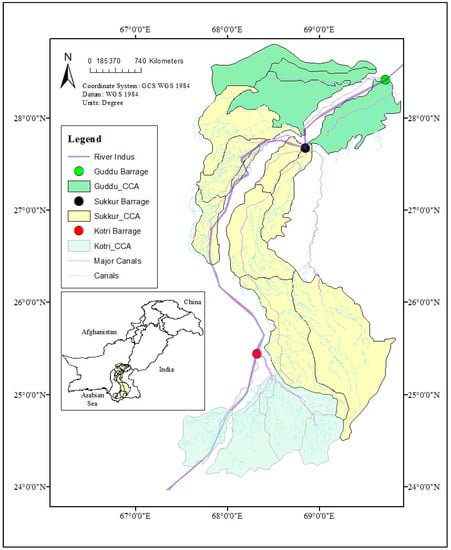
Figure 1.
The Indus Basin Irrigation System (IBIS) in Sindh, Pakistan. Command area (hectares): Sindh total—2540; Guddu—601; Sukkur—1772; Kotri Barrage—170 (as reported in 2015). Source: Irrigation and Power Department, Government of Sindh, Karachi.
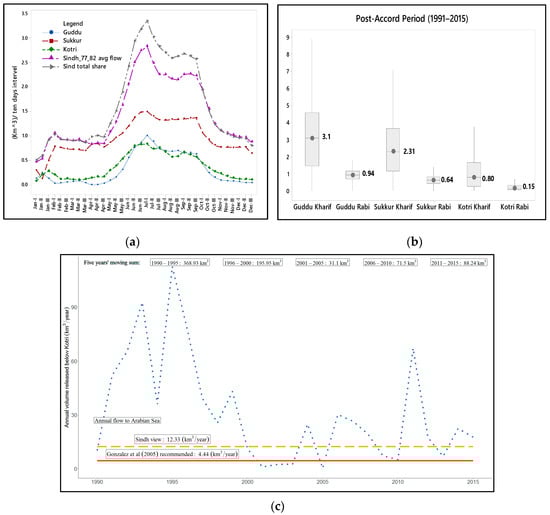
Figure 2.
(a) Lower Indus Basin (Sindh) Water Apportionment Accord (WAA) summary. Ten-day entitlements of Guddu, Sukkur, Kotri Barrages, overall Sindh provincial apportionments (clause 2 of WAA), and 1977–1982 average flows. (b) Minimum, maximum, and median available flow in post-Accord period. (c) Flow to the Arabian Sea from the Indus River, annual environmental. flow as per Sindh’s view; environmental. flows recommended by Gonzalez et al. (2005) [31]. Source: Indus River System Authority (IRSA), Federal Bureau of Statistics, Statistics Division, Government of Pakistan, Irrigation and Power Department, Government of Sindh, Karachi.
2.2. Evaluation of Historical Performance of WAA (1970–2015)
Reliability considers system’s performance during periods of service over the design life. The aim of Reliability-based design is to avoid failure and provide a fail-safe performance. Reliability is a widely used concept to describe the probability and frequency of failures of water supply systems [48]. In the case of a water supply reservoir, the periods in which water supply is sufficient to meet demand are termed as satisfactory; otherwise, it is considered to be in an unsatisfactory state. Reliability is commonly defined as the ratio of the number of satisfactory periods to the number of the total simulation periods [48,50,55].
The study follows Hashimoto’s definition; with reliability being how frequently the system does not fail (or performance is satisfactory):
where d(i) is the duration of the ith failure event, n is the number of failure events, and T is the total number of time intervals.
Resilience provides a measure of how quickly a system recovers from the failure. Hashimoto et al. (1982) defined the resilience as the conditional probability that the system is in a satisfactory state in a particular period given that it was in an unsatisfactory state in the preceding period [48]. Resilience has been applied with varying definitions in socio-ecological sciences [56,57,58,59]. Fiksel (2003) defined a system that could survive large perturbations [60]. Moy et al. (1986) introduced the maximum duration of the failure sequences over the functional period [50]. Chanda et al. (2014) applied the mean duration of consecutive failure sequences over the operating horizon [61]. Recently, there has been a paradigm shift in water resources research, from a “fail-safe design” to a “safe to fail” one. Generally, the resilience of a system can be categorized in two ways. Engineering resilience, that focuses on the constancy, efficiency, and predictability. It is measured using resistance to disturbance and speed of return to the equilibrium state [62,63]. While ecological resilience measures the magnitude of disturbance that the system absorbs before the structure is changed [64,65]. These two aspects of stability are equally important in water resource systems; one measures the efficiency (engineering), while the other represents the system’s existence (ecological). In this paper, the mean recovery time after a failure represents resilience.
where S(t) is the system state variable under consideration. This definition of resilience is equal to the inverse of the mean value of the time the system spends in an unsatisfactory state and it is estimated by Kjeldsen and Rosberg, 2004 [66] as:
where M is the number of failure events.
Resilience = P{S(t + 1)∈NF|S(t)∈F},
Vulnerability is described as the severity of deficits during failure periods. The vulnerability has remained a key indicator to the susceptibility to harm in both engineering and ecological systems. The vulnerability assessment involves interpretations of the thresholds of acceptable risk. Adger (2006) defines vulnerability as “the state of susceptibility to harm from exposure to stresses associated with environmental and social change and from the absence of capacity to adapt” [67]. The often cited Intergovernmental Panel on Climate Change (IPCC) description of vulnerability is “the degree to which a system is susceptible to and is unable to cope with adverse effects” [68]. A number of metrics are proposed to analyze the vulnerability: The mean deficit [48,61,69,70], the median deficit [47], and the maximum deficit [50,71,72] of each failure event over the operational period and the return period of a certain level of cumulative deficit [47]. Since this is a dynamic phenomenon in biophysical processes [73], there is still a research gap to find suitable ecological vulnerability metrics. The present study adopts Hashimoto’s (1982) [48] mean deficit values, which is a commonly-used metric in similar investigations.
The vulnerability representing the likely damage of a failure event, as defined by Hashimoto et al. (1982) [48], is:
where h(j) is the most severe outcome of the jth sojourn in an unsatisfactory state and e(j) is the probability of h(j) being the most severe outcome of a sojourn in an unsatisfactory state. Hashimoto et al. [48] and Jinno et al. [74] based the vulnerability measures on the total water deficit experienced during the entire jth sojourn into F, i.e., the deficit volume. This definition is suitable for reservoirs, as the most severe outcome of a reservoir state is often empty, h(j) = 0. As a further simplification of Equation (4), both studies considered the probability of each event to be equal, i.e., e(1) = … = e(M) = 1/M, where M is the number of failure events. Therefore, the estimated vulnerability is the mean value of the deficit events:
where the v(i) is the mean value of the deficit events.
Water system vulnerability ranges from (0, 1). It is useful to categorize in many ways for analysis. One approach is to define categories using Jenks optimization, also recognized as “Jenks natural breaks” [75]. Jenks optimization attempts to lessen the average deviation of an individual class, while simultaneously maximizing every class deviation from the means of the other classes. Like the product, the vulnerability values found from Equation (5) are grouped into six classes: (1) Extreme (E) (0.333–0.402), (2) medium–extreme (ME) (0.292–0.332), (3) high (H) (0.238–0.291), (4) medium–high (MH) (0.154–0.237), (5) medium (M) (0.106–0.153), and (6) low (L) (0–0.105). By applying Jenks categories in this way, Category 1 represents the highest vulnerability and Category 6 represents the lowest vulnerability. If the vulnerability value exceeds 0.402, it is categorized as the most extreme condition. Hashimoto’s RRV model has been found to be straightforward to apply and adaptable under data constraints [42,43,44,45]. The RRV metrics have been widely applied around the world to evaluate water allocation schemes [46,47] and one that permits comparison among studies and reproducibility. Although RRV criteria have remained a widely used concept in water resource planning, the assessment based on historical time series are problematic. Kjeldsen and Rosbjerg (2004) recommended the use of simulated long data series [66]. Sometimes the severity of a low probability event can be high, therefore, the recent idea of safe to fail as opposed to fail-safe is recommended for resource planning [69]. Because they are simple, versatile, and have fewer data requirements compared to other models, the choice for this study was to use Hashimoto’s RRV metrics as the basis for the assessment of the historical performance of the WAA.
The historical performance assessment of the Accord is divided into two periods for this study, pre-Accord (1970–1990) and post-Accord (1991–2015). The total volume of flow passing over ten-day periods for the 45 years of the study (1970–2015) were acquired for Guddu, Sukkur, and Kotri Barrages from the Pakistan Water and Power Development Authority (WAPDA), Indus River System Authority (IRSA), and Sindh Irrigation Department. The WAA of 1991 distributes water on a ten-day (i.e., seasonally system-wise adjusted allocations) basis throughout Pakistan. These ten-day entitlements are based on the water demands of command areas of the barrages. Similarly, there is also apportionment for Guddu, Sukkur, and Kotri Barrages’ commands as shown in Figure 2a. To establish the WAA, these entitlements were defined by the Government of Pakistan after an analysis of stream flow and demand data for the period of 1977–1982. In the present research, these entitlements are set as the threshold for the performance of the barrages; if the supply is equal to or greater than these demands/entitlements, the performance of the barrage is satisfactory (S); otherwise, it is unsatisfactory (US). Using this threshold, the performance of the three barrages can be quantified using RRV for pre-accord and post-accord periods. A comparison of pre- and post-accord supplies to the Lower Indus Basin (LIB) reservoirs is performed using three different approaches. (1) The flow provisions and e-flows were compared using monthly maximum (Q100), 75th, 50th, 25th percentiles, monthly minimum (Q0), and mean monthly flows (trend results for Kharif, Rabi seasons in pre- and post-accord periods are compared). (2) The percent of the time when discharge was equaled or exceeded (using flow-duration curves for pre- and post-accord periods). (3) Using the RRV criteria, the probability of failure, mean deficit of water supply and mean duration of water shortage. These three approaches provide insights into how water availability varies between pre- and post-accord periods.
3. Results
The deficit of allocated shares versus water availability for Lower Indus (Sindh) is shown in Figure 3 and Table 1 and Table 2. The results highlight that during Rabi season the supply has never been achieved since the mark of allocation. The most severe situations were observed in 1999 and 2002, when Sindh experienced 69.47% and 77.23% deficit from the allocated share respectively.
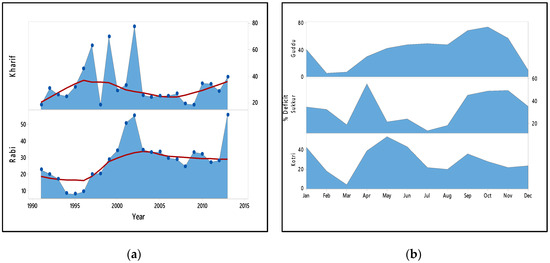
Figure 3.
(a) Seasonal allocation deficits (%) of Sindh versus WAA. (b) Monthly mean water allocation deficit (%) of Guddu, Sukkur, and Kotri Barrages.

Table 1.
Historical performance evaluation of WAA using statistical tests for Kharif and Rabi seasonal flows at Guddu, Sukkur, Kotri, and environmental flows below Kotri (km3/season) in pre-accord period.
Table 2.
Historical performance evaluation of WAA using statistical tests for Kharif and Rabi seasonal flows at Guddu, Sukkur, Kotri, and environmental flows below Kotri (km3/season) in post-accord period.
Figure 4 shows the flow duration curves for the pre- and post-Accord periods. The proportion of time at which the flows of Guddu, Sukkur, Kotri Barrages and e-flows exceeded the entitlements was determined by generating flow duration curves. The flow availability in the pre-Accord period at all three barrages was more than that of the post-Accord’s flow. At Guddu Barrage, the probability exceedance curves show that the discharge was almost the same in the pre- and post-Accord periods. The mid and lower flows (which exceeded the allotment by about 40%) are relatively similar, but the larger flows exhibit much variability. The Sukkur and Kotri Barrages’ flow duration curves show that the amount of water availability was significantly reduced in the post-Accord period.
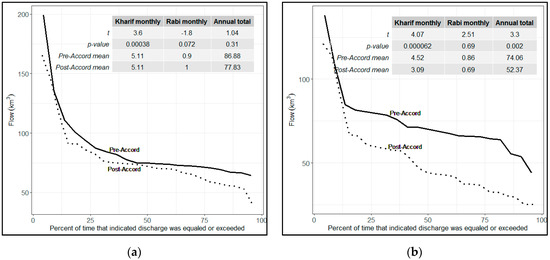
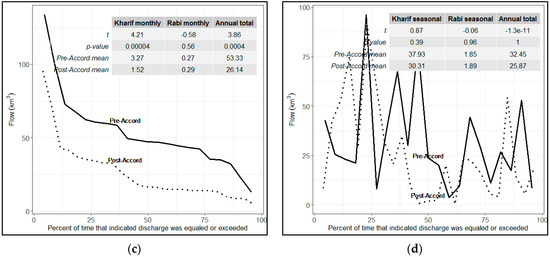
Figure 4.
Flow duration curves (percentage of time that indicated discharge was equaled or exceeded), (a) Guddu Barrage, (b) Sukkur Barrage, and (c) Kotri Barrage. (d) Environmental flow below Kotri Barrage. Statistical tests for pre- and post-Accord periods were performed using Welch Two Sample t-test. The larger t scores represent significant differences while the smaller t scores indicate relatively insignificant differences between the groups.
3.1. Reliability
Since the implementation of the Accord, there have been significant reductions in the reliability observed in the Lower Indus Basin (Sindh). In pre-Accord (Kharif) season, out of 21 years, the Guddu and Sukkur Barrages remained reliable for 48% of the time and 34% for Kotri Barrage, while in the post-Accord period, out of 25 years, the system reliability was observed to be 44% (−4%), 24% (−50%) and 32% (−4%) at Guddu, Sukkur, and Kotri Barrages, respectively. In pre-Accord (Rabi) season, the Guddu remained reliable 48% of the time, Sukkur and Kotri Barrages remained reliable 15% of the time, while in the post-Accord period, the system was reliable 44% (+12%), 16% (+1%), and 12% (−4%) of the period at Guddu, Sukkur, and Kotri Barrages, respectively. The mean reliability improved by 0.01 at Guddu and dropped 0.06 at Sukkur and 0.12 at Kotri. Overall, during the post-Accord period in both Kharif and Rabi seasons, at Guddu Barrage the average reliability was improved by 1.1%, declined 7.7% at Sukkur, and declined by 16.2% at Kotri. Figure 5 describes the reliability during pre- and post-Accord periods (Kharif and Rabi seasons).
Figure 5.
Reliability of Guddu, Sukkur, and Kotri barrages in Kharif and Rabi seasons. Data sources: WAA thresholds—Indus River System Authority (IRSA); flow volume—Pakistan Water and Power Development Authority (WAPDA) and Sindh Irrigation Department.
3.2. Resilience
Since implementation of the accord, the overall system has been more resilient, except at Sukkur Barrage. Figure 6 shows the mean resilience in pre- and post-Accord periods. Overall, at Guddu and Sukkur Barrages, the average resilience diminished by 39.3% and 0.42%, respectively, whereas Kotri experienced an improvement of 70%. Figure 5 illustrates the resilience during pre- and post-Accord periods. The Guddu and Sukkur Barrages indicated insignificant differences, while the larger values at Kotri Barrage indicated significant differences in both periods. In the pre-Accord (Kharif) season, the average resiliencies were found to be 0.0079, 0.0087, and 0.020 at Guddu, Sukkur, and Kotri Barrages, respectively, while in the post-Accord period, the average resiliencies of these three barrages were determined to be 0.062, 0.043, and 0.074 respectively. Similarly, in the pre-Accord (Rabi) season, the average resiliencies was 0.0088, 0.039, and 0.04, whereas in the post-Accord period, the average resiliencies of these three barrages were 0.038, 0.035, and 0.143 at Guddu, Sukkur, and Kotri Barrages, respectively.
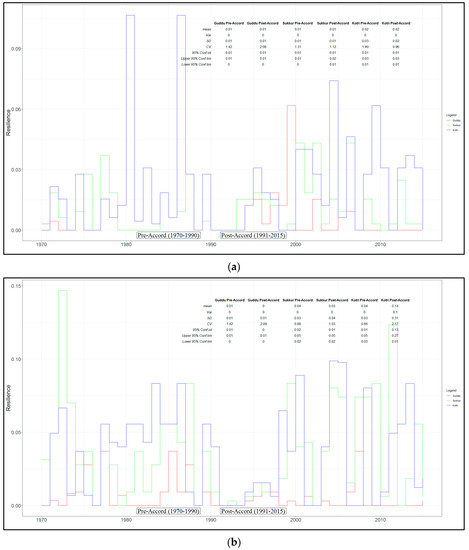
Figure 6.
Resilience of Guddu, Sukkur, and Kotri barrages pre-accord (1970–1990) and post-accord (1991–2015) periods for. (a) Kharif and (b) Rabi season. Statistical tests of each period (mean, variance, standard deviation), for pre- and post-Accord periods. Data sources: WAA thresholds—Indus River System Authority (IRSA); flow volume—Pakistan Water and Power Development Authority (WAPDA) and Sindh Irrigation Department.
3.3. Vulnerability
The lower Indus basin irrigation system was more vulnerable in the post-Accord period with the worst performance at Sukkur and Kotri. Figure 7 shows the vulnerability in pre- and post-Accord periods in both Kharif and Rabi seasons. The smaller t-values at Guddu and Sukkur Barrages indicate insignificant differences, while the larger values at Kotri Barrage indicate significant differences in both periods. Overall, at Guddu Barrage, the average vulnerability remained unaffected during pre- and post-Accord periods, augmented by 12.5% at Sukkur and nearly 90% at Kotri. In the pre-Accord (Kharif) season, the average vulnerabilities were observed to be 0.0355, 0.066, and 0.049 at Guddu, Sukkur, and Kotri, respectively, whereas the average vulnerabilities determined throughout the post-Accord were 0.033, 0.054, and 0.142 at Guddu, Sukkur, and Kotri, respectively. In the pre-Accord period (Rabi season) at Guddu Barrage, the average vulnerability was observed to be 0.02. At Sukkur and Kotri Barrages, the average vulnerabilities during the 21 years of the pre-Accord period were 0.143 (medium-M) and 0.144 (medium-M). Conversely, in the post-Accord period, the average vulnerabilities examined at the three barrages were found to be 0.028, 0.114, and 0.23.
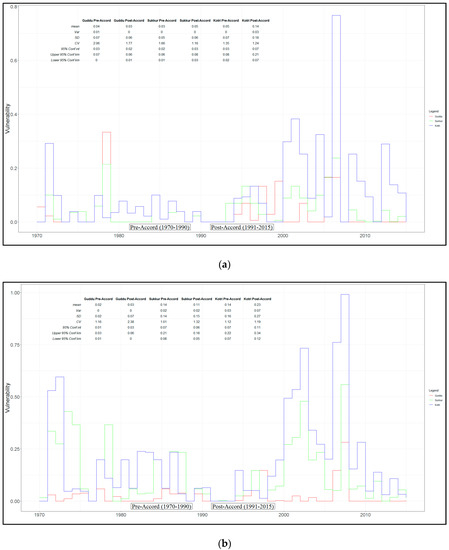
Figure 7.
Vulnerabilities of Guddu, Sukkur, and Kotri barrages for the pre-Accord (1970–1990) and post-Accord (1991–2015) periods. (a) Kharif and (b) Rabi seasons. Statistical tests of each period (mean, variance, standard deviation), for in the pre- versus post-Accord periods. Data sources: WAA thresholds—Indus River System Authority (IRSA); flow volume—Pakistan Water and Power Development Authority (WAPDA) and Sindh Irrigation Department.
Since 2000, there have been significant reductions in the reliability of the Indus delta below Kotri. During the 23 years, there were 10 years when the system performance was unreliable as measured against the allotted shares. During the Rabi season, over the 20 years the water availability was less than the allotted share at Kotri Barrage. The targeted reliability, 1, was attained in only nine years in Kharif and only 3 years in Rabi season. The lower Indus basin irrigation system was observed to be more vulnerable in the post-Accord period with exacerbation in the performance by nearly 90% at Kotri. In the Kharif season, the average vulnerability was 0.17, with the system most vulnerable during 2006 and the observed value was 0.31. While in the Rabi season, the average vulnerability at the same barrage was 0.7 (see Table 3 for mean reliabilities of the pre- versus post-Accord periods).
Table 3.
Comparison of mean reliability, resiliency, and vulnerability of e-flows below Kotri in pre- and post-Accord periods (Kharif and Rabi seasons). Source: Sindh proposed e-flow requirements 12.33 km3/year. Flow released below Kotri from the Sindh Irrigation Department.
4. Discussion and Conclusions
This research presented a comprehensive study of Pakistan’s Water Apportionment Accord of 1991 at the lowermost Guddu, Sukkur, Kotri Barrages and environmental flows below Kotri. During Kharif and Rabi at Guddu Barrage, out of 46 years, there were 21 years when water availability was less than the allotted share. Sukkur and Kotri Barrages experienced 30 and 32 water deficit years in Kharif, while in Rabi, the water deficit years were 36 and 39 years, respectively. The most vulnerable condition was observed during 2007, when the system reliability was almost 0, with the most extreme vulnerability condition of 0.99 at Kotri Barrage. During the post-Accord period in both Kharif and Rabi seasons, at Guddu Barrage the average reliability was enhanced from the pre-Accord period by 1.1% and declined 7.7% at Sukkur and 16.2% at Kotri. At Guddu and Sukkur Barrages, the average resilience diminished by 39.3% and 0.42%, whereas Kotri shows improvements by 70%. However, at Guddu Barrage, the average vulnerability was unaffected during pre- and post-Accord, while it reduced 12.5% at Sukkur and nearly 90% at Kotri.
The lack of flexibility of the WAA is rooted in the provisions of clause 14b, which uses the average flow of 144.75 km3 (1977–1982) of the system to set the water allocation formula used by the Indus River System Authority (IRSA). The WAA does not provide operational rules for every control structure; these rules should be well established and enforced. The Indus delta runs dry for several months in the Rabi season (October–March) each year. The surplus water is available for only 70–100 days during the flood season (June–September). According to WAPDA (Water and Power Development Authority, Pakistan), 43.2 km3 of water on average is outflowing to sea each year. It is a precarious situation that, despite an excess supply of almost 30.84 km3, it is not being used to regulate flow downstream from Kotri because of inadequate storage capacity in the country. Therefore, there is a pressing need to practice clause 6 of the WAA; “the need for storages, wherever feasible” should be carried out on an emergency basis to combat the future shortage.
Water allocation between the upper and lower riparian is a multidimensional problem. The Sindh Province of Pakistan has no alternative to meet the growing demand, other than the Indus River. As domestic and industrial demands increase, the only choice remaining is to reduce the irrigation demands and control water losses. The Singapore case study is a great example of achieving long-term water security. Singapore has significantly reduced dependence on water supply from Malaysia by maximizing rainfall use, managing per capita demand, implementing ordinances, employing water efficiency measures, water reuse, and public education [76,77,78]. The present study notes the need to consider alteration to the WAA of 1991 to account for future changes in demand, ecology, meteorology, glaciology, and other expected changes to define an allocation based approach for shortage conditions. The RRV-based investigations evaluate how different criteria interplay and help in evidence-based policy (EBP) for optimal reservoir operations. Future research could explore the optimal trade-off between RRV to maximize the reliability, by minimizing the severity and duration of water shortage.
Author Contributions
Conceptualization and methodology, D.H., R.B., and S.J.B.; resources and data acquisition, W.A., M.A., M.N.R., and K.A.; writing—original draft preparation, D.H.; writing—review and editing, S.J.B., W.A., and R.B.; visualization, A.R., K.A., and M.A.; supervision, R.B., S.J.B., and W.A.
Funding
This research was funded by the United States Agency for International Development through a U.S,- Pakistan Center for Advanced Studies in Water-Mehran UET grant number 02-Development of a Decision Support System for Water Resources Planning and Management in Pakistan (DSS-Pak).
Acknowledgments
The authors are sincerely grateful to Rick Bereit for technical editing and two anonymous reviewers for their meticulous reading and suggestions to improve the manuscript.
Conflicts of Interest
The authors declare no conflicts of interest.
Disclaimer
This study is made possible by the support of the United States Government and the American people through the United States Agency for International Development (USAID). The contents are the sole responsibility of the University of Utah and do not necessarily reflect the views of USAID or the United States Government.
References
- Rockström, J.; Steffen, W.; Noone, K.; Persson, Å.; Chapin, F.S., III; Lambin, E.F.; Lenton, T.M.; Scheffer, M.; Folke, C.; Schellnhuber, H.J. A safe operating space for humanity. Nature 2009, 461, 472. [Google Scholar] [CrossRef] [PubMed]
- Garrick, D.; Hall, J.W. Water security and society: Risks, metrics, and pathways. Annu. Rev. Environ. Resour. 2014, 39, 611–639. [Google Scholar] [CrossRef]
- Organisation for Economic Co-opearation and Development. OECD Environmental Outlook to 2050; OECD Publishing: Paris, France, 2012. [Google Scholar]
- Water, U. Water Security and the Global Water Agenda: A UN-Water Analytical Brief; UN University: Hamilton, ON, Canada, 2013. [Google Scholar]
- Gerlak, A.K.; House-Peters, L.; Varady, R.G.; Albrecht, T.; Zúñiga-Terán, A.; de Grenade, R.R.; Cook, C.; Scott, C.A. Water security: A review of place-based research. Environ. Sci. Policy 2018, 82, 79–89. [Google Scholar] [CrossRef]
- Dasgupta, P. Human Well-Being and the Natural Environment; Oxford University Press: Oxford, UK, 2001. [Google Scholar]
- Sachs, J.; McArthur, J.W.; Schmidt-Traub, G.; Kruk, M.; Bahadur, C.; Faye, M.; McCord, G. Ending Africa’s poverty trap. Brook. Pap. Econ. Act. 2004, 2004, 117–240. [Google Scholar] [CrossRef]
- Sullivan, C. Calculating a water poverty index. World Dev. 2002, 30, 1195–1210. [Google Scholar] [CrossRef]
- Vicente-Serrano, S.M.; Beguería, S.; López-Moreno, J.I. A multiscalar drought index sensitive to global warming: The standardized precipitation evapotranspiration index. J. Clim. 2010, 23, 1696–1718. [Google Scholar] [CrossRef]
- Bolognesi, T. The Water Vulnerability of Metro and Megacities: An Investigation of Structural Determinants. Nat. Resour. Forum 2015, 39, 123–133. [Google Scholar] [CrossRef]
- Jones, P.D.; Moberg, A. Hemispheric and large-scale surface air temperature variations: An extensive revision and an update to 2001. J. Clim. 2003, 16, 206–223. [Google Scholar] [CrossRef]
- Solomon, S.; Qin, D.; Manning, M.; Averyt, K.; Marquis, M. Climate Change 2007—The Physical Science Basis: Working Group I Contribution to the Fourth Assessment Report of the IPCC; Cambridge University Press: Cambridge, UK, 2007; Volume 4. [Google Scholar]
- Sheffield, J.; Wood, E.F. Projected changes in drought occurrence under future global warming from multi-model, multi-scenario, IPCC AR4 simulations. Clim. Dyn. 2008, 31, 79–105. [Google Scholar] [CrossRef]
- Dubrovsky, M.; Svoboda, M.D.; Trnka, M.; Hayes, M.J.; Wilhite, D.A.; Zalud, Z.; Hlavinka, P. Application of relative drought indices in assessing climate-change impacts on drought conditions in Czechia. Theor. Appl. Climatol. 2009, 96, 155–171. [Google Scholar] [CrossRef]
- Brown, C.; Meeks, R.; Ghile, Y.; Hunu, K. Is water security necessary? An empirical analysis of the effects of climate hazards on national-level economic growth. Philos. Trans. R. Soc. A Math. Phys. Eng. Sci. 2013, 371, 20120416. [Google Scholar] [CrossRef] [PubMed]
- Dadson, S.; Hall, J.W.; Garrick, D.; Sadoff, C.; Grey, D.; Whittington, D. Water security, risk, and economic growth: Insights from a dynamical systems model. Water Resour. Res. 2017, 53, 6425–6438. [Google Scholar] [CrossRef]
- IUCN. Pakistan Water Apportionment Accord for Resolving Inter-Provincial Water Conflicts–Policy Issues and Options; IUCN: Karachi, Pakistan, 2010.
- PILDAT. Inter-Provincial Water Issues in Pakistan; Background Paper; Pakistan Institute of Legislative Development and Transparency: Islamabad, Pakistan, 2011. [Google Scholar]
- Ramphal, S.S.; Sinding, S.W. Population Growth and Environmental Issues; Greenwood Publishing Group: Westport, CT, USA, 1996. [Google Scholar]
- Bughio, A. Cries of Manchar. In Hayatee Magazine; Sindh Graduates Association: Karachi, Pakistan, 1999. [Google Scholar]
- Government of Pakistan. Statistical Supplement of Economic Survey 2006–07; Ministry of Finance: Islamabad, Pakistan, 2008.
- Khan, H.; Khan, A. Natural Hazards and Disaster Management in Pakistan; Munich University Library: Munich, Germany, 2008. [Google Scholar]
- Kurosaki, T. Vulnerability of household consumption to floods and droughts in developing countries: Evidence from Pakistan. Environ. Dev. Econ. 2015, 20, 209–235. [Google Scholar] [CrossRef]
- Sindh Forest Department. Provincial Working Group, Government of Sindh: Sukkur, Pakistan, 2002. Available online: https://sindhforests.gov.pk/ (accessed on 29 June 2019).
- Khalid, I.; Begum, I. Hydro Politics in Pakistan: Perceptions and Misperceptions. South Asian Stud. 2013, 28, 7–23. [Google Scholar]
- Khan, A.H. Water Sharing Dispute in Pakistan: Standpoint of Provinces. Berkeley J. Soc. Sci. 2014, 4, 1–17. [Google Scholar]
- Magsi, H.; Atif, S. Water management, impacts and conflicts: Case of indus water distribution in Sindh, Pakistan. Int. J. Rural Stud. 2012, 19, 3–7. [Google Scholar] [CrossRef]
- Bhatti, M.; Farooq, M. Politics of Water in Pakistan. Pak. J. Soc. Sci. 2014, 34, 205–216. [Google Scholar]
- WWF. Development of the Integrated Water Resources Management (IRBM) for Indus Basin Challenges and Opportunities; WWF Pakistan: Lahore, Pakistan, 2012. [Google Scholar]
- Anwar, A.A.; Bhatti, M.T. Pakistan’s water apportionment Accord of 1991: 25 years and beyond. J. Water Resour. Plan. Manag. 2017, 144, 05017015. [Google Scholar] [CrossRef]
- González, F.J.; Basson, T.; Schultz, B. Final Report of IPOE for Review of Studies on Water Escapages below Kotri Barrage; Unpublished report by an international panel of experts; Pakistan, 2005. [Google Scholar]
- Archer, D. Contrasting hydrological regimes in the upper Indus Basin. J. Hydrol. 2003, 274, 198–210. [Google Scholar] [CrossRef]
- Archer, D.R.; Forsythe, N.; Fowler, H.J.; Shah, S.M. Sustainability of water resources management in the Indus Basin under changing climatic and socio economic conditions. Hydrol. Earth Syst. Sci. 2010, 14, 1669–1680. [Google Scholar] [CrossRef]
- Wescoat, J.L., Jr. Managing the Indus River basin in light of climate change: Four conceptual approaches. Glob. Environ. Chang. 1991, 1, 381–395. [Google Scholar] [CrossRef]
- Akhtar, M.; Ahmad, N.; Booij, M.J. Use of regional climate model simulations as input for hydrological models for the Hindukush-Karakorum-Himalaya region. Hydrol. Earth Syst. Sci. 2009, 13, 1075–1089. [Google Scholar] [CrossRef]
- Patz, A.; Lang, K.; King, J.; Hillmann, P.; Condon, E. Resource Disputes in South Asia: Water Scarcity and the Potential for Interstate Conflict. Ph.D. Thesis, University of Wisconsin–Madison, Madison, WI, USA, 2009. [Google Scholar]
- Arfan, M.; Lund, J.; Hassan, D.; Saleem, M.; Ahmad, A. Assessment of Spatial and Temporal Flow Variability of the Indus River. Resources 2019, 8, 103. [Google Scholar] [CrossRef]
- Yang, Y.-C.E.; Brown, C.; Yu, W.; Wescoat, J., Jr.; Ringler, C. Water governance and adaptation to climate change in the Indus River Basin. J. Hydrol. 2014, 519, 2527–2537. [Google Scholar] [CrossRef]
- Ali, G.; Hasson, S.; Khan, A.M. Climate Change: Implications and Adaptation of Water Resources in Pakistan; Global Change Impact Studies Centre (GCISC): Islamabad, Pakistan, 2009.
- Laghari, A.; Vanham, D.; Rauch, W. The Indus basin in the framework of current and future water resources management. Hydrol. Earth Syst. Sci. 2012, 16, 1063. [Google Scholar] [CrossRef]
- Montgomery, D.C.; Runger, G.C. Applied Statistics and Probability for Engineers; John Wiley & Sons: Hoboken, NJ, USA, 2010. [Google Scholar]
- Fiering, M.B. Alternative indices of resilience. Water Resourc Res. 1982, 18, 33–39. [Google Scholar] [CrossRef]
- Duckstein, L.; Plate, E.J. A system framework for hydrological reliability with application to the design of structures. IAHS AISH Publ. 1985, 213–223. [Google Scholar]
- Kindler, J.; Tyszewski, S. Multicriteria evaluation of decision rules in the design of a storage reservoir. In Closing the Gap Between Theory and Practice; IAHS Publ. No. 180; IAHS: Wallingford, UK, 1989; pp. 187–201. [Google Scholar]
- Kundzewicz, Z.W. Renewal Theory Criteria of Evaluation of Water-Resource Systems: Reliability and ResiliencePaper presented at ICWRS-Workshop on Risk and Uncertainty in Hydrologic Design Oslo, Norway, February-1989. Hydrol. Res. 1989, 20, 215–230. [Google Scholar] [CrossRef]
- Kim, U.; Kaluarachchi, J.J. Climate Change Impacts on Water Resources in the Upper Blue Nile River Basin, Ethiopia 1. Jawra J. Am. Water Resour. Assoc. 2009, 45, 1361–1378. [Google Scholar] [CrossRef]
- Asefa, T.; Clayton, J.; Adams, A.; Anderson, D. Performance evaluation of a water resources system under varying climatic conditions: Reliability, Resilience, Vulnerability and beyond. J. Hydrol. 2014, 508, 53–65. [Google Scholar] [CrossRef]
- Hashimoto, T.; Loucks, D.P.; Stedinger, J.R. Robustness of water resources systems. Water Resour. Res. 1982, 21–26. [Google Scholar] [CrossRef]
- Holling, C.S. Resilience and stability of ecological systems. Annu. Rev. Ecol. Syst. 1973, 4, 1–23. [Google Scholar] [CrossRef]
- Moy, W.S.; Cohon, J.L.; ReVelle, C.S. A programming model for analysis of the reliability, resilience, and vulnerability of a water supply reservoir. Water Resour. Res. 1986, 22, 489–498. [Google Scholar] [CrossRef]
- Smit, B.; Wandel, J. Adaptation, adaptive capacity and vulnerability. Glob. Environ. Chang. 2006, 16, 282–292. [Google Scholar] [CrossRef]
- Rosenzweig, C.; Tubiello, F.N. Developing Climate Change Impacts and Adaptation Metrics for Agriculture. In Proceedings of the Global Forum on Sustainable Development on the Economic Benefits of Climate Change Policies, Paris, France, 24–25 October 2006. [Google Scholar]
- Wang, C.-H.; Blackmore, J.M. Resilience concepts for water resource systems. J. Water Resour. Plan. Manag. 2009, 135, 528–536. [Google Scholar] [CrossRef]
- International Commission on Irrigation and Drainage (ICID). 2010. Available online: https://www.icid.org/ (accessed on 29 June 2019).
- Mondal, M.S.; Wasimi, S.A. Evaluation of risk-related performance in water management for the Ganges Delta of Bangladesh. J. Water Resour. Plan. Manag. 2007, 133, 179–187. [Google Scholar] [CrossRef]
- Francis, R.; Bekera, B. A metric and frameworks for resilience analysis of engineered and infrastructure systems. Reliab. Eng. Syst. Saf. 2014, 121, 90–103. [Google Scholar] [CrossRef]
- Wong, T.H.; Brown, R.R. The water sensitive city: Principles for practice. Water Sci. Technol. 2009, 60, 673–682. [Google Scholar] [CrossRef]
- Woods, D.D. Four concepts for resilience and the implications for the future of resilience engineering. Reliab. Eng. Syst. Saf. 2015, 141, 5–9. [Google Scholar] [CrossRef]
- Schoen, M.; Hawkins, T.; Xue, X.; Ma, C.; Garland, J.; Ashbolt, N.J. Technologic resilience assessment of coastal community water and wastewater service options. Sustain. Water Qual. Ecol. 2015, 6, 75–87. [Google Scholar] [CrossRef]
- Fiksel, J. Designing resilient, sustainable systems. Environ. Sci. Technol. 2003, 37, 5330–5339. [Google Scholar] [CrossRef] [PubMed]
- Chanda, K.; Maity, R.; Sharma, A.; Mehrotra, R. Spatiotemporal variation of long-term drought propensity through reliability-resilience-vulnerability based Drought Management Index. Water Resour. Res. 2014, 50, 7662–7676. [Google Scholar] [CrossRef]
- Pimm, S.L. The complexity and stability of ecosystems. Nature 1984, 307, 321. [Google Scholar] [CrossRef]
- Tilman, D.; Downing, J.A. Biodiversity and stability in grasslands. Nature 1994, 367, 363. [Google Scholar] [CrossRef]
- Walker, B.H.; Ludwig, D.; Holling, C.S.; Peterman, R.M. Stability of semi-arid savanna grazing systems. J. Ecol. 1981, 473–498. [Google Scholar] [CrossRef]
- Holling, C.S. Engineering resilience versus ecological resilience. Eng. Ecol. Constraints 1996, 31, 32. [Google Scholar]
- Kjeldsen, T.R.; Rosbjerg, D. Choice of reliability, resilience and vulnerability estimators for risk assessments of water resources systems/Choix d’estimateurs de fiabilité, de résilience et de vulnérabilité pour les analyses de risque de systèmes de ressources en eau. Hydrol. Sci. J. 2004, 49, 767. [Google Scholar] [CrossRef]
- Adger, W.N. Vulnerability. Glob. Environ. Chang. 2006, 16, 268–281. [Google Scholar] [CrossRef]
- McCarthy, J.J.; Canziani, O.F.; Leary, N.A.; Dokken, D.J.; White, K.S. Climate Change 2001: Impacts, Adaption, and Vulnerability; Cambridge University Press: Cambridge, UK, 2001. [Google Scholar]
- Jain, S.; Bhunya, P. Reliability, resilience and vulnerability of a multipurpose storage reservoir/Confiance, résilience et vulnérabilité d’un barrage multi-objectifs. Hydrol. Sci. J. 2008, 53, 434–447. [Google Scholar] [CrossRef]
- Sandoval-Solis, S.; McKinney, D.; Loucks, D. Sustainability index for water resources planning and management. J. Water Resour. Plan. Manag. 2010, 137, 381–390. [Google Scholar] [CrossRef]
- Fowler, H.; Kilsby, C.; O’Connell, P. Modeling the impacts of climatic change and variability on the reliability, resilience, and vulnerability of a water resource system. Water Resour. Res. 2003, 39. [Google Scholar] [CrossRef]
- Ajami, N.K.; Hornberger, G.M.; Sunding, D.L. Sustainable water resource management under hydrological uncertainty. Water Resour. Res. 2008, 44. [Google Scholar] [CrossRef]
- O’Brien, K.; Eriksen, S.E.; Schjolden, A.; Nygaard, L.P. What’s in a Word? Conflicting Interpretations of Vulnerability in Climate Change Research; Center for International Climate and Environmental Research: Oslo, Norway, 2004. [Google Scholar]
- Jinno, K. Risk assessment of a water supply system during drought. Int. J. Water Resour. Dev. 1995, 11, 185–204. [Google Scholar] [CrossRef]
- Jenks, G.F. The data model concept in statistical mapping. Int. Yearb. Cartogr. 1967, 7, 186–190. [Google Scholar]
- Chen, D.C.; Maksimovic, C.; Voulvoulis, N. Institutional capacity and policy options for integrated urban water management: A Singapore case study. Water Policy 2011, 13, 53–68. [Google Scholar] [CrossRef]
- Luan, I.O.B. Singapore water management policies and practices. Int. J. Water Resour. Dev. 2010, 26, 65–80. [Google Scholar] [CrossRef]
- Tortajada, C. Water management in Singapore. Int. J. Water Resour. Dev. 2006, 22, 227–240. [Google Scholar] [CrossRef]


© 2019 by the authors. Licensee MDPI, Basel, Switzerland. This article is an open access article distributed under the terms and conditions of the Creative Commons Attribution (CC BY) license (http://creativecommons.org/licenses/by/4.0/).