Article

Willingness to Pay for Watershed Management

1
Polo Centre of Sustainability, 18100 Imperia, Italy
2
Water and Land Resource Center, Addis Ababa University, 3880 Addis Ababa, Ethiopia
3
Centre for Development and Environment, University of Bern, 3012 Bern, Switzerland
4
Faculty of Economics, University of Gdansk, 81-824 Sopot, Poland
*
Author to whom correspondence should be addressed.
Resources 2019, 8(2), 77; https://doi.org/10.3390/resources8020077
Submission received: 10 March 2019 / Revised: 18 April 2019 / Accepted: 19 April 2019 / Published: 23 April 2019
(This article belongs to the Special Issue Multiple-Effect Water Resources Management)

Abstract

:
Equitable payments for ecosystem services are emerging as a viable tool to protect and restore ecosystems. Unlike previous studies using contingent valuation approach in Ethiopia, this study is unique in its scope and target users. It explores the possibility of payment for watershed services as an economic tool in supporting and promoting sustainable land management and financing community-based watershed investments from electric users at a national level. We examine the sensitivity of users’ ability to generate funds for watershed services for sustainable watershed management through the raising of small amounts of money added onto a monthly electrical bill. Sampling frame covered four of the nine regional states of Ethiopia with more than 86% coverage dating back to 2014. A total of 501 urban and rural households and 100 organizations were interviewed over a five-year period from 2014–2019. We used a multistage sampling technique; we first selected cities, towns, and villages based on several data collection methodologies. The findings indicate that about 84% and 90% of households and organizations, respectively, showed their willingness to pay (WTP) additional fees for watershed management that could potentially reduce upland degradation and siltation. Specifically, more than half of the households and organizations and industries were willing to pay the surcharge for watershed management. Likewise, we developed a model estimation of results which verified the WTP amount, respectively. We concluded that funds generated from electric users play a possible role in contributing to the financing of watershed management efforts and could be taken as an important lesson for the watershed management continuum efforts Ethiopia-wide and in other countries.

1. Introduction

Adopting sustainable land management (SLM) practices could guarantee the provision of ecosystem services in a sustainable way [1]. Our world faces an urgent need to adopt successful SLM practices for two reasons. First, more than 10 million hectares of land annually continue to be degraded. Second, there is a need to increase terrestrial food production by 70% by 2050 to satisfy the world’s expected population. One of the identified actions related to the implementation and scaling of SLM is the availability of continued funding [2]; hence, payment to compensate farmers for their SLM investments is an essential constituent for such practice [3]. This would ensure an improved livelihood and alleviate poverty for the farmers alike [4]. A range of instruments, soft approaches and direct regulations often drive conservation and related ecosystem understanding. One soft approach, the use of payment for ecosystems services (PES), has been in practice and under debate for more than 30 years [5]. It consists of a wide range of mechanisms aimed at improving water quality and quantity—upstream users get payments from downstream water users to change their land use systems [6,7]. Hence, PES schemes—with a focus of watershed services and biodiversity conservation —are now emerging as a viable tool and instrument in shifting sustainable agriculture in a reward-oriented fashion in which farmers are encouraged to effectively manage their land [8], having a positive impact on their livelihood [1]. PES schemes are now serving as a financing mechanism for several conservation programs in Australia, Asia, Latin America, and Europe [8]. Public watershed payment schemes currently represent by far the largest market for watershed services—well established in the United States, Mexico, Costa Rica, and China—in which private sector entities have limited involvement due to lack of financial return and incentive [9]. Hydropower producers in Costa Rica make substantial voluntary contributions to the national PES scheme, which pays landowners for forest conservation and other measures that substantially contribute to reducing risk of increased siltation from dams [10]. However, despite the potential of agro-ecosystems to restore or provide valuable ecosystem services, many of the PES programs in developing countries are implemented in forest-related ecosystems, rather than in agro-ecosystems [1]. Some watershed service enhancements are increasingly directed toward climate change mitigation—as implemented in Kenya, Tanzania, Uganda, and Guinea—focusing mainly on climatic variability and facilitation [9].
In Ethiopia, 85% of land is estimated to be moderately to severely degraded by soil erosion. National estimates of gross annual soil loss are 1.9 billion ton, with approximately 80% originating from cropland, costing about US$ 4.3 billion annually [11]. This severely threatens agricultural production and its sustainability [12,13,14]. To reduce the problem, various nationwide soil and water conservation (SWC) initiatives have been undertaken, in particular since the 1980s, with support from multiple donors [15]. These initiatives include the Food-for-Work scheme (1973–2002), managing environmental resources to enable transition to more sustainable livelihoods programs (2003–2015), productive safety net plans (2005–present), community mobilization initiatives via free-labor days (1998–present), and the National Sustainable Land Management Project (2008–2018). Several studies have verified these investments as having a positive effect on agricultural production [16,17,18].
Conversely, the adoption rate of SLM practices is low [19,20]; nonetheless, recent studies reveal sustainability of watershed interventions is under question [21,22]. Several factors point toward low adoption and adaptation rates, including: (1) poor extension service arrangements, (2) blanket promotion of technology to distinctly diverse environments, (3) top-down approach to technology promotion, (4) late delivery and input prices, (5) low return on investment, (6) lack of access to seasonal credit and production, and (7) consumption risks [23,24,25]. As such, SLM should focalized on increasing land productivity with long-term associated economic return [26]. Consequently, in the short run, farmers face temporary negative economic earnings unless adequate support from the financial establishment is shown, as well as the opportunity costs of adopting such measures when properly implemented [26,27]. Payments for environmental services with support from rural communities via the adoption of SLM thus seems to be a promising approach [9,26,28]. Designing subsidy and payment mechanisms through PES programs could sustain SLM investments [2] and, in turn, provide a continuous flow of needed funding. Several case-specific studies have been completed. Alemayehu et al. [29] assessed upstream and downstream farmer’s willingness to pay (WTP) for an integrated watershed management intervention examining two watersheds in northeast Ethiopia using the contingent valuation method (CVM). Mezgebo et al. [30] assessed urban freshwater users’ perception of watershed degradation and their WTP for upland degraded watershed management. Tesfaye et al. [31] modeled the preferences and WTP of downstream farmers in Sudan, one of the largest irrigation schemes worldwide, for improved irrigation water supply through trans boundary collaboration with farmers upstream in Ethiopia. The importance of payment for watershed services (PWS) could be paramount, while little has been done so far in light of tapping PES in Ethiopia, even compared with other countries in Africa [12,31].
Several studies have assessed households’ WTP for improved urban water service throughout Ethiopia [30,32,33,34,35,36]; these studies, however, were limited in scope and generated location-specific conclusions that did not generate national comprehensive PWS information. Unlike previous studies, the novelty of this study explores the possibility of PWS as an economic tool in supporting and promoting sustainable watershed management in collaboration with SLM. We established the WTP of electricity users (i.e., (1) households and (2) organizations and industries) at the national level for watershed management development. The general objective is to better understand the sensitivity of residents for the presumed funding generated for the watershed services and to assess the awareness level of residents about land degradation and their WTP for investment through their electricity bill. Specifically, the investigation examines the perception of urban dwellers on the extent of land degradation and their WTP for investment toward sustainable watershed management. The rest of the paper is structured as follows: 
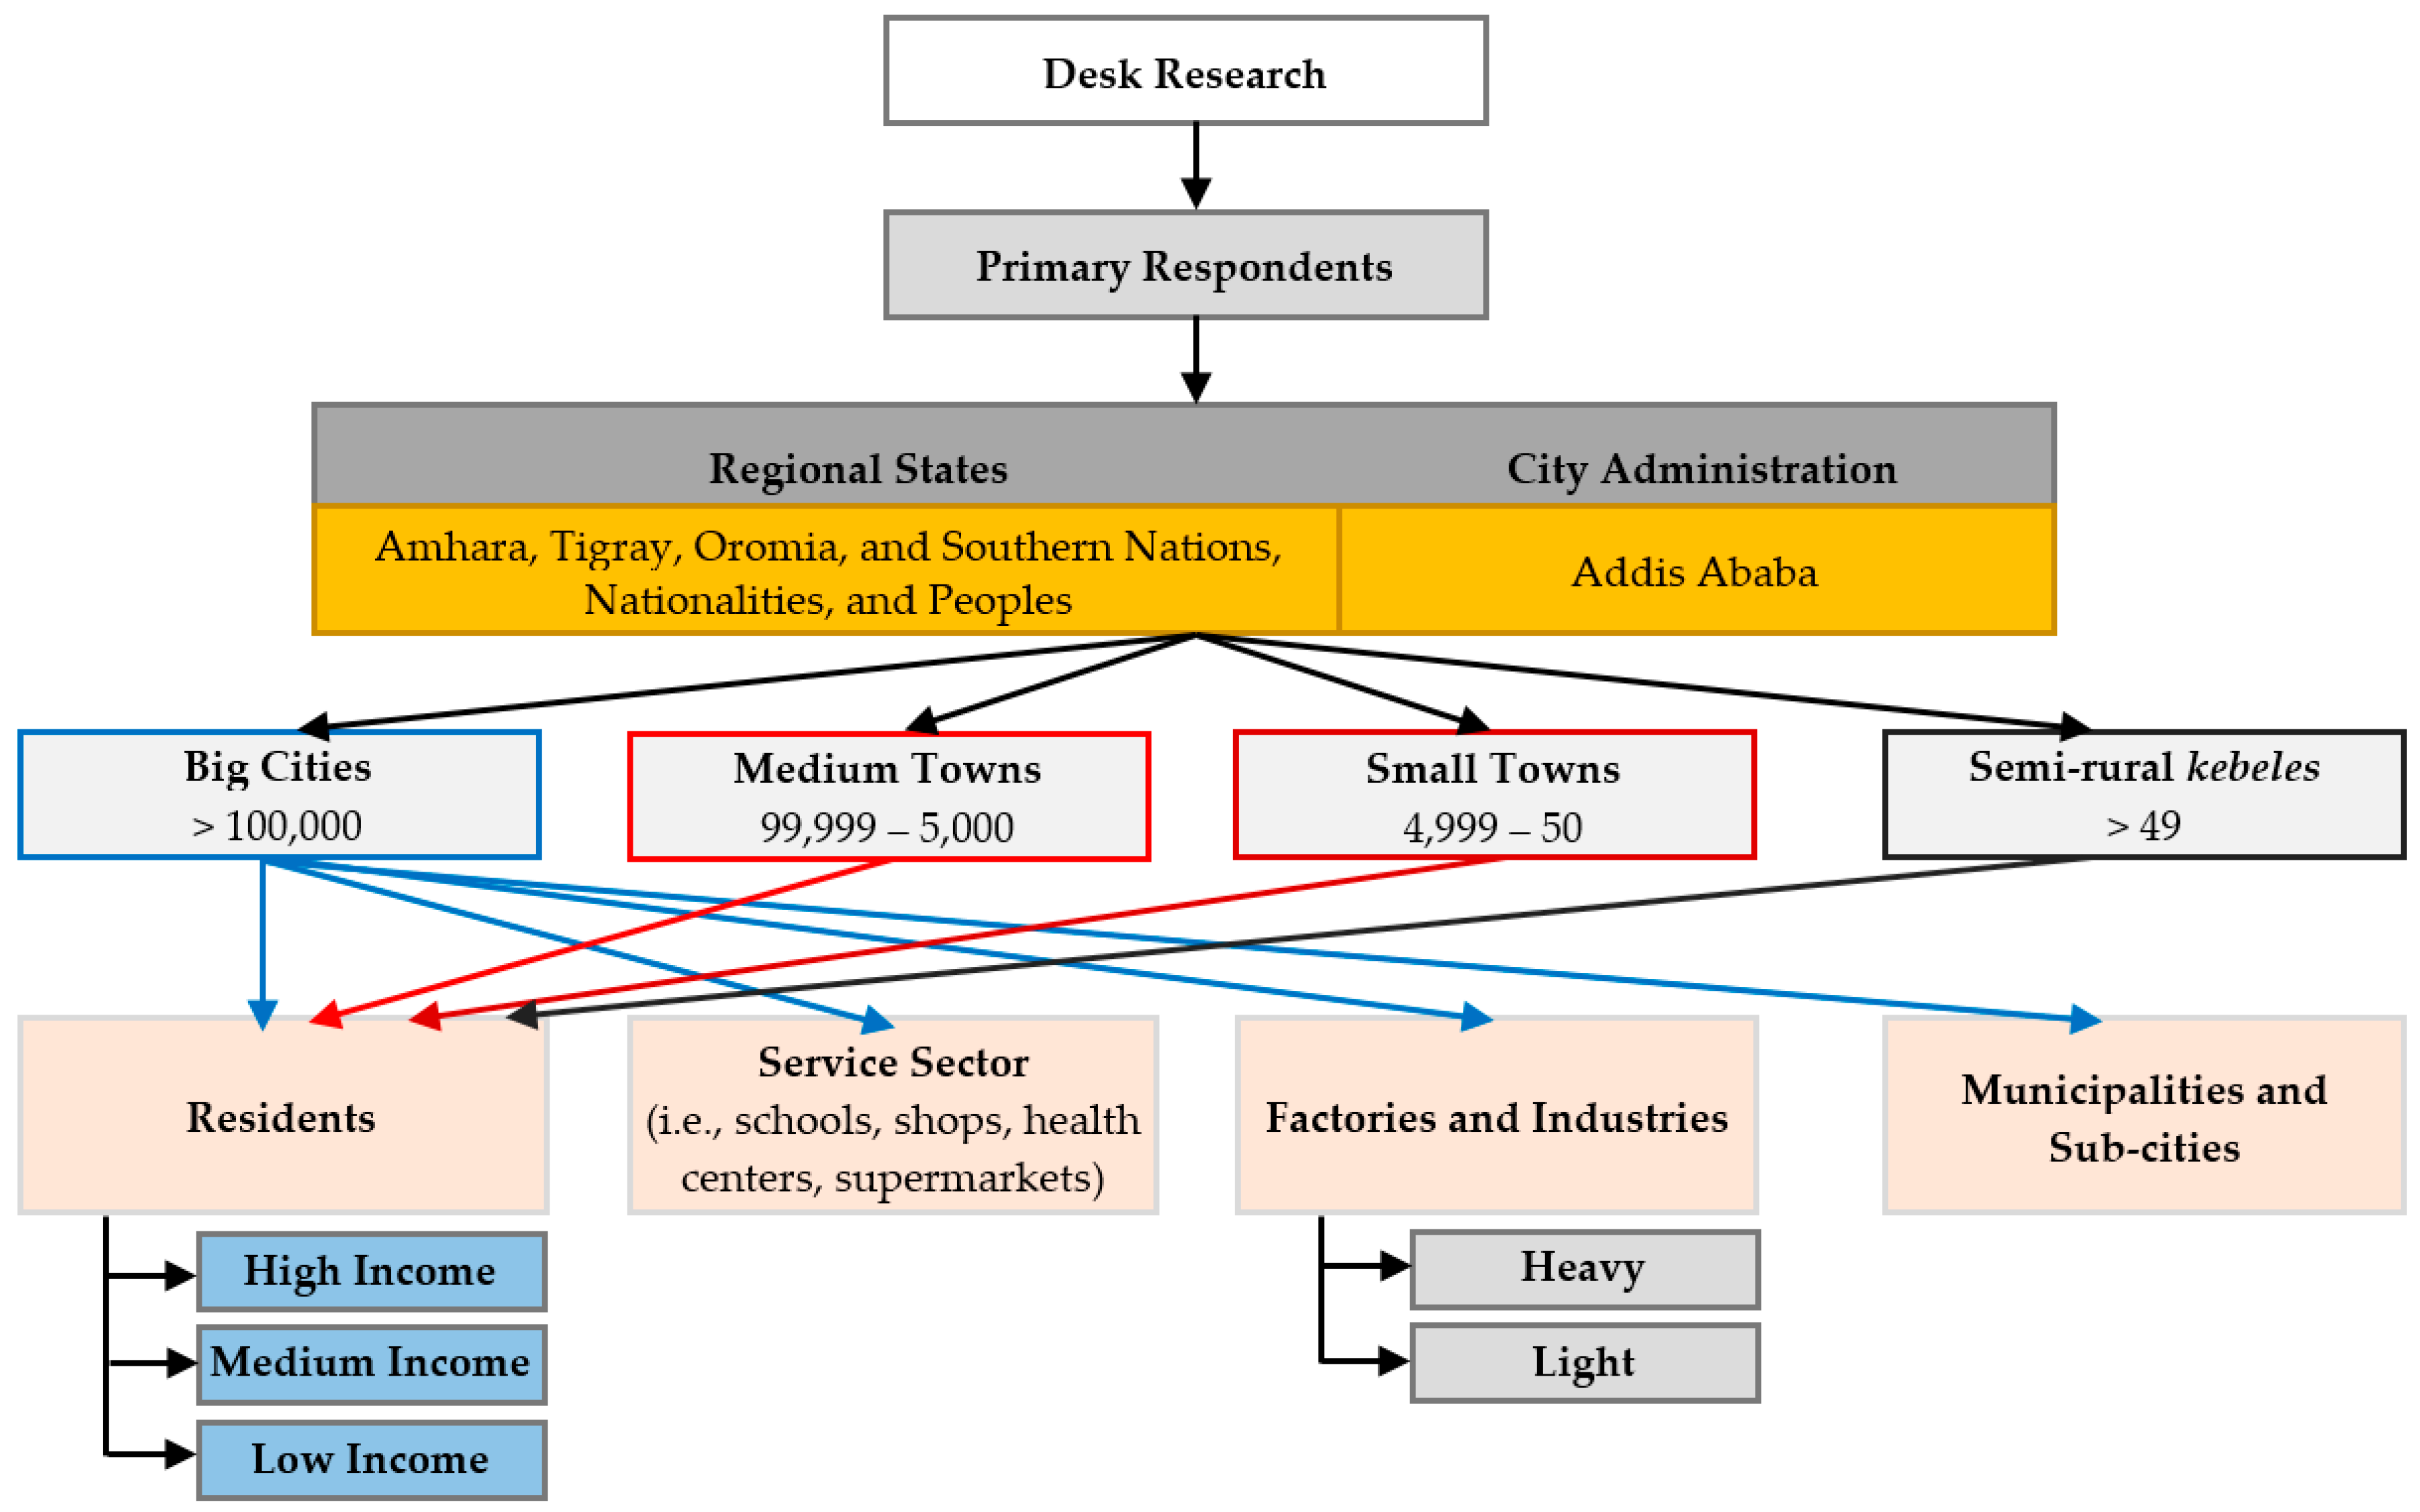
Section 2 contains materials and methods, Section 3 incorporates both the results and discussion, and Section 4 the conclusion.

2. Materials and Methods

2.1. Theoretical Framework: WTP Using CVM

The use of CVM, a direct approach, involves asking a sample of the relevant population questions about their WTP. It is called ‘contingent valuation’ due to the fact the assessment is conditional on the hypothetical scenario of respondents [37]; CVM has two advantages over indirect methods. First, it can deal with both use and non-use values, whereas the indirect methods cover only the former, and involves weak complementarity assumptions. Second, unlike the indirect methods, CVM answers the WTP question by directly applying the correct monetary measures for the utility charge [37]. CVM research has been used in several different elicitation methods, including two prominent ones: (1) open-ended format in which the respondent is asked to provide the interviewer with a point estimate of their WTP, and (2) bidding game in which the interviewer begins by asking respondents whether they accept a given price for the utility and higher or lower prices will be offered depending on initial offers. CVM research has been shown to suffer from compatibility problems in which respondents can influence potential outcome by revealing values other than their true WTP. As an alternative, the dichotomous choice approach has become quite widely adopted, despite criticisms and doubts, in part because it appears to have an incentive-oriented level of compatibility—in theory. When respondents do not give a direct estimate of their WTP, they diminished their ability to influence an aggregate outcome. Nonetheless, this advantage of compatibility has a limitation in which estimates of the WTP are not revealed to the respondents at large [38].
Four key WTP studies in Ethiopia have been found to be relevant. First, Tessema and Holden [39] assessed farmers’ WTP for soil conservation practices in southern Ethiopia. Contingent valuation results indicate that about 96% of respondents were willing to contribute labor to conserve soil in their farms. When the payment is in cash, about 84% were willing to pay. Household random effect model was used to empirically investigate the determinants of the farm households’ WTP or contribute for soil conservation. The empirical result shows that WTP is affected by perception of erosion, poverty (i.e., in terms of resource endowment and cash), and plot characteristics. The study also noted that the farm households were able to contribute more in terms of labor than money due to severe cash privation. Second, CVM was conducted by Gebremariam et al. [40] in order to investigate the associated value farmers have with soil conservation practices and the determinants of WTP for it in northern Ethiopia. The result of this study shows that age, sex, education level, family size, perception, tenure, total livestock, and initial bid were the important variables in 22 determining of WTP for soil conservation practices. The study also indicated that the mean WTP estimated by way of double-bounded dichotomous choice format was computed at 56.65 person days per household. Third, Wagayehu and Drake [41] conducted research on adoption of SWC assessment of households in Hunde-Lafto, eastern Ethiopia. Accordingly, adoption of such conservation measures on farm plots were analyzed using multinomial logistic regression. The results suggest the need for designing and implementing appropriate policies and programs that influence farmers’ behavior toward the introduction of SWC measures in their agricultural practices. Fourth, Ebrahim [42] employed CVM to assess farmers’ WTP for rehabilitation of degraded natural resources in watershed projects in Dejen Woreda within the Amhara Region. The bivariate probit model was applied for the estimation of parameters. The study claimed that age, fertilizer expenditure, education, and land per capita are the main factors that determine the farmers’ demand for rehabilitation of degraded natural resources [43].

2.2. Computation Framework

A hypothetical market was created where respondents were asked the question—how much would you be willing to pay to support watershed management activities? Multiple linear regression model was used to determine the existence of correlation between socioeconomic factors and WTP for watershed management activities. Logistic regression analysis was run to assess the influence of independent variables on dependent ones. The model applied in this study was adopted using Equation (1) from the study of Mitchell and Richard [44], in which WTPÞ is a dependent variable.
WTPÞ = β1 X + β2 B + ε + α
where: Þ is either Y for yes or N for no; β1 are coefficients of X; X is a vector of variables; β2 is the coefficient of the bid; B is the bid price; ε is an error term; α is the mean WTP derived from Equation (2).
α   =   ( ( ( β 1 × X a ) β 2 ) 1
where: β1 are coefficients of X; Xa is the mean value of X; β2 is the coefficient of the bid.

2.3. Research Design, Sampling Techniques and Data Collection Methods

Cross-sectional research was designed to collect the necessary data for the WTP survey. The data used for this study is based on a WTP survey in Ethiopia conducted by the Water and Land Resource Center [45]. The sampling frame covers four of the nine regional states of Ethiopia, in which the selected regions constitute more than 86% coverage in 2014 [46]. They were: Amhara, Tigray, Oromia, and Southern Nations, Nationalities, and Peoples (Figure 1). A total of 501 urban and rural households and 100 organizations were interviewed over a five-year period from 2014 to 2019. We used a multistage sampling technique that first selected cities, towns, and villages based on the following conditions:
  • to cover the largest portion of the country (i.e., at least major cities and regions of the four surveyed states)
  • to cover cities and towns all classed by size and population (i.e., big cities with population size >100,000; medium cities and towns with population size between 99,999 and 5000; and small towns and villages between 4999 and 50)
  • current and future prospects of electric utilization
Based on these conditions, we selected Debre Birhan, Mekelle, Bahir Dar, Hawassa, Adama, and Akaki-Kaliti sub city of Addis Ababa as big cities, while Maychew, Bure, Dukem, Ziway, and Wolkite were from medium and smaller towns and one semi-rural kebele (i.e., the smallest government administrative element in which they are organized via district) from each region. Data collection methods used criteria-based upon a five-point plan, as follows:
  • Within the selected cities and towns, we stratified and selected sample respondents from low-income groups (i.e., by visiting a living quarter dominantly occupied by daily labor and informal sector), medium and upper income categories (i.e., by visiting living quarters dominantly occupied by government employees and business people). The middle class was also accessed by visiting governmental institutions and key informant discussions. The income categories were defined based on the study of poverty, income, and labor market conducted from 1995-1997 using nationwide panel data in larger urban centers based on the Oxford Poverty and Human Development Initiative [47].
  • A brief structured questionnaire was used for the interview.
  • Industries were stratified based on low and high voltage users. Moreover, type of product produced and market are considered (i.e., domestic and foreign) and one is selected from each cluster.
  • Commercial services were interviewed, including: hotels (i.e., low, medium and high star-level hotels), schools, health centers, shops, and supermarkets.
  • Municipalities of each city and town were interviewed.
It should be noted that we did not follow probability sampling, simply due to the absence of a complete registry in almost all of the sample frame identified; in fact, all attempts were made to reduce the bias on household sample selection by trained and experienced enumerators. The enumerators were trained and supervised by Water and Land Resource Center (WLRC) researchers. The data from the sampled industries and municipalities were conducted in two stages. First, WLRC researchers conducted detailed discussions with managers and heads of the selected industries and municipalities. Second, respondents completed a questionnaire specifically tailored for them. A methodological flowchart is illustrated as Figure 2 to elucidate the study’s design phases.

2.3.1. Data Analysis Technique

Descriptive statistics such as mean, standard deviation, percentages, and cross tabulations (i.e., chi-square test and t-test) were used in analyzing the data. Moreover, econometric estimations were employed using STATA 13.1 (College Station, TX, USA). The details are discussed in the computation framework and in the next sub-sections.

2.3.2. Questionnaire Design

Precedence of questionnaire design for this study was to gather primary information such as socio-demographic profiles, awareness, and respondents’ WTP for watershed conservation. The questionnaire was divided into six sections: (1) warming up questions, (2) questions upon current watershed management, (3) awareness towards watershed conservation, (4) respondents’ perceptions, (5) WTP and debriefing questions, and (6) socioeconomic and organizational profile. The first section solicited knowledge about environmental problems for initiating contact with the respondents. The second section respondents were required to give their view regarding current watershed service and related problems. The third and fourth sections included questions about level of environmental awareness and the respondents’ perception toward watershed conservation. The fifth section of the questionnaire was mainly comprised of a hypothetical scenario, followed by WTP and debriefing questions. The scenario elucidated problems encountered due to land degradation which can aggravate hydroelectric dams, thereby their sustainability, electric generation, and livelihood in general. Thus, pointing toward the notion of implementing a conservation program, if necessary. The conservation program included watershed-based reforestation and development of watershed tributaries. Following the scenario, the respondents were provided with a dichotomous choice experiment in which offered bidding was proposed, incrementally, into a monthly electrical bill.

2.3.3. Measurement of Variables and Hypotheses

The dependent variable in the WTP estimation was beneficiary households and industries WTP to support upland SWC practices for the purpose of protecting hydroelectric dams from siltation and sedimentation—thereby generating reliable and sustainable electricity. The variable is dichotomous; it is equal to 1 if the ith household is willing to pay money to support SWC in the upstream, and 0 otherwise. In this dichotomous CVM study, the response of households for the hypothetical scenario is the fundamental basis and key research questions. Given the supply of reliable and uninterrupted electricity, it is evident that the dependent variable will generate demand (i.e., the probability of households’ and industries WTP across different bids). This data was then provided to decision makers on whether the funding raised from downstream, and other users, could support the sustainability of the hydroelectric dams under review. Moreover, the dependent variable indicates how sensitive, for various reasons, which variable is policy relevant considering the cost of implementation and probability of WTP for SWC activities in the reduction of siltation in hydroelectric dammed areas.
It is assumed that the beneficiary household’s desire to maximize its expected utility or profit (i.e., subject to various relevant constraints) determines its decision to vote in favor of the proposed bid price. One consideration is whether the variables that influence WTP are policy-relevant, that is, whether WTP can be influenced by various interventions. Another issue is whether the WTP by watershed service downstream users provides sufficient resources to compensate upstream service providers. Thus, the following eight potential explanatory variables, which are hypothesized to influence households’ WTP to support upland SWC practices, were selected based on the findings of past studies and existing theoretical explanations.
Important variables and potential influence on the WTP for watershed management through monthly electrical billing was conducting via a stepladder process (i.e., starting with the poorest and moving up the strata-chain of wealth). A proposed bid value started with the first possible lowest payment that a low-income household could pay without placing an overwhelming burden on that household; then, increasing upwards based upon the presumed capacity of the households’ base-income, assigned prices were put forward for electric beneficiaries’ (i.e., households and industries) WTP amount. Prices were first determined from previous preliminary investigation—conducted by WLRC researchers and the authors. Accordingly, we used four and five alternative WTP bid values that could be added to their month electrical bill for household and industries, respectively. The incremental price increases in Ethiopian Birr were 2 cents, 5 cents, 8 cents and 10 cents for households per month and 5 cents, 10 cents, 15 cents, 20 cents and 50 cents per kWH for industries and organizations per month (note: 1 Ethiopian Birr = US$ 0.035). Description of the variables and the hypothesis of the WTP influence is presented in Table 1.

3. Results and Discussion.

3.1. Characteristic of the Respondent Households and Organizations

Demographic characteristics of the household such as sex, age, educational status, and marital status of the household head provided an insight into the socioeconomic characteristics of the household. Out of the total sample households interviewed survey-wide, 83.4% were male-headed households compared to 16.4% female. Moreover, households had an average family size of four persons, with the largest family size being 12 persons and the smallest one. With regard to the household age, the average age of the sample household head was 38.6 years old. In terms of marital status, 74.3% of the household heads in the sample were married. Single household heads constituted 19.1%, while 5.7% and 0.9% of the household heads in the sample were divorced and widowed, respectively. With regard to education of the household heads, out of the total sample 52.2% and 15.9% had a university degree and diploma respectively, while 10.5% had attended only primary school and could read and write; finally, 6.7% attended secondary school, 5.1% had reached 11–12 and 2.9% were illiterate.
In the sampled service providing sectors (i.e., schools, hotels, clinics, supermarkets, boutiques, etc.), the number of employees on average was 18.8 person with a maximum of about 156. In the industry sector, the number of employees on average reached 224.4 person with a maximum of 2400 —particularly in the case of the textile sector. Accordingly, the majority of household heads were engaged in government work (69.1%), private business (22.6%), agriculture (7.9%), and other forms of work (0.4%). The households diversified their income sources by farm-oriented and non-agricultural income-generating activities. The non-agricultural sources were mostly government work and private business. The survey results indicated that about 19.5% of the households reportedly earned an annual income of 4000–3001 Ethiopian Birr (US$ 140–105), 15.7% earned an annual income of 3000–1000 Ethiopian Birr (US$ 104–35) and 5.8% of the households received an annual income of 999–501 Ethiopian Birr (US$ 34–18).
The lack of access to modern energy services that are clean, efficient, and environmentally sustainable is a critical limitation on economic growth and sustainable development. Recognizing the critical role played by the energy sector in the economic growth and development process, the Government of Ethiopia (GoE) has embarked on large-scale hydro-electrical projects, with a view to developing renewable and sustainable energy sources. It is currently injecting a huge amount of money into energy infrastructure (i.e., electricity generation from hydro and from other renewable energy sources such as wind, solar, and geothermal). The total hydropower generation capacity country-wide increased from 714 MW in 2004–2005 to 2000 MW in 2009–2010 [45] and up to approximately 3500 MW in 2018 [48]. It is expected to increase to 10,000 MW when the Grand Ethiopian Renascence Dam (GERD) is completed and further planned to increase it to 17,000 MW at the end of GTP II by 2021. Accordingly, electricity service coverage has increased from 41% in 2009–2010 to 56% in 2016. Currently, the per capita consumption of electricity in Ethiopia remains relatively low at about 200 kWh per year. The national energy balance is dominated by a heavy reliance on traditional biomass energy sources such as wood fuels, crop residues, and animal dung.
The survey results indicated that 28.8% of the households have electricity use of between 101 and 200 kWh per month. Only 16.3% of the households used electricity greater than 501 kWh per month. This result shows that the electricity consumption of households is rated as low. Moreover, the average household electric consumption was 311.7 kWh per month. For the sampled organizations it was found that 58.3% in the service sector use low-voltage versus 37.5% who use low- and high-voltage electricity. Only 4.2% use high-voltage electricity. Moreover, about 40% of industries use high-voltage electricity, 31.1% low-voltage and 28.9% use both high- and low-voltage electricity (Table 2).
Moreover, the survey results indicate that average monthly payments for electricity consumption for heavy and medium industries was about 260,000 Ethiopian Birr (US$ 9100) and 74,000 Ethiopian Birr (US$ 2600), respectively (Table 3).

3.2. Perception of Land Degradation

Ethiopia is one of the Sub-Saharan African countries, where deforestation, degradation of the soil, and failure of both ground and surface water largely hinder socioeconomic development. The country is indeed confronted with the dilemma of producing enough food for its rapidly growing population on the one hand, and protecting its natural environment and resources on the other. Maintaining a sustainable balance between these two has been a major challenge [49]. Natural resources are particularly affected by slow progress in economic development [50]. In 2015, Ethiopia’s urban population was about 19.4% [46], which is one of the lowest in the world and well below the Sub-Saharan African average of 37%; however, this is set to change dramatically. According to official figures from the GoE and Ethiopian Central Statistics Agency, the urban population is projected to nearly triple from 15.2 million in 2012 to 42.3 million in 2037, growing at 3.8% a year. Analysis for this report indicates that the rate of urbanization will be even faster, at about 5.4% per year [46]. That would mean a tripling of the urban population even earlier—by 2034, with 30% of the country’s population living in urban areas by 2028.
Hence, peri-urban ecosystems are increasingly at risk of degradation and loss such as natural resource consumption, while waste in urban areas will increase due to rapid urbanization and increasing human activity. Population growth and population influx, property ownership issues, lack of control, enforcement measures, and jurisdictional overlap—which are due to lack of authority and the use of inappropriate technology for farming and even for producing manufactured goods—are some of the causes that aggravate land degradation problems. Hence, the basic problem will need to be asked. How will local communities, particularly urban residents, perceive and cope with land degradation? As a major theme of this study, results indicate that almost of all the respondent households perceived the existence of land degradation as a vital issue, with a whopping 91% ranking it as extremely worrying. Similarly, about 96% and 4.3% of organizations and industries perceived it to be extremely worrying and worrying, respectively. As a result, responsibility and due process in helping to reduce the problem were assessed. We found that about 98% of organizations and industries and 94% households responded that all citizens have a responsibility to reduce land degradation. While about 2% organizations and industries and 5% of households claimed the government had to bear the responsibility. Specifically, organizations were asked two additional questions dividing responses between service and industry sectors. It was found that 97.9% of the service sector and 93.3% of the industry sector reported that land degradation is extremely worrying. Moreover, when asked whom bear responsibility, the majority agreed that all citizens were responsible for reducing the land degradation problem (Table 4).
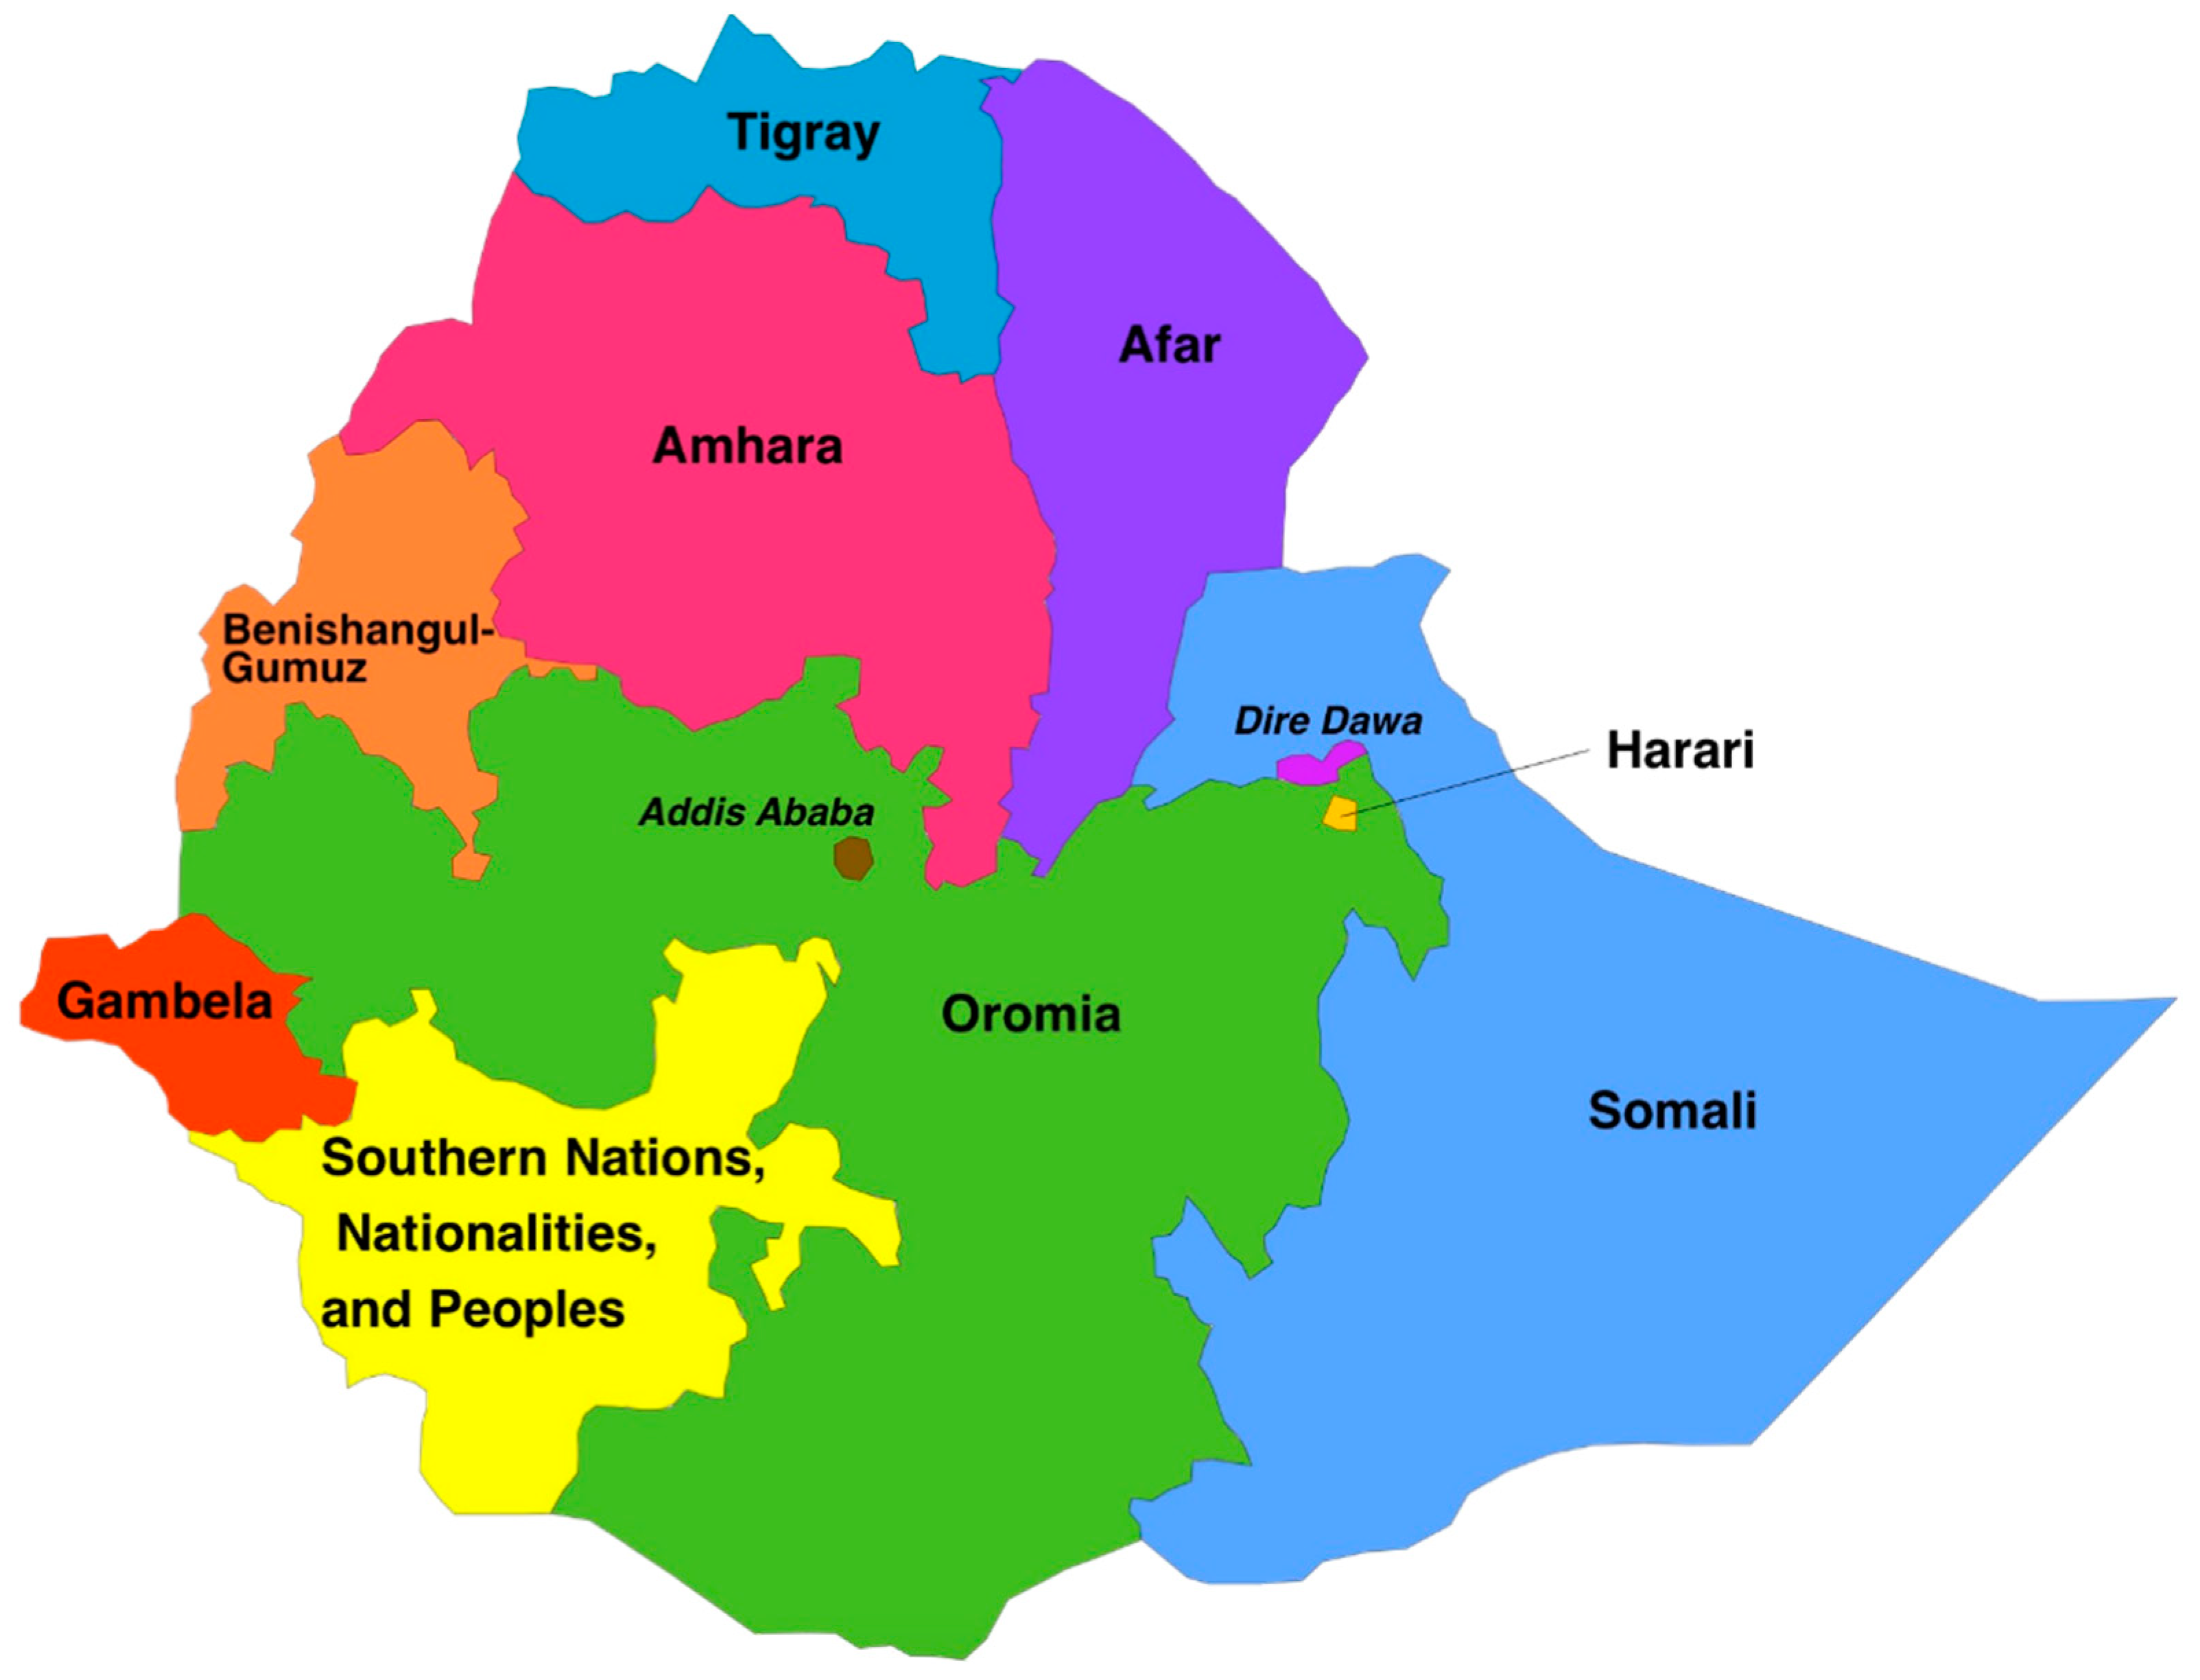
Regionally, organizations were also asked how much land degradation was worrying. The response of the analysis indicated that more than 90% agreed that land degradation problem was extremely worrying. Moreover, the respondents from the four regions agreed that all citizens had a responsibility to reduce land degradation. Similarly, we found that 91% and 87% of the male and female respondents agreed that the current extent of land degradation was very worrying. This indicates the awareness level, regarding land degradation, as almost identical among all levels and scales, survey-wide. As a result, perception on land degradation shows a willingness to, to some degree, hold citizenry responsible, interlinking awareness, education, and know-how to a connection with one’s surroundings. Hence, from a citizenry perspective, custodial responsibility is clearly evident, indicating a positive sign for the GoE to implement and enhance nationally-related programs geared toward better the nation’s land from a care-taker (i.e., grassroots) level.

3.3. WTP for Watershed Management

The emergence of PES as an ecosystem services conservation mechanism indicates a paradigm shift from the former predominant use of command-and-control mechanisms and conventional approaches to a more flexible and efficient ecosystem protection [6,51]. Unlike other conventional approaches to conservation, PES is a direct approach whereby service providers receive payments that are conditional on acceptable conservation performance. Under PES, payment should entail a voluntary transaction between at least one provider and one user for a well-defined environmental service. Thus, conditionality is the characteristic that most distinguishes PES from previous approaches. Findings of this indicated that about 19.7% and 13.9% of households are willing to contribute labor and money respectively for watershed development. While about 65% of the respondents claimed their willingness to contribute both labor and money. Similarly, Mezgebo et al. [30] found 82% willingness by sampling freshwater users in Dire Dawa city administration. Possible variation is due to the scope and target population of the study. On the other hand, about 50% and 38% of the organizations and industries were willing to contribute both money and labor, respectively. Mode of payment also influenced WTP for watershed management, as environmental services were dependent on how respondents perceived the proposed mode of payment. In this, we determined to hypothetically add certain amounts of money to monthly electrical billing. Findings indicated that about 84% of the households stated a WTP or willingness to contribute a certain amount of resources for watershed development activities through their monthly electricity bill with different bids. Similarly, about 90% of organizations affirmed a WTP with different bid amounts (Table 5).
Why respondents do not have a WTP is another important argument. It was found that about 16% and 10% of households and organizations, respectively, refused to offer any payments in addition to what they were currently paying via their electrical bill. About 41% of households claimed that they did not have the capacity to pay for watershed management, while 34% of households and 38% of organizations and industries believed that it was the responsibility of the GoE to support watershed management activities. Some households (i.e., 20%) and organizations and industries (i.e., 63%) did not believe siltation problems of dams and land degradation issues could be solved by paying a contribution of money (Table 6).
Our results indicate that about 51% and 25% of the households were willing to pay 2 and 5 Ethiopian Birr, while 2% and 22% of the households claimed their WTP higher amounts—8 and 10 Ethiopian Birr, respectively. Similarly, about 41% and 37% of the organizations and industries stated a WTP an additional 5 and 10 Ethiopian Birr per kWh, while 8% and 14% were willing to contribute relatively higher amounts 15 and 20 Ethiopian Birr, respectively. Moreover, our gender disaggregated analysis shows that about 49% and 59% of the male- and female-headed households had a WTP 2 Ethiopian Birr per month (Table 7).
Our analysis revealed that the proposed payments significantly varied across electric use categories (i.e., p = 0.01). From the results, about 26% of households used 101–200 kWh per month with a large portion of them (i.e., 40%) with a WTP 8 Ethiopian Birr. Households in the 201–300 kWh per month category accounted for a 15% hike in their monthly bill with a WTP 5 Ethiopian Birr extra. Likewise, Mezgebo et al. [30] identified the base rate of charging a fee relative to volume of water used, income, number of members in the household and fixed rate. Their results indicate about 9% of the respondents selected fixed rate while about 14% selected no fee be changed.
Similar to households, most of the organizations also perceived that problem and extent of land degradation and were willing to add a certain amount to their electrical bill for conservation practices. The majority of the organizations’ WTP opted for the 0.05 Ethiopian Birr per kWh monthly (i.e., about 38%), while the second largest amount was 10 Ethiopian Birr (i.e., about 33.3%) (Table 8). Related research by Mezgebo et al. [30] found freshwater users were asked about the mechanism of fund collection for upland degraded watershed management; accordingly, 26% of respondents preferred a trust fund mechanism, while 45%, 16%, and 13% specified water bills, income tax, and no mechanism of collection, respectively. These comparative results indicate a WTP for watershed management services as similar to the citizenry findings on perception on land degradation. Knowledge among the citizenry of a viable watershed management scheme suggests an underlying knowledge-base at the community and business level. These characteristics, reflective within both urban and rural areas, indicate water supply service and demand are extremely important. Complementary to this point, WTP for such service implies professionalism, optimum care and trustworthiness from the citizen perspective [30,32,36]. Since a reliable water supply is essential to basic need and livelihood it becomes evident watershed management is crucial, if not, imperative to Ethiopia’s future development and practice.

3.4. Model Estimation of the Mean WTP

Logistic modeling, utilized to determine the probability of WTP, was applied in Table 9, Table 10 and Table 11. Type of employment of the household head significantly influenced the WTP at 0.05 significance level (Table 9). Respondents who had better employment were more willing to contribute for watershed management. Moreover, the amount of monthly electrical expense influenced WTP significantly and positively. Qualitative discussions indicate a correlative finding between power interruption concerns and a WTP to support such a concern. Additional media-oriented campaigns to participate in GoE initiatives in watershed management activities could also play a large part in seedlings mass mobilization and awareness. Engagement in private business; however, negatively affected WTP with possible reasons relating to government corruption, lack of awareness creation for township development, and lack of natural resource utilization-knowledge.
The mean WTP modeling results illustrate that households agreed to pay about a 2 Ethiopian Birr increment for their monthly electrical bill, while the service sector (Table 10) and industry sector (Table 11) agreed to pay 3.30 and 6.10 cents Ethiopian Birr per kWh, respectively. On an annual basis, the total benefit paid by the communities estimated at basin per country level is estimated to be 1.80 Ethiopian Birr per month. The increment in monthly electric expense offers adequate funds for watershed conservation. This amount of additional money would assist in covering watershed management, reforestation, and patrolling activities to ensure the reduction of destructive and degradative activities within these areas. However, to design PWS schemes, supplementary studies should be done with regards to willingness to accept if farmers in upper streams, as well as institutional organizations being able to come together and coherently administer sustainably oriented practice. Positive findings from the model estimation imply watershed-wide support could adequately kick-start a community scheme, similar to Ethiopia’s Community Conservation Areas (CCAs) program [19,21], where CCA management committees could cohesively voice local stewardship, community participation, and action planning on how fund allocation is directed—demarcating the development of local bylaws and enforcement from the grassroots. Community mobilization is a critical first step in ensuring communities have a strong voice in advancing their common vision. As such, watershed conservation parallels the GoE’s initiative of doubling agricultural productivity by way of improved natural resource and agricultural land management [11,16]. Using the mean WTP findings, as a projection for local community action, it is palpable to envision an optimistic Ethiopian system of management.
To highlight a key limitation to most WTP studies, one must consider geographical location as imperative of where and with whom WTP is being asked for. Since, WTP is a somewhat of a social construct interlinked with economic and environmental need, the limitation of such a study in Ethiopia restricts the user to a grassroots level of governance. As such, national-level corruption and malpractice is considerably high, although less high than in comparable regional countries. Ethiopia’s anti-corruption laws are primarily made-up from the Revised Federal Ethics and Anti-corruption Commission Establishment Proclamation and the Revised Anti-Corruption Law, which outlaw all major forms of corruption. These important legislative frameworks, however, are infrequently enforced. As such, local governance of WTP fund allocation would need to be appropriately managed as well as sustained. High risk within Ethiopia’s land administration would need to be taken into account and conflicts between international investors and local communities over land rights diligently looked at. Moreover, agreed WTP via electric billing would need to be regularly monitored and any additional fees for watershed services best kept within a CCA-level entity. As no other research has targeted electric users, as conducted in this study, we consider this an important first step in better understanding whether such a scheme’s viability—fully implemented—would contribute to Ethiopia’s SWC management.

4. Conclusions

As a highly promising conservation approach, PWS can benefit both users and upstream communities through improved SWC activities, yet several factors influence service recipients’ WTP for watershed services. In this study, about 84% of households and 90% of organizations and industries showed their WTP additional fees on their monthly electrical bill for watershed management with intention of reduced siltation. Findings indicate type of employment significantly determined WTP. In terms of organizations and industries, an encouraging learning curve was observed when previous participation in environmental-friendly programs existed (e.g., tree planting in their greenery areas and nearby mountains). It is also apparent that such involvement in eco-active plays a willingness to adopt such practices as part of its corporate social responsibility. Still, it is evident, throughout Ethiopia, that a knowledge and awareness gap originates from a lack of sustainable watershed management in its cities and towns at both a household and organization and industries level. Nationwide intervention would be necessary to improve awareness and narrow such a gap accordingly. Our model estimation verifies the WTP would be a useful approach to developing a healthier watershed management program. In some industrial factories, we observed material and product damage due to power fluctuation. As a result, almost all factories have primary and backup generators. These additional costs for gasoline-powered generators also ensured a positive WTP, with example sectors including food and beverage and plastics development where any power interruption or fluctuation can severely affect goods and service. Ethiopia’s manufacturing and development, from urban to rural life, relies on crucial growth and reliability of electric power. The basis of our research is to assist, indirectly, with local industries and engage in different sectors living downstream ensuring a reliable provision of electric supply without power shortage or power interruption. Directly, we are confident it will help local communities living upstream, especially farmers, successfully integrate watershed management initiatives by reducing the in situ impact of land degradation. Accordingly, for this to occur, improved evidence is needed with regard to WTP and research into ability to pay for communities and business contributions for sustainable watershed development. Throughout Ethiopia, this research has paramount importance in furthering the effort and aim of developing sound, sustainable management of natural resources and conservation practices throughout its numerous watersheds. The GoE should place emphasis on avoiding any furthering of the problem. With the introduction of awareness-oriented education, conservation, and the development of a WTP for watershed management our research elucidates that initial advancements would help economically secure Ethiopia’s power concerns, as well as develop a culture of safeguarding its natural resources nationwide and beyond. Moreover, in the country there is a strong need for further research to complement the designing of effective PES schemes focused on agro-ecosystems. Future research should focus more on the assessment and application of the willingness to accept farmers and institutional issues that supplement the setting up of PWS in the country in a sustainable manner.

Author Contributions

Conceptualization, Methodology, Software, Validation, Formal analysis and Writing—Original Draft preparation, S.T.A.; Investigation, Resources, Writing—Review and Editing, S.T.A, V.G.Z., G.Z.E. and G.T.C.; Data curation, A.B.D.; Visualization and Supervision, A.B.D. and G.Z.E.; Project administration and Funding acquisition, G.T.C.

Funding

This research received no external funding.

Conflicts of Interest

The authors declare no conflict of interest.

References

  1. Kwayu, E.J.; Paavola, J.; Sallu, S.M. The livelihood impacts of the Equitable Payments for Watershed Services (EPWS) Program in Morogoro, Tanzania. Environ. Dev. Econ. 2017, 22, 328–349. [Google Scholar] [CrossRef]
  2. Thomas, R.; Reed, M.; Clifton, K.; Appadurai, N.; Mills, A.; Zucca, C.; Kodsi, E.; Sircely, J.; Haddad, F.; Hagen, C.; et al. A framework for scaling sustainable land management options. Land Degrad. Dev. 2018, 29, 3272–3284. [Google Scholar] [CrossRef]
  3. Schmidt, E.; Chinowsky, P.; Robinson, S.; Strzepek, K. Determinants and impact of sustainable land management (SLM) investments: A systems evaluation in the Blue Nile Basin, Ethiopia. Agric. Econ. 2017, 48, 613–627. [Google Scholar] [CrossRef]
  4. Bulte, E.H.; Lipper, L.; Stringer, R.; Zilberman, D. Payments for ecosystem services and poverty reduction: Concepts, issues, and empirical perspectives. Environ. Dev. Econ. 2008, 13, 245–254. [Google Scholar] [CrossRef]
  5. Bond, I. Payments for Watershed Services: Opportunities and Realities; International Institute for Environment and Development: London, UK, 2007. [Google Scholar]
  6. Landell-Mills, N.; Porras, I.T. Silver Bullet or Fools’ Gold: A Global Review of Markets for Forest Environmental Services and Their Impacts on the Poor; International Institute for Environment and Development: London, UK, 2002; ISBN 9781899825929. [Google Scholar]
  7. Van Noordwijk, M.; Leimona, B.; Emerton, L.; Tomich, T.P.; Velarde, S.J.; Kallesoe, M.; Sekher, M.; Swallow, B. Criteria and Indicators for Environmental Service Compensation and Reward Mechanisms: Realistic, Voluntary, Conditional and Pro-Poor; World Agroforestry Centre: Nairobi, Kenya, 2004. [Google Scholar]
  8. WWF Living Planet Index. Available online: http://wwf.panda.org/ (accessed on 17 July 2013).
  9. Branca, G.; Lipper, L.; Neves, B.; Lopa, D.; Mwanyoka, I. Payments for Watershed Services Supporting Sustainable Agricultural Development in Tanzania. J. Environ. Dev. 2011, 20, 278–302. [Google Scholar] [CrossRef]
  10. Fonafifo. Local Agreements for Contributions to the National Programme of Payments for Environmental Services; Fondo Nacional de Financiamiento Forestal: San Jose, CA, USA, 2008.
  11. Gebreselassie, S.; Kirui, O.K.; Mirzabaev, A. Economics of Land Degradation and Improvement in Ethiopia. In Economics of Land Degradation and Improvement—A Global Assessment for Sustainable Development; Springer International Publishing: Cham, Switzerland, 2016; pp. 401–430. [Google Scholar]
  12. Engdawork, A.; Bork, H.-R. Long-Term Indigenous Soil Conservation Technology in the Chencha Area, Southern Ethiopia: Origin, Characteristics, and Sustainability. Ambio 2014, 43, 932–942. [Google Scholar] [CrossRef]
  13. Gessesse, G.D.; Mansberger, R.; Klik, A. Assessment of rill erosion development during erosive storms at Angereb watershed, Lake Tana sub-basin in Ethiopia. J. Mt. Sci. 2015, 12, 49–59. [Google Scholar] [CrossRef]
  14. Gelagay, H.S.; Minale, A.S. Soil loss estimation using GIS and Remote sensing techniques: A case of Koga watershed, Northwestern Ethiopia. Int. Soil Water Conserv. Res. 2016, 4, 126–136. [Google Scholar] [CrossRef]
  15. Haregeweyn, N.; Tsunekawa, A.; Nyssen, J.; Poesen, J.; Tsubo, M.; Tsegaye Meshesha, D.; Schütt, B.; Adgo, E.; Tegegne, F. Soil erosion and conservation in Ethiopia. Prog. Phys. Geogr. Earth Environ. 2015, 39, 750–774. [Google Scholar] [CrossRef]
  16. Kassie, M.; Pender, J.; Yesuf, M.; Kohlin, G.; Bluffstone, R.; Mulugeta, E. Estimating returns to soil conservation adoption in the northern Ethiopian highlands. Agric. Econ. 2008, 38, 213–232. [Google Scholar] [CrossRef]
  17. Holden, S.T.; Deininger, K.; Ghebru, H. Impacts of Low-Cost Land Certification on Investment and Productivity. Am. J. Agric. Econ. 2009, 91, 359–373. [Google Scholar] [CrossRef]
  18. Olarinde, L.O.; Oduol, J.B.; Binam, J.N. Impact of the Adoption of Soil and Water Conservation Practices on Crop Production: Baseline Evidence of the Sub Saharan Africa Challenge Programme. Am. J. Agric. Environ. Sci. 2011, 9, 28–40. [Google Scholar]
  19. Belay, K. Agricultural extension in Ethiopia: The case of participatory demonstration and training extension system. J. Soc. Dev. Afr. 2003, 18, 49–84. [Google Scholar] [CrossRef]
  20. Tadesse, M.; Kassa, B. Factors Influencing Adoption of Soil Conservation Measures in Southern Ethiopia: The Case of Gununo Area. J. Agric. Rural Dev. Trop. Subtrop. 2004, 105, 49–62. [Google Scholar]
  21. Desta, G.; Kassawmar, T.; Mohammed, H.; Tiruneh, S.; Gete, V.; Wondie, M.; Tikue, G.; Alebachew, Z.; Degu, Y.; Teferi, E.; et al. Assessing Sustainability of Watersheds Developed through the Community Mobilization in Ethiopian Highlands: Does Land Tenure Play a Role? Addis Ababa University: Addis Ababa, Ethiopia, 2016. [Google Scholar]
  22. Ejeta, L.T. Community’s Emergency Preparedness for Flood Hazards in Dire-dawa Town, Ethiopia: A Qualitative Study. PLoS Curr. 2018. [Google Scholar] [CrossRef] [PubMed]
  23. Dercon, S.; Christiaensen, L. Consumption risk, technology adoption and poverty traps: Evidence from Ethiopia. J. Dev. Econ. 2011, 96, 159–173. [Google Scholar] [CrossRef]
  24. Kebede, F.; Yamoah, C. Soil Fertility Status and Numass Fertilizer Recommendation of Typic Hapluusterts in the Northern Highlands of Ethiopia. World Appl. Sci. J. 2009, 6, 1473–1480. [Google Scholar]
  25. Spielman, D.J.; Byerlee, D.; Alemu, D.; Kelemework, D. Policies to promote cereal intensification in Ethiopia: The search for appropriate public and private roles. Food Policy 2010, 35, 185–194. [Google Scholar] [CrossRef]
  26. FAO. The State of Food and Agriculture 2007—Paying Farmers for Environmental Services; Food and Agriculture Organization of the United Nations: Rome, Italy, 2007. [Google Scholar]
  27. Amsalu, A.; de Graaff, J. Determinants of adoption and continued use of stone terraces for soil and water conservation in an Ethiopian highland watershed. Ecol. Econ. 2007, 61, 294–302. [Google Scholar] [CrossRef]
  28. Liniger, H.P.; Studer, R.; Hauert, C.; Gurtner, M. Sustainable Land Management in Practice—Guidelines and Best Practices for Sub-Saharan Africa; Food and Agriculture Organization of the United Nations: Rome, Italy, 2011; ISBN 978-92-5-000000-0. [Google Scholar]
  29. Alemayehu, B.; Hagos, F.; Haileselassie, A.; Mapedza, E.; Gebreselasse, S.; Bekele, S.; Peden, D. Payment for environmental service for improved land and water management: The case of Koga and Gumara watersheds of the Blue Nile Basin, Ethiopia. In Proceedings of the Challenge Program on Water and Food Intermediate Results Dissemination Workshop, Addis Ababa, Ethiopia, 5–6 February 2009; CPWF: Addis Ababa, Ethiopia, 2009. [Google Scholar]
  30. Mezgebo, A.; Geta, E.; Zeleke, F. Urban freshwater users’ willingness to pay for upland degraded watershed management: The case of Dechatu in Dire Dawa Administration, Ethiopia. Rev. Agric. Appl. Econ. 2016, 19, 13–20. [Google Scholar]
  31. Tesfaye, A.; Brouwer, R. Exploring the scope for transboundary collaboration in the Blue Nile river basin: Downstream willingness to pay for upstream land use changes to improve irrigation water supply. Environ. Dev. Econ. 2016, 21, 180–204. [Google Scholar] [CrossRef]
  32. Zenebe, G.; Zerihun, M.; Solomon, Z. An ethnobotanical study of medicinal plants in Asgede Tsimbila District, Northwestern Tigray, Northern Ethiopia. Ethnobot. Res. Appl. 2012, 10, 305–320. [Google Scholar] [CrossRef]
  33. Behailu, S.; Kume, A.; Desalegn, B. Household’s willingness to pay for improved water service: A case study in Shebedino District, Southern Ethiopia. Water Environ. J. 2012, 26, 429–434. [Google Scholar] [CrossRef]
  34. Mezgebo, A. Households’ Willingness to Pay For Restoring Environmental Resource: A Case Study of Forest Resource from Dire Dawa Area, Eastern, Ethiopia. Ethiop. J. Econ. 2012, 21, 33–62. [Google Scholar]
  35. Lema, Z.; Beyene, F. Willingness to Pay for Improved Rural Water Supply in Goro-Gutu District of Eastern Ethiopia: An Application of Contingent Valuation. J. Econ. Sustain. Dev. 2012, 3, 145–159. [Google Scholar]
  36. Bogale, A.; Urgessa, B. Households’ Willingness to Pay for Improved Rural Water Service Provision: Application of Contingent Valuation Method in Eastern Ethiopia. J. Hum. Ecol. 2012, 38, 145–154. [Google Scholar] [CrossRef]
  37. Perman, R.; Perman, R. Natural Resource and Environmental Economics; Pearson Addison Wesley: Boston, MA, USA, 2011; ISBN 0321417534. [Google Scholar]
  38. Haab, T.C.; McConnell, K.E. Valuing Environmental and Natural Resources: The Econometrics of Non-Market Valuation; Edward Elgar Publishing: Cheltenham, UK; Northampton, MA, USA, 2002; ISBN 9781840647044. [Google Scholar]
  39. Tessema, W.; Holden, S. Soil Degradation, Poverty, and Farmers’ Willingness to Invest in Soil Conservation: A case from a Highland in Southern Ethiopia. In the Ethiopian Economic Association, Proceedings of the Third International Conference on the Ethiopian Economy, Addis Ababa, Ethiopia, 2–4 June 2005; EEA Publication: Addis Ababa, Ethiopia, 2006; Volume 2, pp. 147–164. [Google Scholar]
  40. Gebremariam, G.G.; Edriss, A.K. Journal of Economics and Sustainable Development (JEDS). J. Econ. Sustain. Dev. 2010, 3, 97–107. [Google Scholar]
  41. Bekele, W.; Drake, L. Soil and water conservation decision behavior of subsistence farmers in the Eastern Highlands of Ethiopia: A case study of the Hunde-Lafto area. Ecol. Econ. 2003, 46, 437–451. [Google Scholar] [CrossRef]
  42. Ebrahim, A. Farmers’ willingness to pay for rehabilitation of degraded natural resources under watershed development in Ethiopia (case study in Dejen Woreda). Afr. J. Econ. Sustain. Dev. 2014, 3, 273–287. [Google Scholar] [CrossRef]
  43. Smith, R.D.; Sach, T.H. Contingent valuation: What needs to be done? Health Econ. Policy Law 2010, 5, 91. [Google Scholar] [CrossRef]
  44. Mitchell, R.C.; Richard, T.C. Using Surveys to Value Public Goods: The Contingent Valuation Method; Resources for the Future: Washington, DC, USA, 1989. [Google Scholar]
  45. MoFED. EFDRE Growth and Transformation Plan (2010/11-2014/15); MoFED: Addis Ababa, Ethiopia, 2010.
  46. CSA Central Statistical Agency of Ethiopia. Available online: http://www.csa.gov.et/ (accessed on 7 July 2018).
  47. OPHI. Informing Policy Around the World: Briefing 30; Oxford Poverty & Human Development Initiative, Ed.; Oxford University Press: Oxford, UK, 2015. [Google Scholar]
  48. EEP Ethiopian Electric Power. Available online: http://www.eep.gov.et/ (accessed on 2 February 2019).
  49. Melaku, W. Agro-biodiversity and food security in Ethiopia. In Proceedings of the Environment and Development in Ethiopia: Proceedings of the Symposium of the Forum for Social Studies, Addis Ababa, Ethiopia, 15–16 September 2000; Japan Fund for Global Environment: Addis Ababa, Ethiopia, 2001. [Google Scholar]
  50. Dubale, P. Soil and Water Resources and Degradation Factors Affecting Productivity in Ethiopian Highland Agro-Ecosystems. Northeast Afr. Stud. 2001, 8, 27–51. [Google Scholar] [CrossRef]
  51. De Groot, R.S.; Wilson, M.A.; Boumans, R.M.J. A typology for the classification, description and valuation of ecosystem functions, goods and services. Ecol. Econ. 2002, 41, 393–408. [Google Scholar] [CrossRef]
Figure 1. Map of Ethiopia sampling frame covered four of the nine regional states of Ethiopia: Amhara, Tigray, Oromia, and Southern Nations, Nationalities, and Peoples, as well as the city of Addis Ababa.
Resources 08 00077 g001
Figure 2. Methodological flowchart.
Resources 08 00077 g002
Table 1. Description of variables included and hypothesis on the WTP influence.
VariablesDescriptionValue Range Hypothesis
Family sizeNumber of family members1–10-
Dependency ratioNumber (ratio) representing economically active family members0.17–4-
Sex of headDummy variable: 0 = male, 1 = female -
Marital statusMarital status: 1 = unmarried, 2 = married, 3 = divorced +
Age of headAge in years18–85+
Average family ageMean age in years +
Education of headCategorical variable: 0=unable to read and write, 1 = 1–4, 2 = 5–8, 3 = 9–10, 4 = 11–12, 5 = TVET, 6 = Diploma (12 + 2), 7 = university degree +
Monthly incomeCategorical variable (Ethiopian Birr *): 1=less than 1000, 2 = 1000–2000, 3 = 2000–3000, 4 = 3000–4000, 5 = 4000–5000, 6 =greater than 5000 +
Engaged in private businessDummy variable: 1 = engage in private business, or otherwise +
Engaged in government employmentDummy variable: 1 = employed in government institutions, or otherwise +
Amount of electrical use Mean monthly electrical consumption, categorical variable in kWh: 1 = 0–50, 2 = 51–100, 3 = 101–200, 4 = 201–300, 5 = 301–400, 6 => 500 +
Monthly electrical expenseMean monthly of electrical expense in Ethiopian Birr *2–800-
Note: † continuous variables, ‡ potential effect, * 1 Ethiopian Birr = US$ 0.035.
Table 2. Electric user sampled institutions by category.
Electric VoltageNumber of Samples Service Sector (%)Industry Sector (%)
Low voltage4258.331.1
High voltage204.240
Both3137.528.9
Total93100100
Table 3. Amount of monthly electricity payment of organizations.
Type of OrganizationsType of IndustryNMaxMeanSD
IndustriesHeavy101,300,000.00260,000.5739.00
Medium18800,000.0074,000.3019.00
Light136000.50920.0017.25
Service providersHotels2250,000.00334010.51
Schools31000.10650.000.43
Hospitals10600.00270.000.19
Supermarkets121000.20360.000.35
Table 4. Perception of land degradation across organizations.
OrganizationsNumber of SamplesHow Much Worrying Land Degradation is?Who is Responsible to Reduce the Problem?
Extremely Worrying (%)Worrying (%)All Citizens (%)Government (%)
Service sector4897.92.11000
Industry sector4593.36.795.64.4
Table 5. Respondents’ willingness to pay for watershed management.
Willingness to Pay for Watershed Management Number of SamplesHouseholdOrganizations
Yes41683.990.3
No9016.19.7
Total496100100
Table 6. Proposed payment across electric use categories for households.
Proposed Payment for Household
(Ethiopian Birr *)
Number of SamplesPercentage of Electric Users Based on kWh per MonthTotalχ2 value **
0–5051–100101–200201–300301–400401–500>501
22101816281672145032.024
510319726191221425
81010104010200102
109391921111172222
Total Average416161426159316100
Note: * 1 Ethiopian Birr = US$ 0.035, ** indicates significance at 0.01 level.
Table 7. Cross tabulation of proposed payment bids with monthly income categories of respondent households.
Town CategoriesNumber of SamplesProposed Bids
(Ethiopian Birr *)
Categorized Percentage of Monthly Income (’000)
<11–22–33–44–5>5
Large60213.9318.8518.0319.679.8419.67
57.5511.3220.7516.9822.6420.75
80204020020
109.844.9213.116.5616.3949.18
Medium50218.3130.9815.4923.942.81698.45
58.1218.9218.9221.6213.5118.92
8020040040
1017.8610.7121.4321.4310.7117.86
Small villages302756.2506.256.256.25
561.5423.0807.6907.69
Note: * 1 Ethiopian Birr = US$ 0.035.
Table 8. Proposed bids across organization categories.
Amount of Ethiopian Birr *Service Sector (%)Industry Sector (%)
0.05 per kWh24.437.5
0.10 per kWh33.322.5
0.15 per kWh2.210.0
0.20 per kWh8.912.5
0.50 per kWh31.112.5
Note: * 1 Ethiopian Birr = US$ 0.035.
Table 9. Mean WTP calculation of households for watershed management.
VariableCoefficientStandard ErrorMeanCoefficient × Mean
Bid0.0040.016
Total family size−0.0110.0423.46670.013867
Dependency ratio0.1230.0870.7845−0.00863
Sex of the h head−0.0040.056N/A0
Marital status of HH * head−0.0020.003N/A0
Age of the HH * head−0.0030.00638.6404-0.07728
Education status of HH * head00N/A0
Monthly electricity expense **0.0140.013 ***N/A0
Monthly income0.0040.0173.53230.049452
Engagement in private company−0.7220.173 ***N/A0
Engagement in government employment0.7160.169 ***N/A0
Engagement in agriculture 0.7460.184 ***N/A0
Constant −1.7810.2 −1.781
Mean WTP −1.80359
Note: * HH = household, ** Ethiopian Birr (conversion rate: 1 Ethiopian Birr = US$ 0.035), *** indicates significance at 0.01 level.
Table 10. Mean WTP calculation of service providers for watershed management.
ParameterEstimateStandard ErrorMeanCoefficient × Mean
Experience in business (in years)−0.0210.03111.87−0.24927
Number of employees−0.0130.0118.8298−0.24479
Monthly electric payment **001760.3620
Problem related to electricity0.4460.547N//ANA
Amount Eth. Birr cost for generator oil001757.8260
Capital in millions **−0.0010.002 ***50.3443−0.05034
Bid −0.5560.166-
Intercept−2.7462.024−2.746−2.746
Mean WTP −3.2904
Note: ** Ethiopian Birr (conversion rate: 1 Ethiopian Birr = US$ 0.035), *** indicates significance at 0.05 level.
Table 11. Mean WTP calculation of industries for watershed management.
ParameterEstimateStandard ErrorMeanCoefficient × Mean
Type of industry0.0610.356N/A0
Year of establishment−0.0040.0211.23−0.04492
Number of employees00.001224.48890
Monthly payment **0094185.90
Problem related to electricity−0.040.072N/A0
Initial investment capital in millions **00.00225.260
market for the product2.092.946N/A0
Amount you need full capacity (kWh)0.1490.61 ***N/A0
Bid0.0070.051N/A0
Intercept−6.0282.184 −6.028
Mean WTP −6.07292 ****
Note: ** Ethiopian Birr (conversion rate: 1 Ethiopian Birr = US$ 0.035), *** indicates significance at 0.05 level, **** mean WTP is average largest amount of money that an individual or group could pay, along with a change in policy, without being made worse off. It is, therefore, a monetary measure of the benefit to them of the policy change; if negative, it measures its cost.

