Abstract
Carbon sequestered as soil inorganic carbon (SIC) provides a regulating ecosystem service, which can be assigned a monetary value based on the avoided social cost of carbon (SC-CO2). By definition, the SC-CO2 is a measure, in dollars, of the long-term damage resulting from the emission of a metric ton of carbon dioxide (CO2). Therefore, this dollar figure also represents the value of damages avoided due to an equivalent reduction or sequestration of CO2. The objective of this study was to assess the value of SIC stocks in the contiguous United States (U.S.) by soil order, soil depth (0–20, 20–100, 100–200 cm), land resource region (LRR), state, and region using information from the State Soil Geographic (STATSGO) database together with a reported SC-CO2 of $42 (U.S. dollars). With this approach, the calculated monetary value for total SIC storage in the contiguous U.S. was between $3.48T (i.e., $3.48 trillion U.S. dollars, where T = trillion = 1012) and $14.4T, with a midpoint value of $8.34T. Soil orders with the highest (midpoint) values for SIC storage were: 1) Mollisols ($3.57T), 2) Aridisols ($1.99T), and 3) Alfisols ($841B) (i.e., $841B is 841 billion U.S. dollars, where B = billion = 109). When normalized by land area, the soil orders with the highest (midpoint) values for SIC storage were: 1) Vertisols ($3.57 m−2), 2) Aridisols ($2.45 m−2), and 3) Mollisols ($1.77 m−2). Most of the SIC value was associated with the 100–200 cm depth interval, with a midpoint value of $4T and an area-normalized value of $0.54 m−2. The LRRs with the highest (midpoint) values of SIC storage were: 1) D—Western Range and Irrigated Region ($1.77T), 2) H—Central Great Plains Winter Wheat and Range Region ($1.49T), and 3) M—Central Feed Grains and Livestock Region ($1.02T). When normalized by land area, the LRRs were ranked: 1) I—Southwest Plateaus and Plains Range and Cotton Region ($5.36 m−2), 2) J—Southwestern Prairies Cotton and Forage Region ($4.56 m−2), and 3) H—Central Great Plains Winter Wheat and Range Region ($2.56 m−2). States with the highest (midpoint) values for SIC storage were: 1) Texas ($2.96T), 2) New Mexico ($572B), and 3) Montana ($524B). When normalized by land area, the states were ranked: 1) Texas ($4.47 m−2), 2) Utah ($2.77 m−2), and 3) Minnesota ($2.17 m−2). Lastly, regions with the highest (midpoint) values for SIC storage were: 1) South Central ($3.13T), 2) West ($1.98T), and 3) Northern Plains ($1.62T). When normalized by land area, the regions were ranked: 1) South Central ($2.90 m−2), 2) Midwest ($1.32 m−2), and 3) West ($1.02 m−2). Results from this study demonstrate a new approach for assigning monetary values to SIC stocks at various scales based on their role in providing ecosystem services for climate regulation and carbon sequestration.
1. Introduction
The United Nations (UN) has challenged countries and stakeholders to establish sustainable development, enhance global well-being and increase environmental protection and conservation with the creation of 17 Sustainable Development Goals (SDGs) []. Achieving the UN SDGs by the projected target year of 2030 can be facilitated with the use of the ecosystem services framework, whose central idea revolves around the benefits people derive from nature []. The UN SDGs and the ecosystem services framework (provisioning, regulating, cultural, and supporting services) are linked because services provided by ecosystems can contribute to achieving SDG targets []. Soil carbon plays an important role in the UN SDGs, and its role varies depending on the type of soil carbon. Total soil carbon (TC) is composed of soil organic carbon (SOC) and soil inorganic carbon (SIC). Soil organic carbon is derived from living matter, tends to be concentrated in the topsoil, and plays an important role in provisioning and regulating ecosystem services. Soil inorganic carbon is derived from mineral matter, tends to be concentrated below topsoil, and also plays an important role in provisioning and regulating services. For example, SIC exchanges carbon with the atmosphere and provides regulating ecosystem services of climate regulation and carbon sequestration []. These regulating services provided by SIC underpin specific SDGs: 12) ensure sustainable consumption and production patterns, 13) take urgent action to combat climate change and its impacts, and 15) protect, restore and promote sustainable use of terrestrial ecosystems [] (Table 1).

Table 1.
Connections between regulating ecosystem services and selected Sustainable Development Goals (SDGs) in relation to soil inorganic carbon (SIC) (adapted from Wood et al., 2017 []).
Soil inorganic carbon (SIC) is an important soil property for ecosystem services, specifically, regulating services (e.g., climate regulation and carbon sequestration). However, SIC has not been included in the ecosystem services framework (Figure 1) []. Carbon (C) storage as an ecosystem service is important because of SIC’s role in Earth’s climate system []. Humans are altering the soils through land management practices. Therefore, SIC assessment using the ecosystem services framework is critical, especially in regulating services in regions where the SIC pool constitutes the largest C pool (e.g., semiarid and arid climates) []. Soil inorganic carbon is different from mineral inorganic carbon because it is soil-derived (Figure 1). Both lithospheric and pedospheric stocks of carbonates are quantifiable amounts of inorganic carbon with units defined in a spatial context (e.g., kg m−2) []. These stocks can be measured as separate constituent stocks (e.g., lithogenic, pedogenic carbonates), or as composite stocks (e.g., lithogenic + pedogenic carbonates). Flows into or from these stocks are fluxes, which are quantities per unit area per unit of time (e.g., the concentration of CO2 sequestered or released in parts per million per meter squared per year). Carbon sequestration or release via SIC is a complex process in the pedosphere-atmosphere exchange system (Table 2).
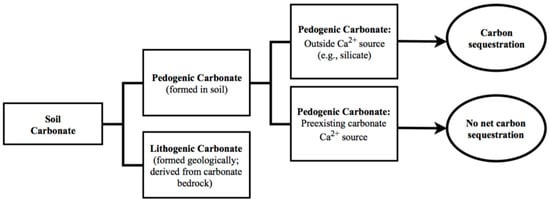
Figure 1.
Soil carbonate classification based on type of carbonate precipitation and carbon sequestration pathway dependent on calcium source (adapted from Monger et al., 2015 []).

Table 2.
Lithosphere-pedosphere-atmosphere ecosystem services exchange, stocks, goods, flows (represented by arrows).
Soil inorganic carbon is found in varying quantities, depths, and forms such as gaseous carbon dioxide (CO2 (g)), dissolved carbon dioxide (CO2 (aq)), carbonic acid (H2CO3 (aq)), bicarbonate ion (HCO3− (aq)), carbonate ion (CO32− (aq)), and solid-phase inorganic carbon (e.g., concretions) [,,]. Soil inorganic carbon stocks have variable distributions in the contiguous U.S., with concentrated quantities in the Central Midwest-Great Plains and arid regions []. Soil inorganic carbon comprises one of the largest terrestrial C pools of ~940 PgC compared with the soil organic carbon (SOC) pool of ~1530 PgC []. There are two types of carbonates found in the soil: lithogenic carbonates (also known as inherited or geogenic) and pedogenic carbonates (also known as authigenic) []. Lithogenic carbonates are initially formed geologically in a marine depositional environment and then either transported (eolian, alluvial, colluvial, or glacial) to the soil (ex situ) or derived from carbonate bedrock (in situ) []. Pedogenic carbonates precipitate in the soil and can sequester carbon if the calcium ion (Ca2+) is sourced from outside (e.g., atmosphere) and/or weathered silicate minerals from sources such as igneous and metamorphic rocks [] (Figure 1). For carbon sequestration, two moles of atmospheric carbon react with one mole of calcium (silicate source), which yields one mole of carbon to be released back into the atmosphere and one mole of carbon sequestered []. During formation, if the Ca2+ ion is sourced from the dissolution of a pre-existing carbonate (such as pedogenic carbonates, dolomite, calcareous sandstones, etc.), then there is no net carbon sequestration upon precipitation of the newly formed pedogenic carbonate [] (Figure 1). The precipitation of a pedogenic carbonate using a silicate Ca2+ from the outside source is a regulating ecosystem service because the formation process sequesters CO2 (sink). However, the dissolution of a soil carbonate would be a regulating ecosystem disservice because the dissolution process releases previously sequestered carbon, and therefore becomes a source of CO2 for the atmosphere [,,,].
Regulating services are one of four broad categories of the ecosystem services framework, which benefit people through their regulation of ecosystem processes such as air quality regulation, climate regulation, water regulation, erosion regulation, disease regulation, and pollination []. The overall soil carbon (C) cycle, and their regulating ecosystem services, are being impacted by land management decisions []. For example, a change in land use (from wetland, grassland or forest to cropland) decreases the quantity of C sequestered. In contrast, a change in land use (from agricultural land to forest or grassland) increases the quantity of C sequestered []. Previous research from Mikhailova and Post (2006) [] reported significant differences in SIC stocks between native grassland fields, continuously fallow fields, and continuously cropped fields. Furthermore, SIC formation can increase under the application of irrigation water, but can also undergo dissolution if in the presence of acidification []. Soil inorganic carbon and its regulating services can potentially be impacted by land management practices. However, SIC is neglected in the current ecosystem services framework, despite SIC’s important role in the long-term C cycle [,].
Soil inorganic carbon stocks are vulnerable to fluctuation through time. For example, previous research from Monger (2014) [] suggests that SIC stocks increased during the Silurian era due to increased mineral weathering coinciding with the emergence of terrestrial land plants raising CO2 levels in the soils. However, Monger (2014) [] questions how an increase in atmospheric CO2 level could potentially impact the formation of pedogenic carbonates. In the Cambrian era, CO2 levels in the atmosphere were significantly higher than today (~8000 ppm) and there is no record of pedogenic carbonate in Cambrian paleosols. Therefore, there is an urgent need to commence comprehensive monitoring of SIC stocks through the ecosystem services framework to maintain SIC’s services of climate regulation and carbon sequestration throughout time.
The objective of this study was to assess the value of SIC in the contiguous U.S. based on two key precepts of ecological economics: (1) the role of SIC in providing carbon sequestration ecosystem services, and (2) the social cost of carbon (SC-CO2) and avoided emissions provided by carbon sequestration. This study provides the monetary values of SIC by soil depth (0–20, 20–100, 100–200 cm) across the contiguous U.S. and by considering different spatial aggregation levels (i.e., state, region, land resource region (LRR)) using information previously compiled from the State Soil Geographic (STATSGO) database that has been reported by Guo et al. (2006) [].
2. Materials and Methods
2.1. The Accounting Framework
This study used both biophysical (science-based) and administrative (boundary-based) accounts to calculate monetary values for SIC (Table 3).

Table 3.
Conceptual overview of the accounting framework used in this study (adapted from Groshans et al., 2018 []).
2.2. Monetary Valuation Approach
Guo et al. (2006) [] reported the estimated values for the total SIC storage (in Mg or metric tons) and content (in kg m−2) in the contiguous U.S. by soil depth intervals, as well as by states and regions for the upper 2 m depth of soil. A monetary valuation for SIC was calculated using the social cost of carbon (SC-CO2) and avoided emissions, which the U.S. Environmental Protection Agency (EPA) has determined to be $42 per metric ton of CO2 []. It is important to note that, since 2008, EPA has worked with other U.S. federal agencies, including the National Academies of Science, to derive an appropriate value to assign to the SC-CO2. The listed figure of $42 per metric ton of CO2 is applicable for the year 2020 based on 2007 U.S. dollars and an average discount rate of 3%. As explained by the EPA, the SC-CO2 is intended to be a comprehensive estimate of climate change damages. However, there are various important climate change impacts recognized in the literature that are not currently included in its reported values for SC-CO2 []. Therefore, the SC-CO2 is most likely an underestimate of the true damages and cost of CO2 emissions. For the contiguous U.S., numbers for the minimum, midpoint, and maximum SIC storage and SIC content for all soils by depth (0–20, 20–100, 100–200 cm), state, region, and land resource region (LRR) were acquired from []. Soil inorganic carbon storage and content numbers were then converted to U.S. dollars and dollars per square meter in Microsoft Excel using the following equations, with a social cost of carbon of $42/Mg CO2:
For example, for the State of Iowa, Guo et al. (2006) [] reported midpoint SIC storage and content numbers of 167,537 × 104 Mg and 11.7 kg∙m−2, respectively. Using these two numbers together with a conversion factor for SIC to CO2 and the EPA dollar value for the SC-CO2 results in a total SIC value of $2.58 × 10¹¹ (about $0.26T or 0.26 trillion U.S. dollars) and an area-normalized SIC value of $1.80 m−2, respectively.
3. Results
Soil inorganic carbon (SIC) in the contiguous U.S., either formed naturally or anthropogenically in the soil as pedogenic carbonates or inherited as lithogenic carbonates, encompasses a potentially consequential monetary value reflected as avoided social costs because these SIC stocks contribute to carbon sequestration. The estimated values (minimum, mid-value, and maximum) associated with SIC in the contiguous U.S. vary by soil order, depth, land resource regions (LRR), state, and region. The total SIC storage value in the contiguous U.S. is between $3.48T (i.e., $3.48 trillion U.S. dollars, where T = trillion = 1012) and $14.4T, with a midpoint value of $8.34T.
3.1. Value of SIC by Soil Order
The soil orders with the highest total (midpoint) values of SIC were: 1) Mollisols ($3.57T), 2) Aridisols ($1.99T), and 3) Alfisols ($841B) (Table 4).

Table 4.
Total and area-normalized values of soil inorganic carbon (SIC) storage in the upper 2 m within the contiguous U.S., based on SIC numbers from Guo et al., 2006 [] and a social cost of carbon (SC-CO2) of $42 per metric ton of CO2.
When normalized by area, the soil orders with the highest area-normalized (midpoint) values of SIC were: 1) Vertisols ($3.57 m−2), 2) Aridisols ($2.45 m−2), and 3) Mollisols ($1.77 m−2) (Table 4). The soil orders with the highest values of SIC, and highest area-normalized values of SIC, are intermediately weathered soil orders (i.e., Mollisols, Alfisols, Aridisols, and Vertisols), whereas soil orders with the lowest SIC values are slightly and strongly weathered.
3.2. Value of SIC by Soil Depth in the Contiguous U.S.
The total (storage) value of the SIC and SIC value per area are broken down by soil depths of 0–20 cm, 20–100 cm, and 100–200 cm (Table 5). Most of the SIC value is associated with the 100–200 cm depth interval with a midpoint value of $4T and an area-normalized value of $0.54 m−2, while the lowest values were in the 0–20 cm depth interval (Table 5). The soil depth of 0–20 cm is a critical depth interval in the agricultural industry.

Table 5.
Total and area-normalized values of SIC by depth for the contiguous U.S., based on SIC numbers from Guo et al., 2006 [] and a SC-CO2 of $42 per metric ton of CO2.
3.3. Value of SIC by Land Resource Regions (LRRs) in the Contiguous U.S.
The U.S. Department of Agriculture (USDA) characterizes Land Resource Regions (LRRs) by their geographically corresponding major land resource areas (MLRAs) and uses capital letters to denote agricultural markets (e.g., A, B, C, D, etc.; see Table 6 notes). In the U.S., LRRs are divided into 28 localities. However, the study area (contiguous U.S.) comprises only 20 out of the 28 LRRs. The LRRs with the highest (midpoint) SIC values were: 1) D—Western Range and Irrigated Region ($1.77T), 2) H—Central Great Plains Winter Wheat and Range Region ($1.49T), and 3) M—Central Feed Grains and Livestock Region ($1.02T) (Table 6, Figure 2). When normalized by area, the LRRs were ranked: 1) I—Southwest Plateaus and Plains Range and Cotton Region ($5.36 m−2), 2) J—Southwestern Prairies Cotton and Forage Region ($4.56 m−2), and 3) H—Central Great Plains Winter Wheat and Range Region ($2.56 m−2) (Table 6, Figure 2).

Table 6.
Total and area-normalized values by Land Resource Regions (LRRs) for the contiguous U.S., based on SIC numbers from Guo et al. 2006 [] and a SC-CO2 of $42 per metric ton of CO2.
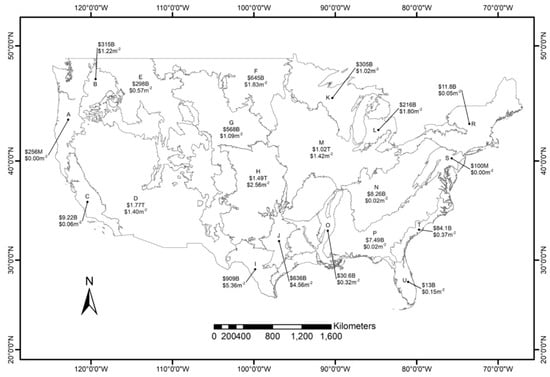
Figure 2.
The total (midpoint) value (top number) and (midpoint) value normalized by area (bottom number) of the SIC for different Land Resources Regions (LRRs) in the contiguous U.S., based on SIC numbers from Guo et al. 2006 [] and a SC-CO2 of $42 per metric ton of CO2.
3.4. Value of SIC by States and Regions in the Contiguous U.S.
States with the highest (midpoint) values of SIC were: 1) Texas ($2.96T), 2) New Mexico ($572B), and 3) Montana ($524B) (Table 7, Figure 3). When normalized by land area, the states were ranked: 1) Texas ($4.47 m−2), 2) Utah ($2.77 m−2), and 3) Minnesota ($2.17 m−2) (Table 7, Figure 3). Regions with the highest (midpoint) values of SIC were: 1) South Central ($3.13T), 2) West ($1.98T), and 3) Northern Plains ($1.62T) (Table 7, Figure 4). When normalized by land area, the regions were ranked: 1) South Central ($2.90 m−2), 2) Midwest ($1.32 m−2), and 3) West ($1.02 m−2) (Table 7, Figure 4).

Table 7.
Total and area-normalized values by state and region for the contiguous U.S., based on SIC numbers from Guo et al. 2006 [] and a SC-CO2 of $42 per metric ton of CO2.
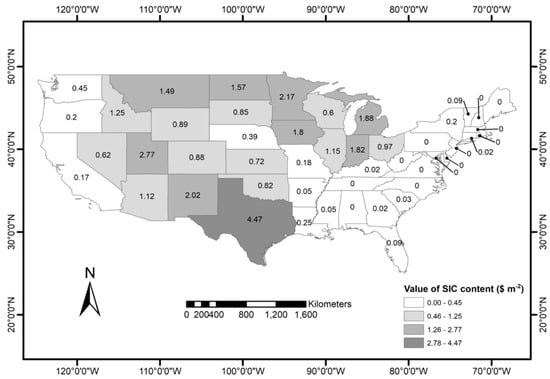
Figure 3.
Midpoint values of SIC normalized by land area ($ m−2) for states in the contiguous U.S., based on SIC numbers from Guo et al. 2006 [] and a SC-CO2 of $42 per metric ton of CO2.
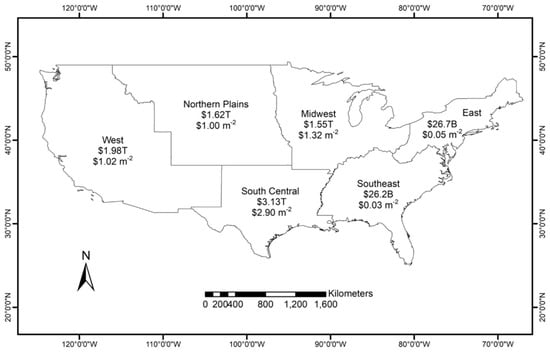
Figure 4.
Total (midpoint) SIC values (top number), and midpoint SIC values normalized by land area (bottom number), for different regions in the contiguous U.S., based on SIC numbers from Guo et al. 2006 [] and a SC-CO2 of $42 per metric ton of CO2.
4. Discussion
4.1. Implications for Ecosystem Services and Sustainable Development Goals (SDGs)
The inclusion of SIC into the list of key soil properties linked to regulating ecosystem services is important for achieving the SDGs to sustain global human societies, and the following examples are specifically linked to the selected SDGs—12, 13, and 15 (listed below) []:
- 12. Ensure sustainable consumption and production patterns:
Naturally present SIC provides multiple beneficial liming impacts on soils (e.g., increase in soil pH, nutrient availability etc.), but agricultural activities are depleting SIC stocks and altering the valuable provisioning and regulating services they provide []. Soil inorganic carbon stocks are relatively easy to measure, and monitor. For example, Groshans et al., 2018 [] assessed the value of SIC for ecosystem services (ES) in the contiguous United States based on liming replacement costs and reported the total replacement cost value of SIC in the upper two meters of soil between $2.16T and $8.97T U.S. dollars (where T = trillion = 1012).
- 13. Take urgent action to combat climate change and its impacts:
Traditionally, soil organic carbon (SOC) was considered the basis of soil carbon sequestration, with SIC being generally overlooked, underestimated, and undervalued []. Soil inorganic carbon can be a source and/or sink of carbon dioxide depending on the source of calcium (Ca2+) and magnesium (Mg2+) cations. Mikhailova et al. (2013) [] evaluated the potential contribution of combined atmospheric Ca2+ and Mg2+ wet deposition within the continental U.S. to soil inorganic carbon sequestration. According to this study, Mollisols (1.1 × 10⁸ kg C) and Alfisols (8.4 × 10⁷ kg C) were ranked first and second with regards to the highest total amounts of carbon that could potentially be sequestered as carbonate from the wet deposition of Ca2+ and Mg2+ []. In terms of area-normalized potential carbon sequestration, Histosols, Alfisols, and Vertisols were the highest ranked soil orders [].
- 15. Protect, restore, and promote sustainable use of terrestrial ecosystems:
Soil inorganic carbon is an important carbon reservoir in terrestrial ecosystems. Soils in dry climates, which cover approximately 40% of the land surface of the earth, commonly have significant amounts of soil inorganic carbon [].
Although remarkable progress has been made in documenting the importance of SIC in the carbon cycle, the economic valuation of regulating ecosystems services provided by the SIC remains poorly understood.
4.2. Economic Implications
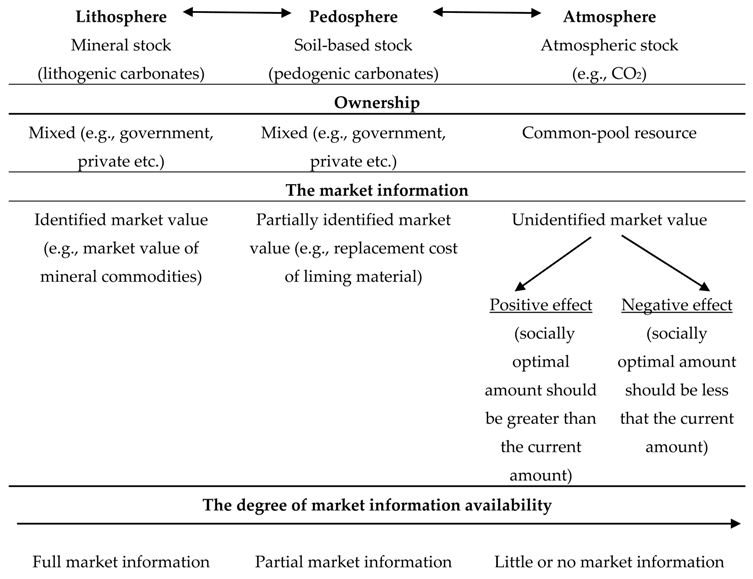
Ecosystem service exchanges, stocks, goods, flows, and ownership vary among Earth’s interconnected “spheres” (e.g., the lithosphere, pedosphere, hydrosphere, atmosphere, etc.). For instance, lithogenic carbonate (mineral stock) forms in considerable quantities over geologic time. Therefore, mixed ownership (government, private stakeholders, etc.) have commoditized lithogenic carbonate in the market. Since the market value of lithogenic carbonate (e.g., agricultural lime) is known and identified, it is considered to have full market information (Table 8). If an ecosystem service has full market information, then a certain price reflected in the market can be used for ecosystem service valuation. Similarly, pedogenic carbonate (soil-based stock) has mixed ownership but forms throughout the soil in less accruing deposits. Therefore, pedogenic carbonate is not commoditized or brought into the market (Table 8). Since pedogenic carbonate is not in the market, it does not have a definitive market value. However, there are methods of valuing pedogenic carbonate through indirect valuation (e.g., replacement cost of liming materials), so pedogenic carbonate is considered to have partial market information. This research study estimates a monetary value for SIC, based on SC-CO2 and the avoided emissions/damages that are gained by sequestration of CO2 from the atmosphere. However, the SC-CO2 itself is considered to have an unidentified market value (little or no market information) (Table 8). The unidentified market value of pedogenic carbonate based on the SC-CO2 can either have a positive effect (a socially optimal amount should be greater than the current amount) or a negative effect (the socially optimal amount should be less than the current amount) on the costs of climate control after a price for pedogenic carbonate is identified (Table 8).

Table 8.
Lithosphere–pedosphere–atmosphere ecosystem services exchange, stocks, goods, flows (represented by arrows), and ownership in relation to soil inorganic carbon.
Fundamental economic analysis defines marginal costs (MC) as the costs of generating an additional good or service, while marginal benefit (MB) represents the subsequent benefits following consumption of the additional good or service. The intersection between the MB and the MC represents the optimal amount to pay for carbon sequestration and climate regulation, otherwise known as climate control costs. In Figure 5, MC1 represents the marginal costs if the value of SIC stocks based on the SC-CO2 are not identified. The optimal amount to pay for climate control costs if the value of SIC stocks based on the SC-CO2 are not identified is represented at the intersection of MC1 and MB. The optimal amount means that P1 is the optimal price to pay for climate control at the optimal quantity of Q1 (Figure 5).
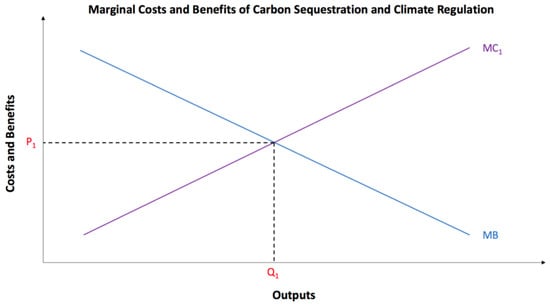
Figure 5.
The marginal costs and benefits of carbon sequestration and climate regulation based on costs and benefits (y-axis) and outputs (x-axis). Note: MB = marginal benefit, MC1 = marginal cost when the value of SIC stocks based on the SC-CO2 are not identified, and the intersection of MB and MC1 represents the optimal amount when the value of SIC stocks based on the SC-CO2 are not identified.
In Figure 6, the MC2 curve represents the marginal cost of carbon sequestration and climate regulation if the value of SIC stocks based on the SC-CO2 are identified. Since MC2 is inclusive of SIC stocks, the overall climate control costs are reduced because the SIC stocks possess the benefit of carbon sequestration, which can decrease carbon emissions. The shifting of the MC curve from MC1 to MC2 produces a positive effect (the socially optimal amount is greater than the current amount), which increases the optimal amount the (intersection of MB and MC2) (Figure 6).
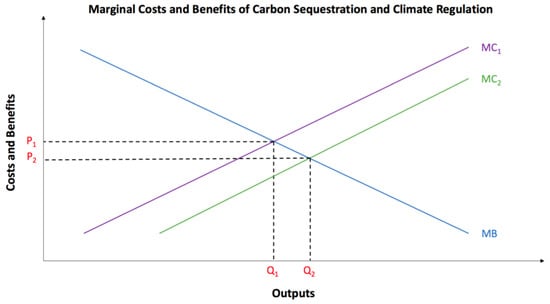
Figure 6.
The marginal costs and benefits of carbon sequestration and climate regulation based on costs and benefits (y-axis) and outputs (x-axis). Note: MB = marginal benefit, MC1 = marginal cost when the value of SIC stocks based on the SC-CO2 are not identified, MC2 = marginal cost when the value of SIC stocks based on the SC-CO2 are identified, the intersection of MB and MC1 represents the optimal amount when the value of SIC stocks based on the SC-CO2 are not identified, and the intersection of MB and MC2 represents the new optimal amount when the value of SIC stocks based on the SC-CO2 are identified.
The new optimal amount depicted in Figure 6 possesses a lower price (P2) and a greater quantity (Q2). Since SIC stocks based on the SC-CO2 have little or no market information, the MC curve might not represent the true value of climate control costs (Table 8). For instance, the new optimal amount reduced climate control costs. Therefore, the previous optimal amount represented an incorrect price and quantity. The lack of information produced an inefficient socially optimal amount (the intersection of P1 and Q1), which suggested a higher, incorrect cost of climate control that could eventually lead to a market failure (Figure 6). Based on the U.S. states, this outcome will change depending on the amount of SIC. For instance, if a state has a zero SIC content value, such as Pennsylvania ($0 m−2), then the marginal costs of climate control would not change (Figure 3 and Figure 5). The marginal cost curve MC1 represents the cost of climate control for the state of Pennsylvania or any other state with a zero SIC content value because there is no additional benefit, which changes neither the price nor quantity of climate control. However, if the state has a SIC content value, like Texas ($4.47 m−2), then the marginal costs of climate control will reduce (Figure 3 and Figure 6). The marginal cost curve MC2 represents the reduced cost of climate control for the state of Texas or any other state that contains above a negligible amount of SIC value because the additional benefit of SIC positively impacts carbon sequestration and climate regulation, which decreases the price (P2) of climate control, while increasing the quantity (Q2) (Figure 3 and Figure 6).
The positive implications of assessing the value of SIC based on avoided social costs of carbon emissions at various scales and boundaries (e.g., state, region, LRR, etc.) include allocating the appropriate amount of responsibility to boundaries that possess greater SIC values. Soil inorganic stocks are dynamically changing. Therefore, present SIC stocks should be monitored. Agricultural activities can remove (through plant uptake) or add to SIC through fertilization and liming. Atmospheric deposition of calcium and magnesium can also play an important role in inorganic carbon formation, resulting in potential inorganic carbon sequestration []. Regulating ecosystem services provided by SIC can be bundled with other ecosystem services (e.g., provisioning, supporting) since they are provided at the same place and time []. For example, they can be bundled with provisioning services provided by SIC, as estimated by Groshans et al. (2018) [,], for the same location. Comparison of the results of this study with Groshans et al. (2018) [,] shows a similar pattern in soil orders with regards to the value of provisioning and regulating services.
5. Conclusions
Carbon sequestered in fertile soils as SIC provides regulating ecosystem services (e.g., carbon sequestration and climate regulation), but SIC has not been included in economic valuations of ecosystem services. In this study the regulating services provided by the SIC were valued based on the SC-CO2 in the contiguous United States (U.S.) (with a midpoint valuation of $8.34T) by soil order, depth, state, region, and land resource region (LRR). Soil orders with the highest (midpoint) values for SIC storage were: 1) Mollisols ($3.57T), 2) Aridisols ($1.99T), and 3) Alfisols ($841B). Soil orders normalized by land area with the highest (midpoint) values for SIC storage were: 1) Vertisols ($3.57 m−2), 2) Aridisols ($2.45 m−2), and 3) Mollisols ($1.77 m−2). The majority of the SIC value was associated with the 100–200 cm soil depth interval, with a midpoint value of $4T and an area-normalized value of $0.54 m−2. The LRRs with the highest (midpoint) values of SIC storage were: 1) D—Western Range and Irrigated Region ($1.77T), 2) H—Central Great Plains Winter Wheat and Range Region ($1.49T), and 3) M—Central Feed Grains and Livestock Region ($1.02T). States with the highest (midpoint) values for SIC storage were: 1) Texas ($2.96T), 2) New Mexico ($572B), and 3) Montana ($524B). States, when normalized by land area, were ranked as: 1) Texas ($4.47 m−2), 2) Utah ($2.77 m−2), and 3) Minnesota ($2.17 m−2). The regions with the highest (midpoint) values for SIC storage were: 1) South Central ($3.13T), 2) West ($1.98T), and 3) Northern Plains ($1.62T). Region ranking when normalized by land area were: 1) South Central ($2.90 m−2), 2) Midwest ($1.32 m−2), and 3) West ($1.02 m−2). These obtained values were mapped using the “crisp” boundary approach to accommodate administrative decision-making. The total values and area-normalized values of SIC stocks were spatially variable within science-based and administrative boundaries, and this spatial distribution information could be linked to existing or future decision-making with regards to sustainable carbon management. For example, these values can be used for comparison between reducing emissions opposed to expenses associated with addressing climate change. Since SIC is often associated with fertile soils under agricultural production, both provisional and regulating services provided by SIC are often privately owned (e.g., farms) and controlled. Agricultural activities generate “capturable” (e.g., food production) revenue, and “non-capturable” outcomes (externalities) for a society. Placing a monetary value on SIC helps to address these externalities in order to develop incentives to manage soils for carbon sequestration, thereby internalizing this externality. The regulating ecosystems service value of SIC is one of the most conspicuous global public goods arising from the soil management of privately and publically owned lands, and this study provides a methodology to quantify SIC regulating services. Future research should examine the interplay between the regulating and provisioning ecosystem services provided by the SIC.
Author Contributions
Conceptualization, E.A.M.; methodology, G.R.G., M.A.S., and L.Z.; writing—original draft preparation, G.R.G. and E.A.M.; writing—review and editing, G.R.G., E.A.M., C.J.P., M.A.S., and L.Z.; visualization, C.J.P.
Funding
This research received no external funding.
Acknowledgments
We would like to thank the reviewers for their constructive comments and suggestions.
Conflicts of Interest
The authors declare no conflict of interest.
References
- Keestra, S.D.; Bouma, J.; Wallinga, J.; Tittonell, P.; Smith, P.; Cerda, A.; Montanarella, L.; Quinton, J.N.; Pachepsky, Y.; Van der Putten, W.H.; et al. The significance of soils and soil science towards realization of the United Nations Sustainable Development Goals. Soil 2016, 2, 111–128. [Google Scholar] [CrossRef]
- Wood, S.L.; Jones, S.K.; Johnson, J.A.; Brauman, K.A.; Chaplin-Kramer, R.; Fremier, A.; Girvetz, E.; Gordon, L.J.; Kappel, C.V.; Mandle, L.; et al. Distilling the role of ecosystem services in the Sustainable Development Goals. Ecosyt. Serv. 2017, 29, 701–782. [Google Scholar] [CrossRef]
- Monger, C.H.; Kraimer, R.A.; Khresat, S.; Cole, D.R.; Wang, X.; Wang, J. Sequestration of inorganic carbon in soil and groundwater. Geology 2015, 43, 375–378. [Google Scholar] [CrossRef]
- Groshans, G.R.; Mikhailova, E.A.; Post, C.J.; Schlautman, M.A. Accounting for soil inorganic carbon in the ecosystem services framework for the United Nations Sustainable Development Goals. Geoderma 2018, 324, 37–46. [Google Scholar] [CrossRef]
- FAO. Status of the World’s Soil Resources (SWSR)—Main Report; Food and Agriculture Organization of the United Nations and Intergovernmental Technical Panel on Soils (ITPS): Rome, Italy, 2015; Available online: http://www.fao.org/documents/card/en/c/c6814873-efc3-41db-b7d3-2081a10ede50/ (accessed on 1 June 2019).
- Jones, L.; Norton, L.; Austin, Z.; Browne, A.L.; Donovan, D.; Emmett, B.A.; Grabowski, Z.J.; Howard, D.C.; Jones, J.P.G.; Kenter, J.O.; et al. Stocks and flows of natural and human-derived capital in ecosystem services. Land Use Policy 2016, 52, 151–162. [Google Scholar] [CrossRef]
- Mikhailova, E.A.; Post, C.J.; Magrini-Bair, K.; Castle, J.W. Pedogenic carbonate concretions in the Russian Chernozem. Soil Sci. 2006, 171, 981–991. [Google Scholar] [CrossRef]
- Mikhailova, E.A.; Post, C.J. Stable carbon and oxygen isotopes of soil carbonates at depth in the Russian Chernozem under different land use. Soil Sci. 2006, 171, 334–340. [Google Scholar] [CrossRef]
- Millennium Ecosystem Assessment (MEA). Ecosystems and Human Well-Being: Synthesis; Island Press: Washington, DC, USA, 2005. [Google Scholar]
- Zamanian, K.; Pustovoytov, K.; Kuzyakov, Y. Pedogenic carbonates: Forms and formation processes. Earth Sci. Rev 2016, 157, 1–17. [Google Scholar] [CrossRef]
- Ramnarine, R.; Wagner-Riddle, C.; Dunfield, K.E.; Voroney, R.P. Contributions of carbonates to soil CO2 emissions. Can. J. Soil Sci. 2012, 92, 599–607. [Google Scholar] [CrossRef]
- Smith, P.; Cotrufo, M.F.; Rumpel, C.; Paustain, K.; Kuikman, P.J.; Elliot, P.J.; McDowell, R.; Griffiths, R.I.; Asakawa, S.; Bustamante, M.; et al. Biogeochemical cycles and biodiversity as key drivers of ecosystem services provided by soils. Soil 2015, 1, 665–685. [Google Scholar] [CrossRef]
- Mikhailova, E.A.; Post, C.J. Effects of land use on soil inorganic carbon stocks in the Russian Chernozem. J. Environ. Qual. 2006, 35, 1384–1388. [Google Scholar] [CrossRef] [PubMed]
- Sanderman, J. Can management induced changes in the carbonate system drive soil carbon sequestration? A review with particular focus on Australia. Agric. Ecosyst. Environ. 2012, 155, 70–77. [Google Scholar] [CrossRef]
- Monger, C.H. Soils as generators and sinks of inorganic carbon in geologic time. In Soil Carbon, Progress in Soil Science; Hartemink, A., McSweeney, K., Eds.; Springer: Cham, Switzerland, 2014; pp. 27–36. [Google Scholar] [CrossRef]
- Guo, Y.; Amundson, R.; Gong, P.; Yu, Q. Quantity and spatial variability of soil carbon in the conterminous United States. Soil Sci. Soc. Am. J. 2006, 70, 590–600. [Google Scholar] [CrossRef]
- Groshans, G.R.; Mikhailova, E.A.; Post, C.J.; Schlautman, M.A.; Zurqani, H.A.; Zhang, L. Assessing the value of soil inorganic carbon for ecosystem services in the contiguous United States based on liming replacement costs. Land 2018, 7, 149. [Google Scholar] [CrossRef]
- EPA. The Social Cost of Carbon. EPA Fact Sheet. 2016. Available online: https://19january2017snapshot.epa.gov/climatechange/social-cost-carbon_.html (accessed on 15 March 2019).
- Alexander, P.; Paustian, K.; Smith, P.; Moran, D. The economics of soil C sequestration and agricultural emissions abatement. Soil 2015, 1, 331–339. [Google Scholar] [CrossRef]
- Gao, Y.; Tian, J.; Pang, Y.; Liu, J. Soil inorganic carbon sequestration following afforestation is probably induced by pedogenic carbonate formation in Northwest China. Front. Plant Sci. 2017, 8, 1282. [Google Scholar] [CrossRef] [PubMed]
- Mikhailova, E.A.; Goddard, M.A.; Post, C.J.; Schlautman, M.A.; Galbraith, J.M. Potential contribution of combined atmospheric Ca2+ and Mg2+ wet deposition within the continental U.S. to soil inorganic carbon sequestration. Pedosphere 2013, 23, 808–814. [Google Scholar] [CrossRef]
- Renard, D.; Rhemtulla, J.M.; Bennett, E.M. Historical dynamics in ecosystem service bundles. Proc. Natl. Acad. Sci. USA 2015, 112, 13411–13416. [Google Scholar] [CrossRef] [PubMed]
© 2019 by the authors. Licensee MDPI, Basel, Switzerland. This article is an open access article distributed under the terms and conditions of the Creative Commons Attribution (CC BY) license (http://creativecommons.org/licenses/by/4.0/).

