1. Introduction
Producing heat energy from biomass has a good energy efficiency. However, using it for electricity production has less efficiency. Using pyrolysis can guarantee heat energy and electricity combined production with higher efficiency. Employing a combined heat and power (CHP) small power plant seems to be a promising technological solution. The machine can be installed directly at the agricultural area of production, and as such, offers various opportunities for heat energy usage locally as well [
1]. The remnant materials with high carbon content, and the biochar remaining from incomplete gasification can be used in agriculture to notable effect, since the soil of intensive plant production always has a carbon deficiency [
2,
3,
4]. The biomass that enters the gas generator first starts to dry with the aid of the burning gases (exchangeable with external energy source). Soon after, once temperature gets even higher, and pyrolysis happens, which releases the following: steam, carbon dioxide, hydrogen, heavy carbohydrates, mainly ethylene, methane, carbon monoxide, tar gases, vinegar acid, methyl alcohol, nitrogen, ammonium-variants, and sulphur-hydrogen variants. Apart from pyrolysis, heat treatment done on biomass for producing carbon is called torrefaction. The pyrolysis of biomass is a thermo-chemical process, which primarily refers to the decomposition of lignocellulose materials, other organic polymers, and biomass minerals [
5,
6,
7]. The products of decomposition are created at a temperature between 400 °C and 800 °C with no oxygen. The main products are pyrolysis vapors which can be divided into two fractions. These are: gases that cannot be condensed (pyrogas) and those that can (biooils). In the case of slow pyrolysis (300–400 °C), the goal may be to produce more char, and reaction times are longer. The coke created during gasification, and the oxygen chemically reacts with each other, and result in so-called illumination gas, or pyrolysis gas [
8,
9,
10]. If the end product is gaseous for direct usage, the temperature for the reaction is usually above 600 °C.
The goal of the experimental work is to use an experimental small power plant to create heat, electricity, and char from agricultural biomass and waste using the pyrolysis method. This paper deals with the experiments preceding the designing phase on the one hand. On the other hand, it defines the preliminary conditions for some operating parameters required for the development of fixed bed small scale pyrolysis plant.
There is a multitude of known pyrolysis processes. The main aim of different development processes is to achieve higher performance, better efficiency, and lower tar content or material remains. The type of reactor used in pyrolysis plays an essential role in the process because of the very high amount of heat that has to pass through the reactor to allow decomposition of the material. The following types are used in practice [
11]:
Due to the small design criteria, only the fixed bedding of the three types can be operated effectively. Within the fixed bedding, ascension gas generator, the pyrolysis gas [
12], and the supplement used for gasification flows counter to the fuel through the generators. If the fresh fuel is poured into the reactor through the top, the supplement of gasification (air, oxygen or steam) arrives into the reaction area from above the gate holding the fuel column. The product of decomposition made in the pyrolysis zone and the steam resulting from the drying injected fuel mix with the pyrolysis gas or pyrogas and propel the generator together. The main problem is that the pyrolysis gas does not go through any high-temperature zones at all, which is why it does not oxidize or decompose properly [
11,
13]. Therefore, the raw pyrogas leaving the generator can have up to or above 100 g/Nm
3 sulphur content [
14,
15]. In the case of fixed bedding, descending gas generators, the gasification supplement flows in the same direction with the fresh fuel entering from the top, meaning it descends. Thus, the drying and pyrolysis zones are directly above the oxidation zone. Therefore, they obtain the temperature required for processes through heat transportation. In the oxidation zone, a reaction happens between the products of pyrolysis, mainly gases, and the incoming gasification supplement. The gases leaking from the oxidation zone and the burning biochar in the reduction zone reduces it into CO and H
2. Therefore, it transports part of the temperature of the smoke after the endothermic Boudouard, and water–gas reactions concluded. Due to this, in the reduction zone of the descent gas generators, char remains above the gate, which leaves together with the cinders. In spite of this, among optimal operational conditions, up to 95% of the fuel’s dry mass can be transformed. Pyrolysis gas leaves the reaction area below the gate.
Tar content is usually around 1.0 g/Nm
3. The designing of descent gas generators and the processes happening within them are extremely sensitive to fuel quality, most notably to its water contents [
16,
17,
18]. The entirety of the steam created in the drying zone has to leave through the fuel column, meaning water is not only necessary for transferring the heat required for evaporation but has to reach the temperature of the oxidation zone all the way. Therefore, the endothermic water-gas reactions that happen takes away heat from the oxidation zone, this is why the high water content reduces the oxidation zone’s temperature, necessary for creating the pyrolysis gas [
19,
20,
21]. In the system we propose, the gas made in the drying and pyrolysis zones is refilled into the air entering the system, and this mixture is fed into the system’s reduction zone, this improves the heating efficiency of the gas, its energy content, and we get a tar-free, dry gas. The principal goal of this system, apart from its simplicity, is to oxidize the gases created during the pyrolysis, the first tar transformation, and the regulation of the various gas-biochar reaction (reduction/gasification). We assumed that the tar content of the resulting generator gas could be kept below 25 mg/m
3, which is lower than the requirements of a gas engine, meaning that other gas purification/treatment methods and machinery are unnecessary [
22,
23]. From the perspective of gas quality, the reduction zone is important, in which the non-combustible gases produced in earlier areas, and the carbon dioxide and water flow through the burning biochar in the lower area [
24]. In this zone, char reduces them through further chemical reactions. The endothermic processes take away heat from the environment, and if the ideal temperature of 600 °C–1000 °C temperature is not reached, the quality of produced gas will drop. Carbo-hydrogens start to get released at about 600 °C, and gases are combusted with a visible flame when secondary airflow enters into the fire bed [
25,
26].
During the heat treatment of biomass, a lower temperature should be applied. This process is only the first part of the pyrolysis process (dehydration stage) [
27].
The general reaction of pyrolysis is as follows, the first product of the reaction is (bio)char:
Q is the total amount of heat needed to make the reaction happen.
Its central goal is to produce char, which has more stable, and more advantageous attributes than the original biomass:
Specific energy content is higher,
Resistant to bio-degradation,
Lower volume, easier to contain,
Easier to chip and grind,
Higher specific biochar content.
One disadvantage is that during the process, the original material loses 15–20% of its energy content. The largest change in mass can be seen in the first stages, where the temperature is lower [
28]. Usually, the entire process can be separated into three stages. For example, at 300 °C, hardwood loses about 50% of its entire mass, and gas is created most intensively at a temperature of 250 °C–400 °C. In this stage 20–50% of the material’s mass loss also happens. According to experiences, in the cases of heat treatment on temperatures of 225 °C and 275 °C, the time during which temperature is kept constant does not significantly alter the material’s structure. But on 300 °C, cellulose entirely decomposes, which makes the time of heat treatment significantly different. The biochar produced during pyrolysis has a large amount of micro-and macro-elements, which is why it is useful in keeping its nutrient content, which is easily absorbed by the plants [
29,
30]. The biochar from the plant affects the content of soil’s organic matter, and its agro-chemical attributes. Char from a wooden source increased the soil’s potassium, calcium and magnesium content, this has advantages from the perspectives of nutrient supply and soil improvement [
31,
32]. During soil improvement, using 1.0 tons of biomass, we can drive 0.6–0.8 tons of biochar into the soil, which equals to a carbon-dioxide grounding of 2.2–2.9 tons [
33,
34]. With the improvement in adsorption, the grounding capacity of soil also improves. The biochar mixed into soil has high porosity, which makes it the basis for advantageous conditions to soil-inhabiting fungi and micro-organisms by offering a further area of existence and protection against carnivores, and helping the symbiotic relations between soil, plant, and microbe be created [
35].
The size of the biomass grains affects the carbonization times, and the reaction capacity [
36]. Even within the material, hemicellulosic, cellulose, lignin, and different grain sizes affect the process of pyrolysis. Concerning this, high heating speed is not necessarily the same as high reaction speed, but there is a complex relation between thermal hysteresis and the propelling from various heating speeds [
19,
37]. Within slow heating systems, decreasing grain size increases activation energy, which can be attributed to the shape of the molecules [
38]. Size causes mass exchange limits when transporting volatile materials, and in inter-particular heat gradient reactions causing tar decomposition. The size of wood molecules, their shape and reduction, and the external heat exchange conditions all have a considerable effect on the resulting product.
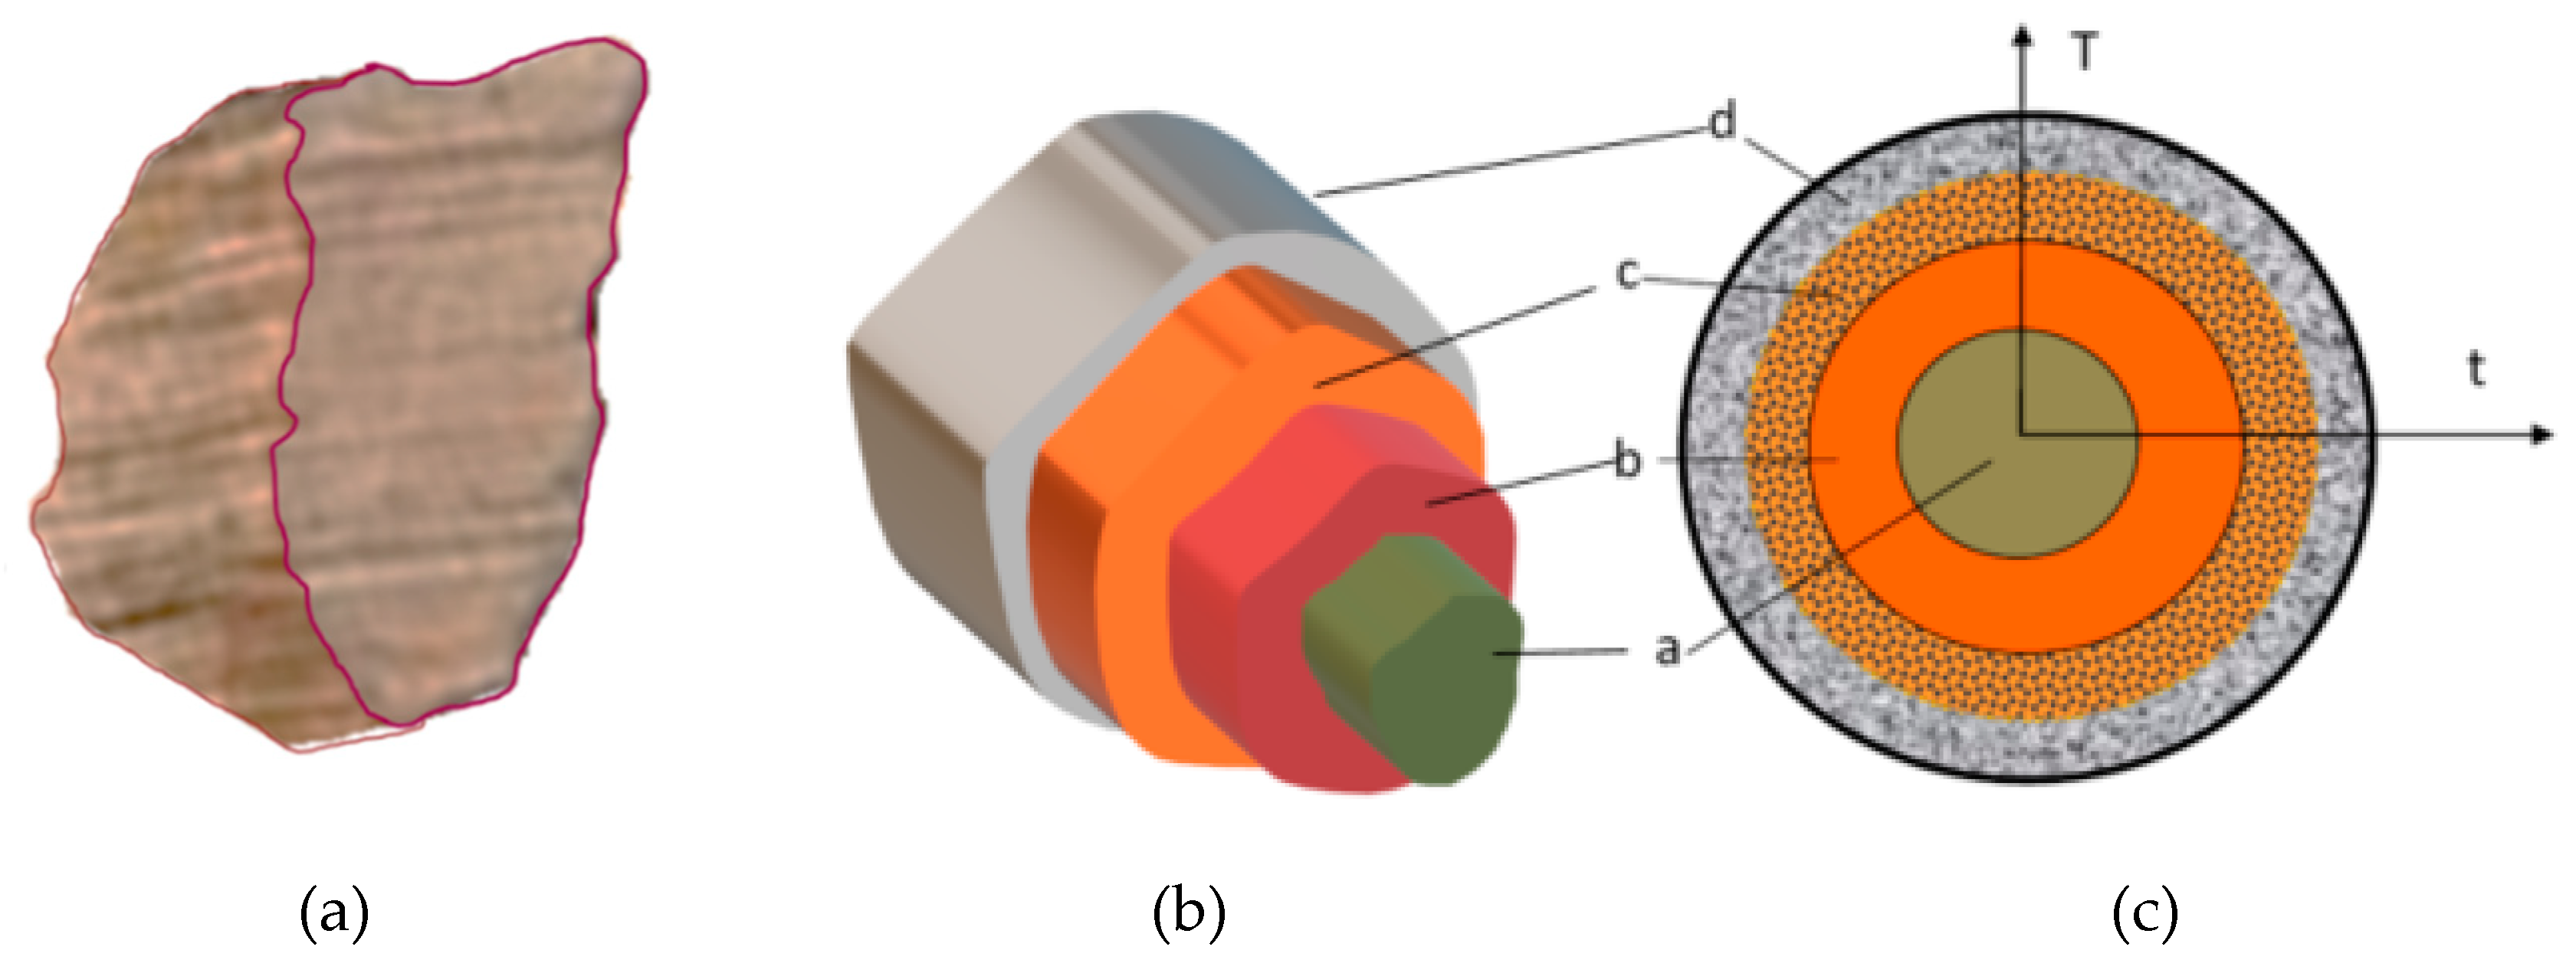
If we look at grain, its geometric layers (irregular block, tube, sphere, etc.) have “similar processes”, as in the entirety of the material within the pyrolysis reactor (
Figure 1).
Heat energy flows into the molecules via heat exchange most notably. By the heat and heat flow taken in by the material causes the exothermal secondary reactions to affecting decomposition. However, conventional heat flowing out due to the exit of volatile materials blocks ascending heat. A part of the volatile materials can be forced back, which causes further chemical reactions. The size of the grains mainly determines all this. The actual process of the pyrolysis or lack thereof is dependent on the different densities, and the temperature of the given point in the system. The latter is defined by mid-products, and different behaviour [
39,
40], this is why there are regulations in place for the level of chipping for chipped biomass (whether we’re talking about combustion or pyrolysis). By chipping the biomass, the size of pieces reduces, but the entire surface area of the chips increases. The dimensions of chips can be arranged into a size classification (according to ÖNORM M7133), but we can also draw a spread function by the mass or size of the various classes. As for chipping, we must know that it has a high energy requirement. According to Kick (1885) [
41], the energy requirement is dependent on the logarithm of chips before (
x0) and after (
xn) chipping, and the
ka factor of the material (which is given by the materials’ solidity factor).
If we measure the energy required during the chipping of air-dry material, we can calculate the ka value for the given material. (The attributes affect the level of decomposition, its time, and other factors. The most notable are: Moisture content (%); ratio of contents (C, N, O, S, Cl, etc.); energy content (MJ/kg); density (kg/m3); cinders (°C melting point); carbonization, and reaction capacity in light of temperature).
In order to increase the efficiency of pyrolysis and the hydrogen gas production, new firing techniques and input materials have emerged in new research trends. Technological experiments on co-pyrolysis and charcoal gasification are the most successful based on the relevant literature. Successful experiments have been carried out at Perugia University to improve the material structure and increase the efficiency of gas generation, where 20% glycerol is added to the biomass pellet to increase gas generation [
42]. At the same university research center, a pyrolysis unit or steam gasification plant has been developed that produces hydrogen from charcoal with very high efficiency (hydrogen concentration was 58.26%). The advantage of using charcoal instead of biomass in the gasification process is to reduce tar content also [
43]. The above two experimental programs demonstrate the importance of the heat of reaction and physical structure of the material in the pyrolysis gas generation process. Our experiments have also demonstrated the importance of the material structure in the pyrolysis process in the small fixed bedding pyrolysis units. These should also be taken into account when designing the units of the prototype. Different physical structures and ingredients, as well as low and high temperatures, have different gasification periods (degradation times). In the case of hardwood biomass, we were looking for a functional relationship to describe the process (we found the correlation for several materials, but for reasons of scope we only show the 50 mm structure of the hardwood).
2. Materials and Methods
The international standards were used for the operation of the part of the pyrolysis process, and the necessary measurements were determined according to international standards. In this short scientific communication, the entire measurement system is not detailed.
About the basic measurement conditions:
Briefly, in the course of the experiments, we examined the internal characteristics of 8 different materials, 20–25% initial moisture content, 30 mm and 50 mm shredding before thermal decomposition (C; O; H; N; W%, ash). Knowing these, we placed the materials in the measuring unit. Heating of the inserted material set was carried out with an inert gas (N) at 300 and 600 °C, which was provided by an electric heating cartridge in front of the grating. The temperature was measured at 4 equal heights starting from the beginning of the heating. We measured the change in the weight of the material—with the help of a precision scale—as a function of time (with 10 s period). The amount and pressure of the inert gas under the time unit has not changed.
The main elements of the test system can be described as follows. For determining the relation between temperature and mass change, we usually employ the simplest of thermo-analytic methods, thermogravimetry (TG) [
44]. Within the thermo-gravimetry apparatus (TGA—IKA-WERKE C2000 calorimeter), there is a precision scale, on which the material (the sample) can be placed within a heated furnace. The electric-programmed apparatus records how the mass changes by the temperature. It is fundamental to keep the sample on a consistent temperature, for which usually, a particular sensor (DSC—ELEMENETAR VARIO X element analyzer, Elementar Analysensysteme GmbH, Langenselbold, Germany) measures and controls electric performance. International literature-conducted measurements gave the basis for a three-phase separation. As such, Dhaundiyal-Singh (2016) [
45] as
- (a)
Loss of moisture content (drying);
- (b)
Evaporation of volatile substances, and gas production;
- (c)
Gas production and carbonization.
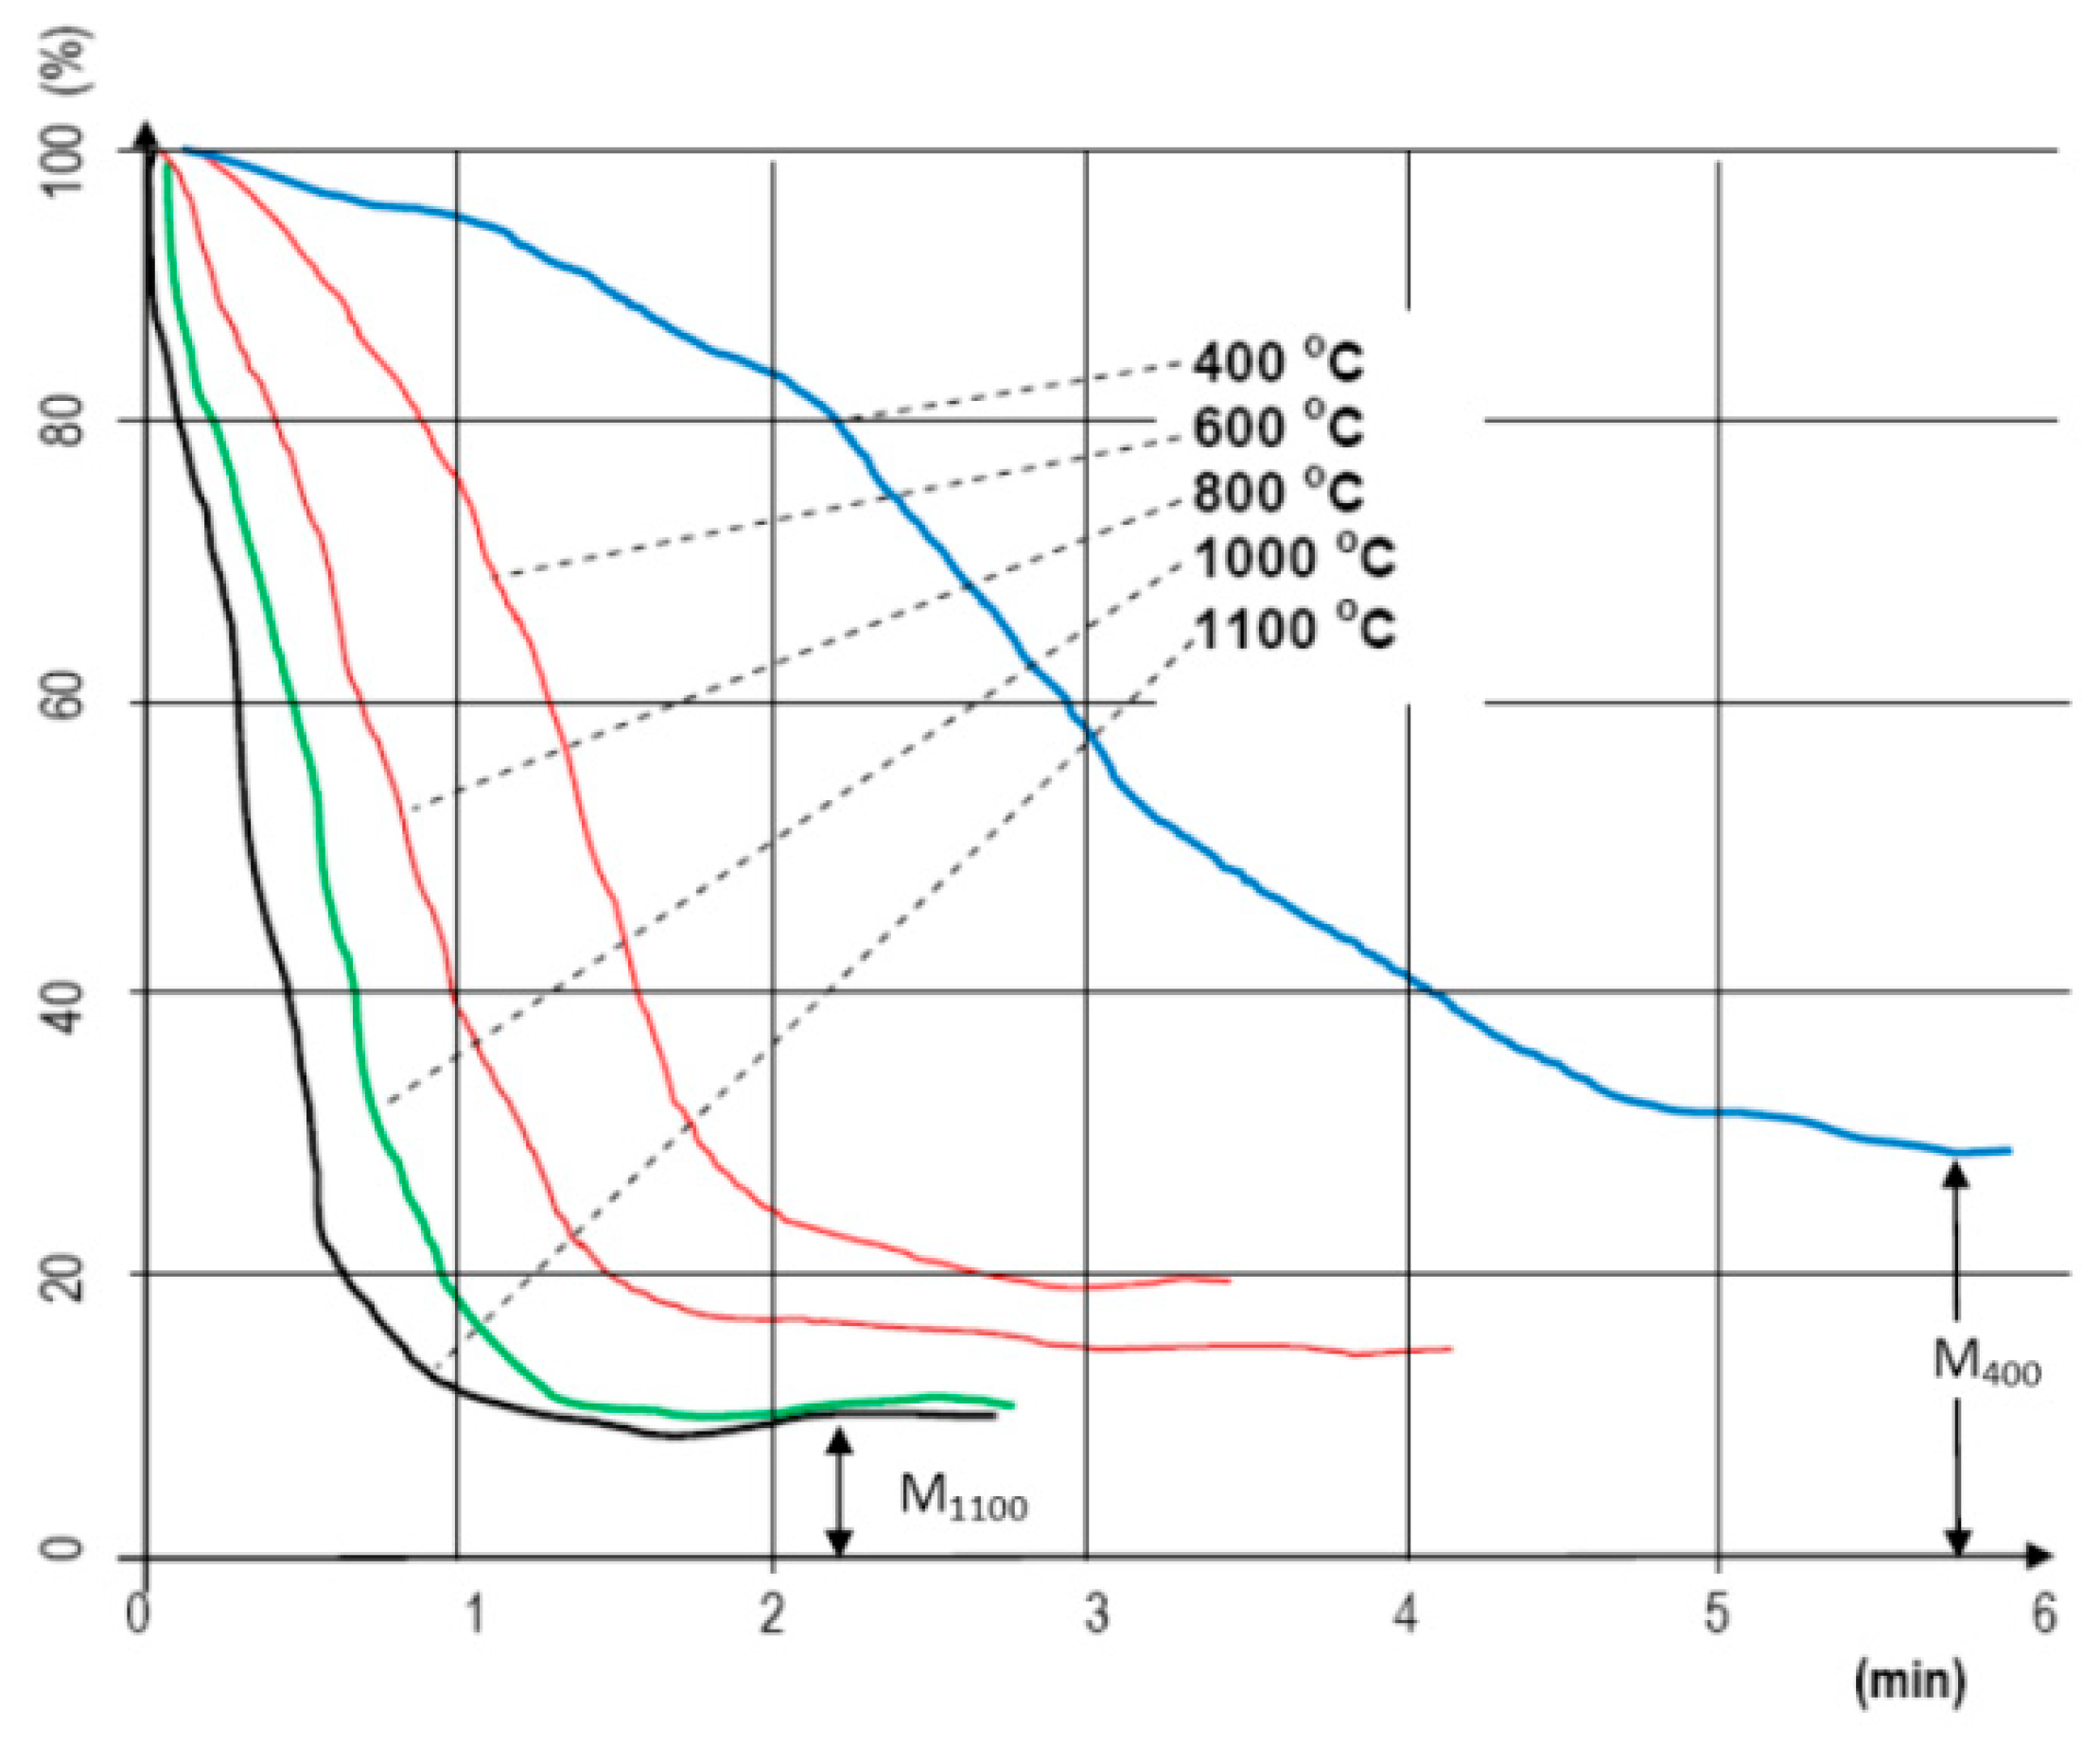
When analyzing small laboratory samples, the effects of temperature levels on mass change were measured by time (
Figure 2). For this measurement set, 10 g of material was placed into the apparatus for each conducted measurement, and the structure was not important. The style of our recorded curves shows how the increase in temperature affected the decrease in mass by time. It is important to note that on a higher temperature, due to the lower moisture content, the so-called drying phase technically “does not even exist”. The material goes through a “heat shock”, and because of it, almost immediately gets rid of its moisture (we used the METTLER TOLEDO meter, Mettler-Toledo Process Analytics Inc., Columbus, OH, USA). The velocity of mass decrease “follows” the heating temperature almost consistently [
32]. Due to the small sample mass, the analysis of the structure was not solved.
Fixed Bedding System Design
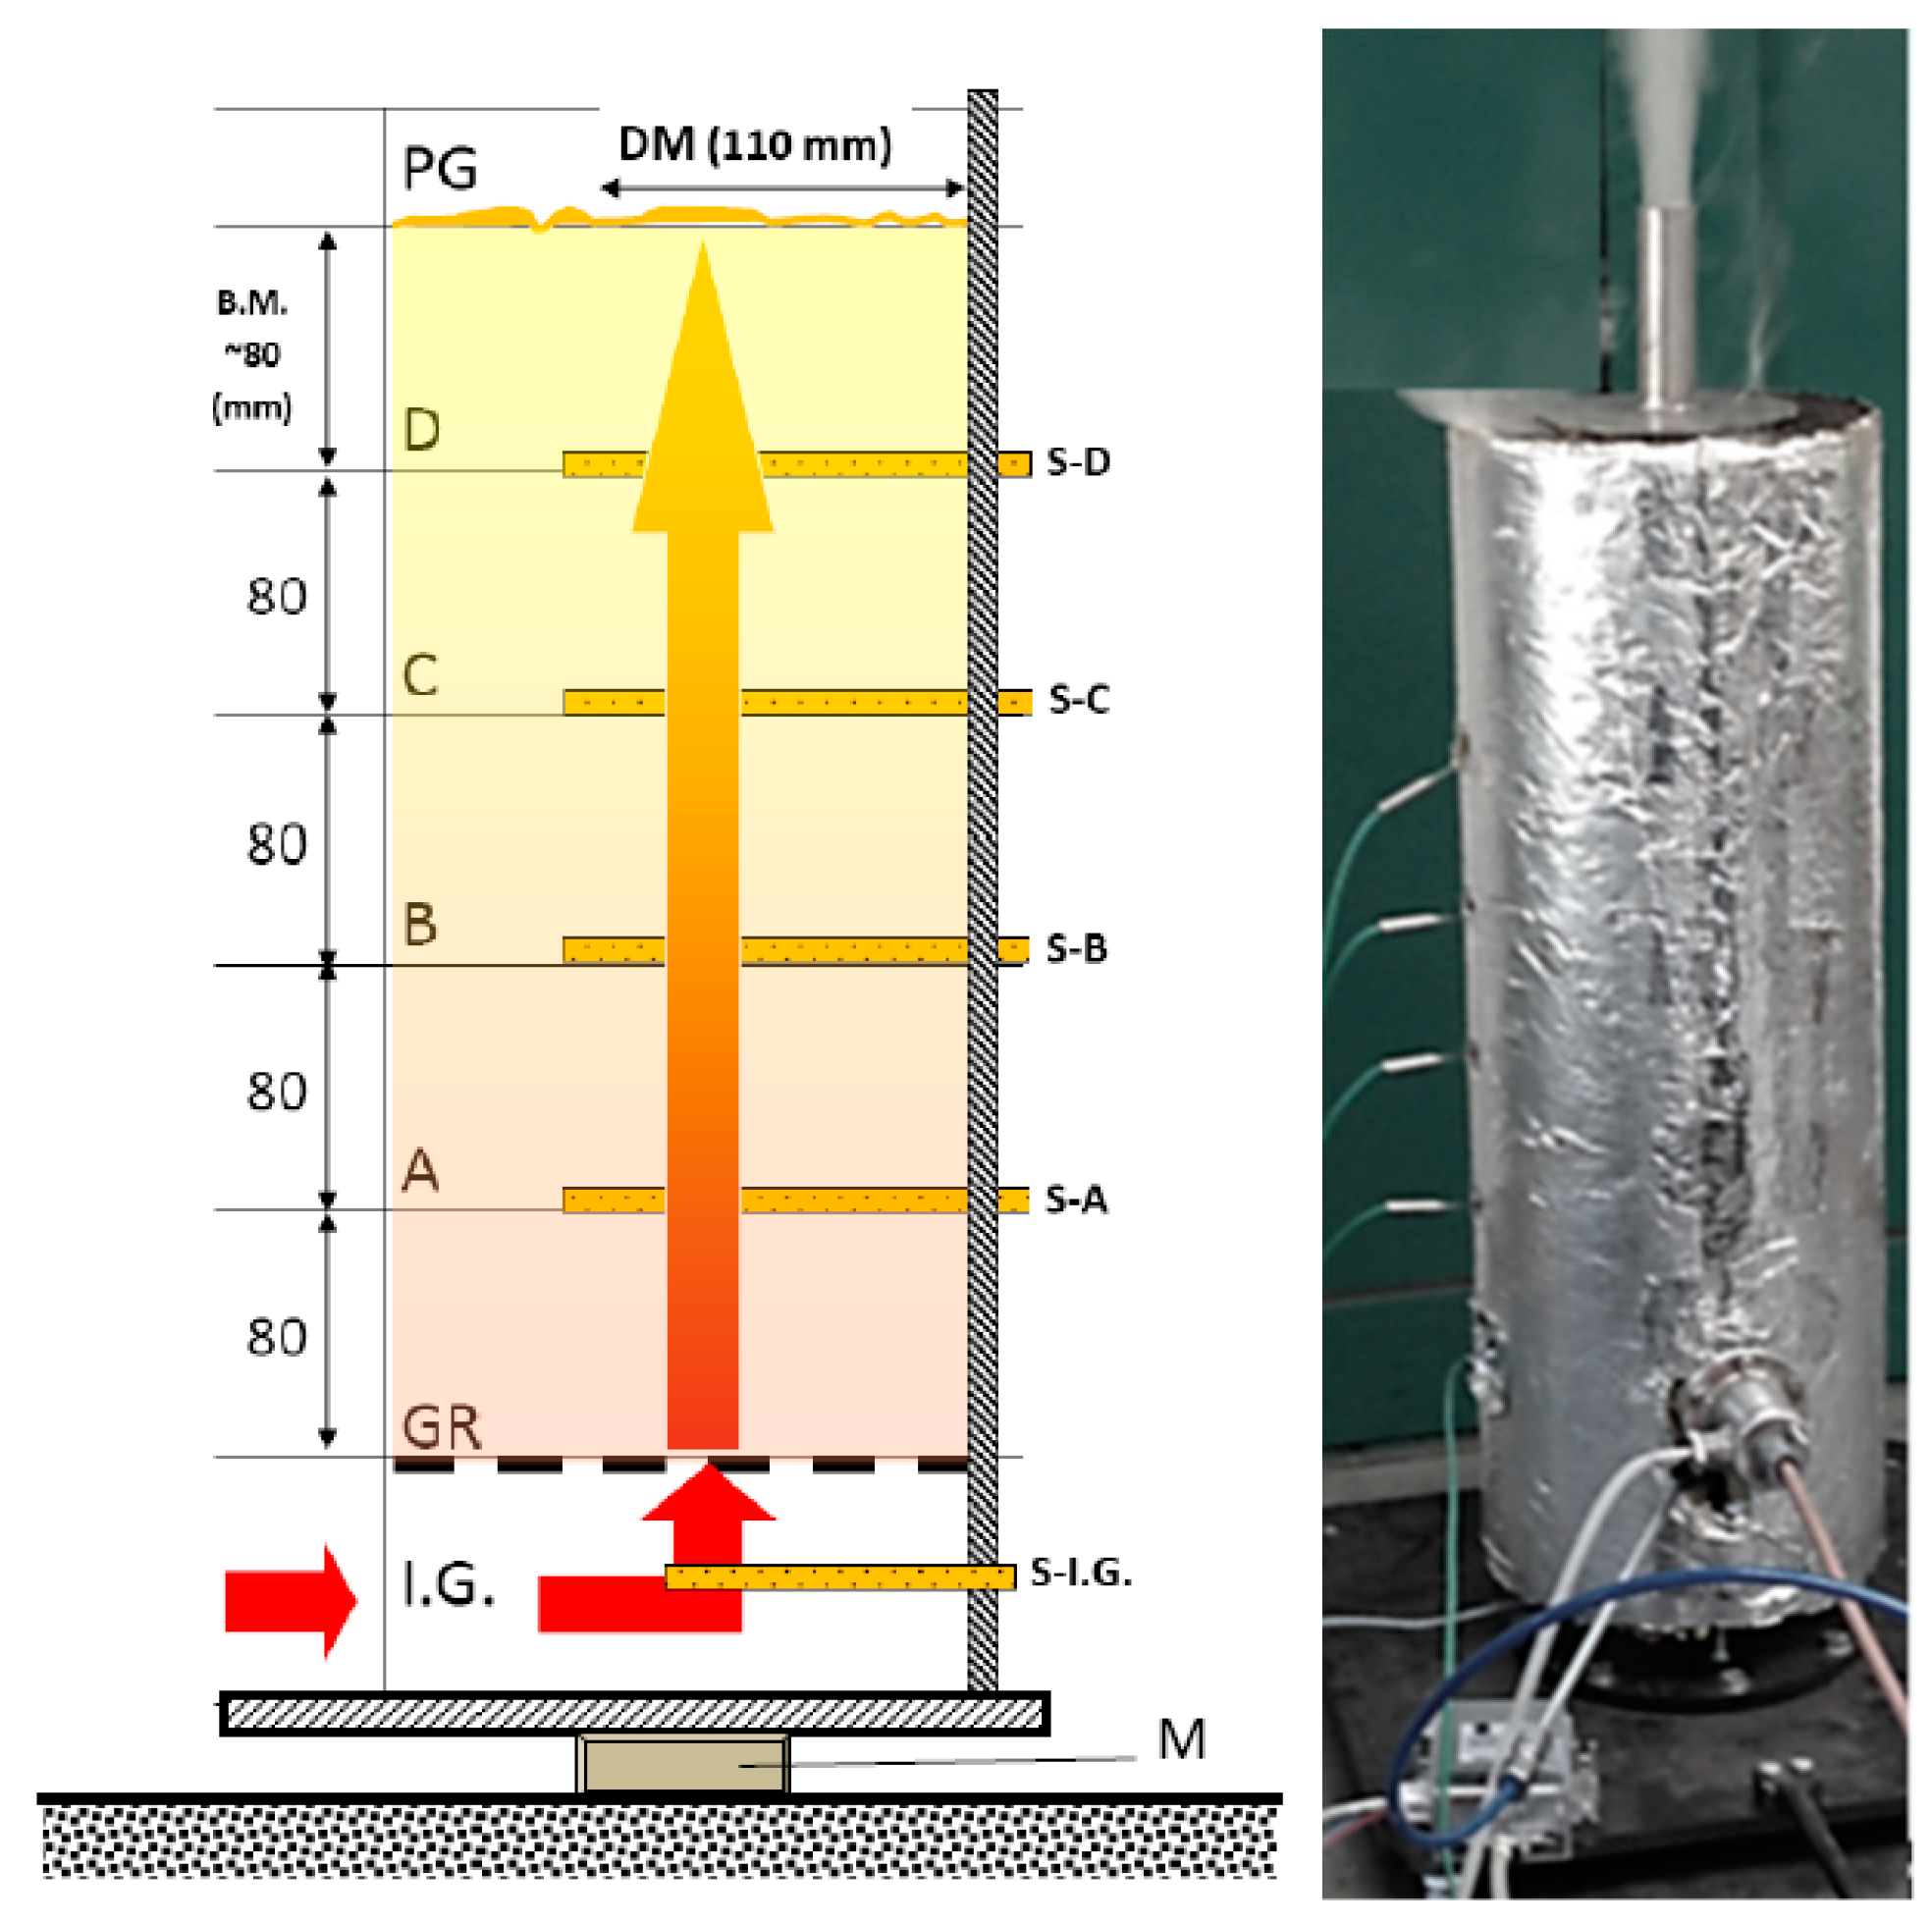
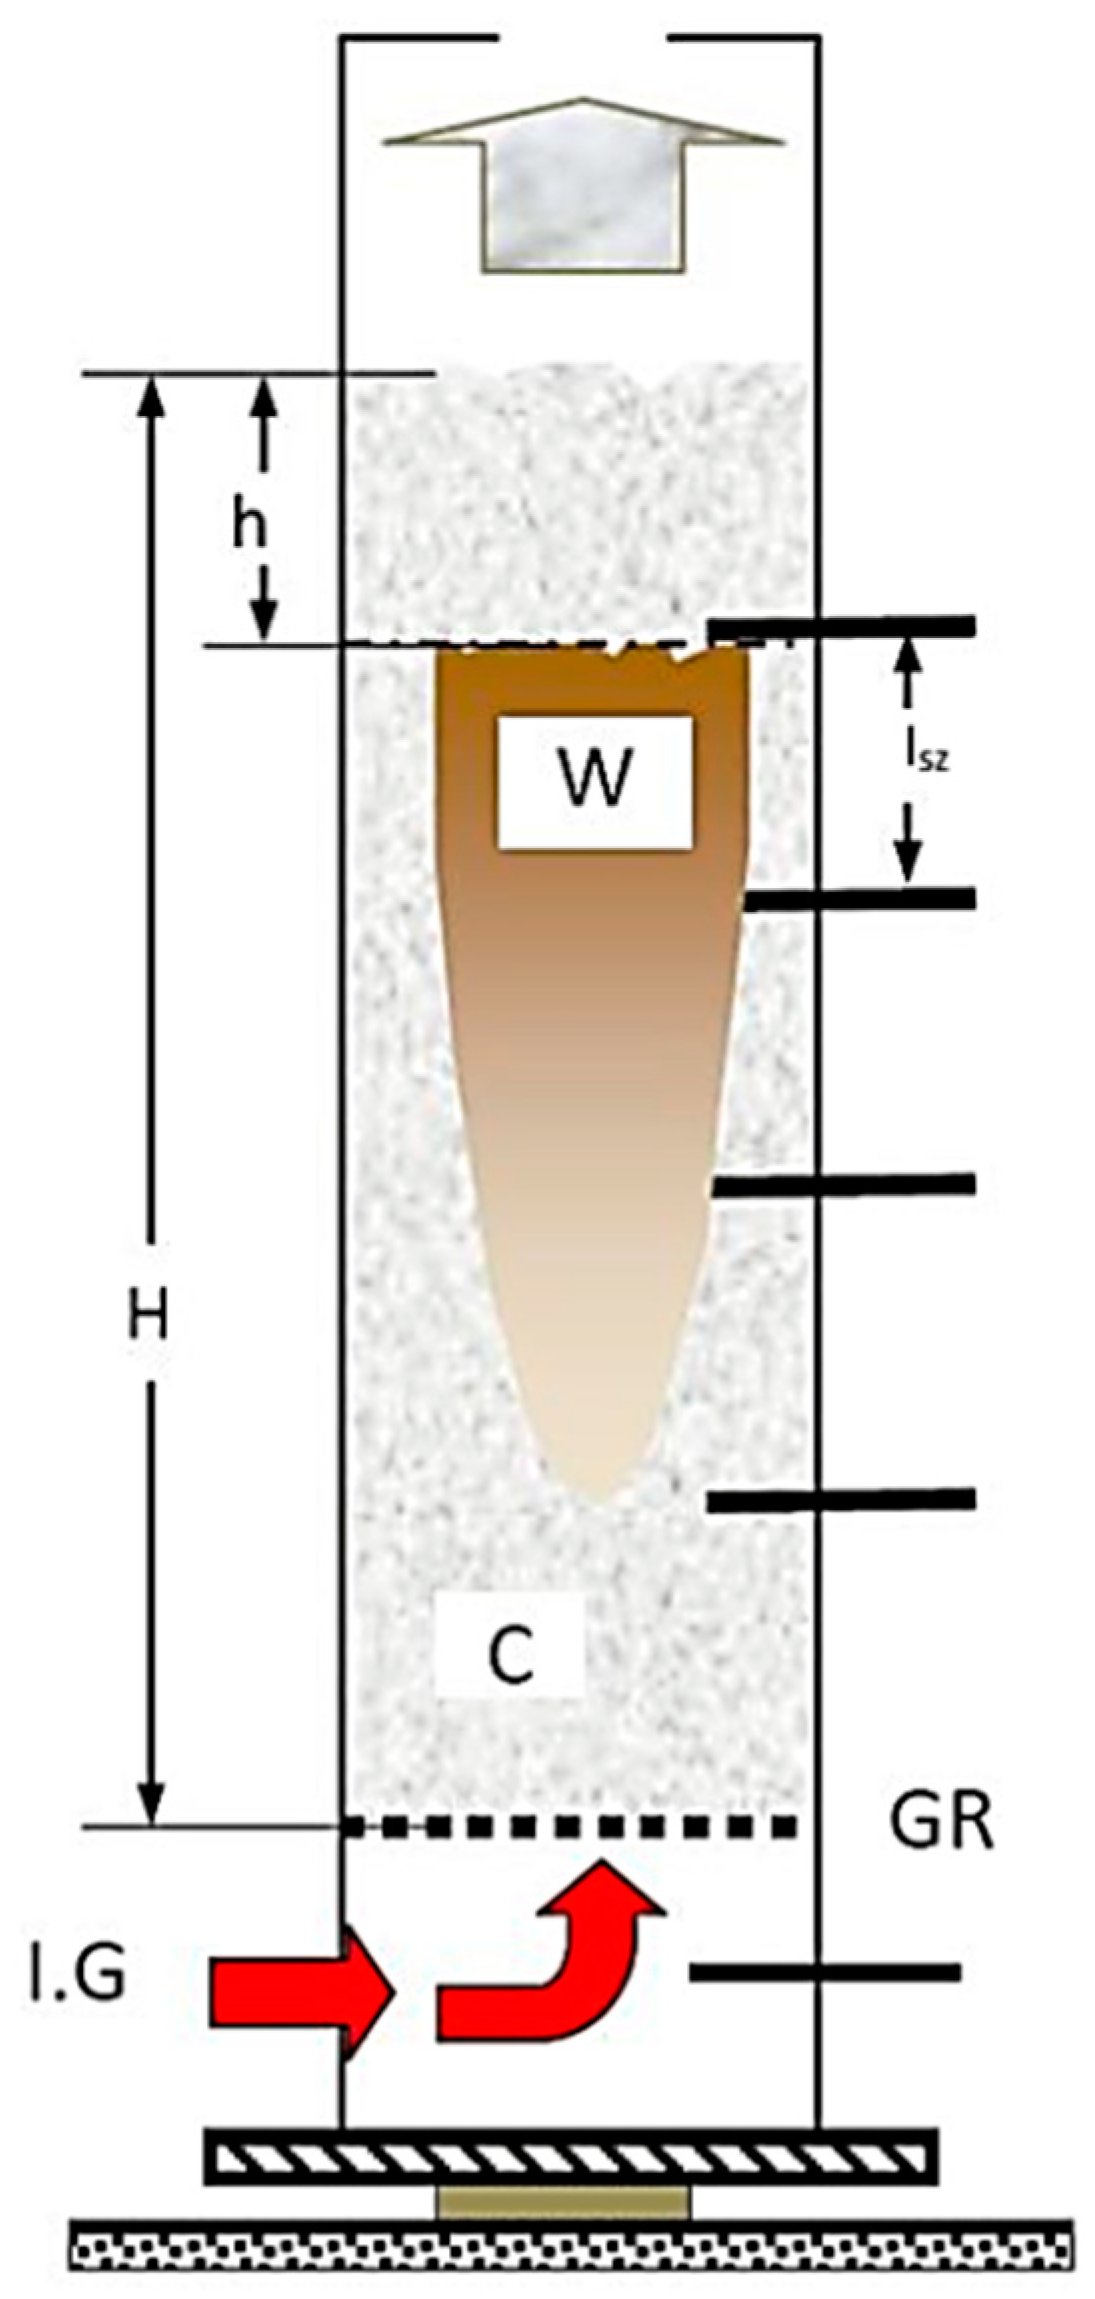
Designing the experimental fixed bedding system was the first step of the process. The unit developed for the heat-technical attributes of material masses. From the perspective of the construct we wish to create (pyrolysis generator), it is imperative to understand the processes that conclude for material masses. The drying, temperature-flow and gas-flow attributes within fixed bedding reactors are important efficiency indicators for the construct. To model, and measure the reactor attributed, we’ve developed a so-called laboratory large sample gasification apparatus (
Figure 3). The wall of the reactor is made up of a 110 mm, well-insulated steel pipe, which is placed on a precision, torsion scale cell. The mass of the material loaded into the reactor pipe varied between 350 and 700 g, by the mass density of the material. The heat energy required for gasification was offered by a 2000 W electric heat canister, which was controlled by our self-developed system. There were K-type heating elements on the side of the reactor perpendicular to its longer axis, reaching through the side wall. The one in the lowest position was directly behind the heating canister, which offers feedback to the controller, to make sure heating is consistent. Going higher, there were four more heating elements, to an equal distance from each other. We used these to measure the temperature’s spread throughout the material mass by time. Through the heating canister, nitrogen gas was driven into the reactor zone with a pressure controller, which made sure there was an inert atmosphere within. The resulting product gas was lead towards an analysis apparatus, then towards the exhaust torch. We used the previously mentioned precision scale fastened beneath the gasification apparatus to measure the mass change of the material by time and make a timeline. Gas production was determined by weight loss.
3. Results
We conducted analyses with various agri- and sylvicultural waste materials. As an example, we introduce the evaluation and said evaluation’s research method using hardwood chips’ results. We also conducted the analytical experiments of the material. During the measurements, we obtained huge excel databases (800–1400 rows for each calculation, for a 10 s data collection).
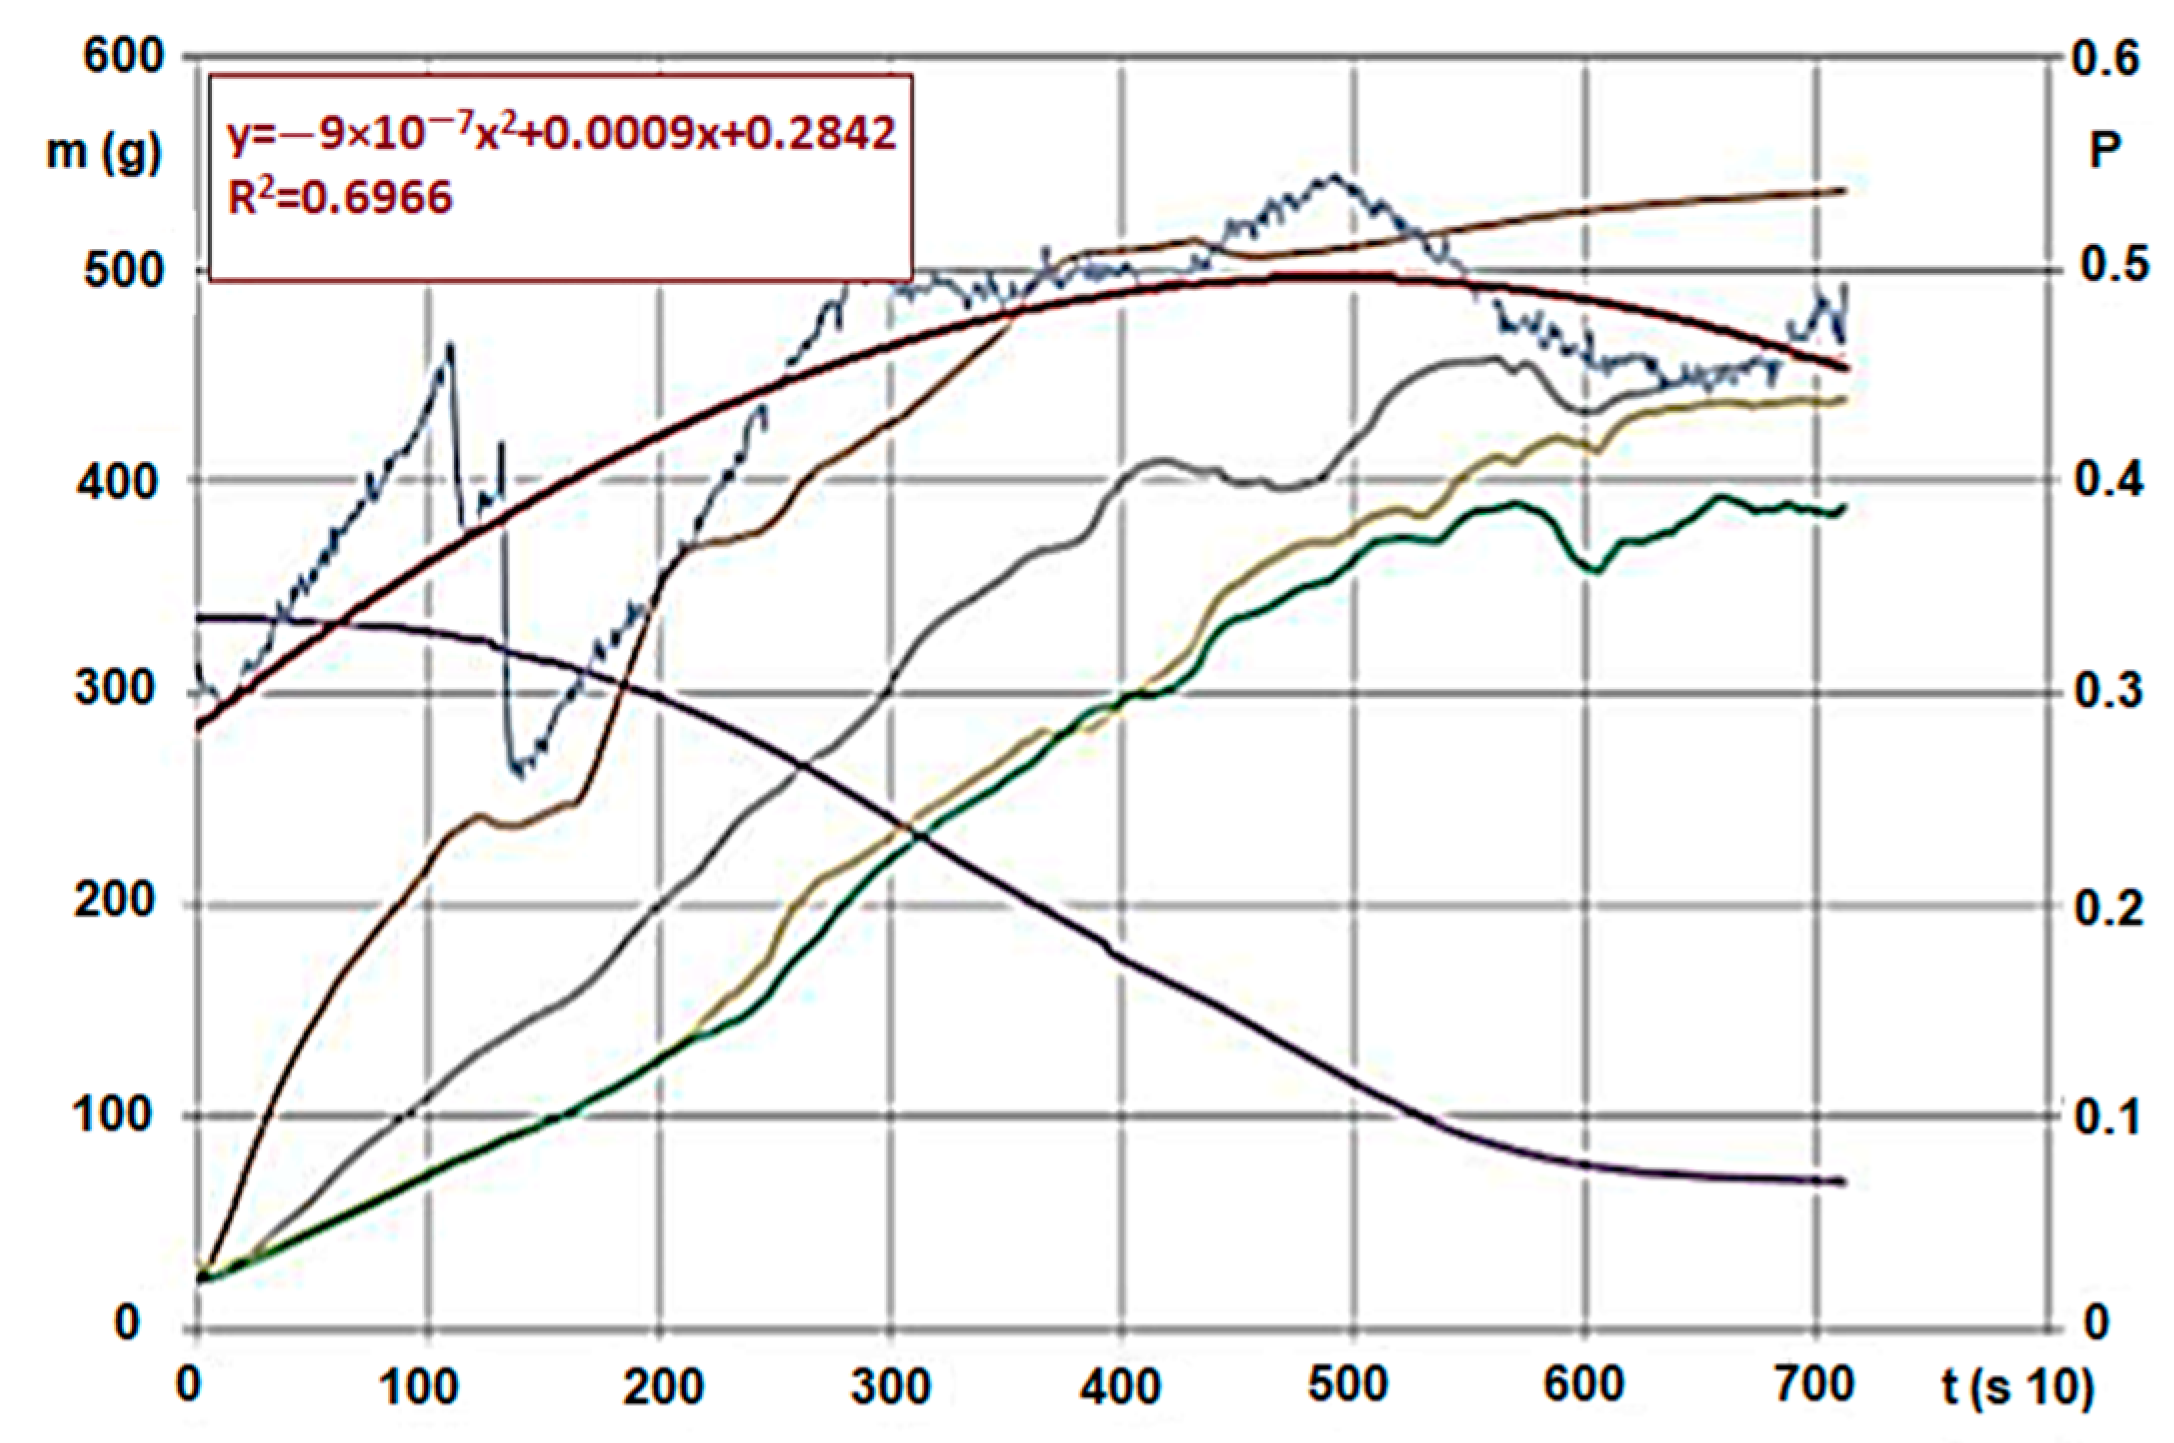
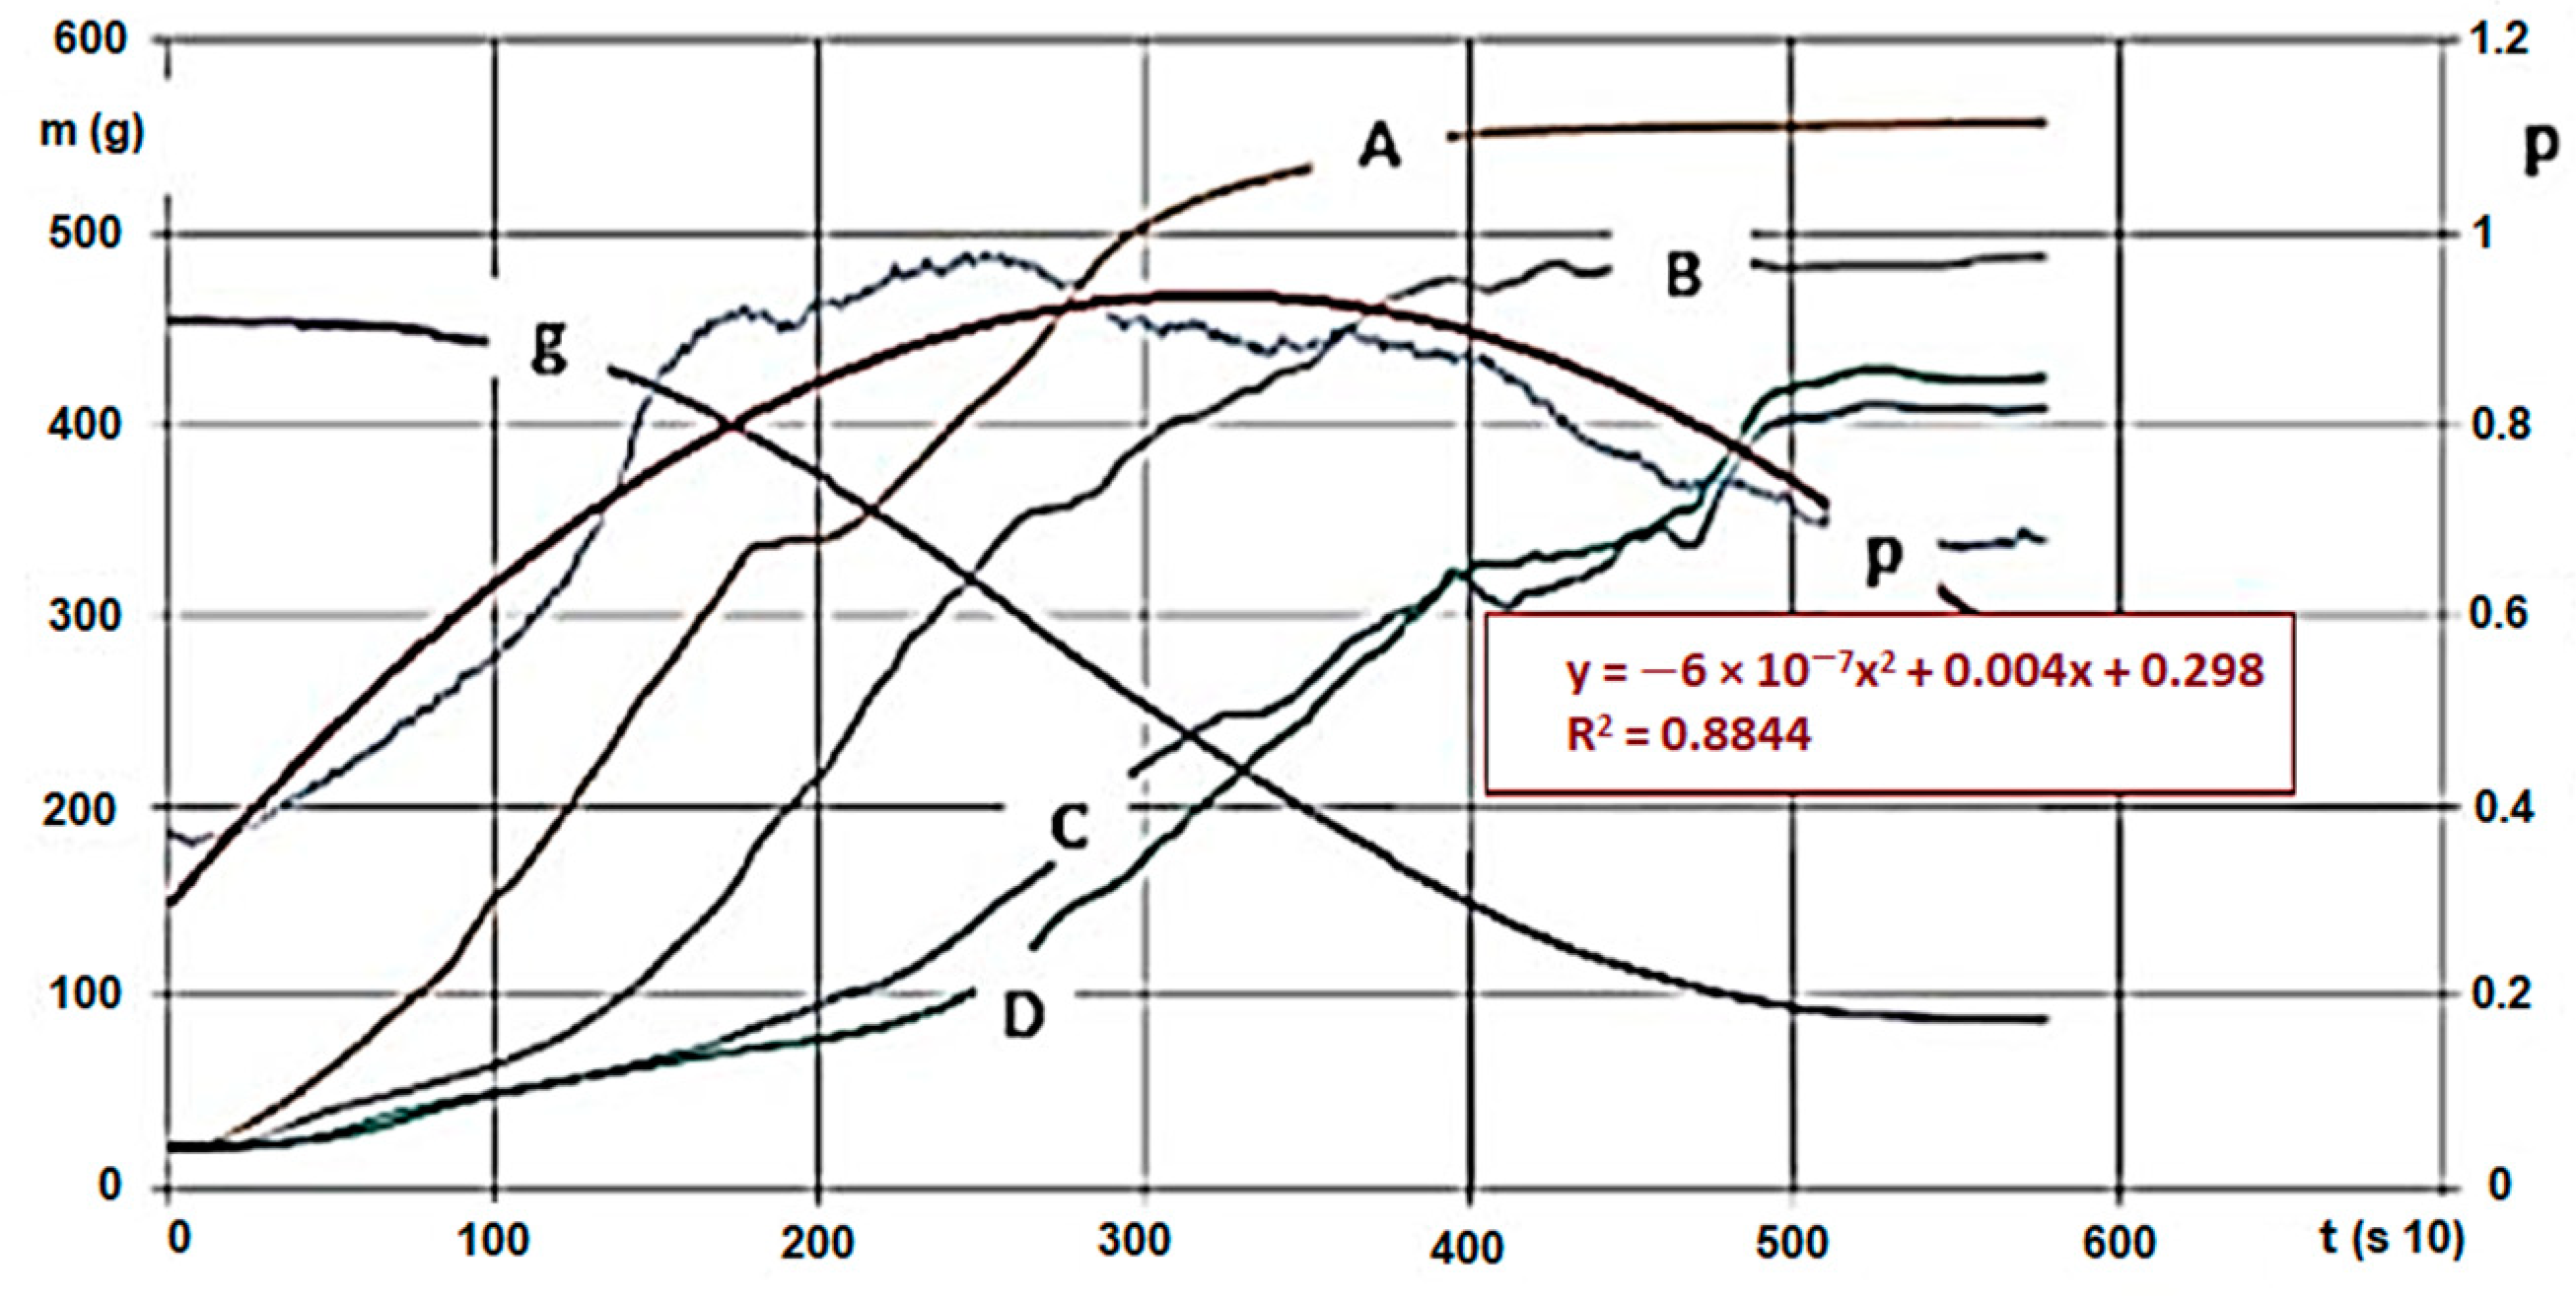
Figure 4 and
Figure 5 show the following by time: hardwood chips’ (G30 and G50) mass decrease and temperature change within the material column during carbonisation, and inert and pyrolysis gas’s pressure, heat and mass values due to gap volume change (the latter ones were measured below the GR area). The high-pressure nitrogen canister fed the gas into the zone after the heating unit on constant pressure and mass flow. The sensor there measured the changing values for the entire carbonisation cycle, by time. Measurement parameters (in
Figure 4):
The inert gas flow (litre/min) didn’t change with time during measurements (MF5712 Rotameter). We regulated the temperature within the I.G. zone to a constant value, using electric energy delivered into the heating canister.
We usually saw a significant change for various materials (we measured eight different ones) when the temperature of the estimated entirety of the material volume went over 100 °C, meaning in every layer, the steam and gas production began (active pyrolysis). Layers A and B carbonised intensively, and the smaller grains in the material reduced in size even further, the layer density reduced, which made the internal flow resistance even smaller. This also resulted in a pressure reduction, which finally stopped on 0.5–1.0 mbar. At this point, the entire mass was carbonized, and “fell into itself”, which often caused a shorter pressure wave. The level pressure increase at 400 °C for both fractions showed that unlike expectations, G30 and G50 materials showed no pressure difference. Taking the pressure values from prior figures,
Figure 6 shows the differences (which are more significant here).
3.1. Attributes of Mass Change Due to the Temperature in the Material Pillar
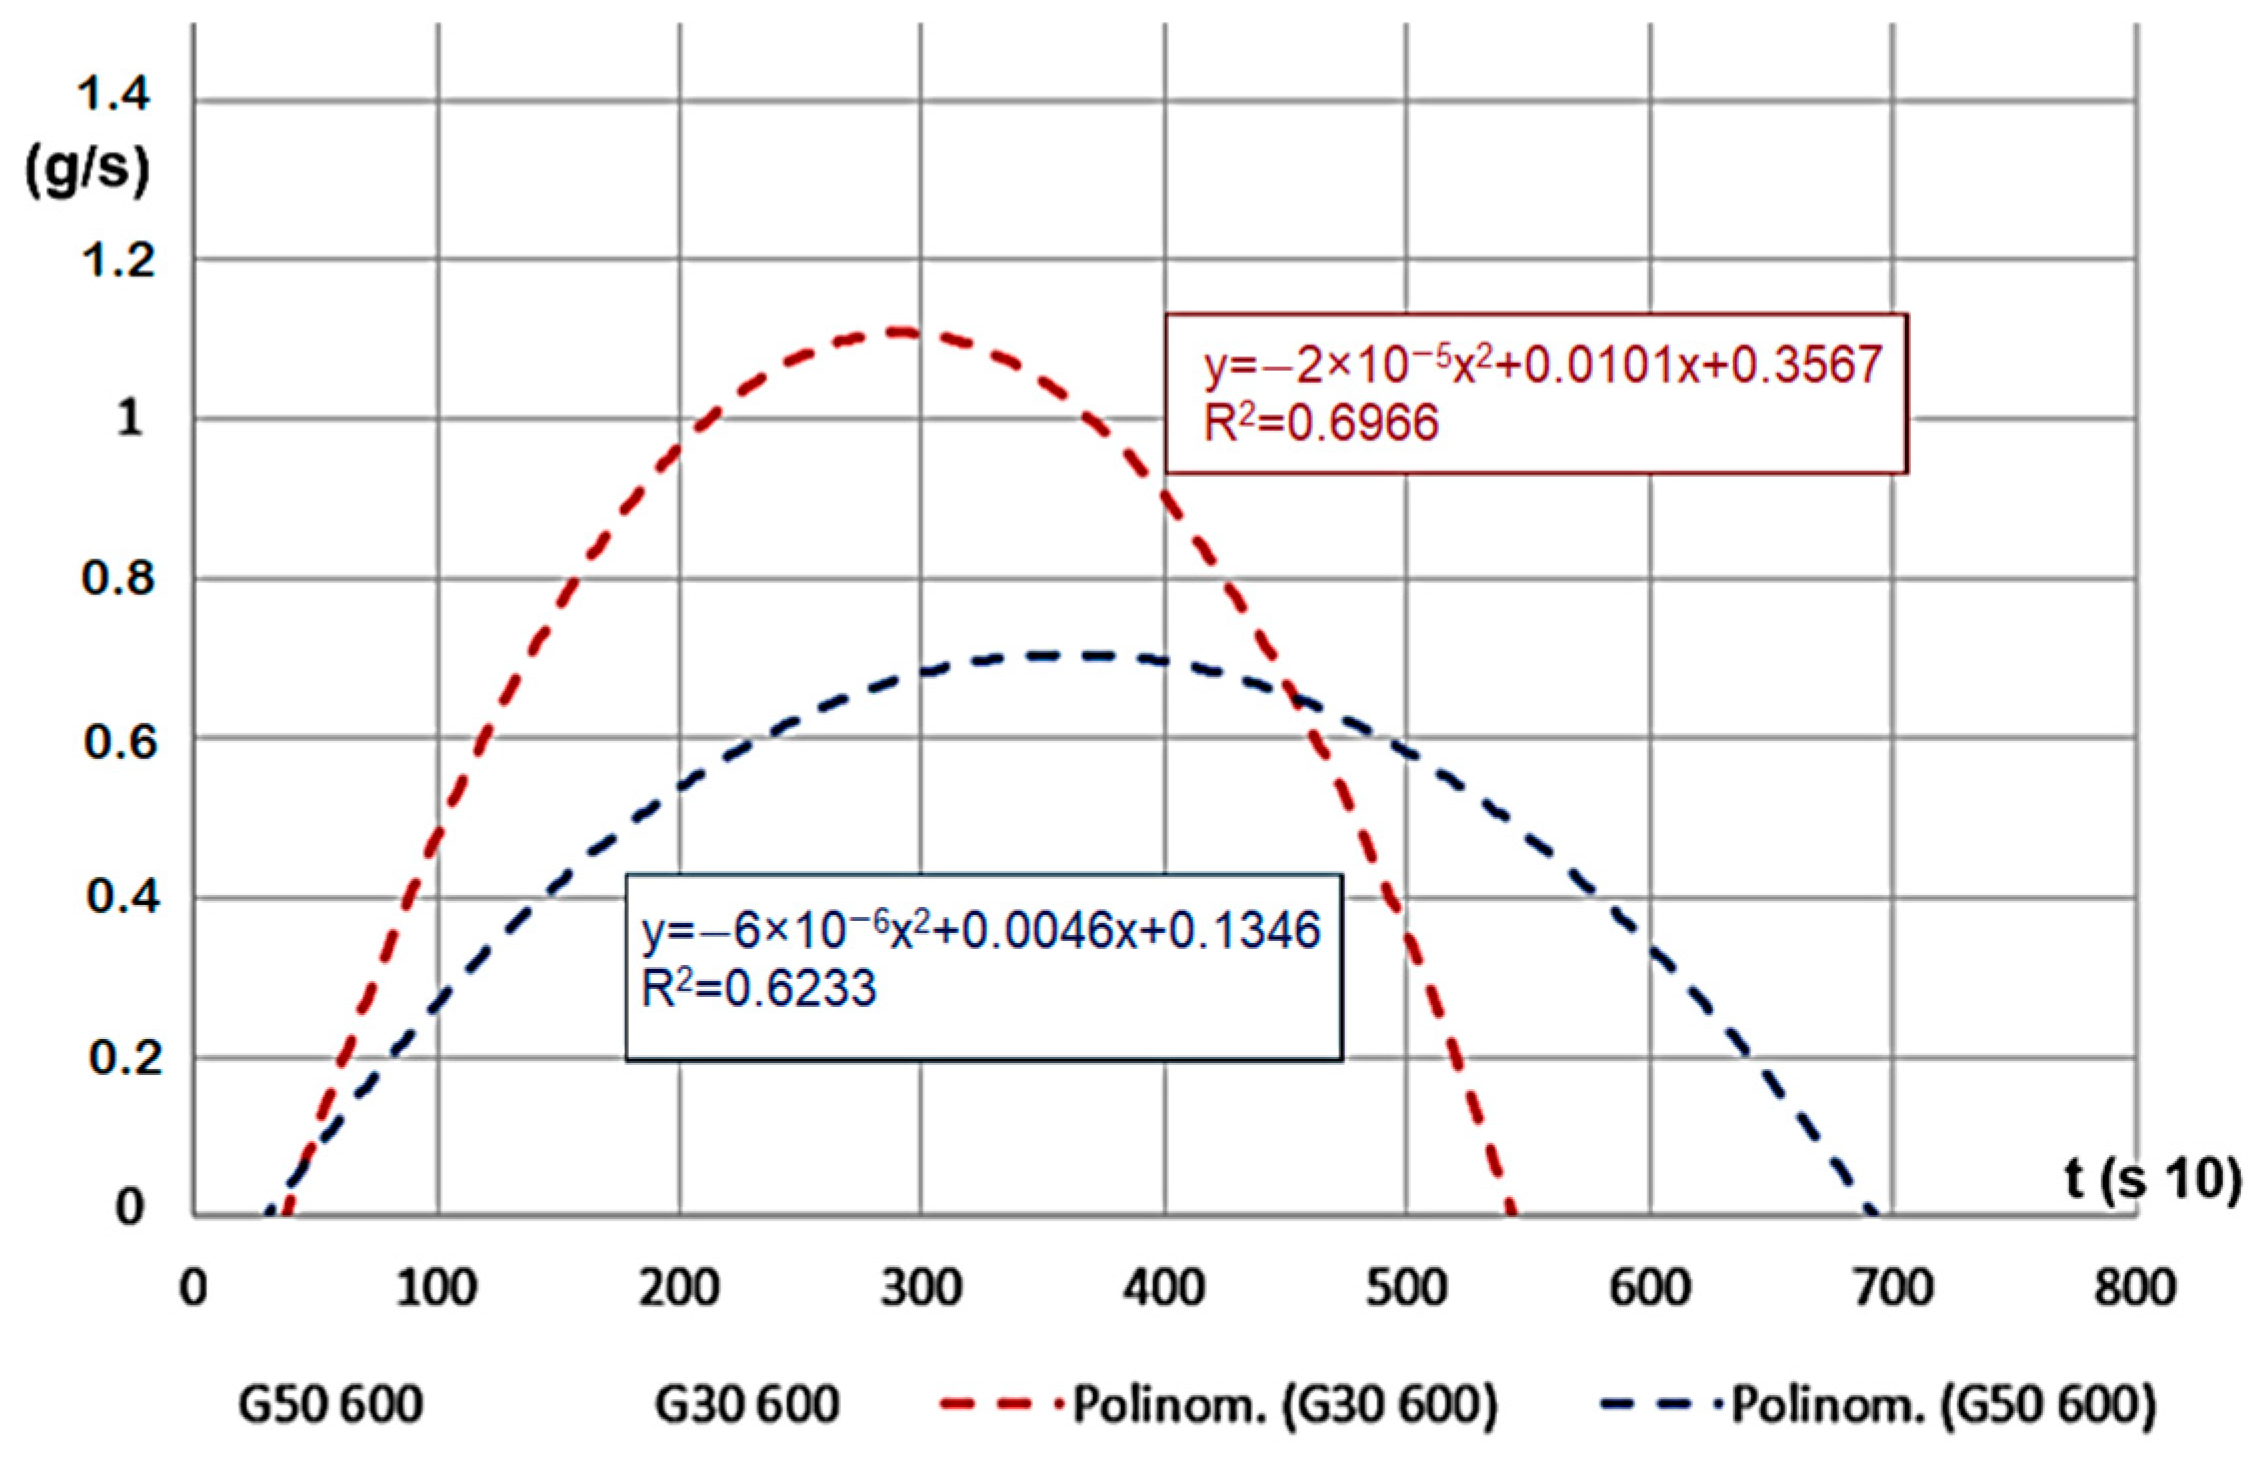
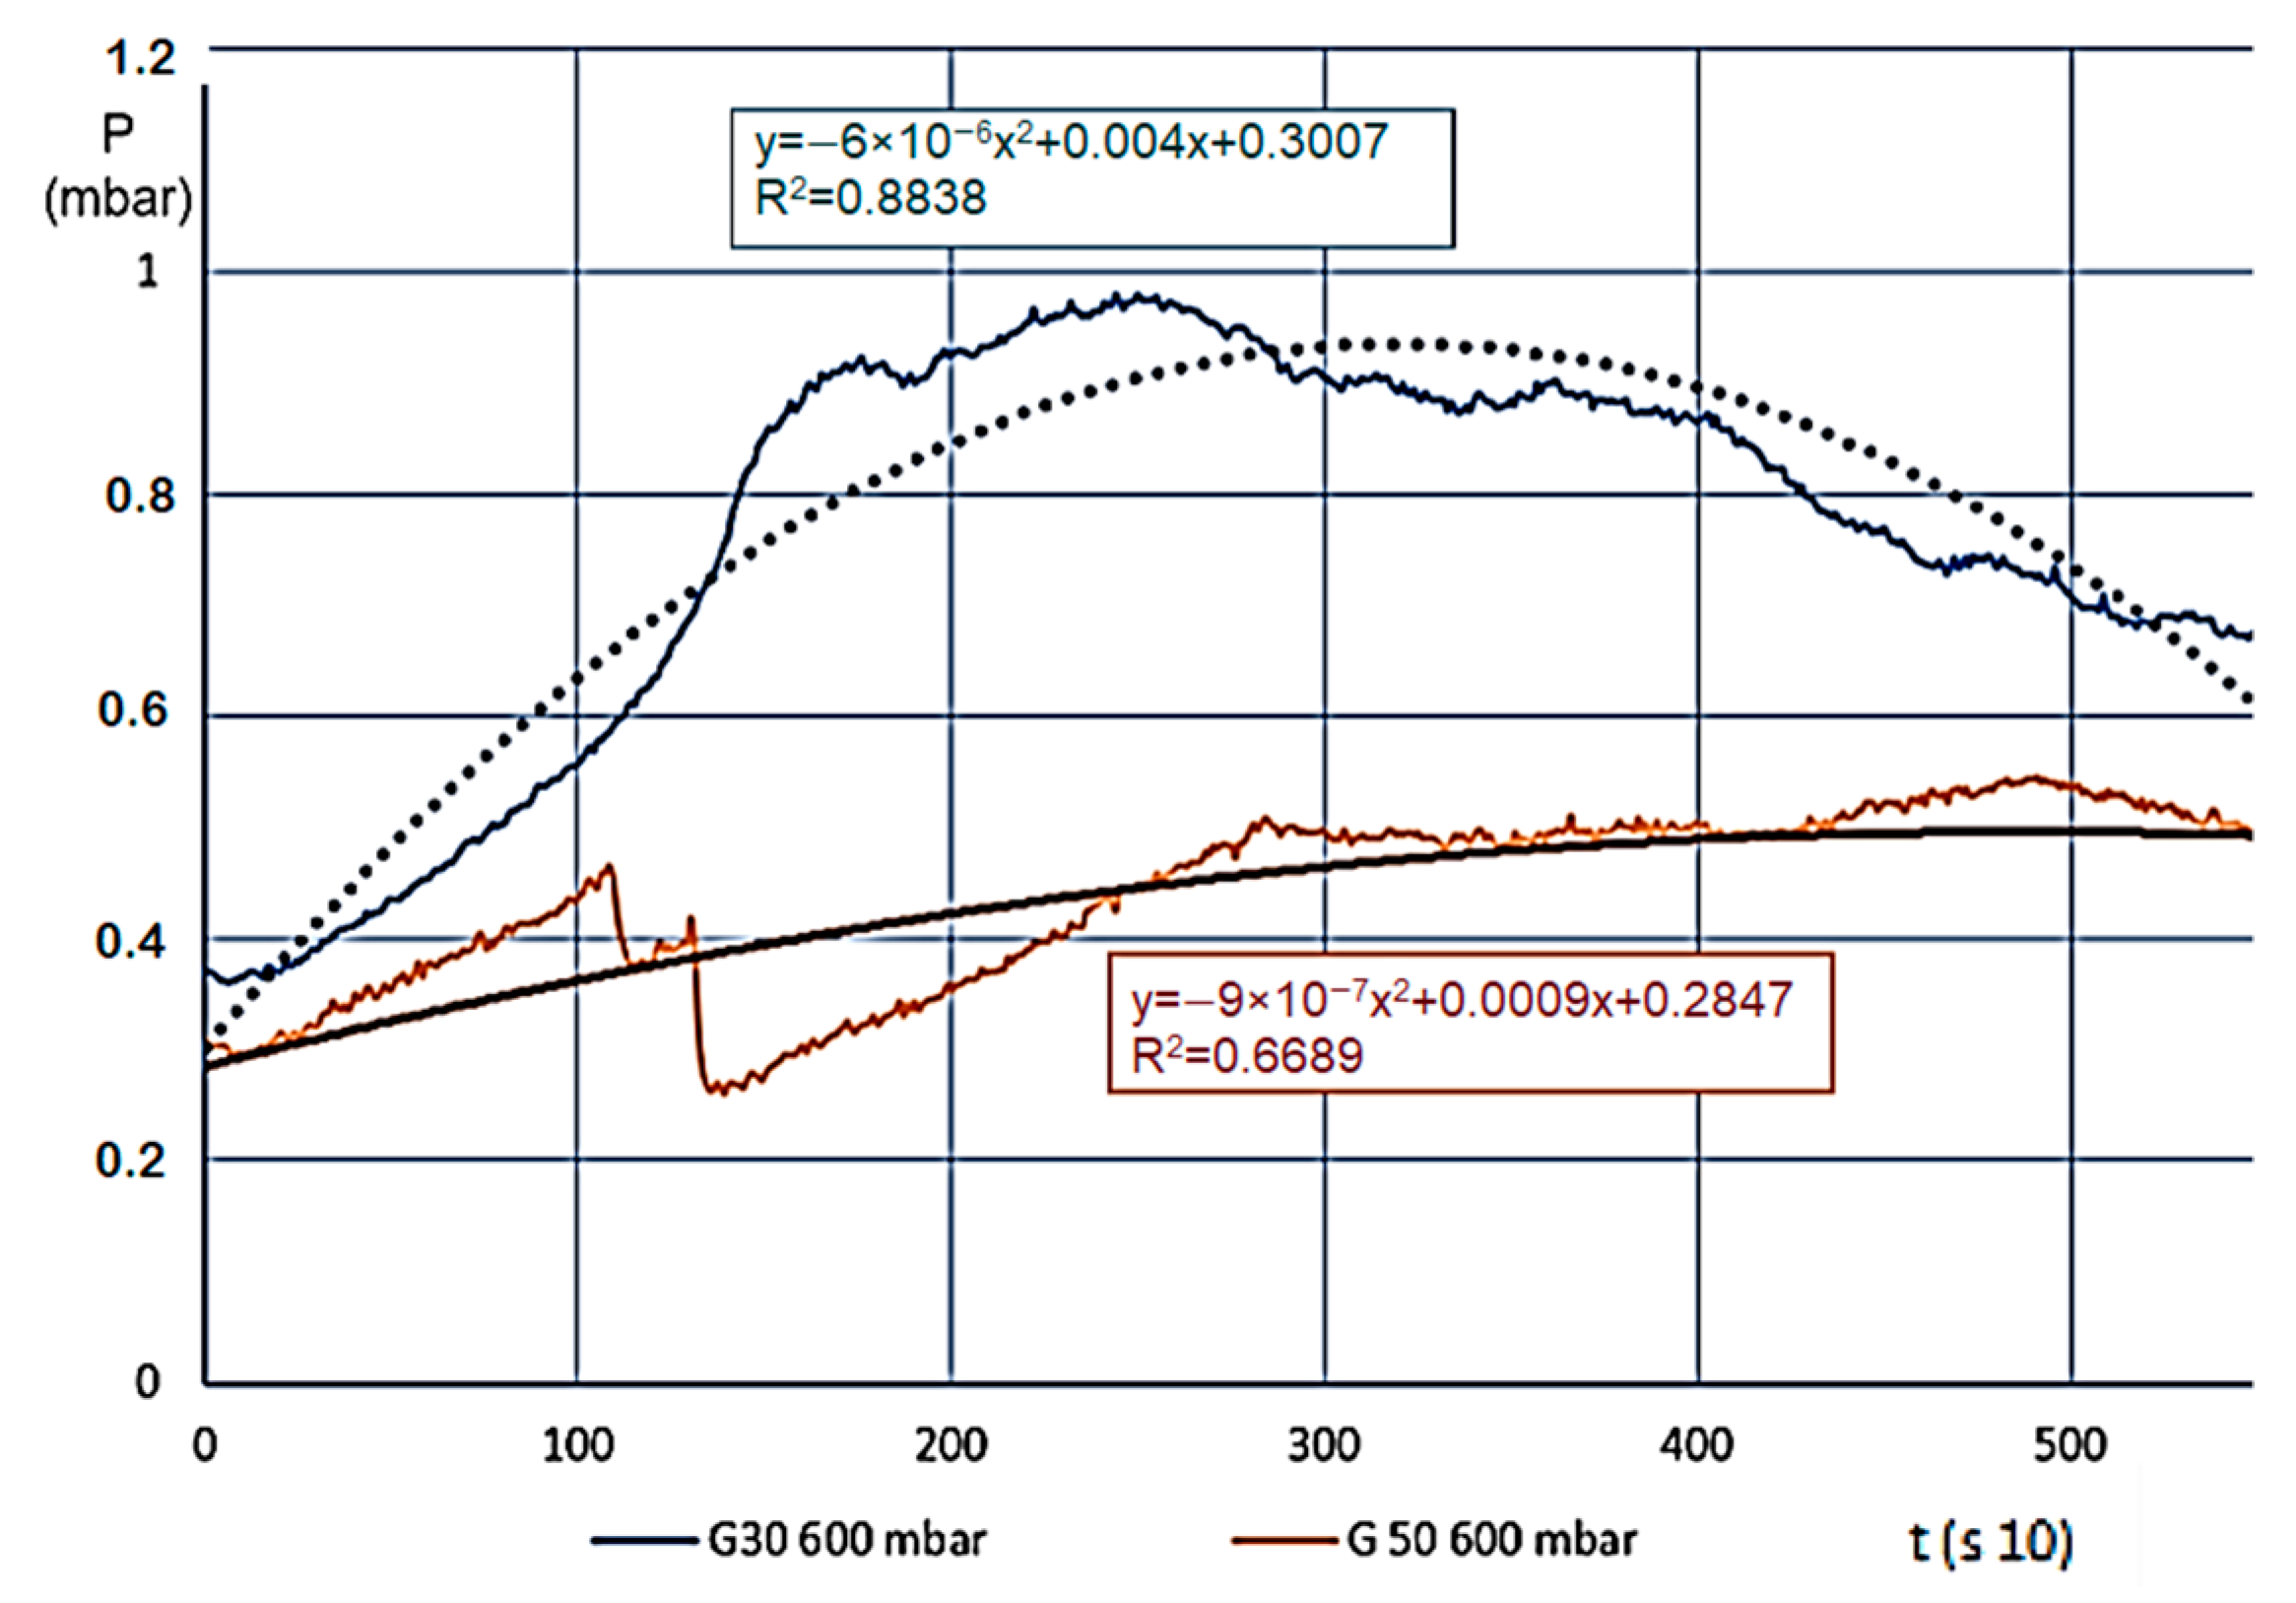
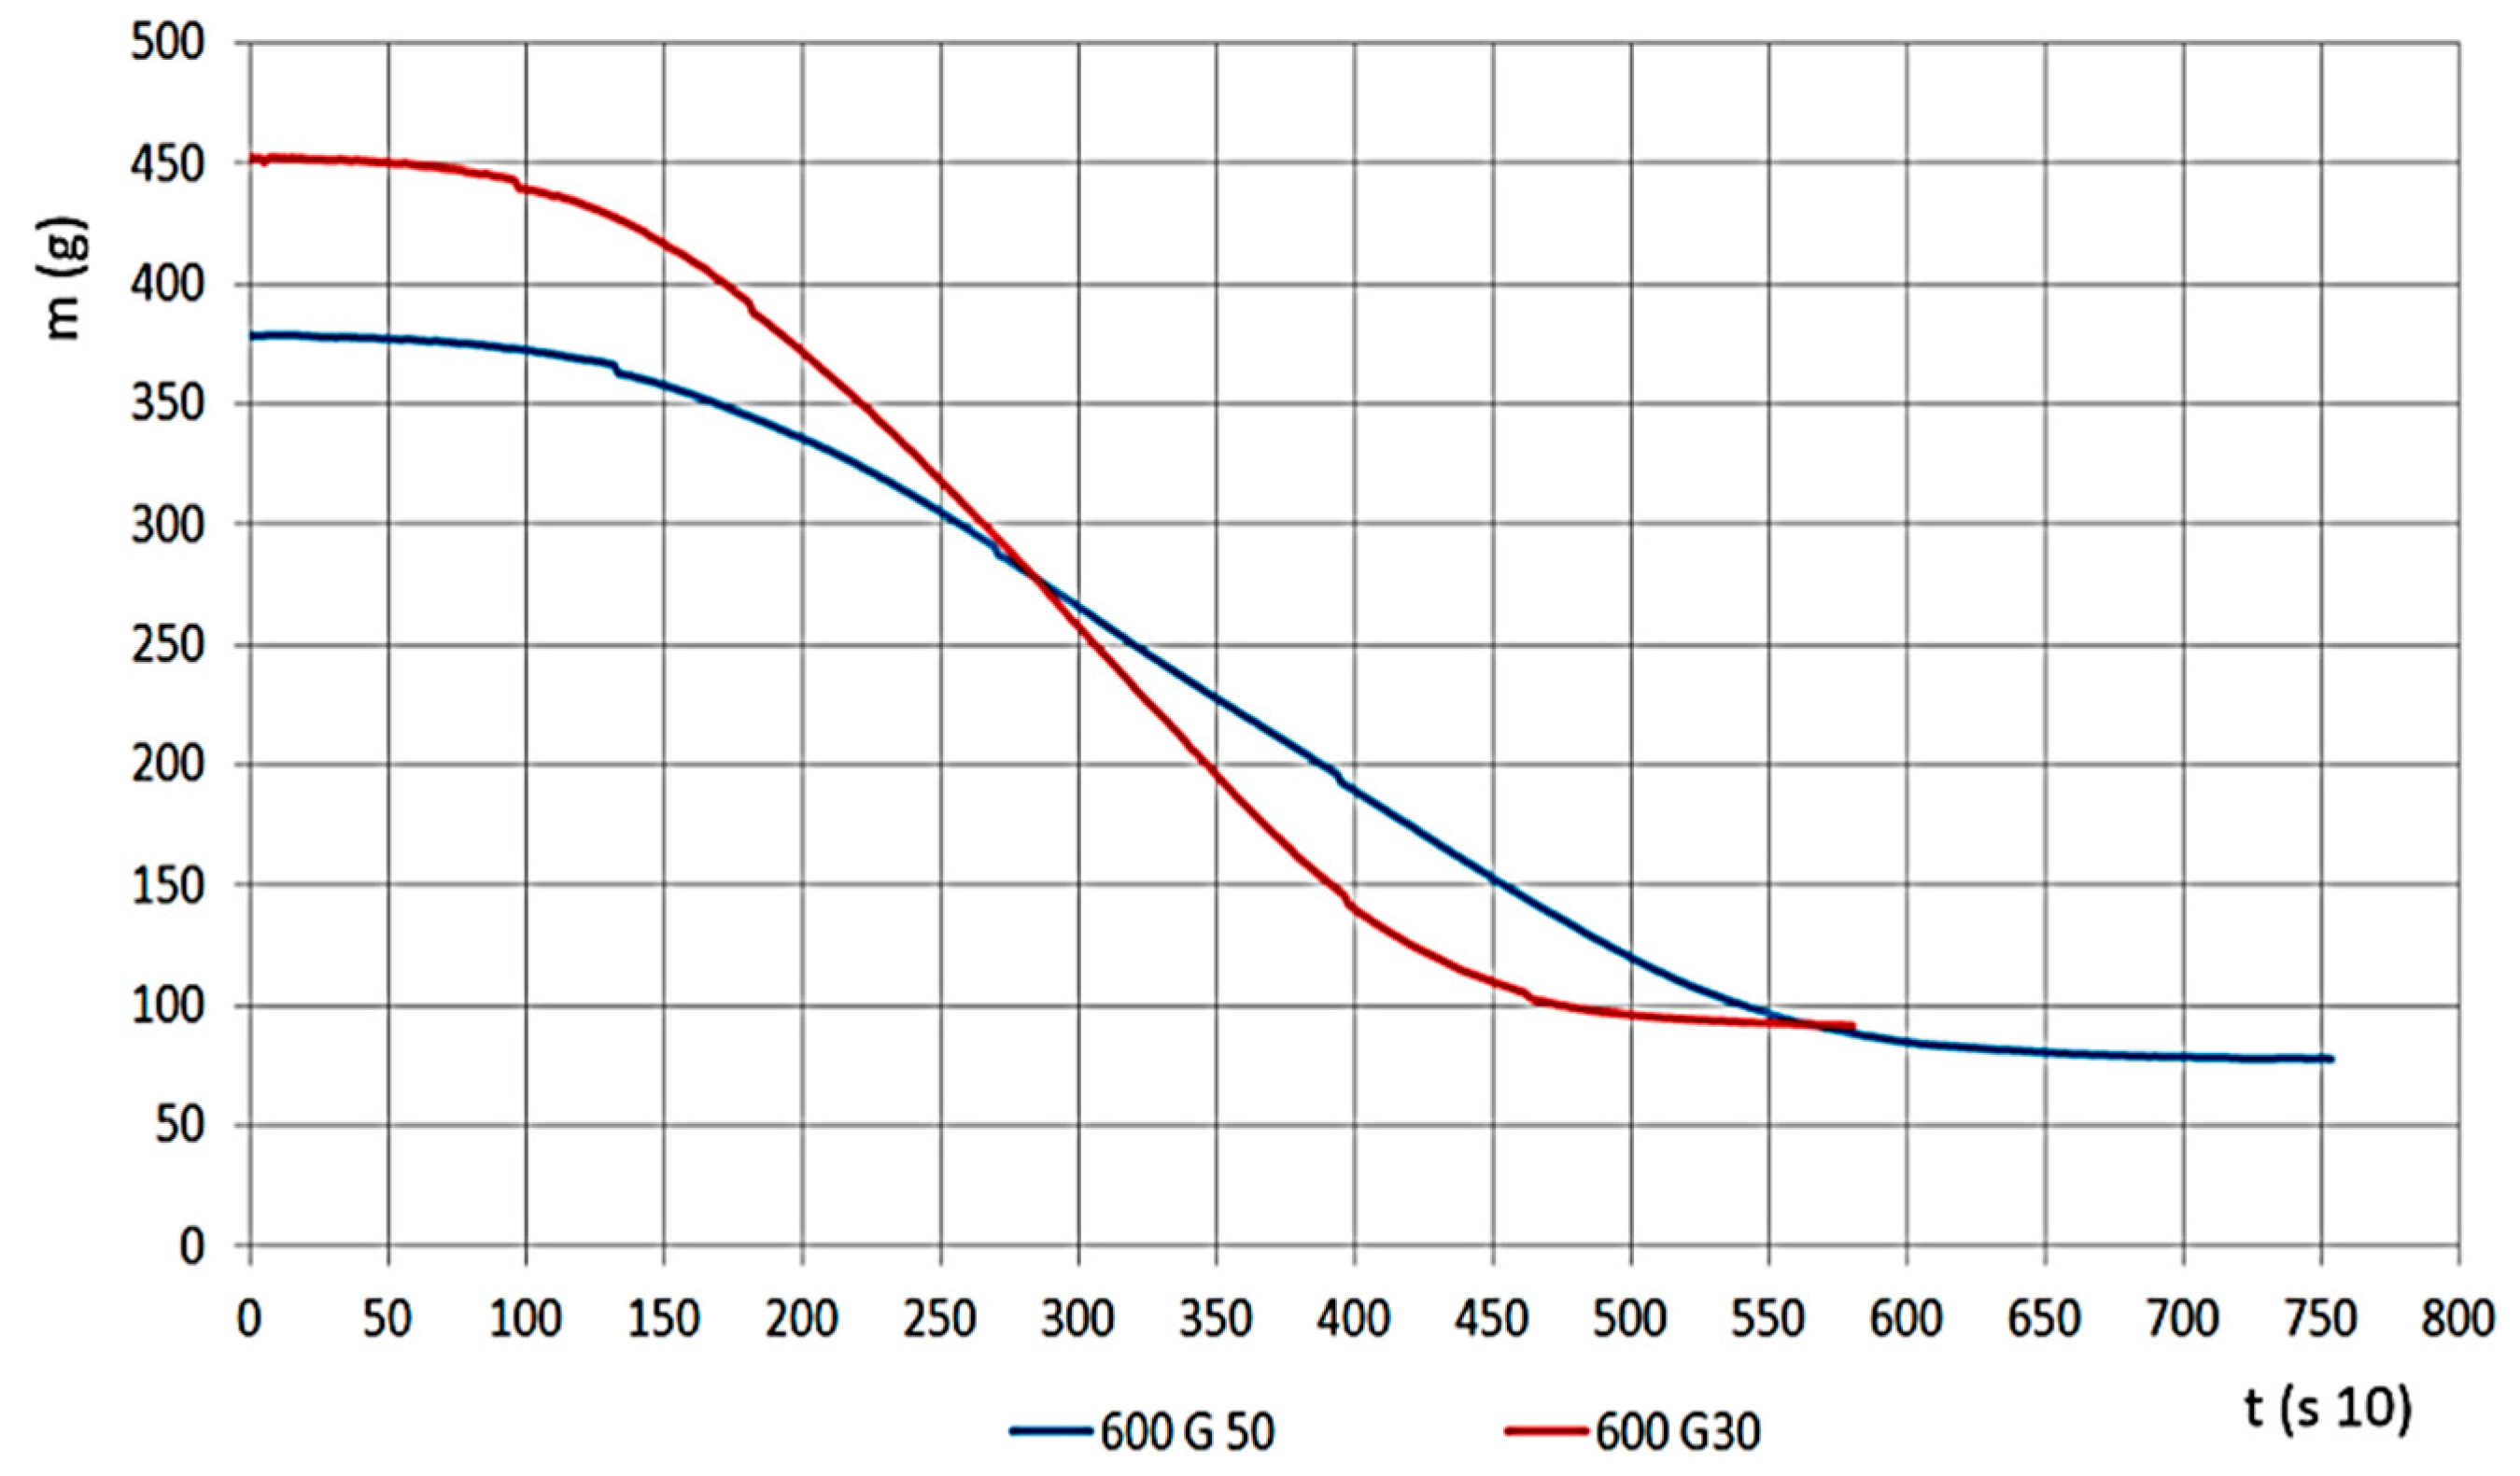
The material density of G30 and G50 chips are different because G50 has smaller density values. Therefore, within the measurement area of the apparatus, we could load in a smaller amount of material. Therefore, we watched the relations between changes, both for mass change velocity and for determining pressure values for gas flow, this is presented on
Figure 7, for G30 and G50 hardwood materials on 600 °C.
For the material with smaller grains, meaning larger volume density, mass change time was shorter, and the mass decrease velocity was significantly higher (
Figure 8). If we look at the percentage, the remaining char is less (ms, 10–22%). The results on the Figure show the G30 and G50 hardwood chips’ decomposition results on a temperature of 600 °C.
For a case of 400 °C heating temperature, during the decomposition of G50 and G30 hardwood, the velocity did not show a statistically significant difference, but the peak values were lower compared to the values obtained for 600 °C (only reached 30–40% of that value). This proves the effect of the gap volume and the active surface area in the decomposition process.
3.2. Temperature Change in the Mass
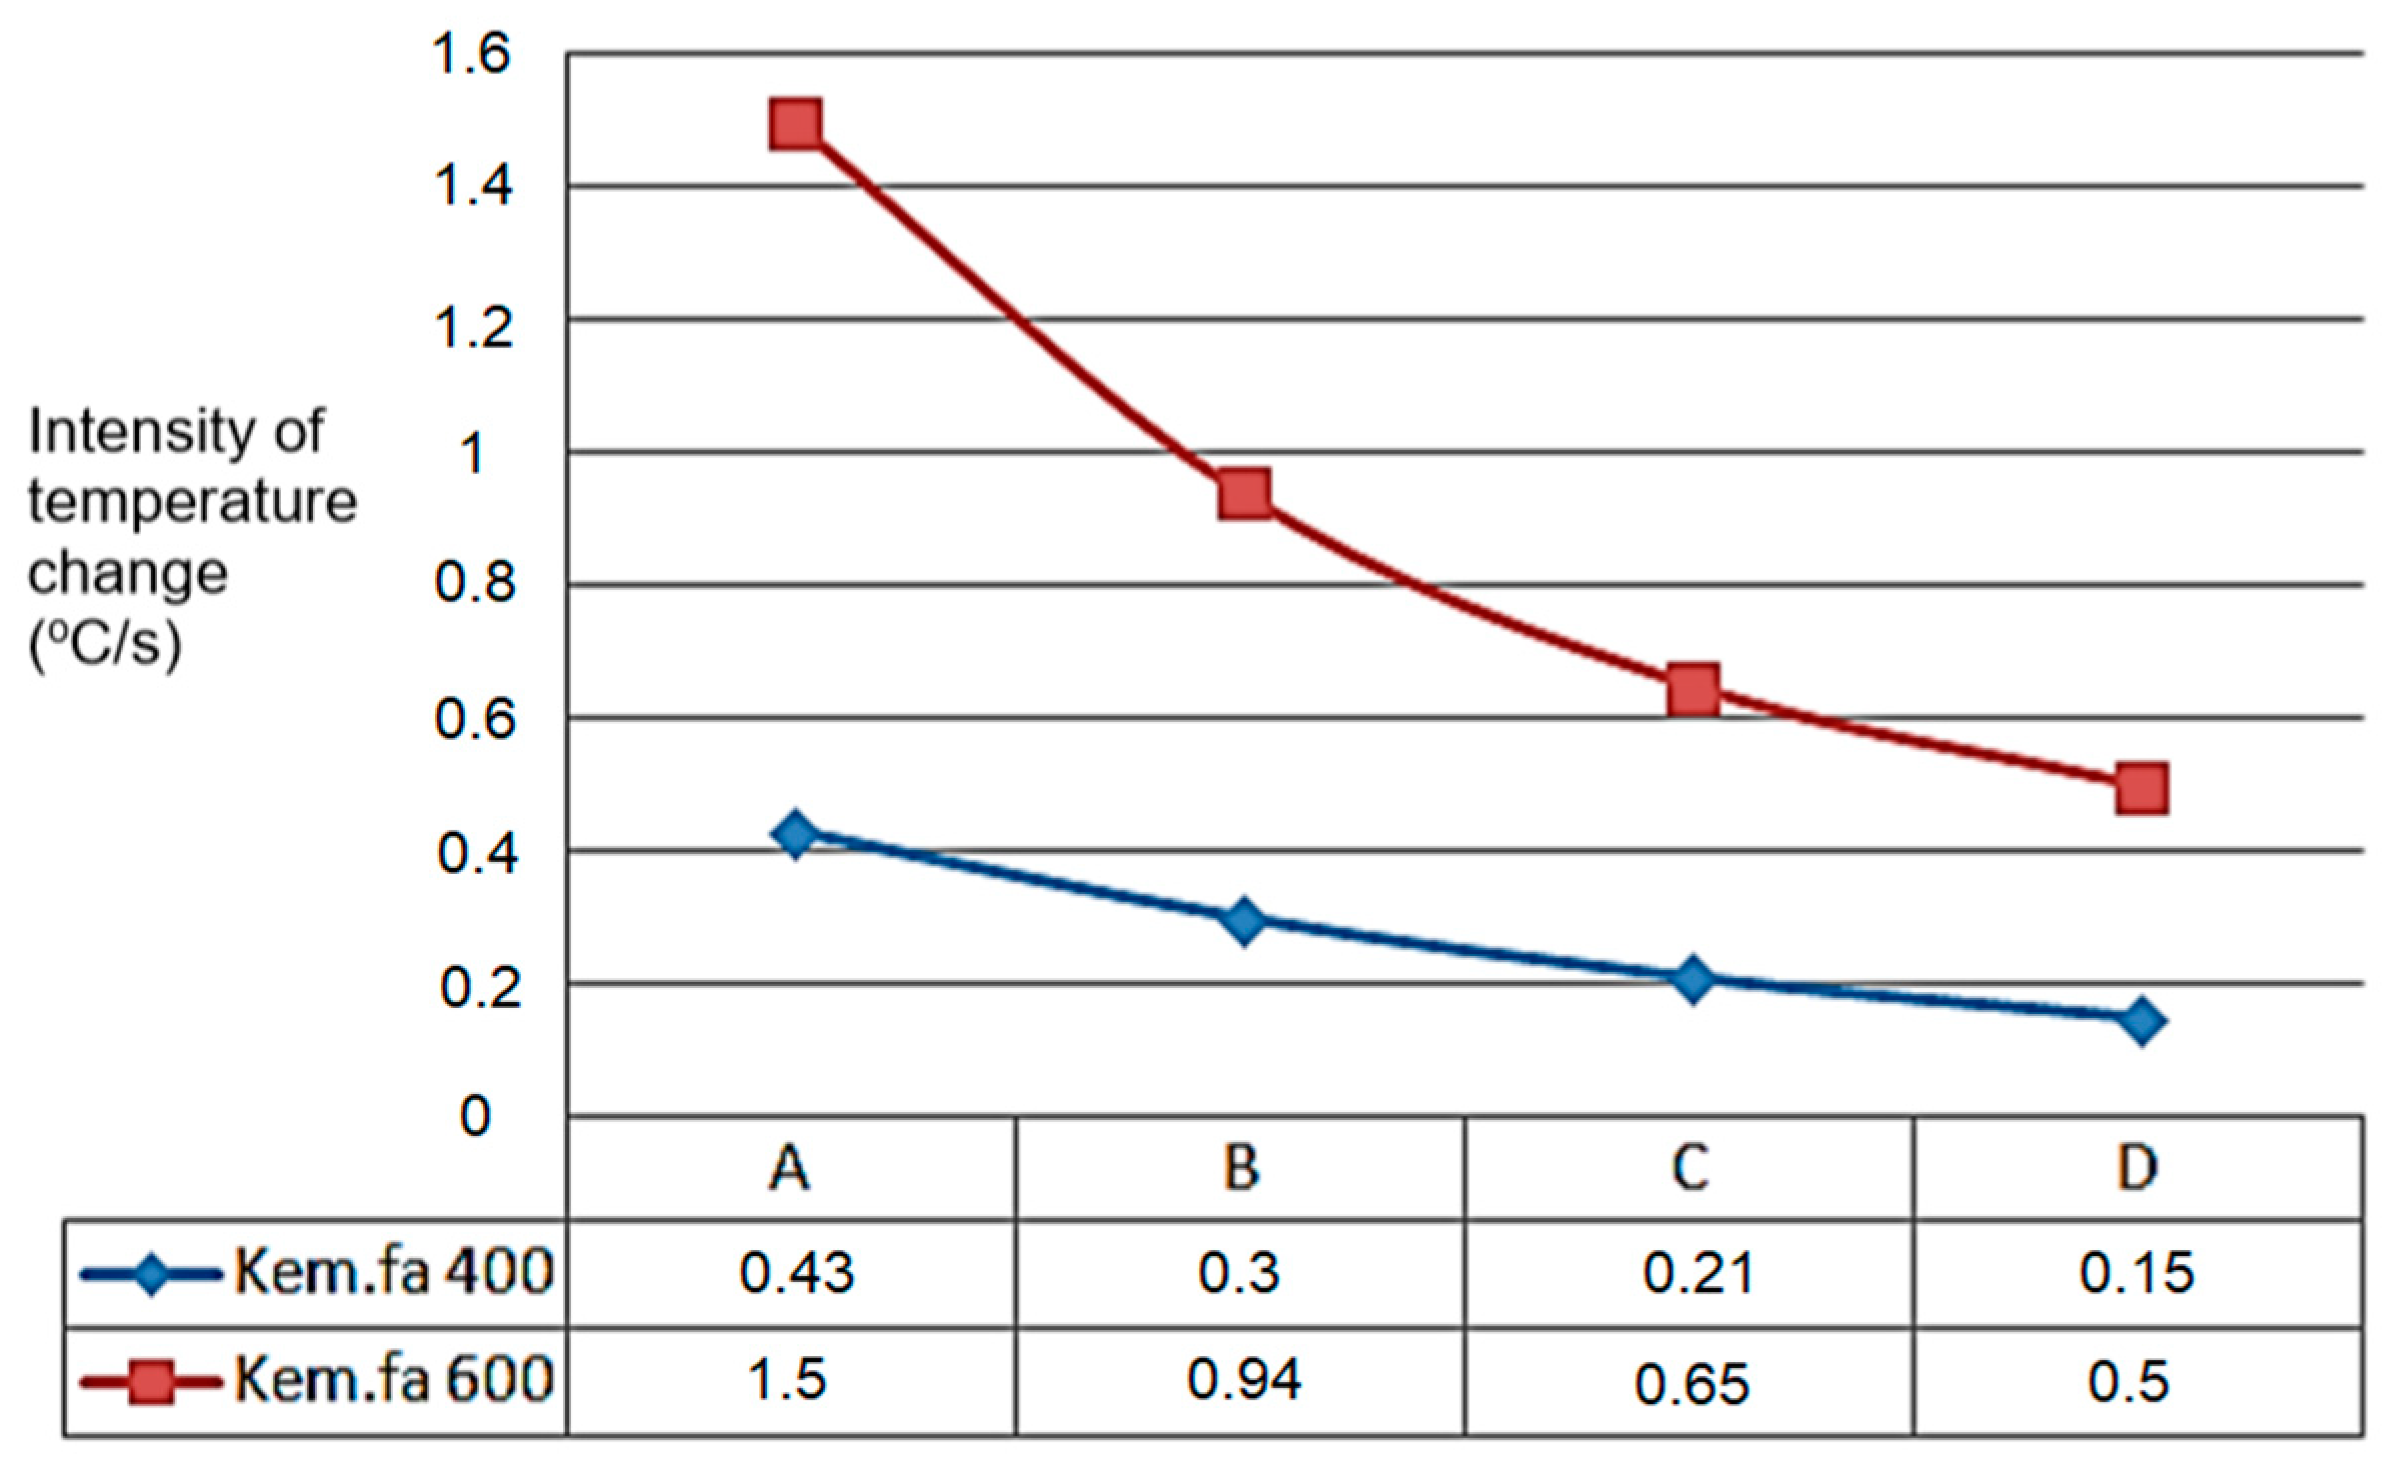
The A, B, C, and D points’ temperature sensors measured the temperature values, which can be seen in the next
Figure 9, starting from point A. The temperature change shows a similar tendency for the higher temperature’s higher intensity temperature change value for 600 °C and the lowest point for 400 °C where the heated inert gas was filled in (
Figure 9).
In cases of temperature on different heights of the material pillar, for 400 °C and 600 °C (within inert gas). The process of the carbonisation refers to the cause of the difference, seen in
Figure 10 (it also follows the logic during drying, with moisture content change).
3.3. Estimation of Expected Mass Change Value
Calculating the air resistance of material mass is one of the most important analysis. In the case of fixed bedding systems (for taller material masses), the gas flow between grains also has resistance, which has to be taken into consideration. In the combined system we prefer (see:
Figure 3), the flow goes upward in the pyrolysis and drying zones, while downward in the reduction zone. Within the upward flowing material, there are both the original and carbonized (dry) grains. Within the downward flow, only char and cinders can be found. The upward flow increases porous characteristic, meaning the gap volume, whereas the downward one compresses, has the opposite effect, counterbalanced by the porous nature of char [
21,
46]. Within the fixed bedding systems usable in smaller facilities, the quality of chipping is also important, since, during the process, this makes gas production more equalized, both in quality and in quantity perspectives. Naturally, the efficiency of the process differs by material, since the internal structure of said materials is different. In the end, with the level of chipping, volume density also changes, similarly to porosity levels, which are significant factors in the flow parameters of gas (
Table 1).
3.4. Modelling Mass Change
In the case of pyrolysis, simulation models are used to understand the role of operating conditions. The clarification of the interactions between physical and chemical processes is very important in the case of fix bad small pyrolysis units, as their input biomass sensitivity is extremely high. Of the physical properties, material density and size cause the model’s greatest sensitivity. We can use a mathematical approach if we know the materials’ attributes and the temperature to describe the relation of gas production and mass decrease in time.
Important mass attributes:
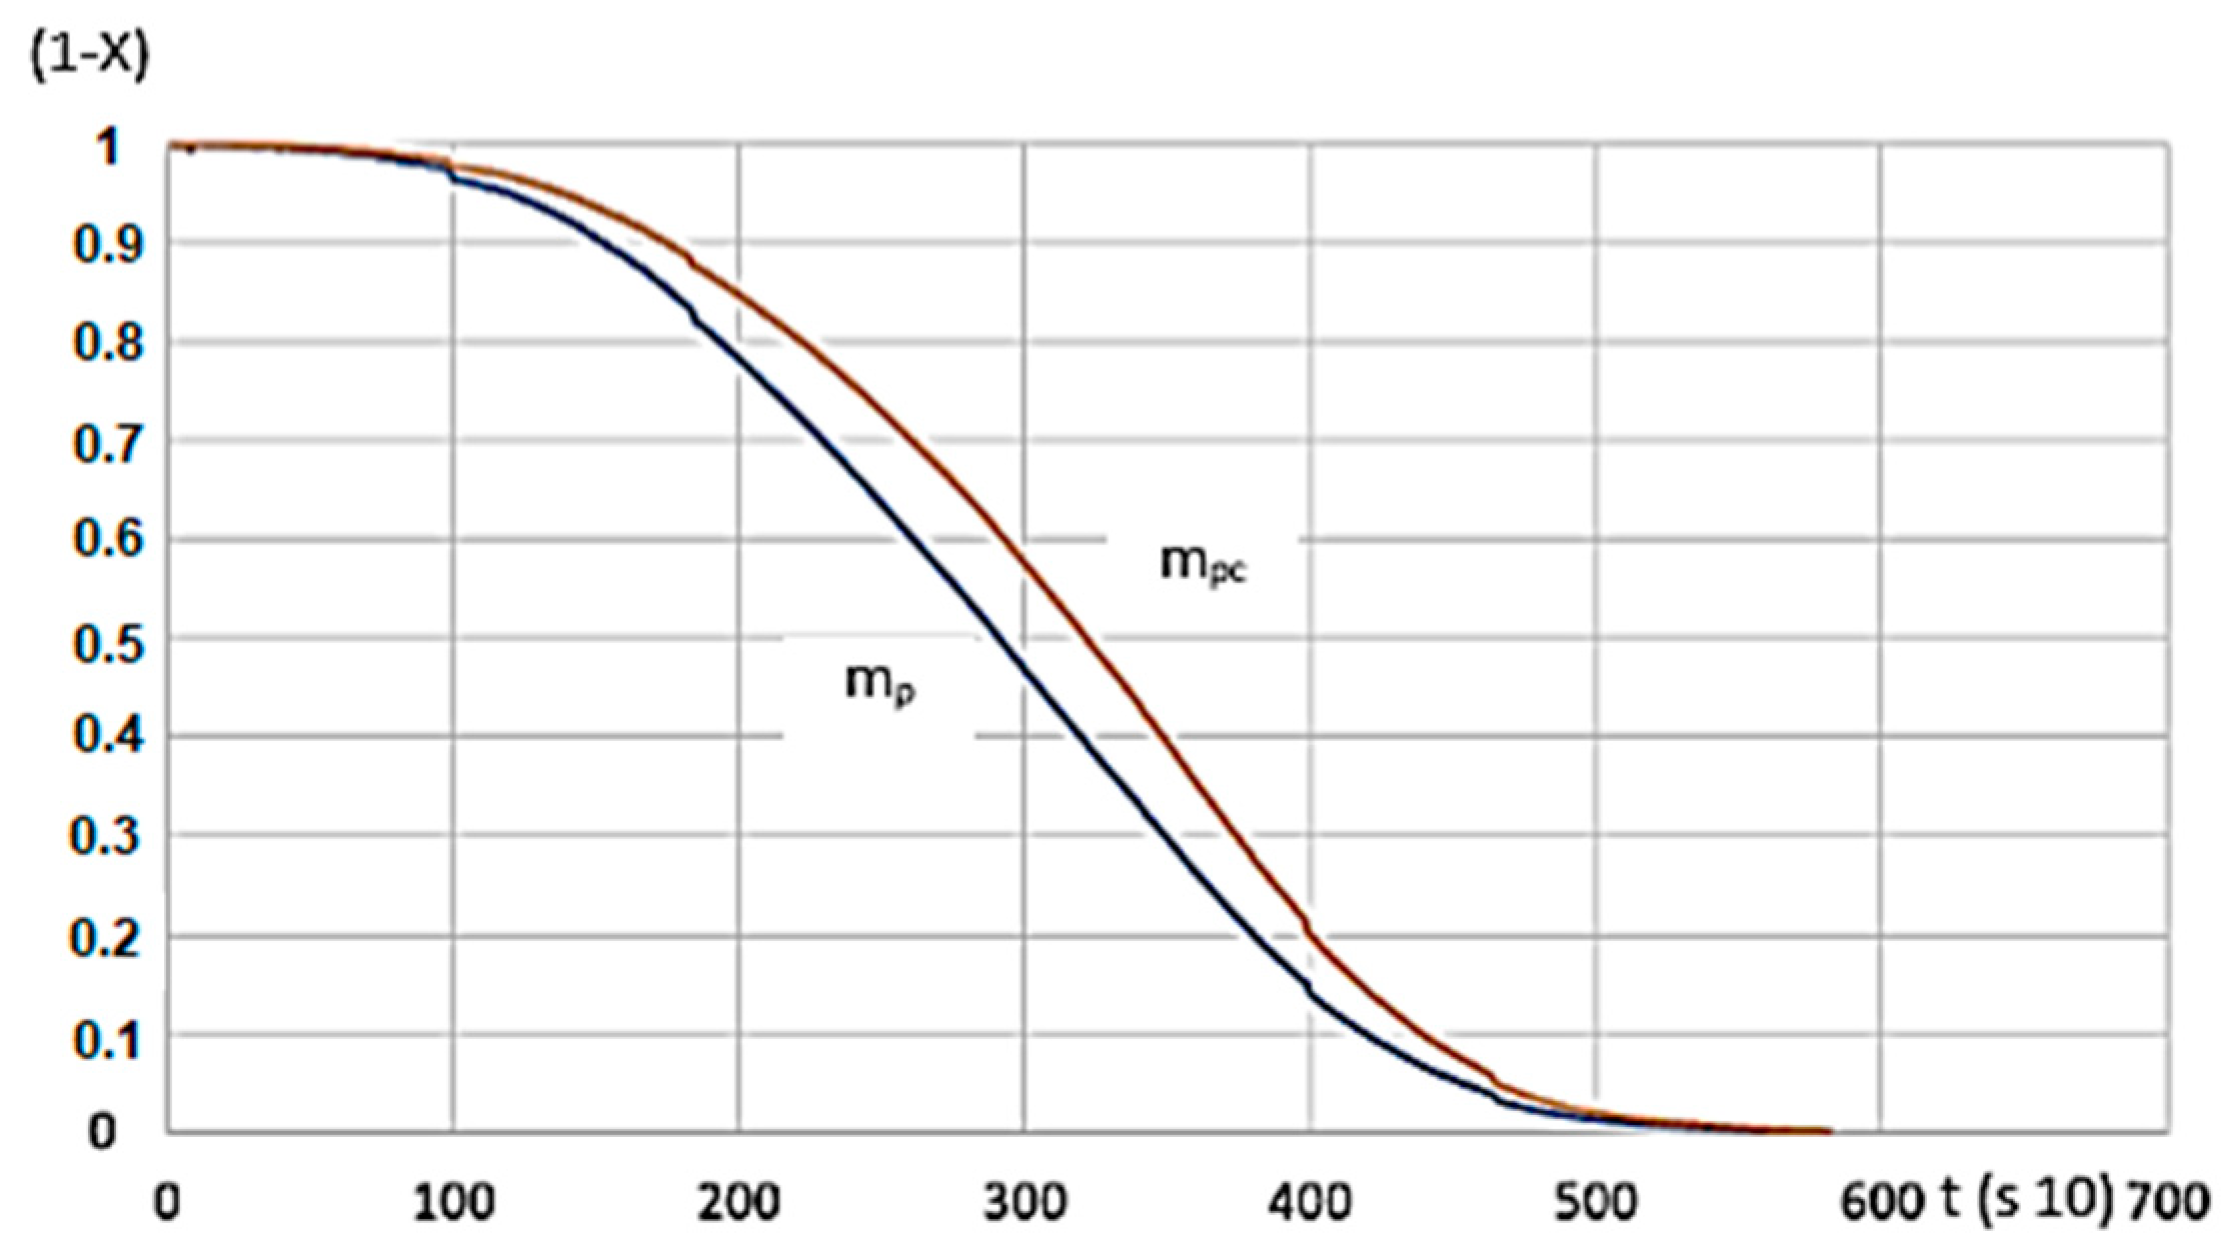
mk = mass of material entered into the experimental apparatus (g); ms = mass of material remaining in the experimental apparatus (g), (char, cinders); mp = momentary (in-situ) mass of material transforming into pyrolysis gas within the experimental apparatus (g); mpc = the mass of the material transforming into pyrolysis gas based on the calculated function (g)
Mathematical model of mass reduction (g) by time:
a = base units (1) b = based on the material structure c = based on volume density If mp = 1.0 for the material when starting the heating, mpc = X (0–1.0), during heating, and after mass reduction.
There’s a tight match between calculated and measured data sets for the function serving as the calculation’s basis (
Figure 11).
As shown in
Figure 11, the function of the measured and calculated data is close to one another. Based on the R
2 value, the applied function can be used to model the process.
4. Discussion and Conclusions
We created an experimental model apparatus for the analysis, which made it possible to determine the attributes of the various processes within. Our goal was to create a fixed bedding solution, which is why we conducted analyses with various materials. In our current article, we only used the hardwood chips as an example for our results (closely resembling for other materials). Based on biochar experiments, we have drawn conclusions that can be applied to all small, fixed bed reactors. Literature sources underline our results. It is important to note that the quality of the input material (size and hardness) is extremely important in the design of small pyrolysis equipment. In order to maximize the efficiency of pyrolysis, gas production and carbon formation should be optimized, and careful design of biomass raw materials is required. Based on the results of the research, we can conclude, it is important to measure the spreading velocity of heat within the material column, starting from the heat transfer point, until the farthest point of the material. On a lower temperature (400 °C, which is also good for creating char), the material layers allow for lower gas flow intensity, and the flow itself is more balanced (with an apt estimation, it can result in a linear function). On a higher temperature, the heat spread is more intense, and gas production is also more prevalent, which gets reduced gradually (the relation is the second level). The mass is reduced, reaches top value on the parabola’s peak (
Figure 8), resulting char is less. Within the material layers, temperature differences are usually higher for higher heating levels. This also affects the heat spread velocity, which is lower for a lower temperature but is always higher in the zone closer to heating wall.
Similarly to currently operating factory apparatuses, our model’s walls also have good heat exchanging qualities, while the mantle is insulated well. Due to this, heat spread close to the wall is more significant, slower in the middle of the material, and always lower there. This means that for fixed bedding solutions with similar values, to improve efficiency, we need to slowly and gently move the material’s “core” part, for better heat exchange. Knowing the internal contents of materials, and their physical attributes, furthermore, the parameters of the systems, mathematical calculations can be easily used to estimate the resulting mass decrease (material remains). According to the calculations, the porous nature of char is much more significant than that of the biomass material. In spite of this, unlike expectations, compression causes the gas need just as much energy to flow through the high temperature, mostly char-made up material within the reduction zone.
Increasing the level of chipping is advantageous for the pyrolysis—from a heating technical perspective—until a set level, but it has a high energy requirement, which is why we must aim to reach the optimal level. Statistical significance for the correlation is acceptable. Taking results into consideration, we began long term operating the experimental apparatus and measuring results on it.


