Article

Determining Health Index of Transmission Line Asset using Condition-Based Method

by
Ruqayyah Hashim
1,*,
Fathoni Usman
2,3 and
Intan Nor Zuliana Baharuddin
2,3
1
College of Graduate Studies, University Tenaga Nasional, Jalan IKRAM-UNITEN, Kajang 43000, Selangor, Malaysia
2
Institute of Energy Infrastructure, University Tenaga Nasional, Jalan IKRAM-UNITEN, Kajang 43000, Selangor, Malaysia
3
Department of Civil Engineering, College of Engineering, University Tenaga Nasional, Jalan IKRAM-UNITEN, Kajang 43000, Selangor, Malaysia
*
Author to whom correspondence should be addressed.
Resources 2019, 8(2), 80; https://doi.org/10.3390/resources8020080
Submission received: 21 March 2019 / Revised: 5 April 2019 / Accepted: 9 April 2019 / Published: 25 April 2019

Abstract

:
Assessment of overhead transmission lines is a crucial task in the asset management of electric power infrastructures. Any assets have different life spans and require proper assessment and maintenance actions. Disruption of the power supply may cause national problems. Therefore, it is essential to ensure that the distribution and transmission of electric power from the power plant to end consumers is achieved without fail. This paper presents a proposed framework of health index of the transmission line using a condition-based method. This study refers to previous methods in determining the health index of electrical power assets, mainly transformer and transmission line. Three main indicators contributed and need to be considered in determining the health index. The indicators are structural, electrical and environmental aspects. The health index of these three indicators with 14 items was calculated, and the overall health index of the transmission line determined. From the case study conducted for this study, the specific location, tower and item can be acknowledged that cause the failure and the service interruption of energy supply to the consumer. It is found that the implementation of the health index calculation gives a more accurate description of the health status of a transmission line. The health index can be used for the prioritizing of maintenance, refurbishment or replacement to avoid disruption.

1. Introduction

In Peninsular Malaysia, the conductor length of overhead transmission lines span more than 532,403 km and there are 74,417 distribution substations operated by the electric power utility company, Tenaga Nasional Berhad [1]. Based on the Malaysia Energy Commission, the energy demand by the consumer consists of 81% to the domestic sector while 17% to the commercial sector and 0.3% to the industrial sector. The electrical power coverage on the Peninsular Malaysia is about 99.8% [2]. Assessment of overhead transmission lines is crucial in the asset management of energy infrastructure. Any failure related to electrical power distribution and transmission components will cause interruption to power supply. Based on a 2016 statistical report on electricity performance in Malaysia, the percentage of unscheduled supply caused by environment was 12.94% for low and medium voltage interruption [1]. Figure 1 shows the compilation of performance report from the Malaysia Energy Commission from 2000 to 2016 [1,3,4,5,6,7,8,9,10,11,12,13]. The disruption caused by environment was 31%, 17% was caused by structure failure, 40% was caused by conductor problems and disruption caused by a third party was 12%.
To ensure continuous service and supply of the energy to the consumer, those interruptions need to be taken care of, and this will reduce the unscheduled disruption. One method to reduce the interruption of energy supply is by calculating the health index of the asset. Most of the assessment practices grouped into two major approaches, visual assessment and using non-destructive test [14]. Environmental, structure, and electrical/mechanical are the main concern in the overhead transmission lines that can cause major failure in electrical supply.
This paper presents a proposed framework of the process to determine the condition of overhead transmission lines by calculating the health index based on specific indicators. The condition-based assessment was taken as a fundamental development of the framework as this assessment is a routine schedule conducted. From this assessment, the failure which causes the service interruption can be determined with a specific location, tower and indicators that distresses the energy supply to the consumer. Other approaches which were used in energy infrastructure asset maintenance to determine the service condition of their assets have been discussed in this paper. The rest of the paper is structured as follows: Section 2 contains on the material and methods of the health index from the previous study, the common indicator used, the proposed indicators and methods in determining the health index. Section 3 contains the result from the case study of the overhead transmission lines. Section 4 contains discussion of the findings and Section 5 contains the conclusion of this paper.

2. Material and Methods

2.1. Health Index for Energy Infrastructure’s Assets

One method that had been used by the energy utility company to determine the service condition of their infrastructure is by determining the health index. It is a strategy task to ensure their continuous service executes without fail [15]. This method is a tool for asset management which makes it possible to describe an unbiased policy for maintenance, refurbishing or replacement of the assets. The data of the component in the transmission network can be useful in developing the health index. By the implementation of the health index, the maintenance planning can be identified, as can which requirement is needing to be done to ensure the asset on its required performance.
Thongchai et al. in Reference [14] presented a method to determine the health index based on the condition assessment of the overhead transmission lines. The process of determining the health index is shown in Figure 2. The component categorized by four which are foundation, structure, conductor, and insulator. The condition of these four components was assessed. After the assessment conducted by patrolmen, the condition of the components was identified. The calculation of the health index was based on the checking list document which was used by the patrolmen to inspect the overhead transmission lines.
The formula of the calculation of the health index depends on the item score, condition scores and mode score of the component of the overhead transmission lines as in Equations (1) and (2). The patrolmen provides the score based on the visual inspection.
H I = i = 1 m I i C I
where HI is a health index, I is item score and C is Condition score.
% T H I = i = 1 n H I i M i 100
where THI is total health index, HI is health index and M is mode score of the component.
From the health index calculation using Equations (1) and (2), the physical health condition of the overhead transmission lines is determined. If the value of the THI is 100%, the health of the asset is in good condition, hence no maintenance is needed. If the value of the THI is 0%, the health of the asset shows that the immediate replacement or repair needs to be implemented.
However, Tsimberg et al. in Reference [16] show the condition of the conductor can be expanded to identify the remaining life. The process of determining the condition of the conductor is based on Figure 3. The determining of the condition of the conductor divides into two, a basic health index and comprehensive health index. The basic health index is considered as physical condition, service record parameter and the de-rating factor. The de-rating factor appears once the data shows the presence of any repairs or splices, while the parameters of the comprehensive health index formula are mechanical properties, physical properties, service record, repairs/splices, and remaining tensile strength.
The calculation of the health index in this study was made by applying the additional coefficient and de-rating factor in the formula. In formulating the health index, condition parameters are ranked by the assignment of weights. The greater the parameter’s contribution to asset degradation, the higher its weight. The condition parameter score is an evaluation of an asset concerning a condition parameter. Calculation of the asset is based on the comparison of the basic health index and comprehensive health index. This method is different compared to Thongchai et al. in Reference [14]. The formula of health index calculation is based on Equations (3) and (4).
H I = m = 1 m m ( C P S m × W C P m ) m = 1 m m ( C P S m . m a x × W C P m ) × D R F
where CPS is condition parameter score, WCP is weight of condition parameter, CPSmax is maximum score for condition parameter and αm is data availability coefficient.
C P S = n = 1 n β n ( S C P S n × W S C P n ) n = 1 n β n ( S C P S n . m a x × W S C P n )
where SCPS is sub-condition parameter score, WSCP is weight of sub-condition parameter, SCPSmax is maximum score for sub-condition parameter, βm is data availability coefficient and DRF is De-Rating Factor.
On the other hand, Hjartarson et al. in Reference [17] used a scoring and ranking method in determining the health index. The method was strengthened by the application of the importance weightage of the component to the asset. This method is widely used by other researchers [18,19,20,21,22,23]. Figure 4 shows the process of finding the condition of the asset.
The development of condition-based health index requires an assessment of the relative degree of importance of condition factor. The rating use gravitational factor which start with Weight ‘1′ for very low importance, Weight ‘2’ for low importance, Weight ‘3’ for moderate importance, Weight ‘4’ for high importance, Weight ‘5’ for very high importance [24]. The scoring system is used for classifying the asset condition into several stages such as Score ‘1’ for “normal” level, Score ‘2’ for “suspect” level, and Score ‘3’ for “poor” level. The score levels determine using the recommended limit from electric industry accepted various international standards Institute of Electrical and Electronics Engineers (IEEE), International Electrotechnical Commission (IEC), and Conseil International des Grands Réseaux Électriques (CIGRE) guides [25]. By multiplying the weight and scoring system, the condition of the asset health was identified. The formula of health index is based on Equation (5), the formula of condition index is based on Equation (6), and the important index calculation is based on Equation (7).
H I C % = c i = 1 n ( S c i × W c i ) c i = 1 j ( S m a x c i × W c i ) × 100 %
where HIC is the health index of each component, Sci is the score of each diagnostic test, S m a x c i is the maximum score of each diagnostic test, Wci is weighting number of each diagnostic test and n is the number of diagnostic tests.
C I % = j = 1 m ( H I C j × W j ) × 100 %
where CI is the health index of each power transformer, Wj is weighting number of each component, HIC is the health index of each component and m is number of components.
I I % = i i = 1 p ( S i i × W i i ) i i = 1 p ( S m a x i i × W i i ) × 100 %
where II is the importance index of the transformer, Sii is the score of each importance criterion, S m a x i i is the maximum score of each importance criterion, Wii is the weighting number of each criterion, and p is the number of criteria.
The risk index was combined with the health index to optimize the health of the asset. The risk factor was incorporated in the condition assessment; it is called a composite risk index. The composite risk factor can be viewed in two ways. First, as a composite health index together with a composite non-condition risk index where the weightage reflect with the degree of confidence imparted by each index. Second, as a reformulation of the composite health index with an additional non-condition risk factor. Each factor is assigned a weighting according to the importance and degree of confidence.
In addition, a different method of finding the health index which was introduced by German et al. in Reference [26]. The health index was calculated by determining the criticality failure of the parameter in the component of the asset. The studies on the transformer show that a higher rate of failure of the component will give a higher percentage in the finding of the health index. Figure 5 shows the process of determining the health index of the transformer by using the 24 diagnosed parameters used by German et al. in [26]. The health index relies on 24 diagnostic parameters. This formulation of finding the health index is widely used in the finding of the health index of the transformer [19,20,27].
The percentage of the calculation is 60% weighted factor due to the transformer and 40% weighted factor due to load tap changer (LTC), as shown in Equation (8)
H I =   60 % × i = 1 21 K i P i i = 1 21 4 K i + 40 % × i = 22 24 K i P i i = 22 24 4 K i
where HI is health index, K is the factor, HIF is the condition rating factor, the weighted factor of 60% due to the transformer and the weighted factor of 40% due to LTC.
The artificial neural networks (ANN) and adaptive neuro-fuzzy inference system (ANFIS) models are the other methods used to calculate the health index as in Reference [28]. The ANN and ANFIS methods are data-driven tools. Their parameters and weight matrices are adjusted using input/output data. In this method, two artificial intelligence models including artificial neural network and adaptive neuro-fuzzy inference system models are presented to determine the health index of the transformer. The dataset in the model was divided randomly into training (80% of dataset) and testing (20% of dataset) subsets which the testing dataset is used to evaluate performance of the models. Vahidi in Reference [28] used the dataset of 226 test records of power transformers with different voltage levels and power ranges in different weather and operating conditions. Diagnostic tests are conducted on power transformers located in different regions with different climates in terms of temperature, humidity and atmospheric pressure. Moreover, operating and loading conditions of transformers are different depending on the type of the industrial facilities they are used in. Therefore, the results of the models are more accurate depending diverse and larger dataset. The model provides good prediction of the health index and decisively can be referred as a reliable model trained by the diverse dataset.

2.2. The Health Index of Overhead Transmission Lines

Overhead transmission lines are used to transmit the electrical energy from the source to the consumer throughout the nation. The condition of transmission lines is basically made up of four major components, which are the foundation, structure, insulator, and conductor [29]. Table 1 shows the list of the common components considered for calculating the health index of an overhead transmission line.
Table 1 shows there are six common component considerations in determining the health index of overhead transmission lines. The structure of the tower supports the transmission lines, and may be made of any material, comprising a body which is normally four-sided with a crossarm. The structure of the tower consists of the entire body of the transmission tower. The structure is divided into tower leg, tower frame, bracing and crossarm. The type of structural design in the transmission line are a self-supporting lattice, cantilever or guyed poles, or framed structures. The design of the structure depends on the factors of public concerns, erection techniques, and inspection practice. The most common structures installed are made of galvanized steel due to conveniences for fabrication, strength, and transportation purposed. Based on Table 1, the researchers have emphasized that the failure mode of the steel tower is mostly caused by the cracking of the wooden tower and corrosion of the steel member which may lead to failure. Besides that, other failure modes for the structure are a failure due to deformation, settlement and excessive deflection. However, only one study considered that vandalism may affect the condition of the transmission lines [15]. Vandalism also contributed to the reason for the failure in Reference [34].
Conductors carry rated current up to their maximum design temperatures within their mechanical design limits. Substantial of this purpose, the sags of the conductor need to be maintained throughout the line’s route to make sure the ground clearance is within the statutory limits. The aluminium conductor steel reinforced (ACSR) is the most commonly used in the industry because of its mechanical strength, widespread manufacturing capacity and cost-effectiveness [29]. The use of copper is rare in modern transmission lines since it is heavier and usually more costly than aluminium conductor of the same resistance. Conductors are inclined to corrosion, especially in heavily industrialized areas which have high stages of pollutants in the atmosphere. The joints present critical weak points along the conductor as corrosive contaminants accumulate more easily in them than in the conductors. Symptoms that show deteriorating joints can be detected by measuring their temperature and resistance [35]. However, only three researchers considered the element of corrosion in the conductor component. The failure of the broken strand was agreed by five researchers to show the importance of this criterion to be considered in the overhead transmission lines. The other failure caused by the conductor is loose wire strands, and the conditions of sag and jumpers.
The insulator is one of the important components in the transmission lines, based on previous researcher studies. If transmission lines are not properly insulated from their support poles/transmission towers, the current will flow towards the ground through the poles/towers, which also become dangerous for living beings. Generally, insulators are used to attach the conductor to the crossarm of the transmission tower, where it provides mechanical support and isolates live parts from the earth. The common materials used in the insulator are glass, porcelain, and polymers. The insulation criteria commonly check the polluted insulator grade, crack of the insulator and the service life of the insulator.
Four researchers considered the component of the foundation to be included in determining the condition of overhead transmission lines. Tower foundations provide anchorage for the tower to the ground. The type and depth of the foundation are dependent on the tower orientation and the ground conditions. Most foundations are constructed by using galvanized-steel reinforced concrete (also termed as grillage foundations) [32]. The reinforcement of the foundation is exposed to the soil which may lead to the corrosions. The steel reinforcement in the foundation may become rusty and brittle, which may cause the failure of the foundation and create in unstable condition in the tower. Rusty steel reinforcements can be detected by using the half-cell measurement device [36]. Besides that, foundation failure may be caused by displacement of the foundation to the ground, settlement of the soil, damage of the slope protection and flood disaster. The failure of these components may affect the electrical distribution to the consumer where may cause interruption of the power supply.
Four researchers proposed that the environment and grounding/lightning components need to be included in the assessment. The environment criteria are based on the tree barrier condition, construction nearby, vehicle approaches, thunder, strong wind, and rainfall. The location of the transmission lines is not included in the assessment. In Malaysia, the environment components need to be added to the health asset. The statistical data from the energy commissioner shows that 31% of the power interruption is caused by the environment factor. Based on the study by Fathoni et al. [37], the quality and integrity of each component of the electric power transmission tower is mainly controlled by atmospheric corrosion. Moreover, a study by Fathoni et al. [38] on steel building material revealed its estimated service life for different environmental zones.

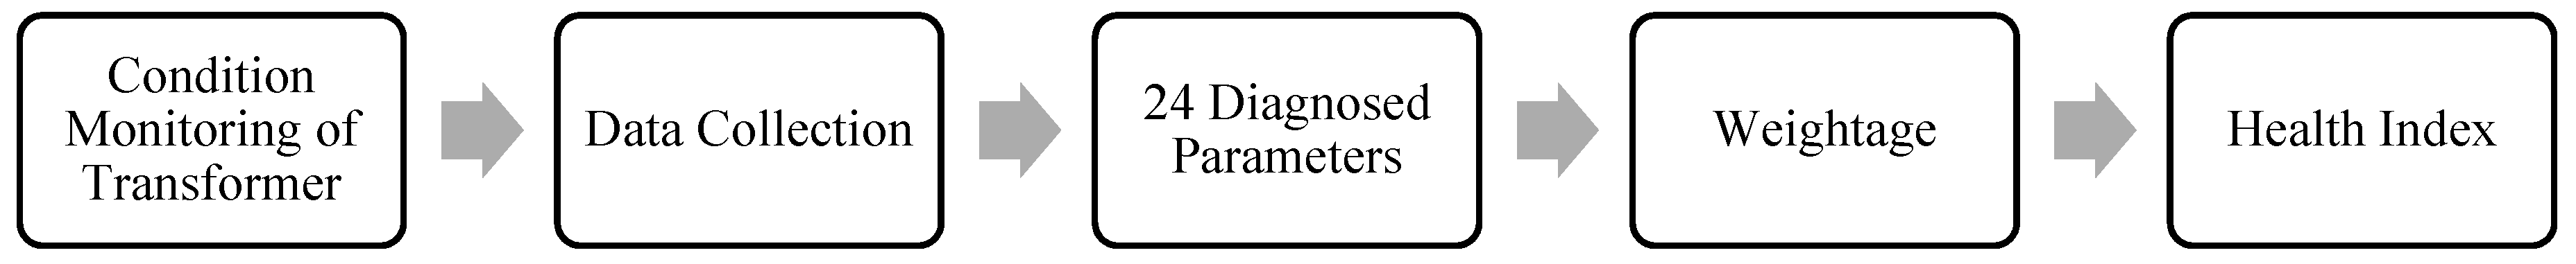
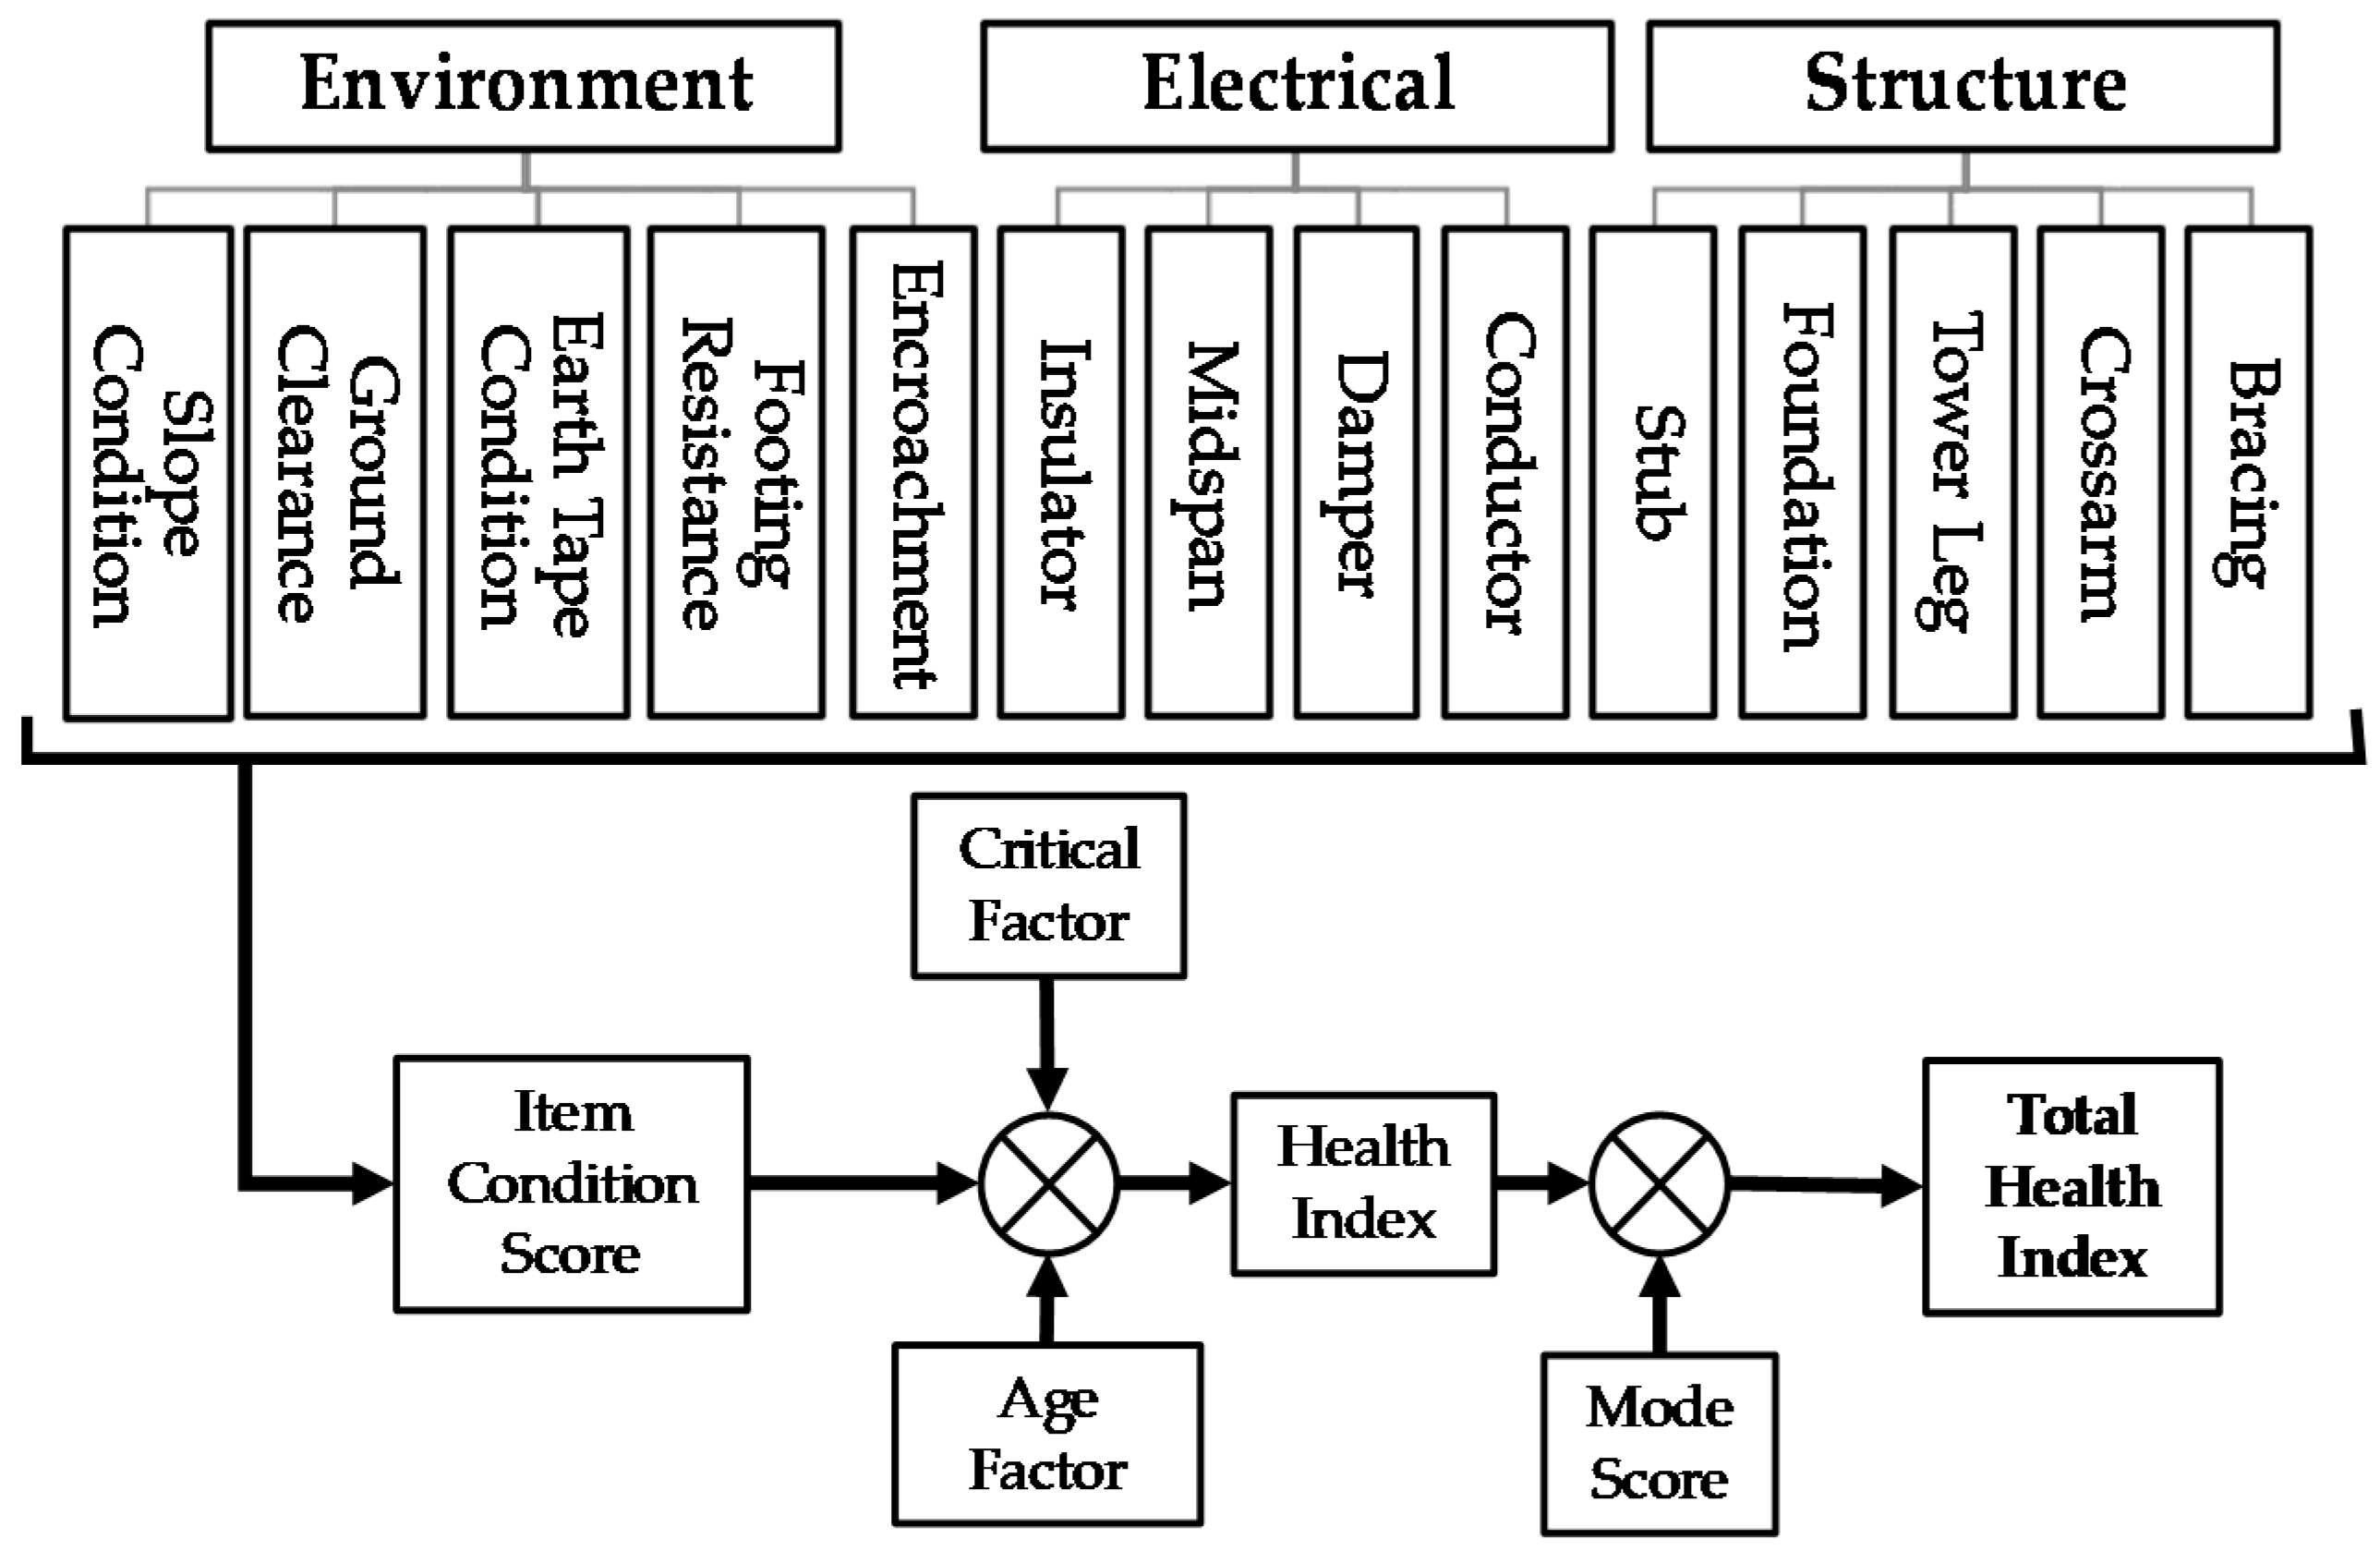
2.3. The Health Index Material and Methodology
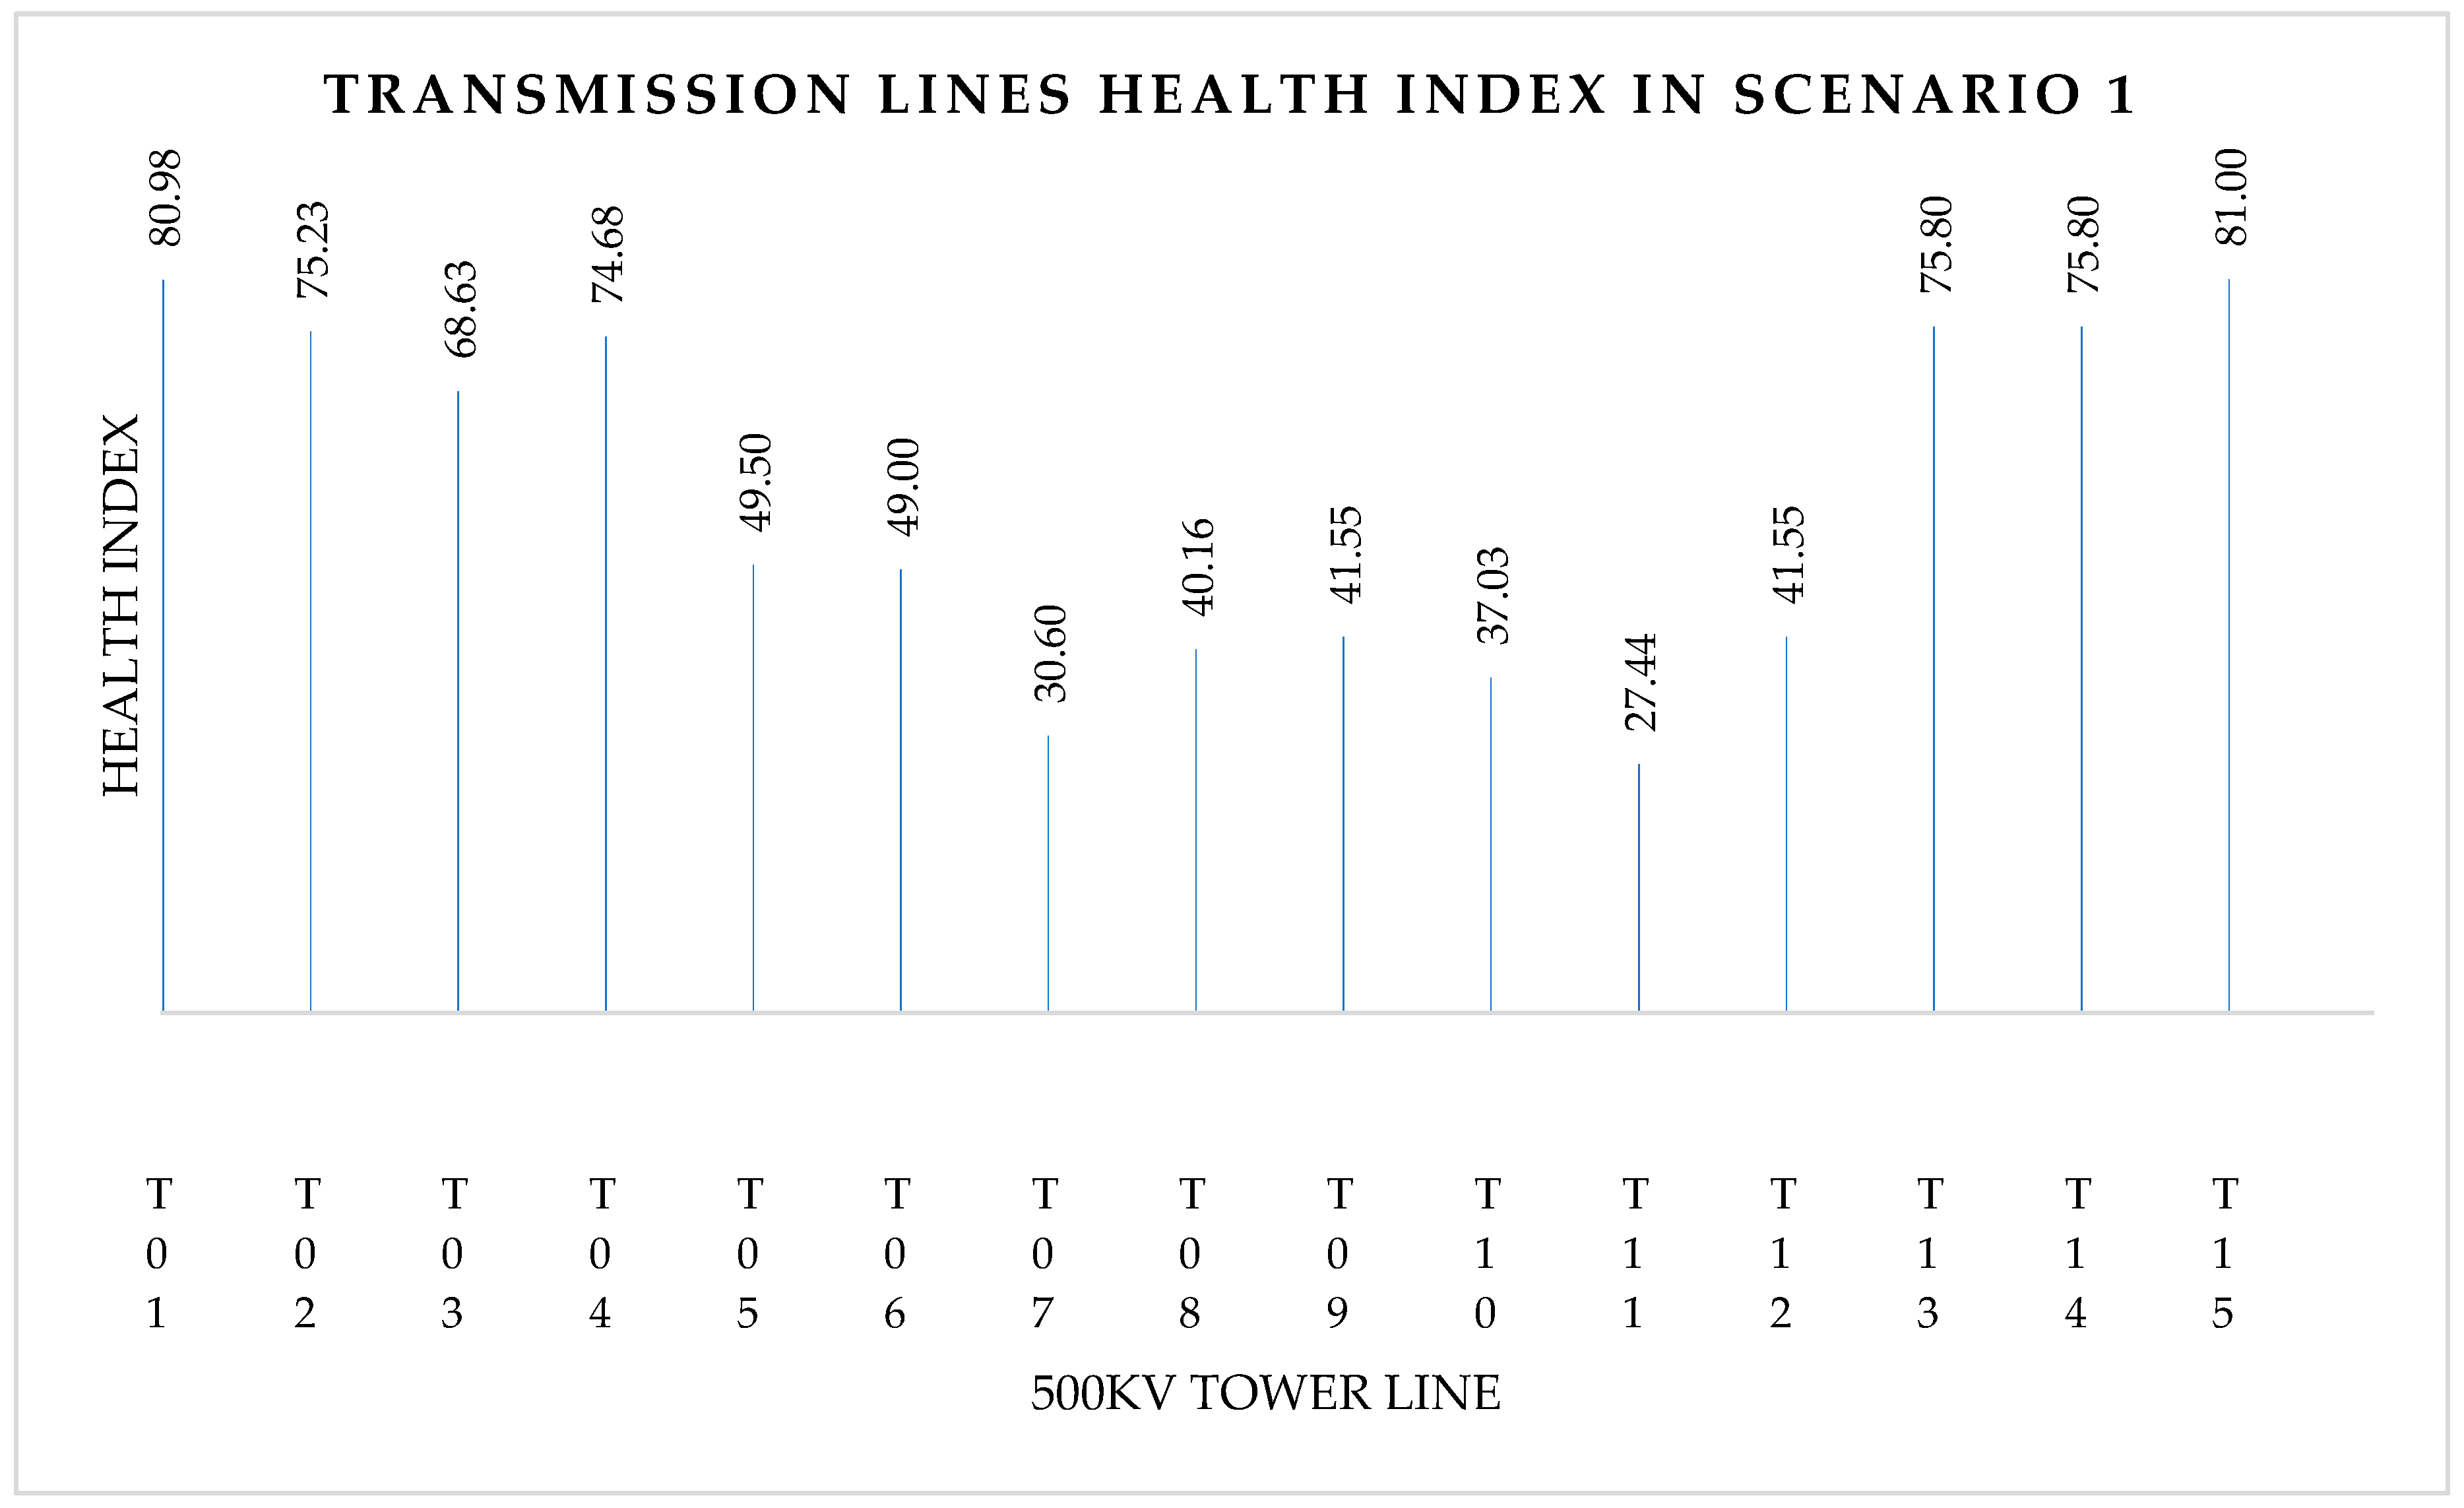
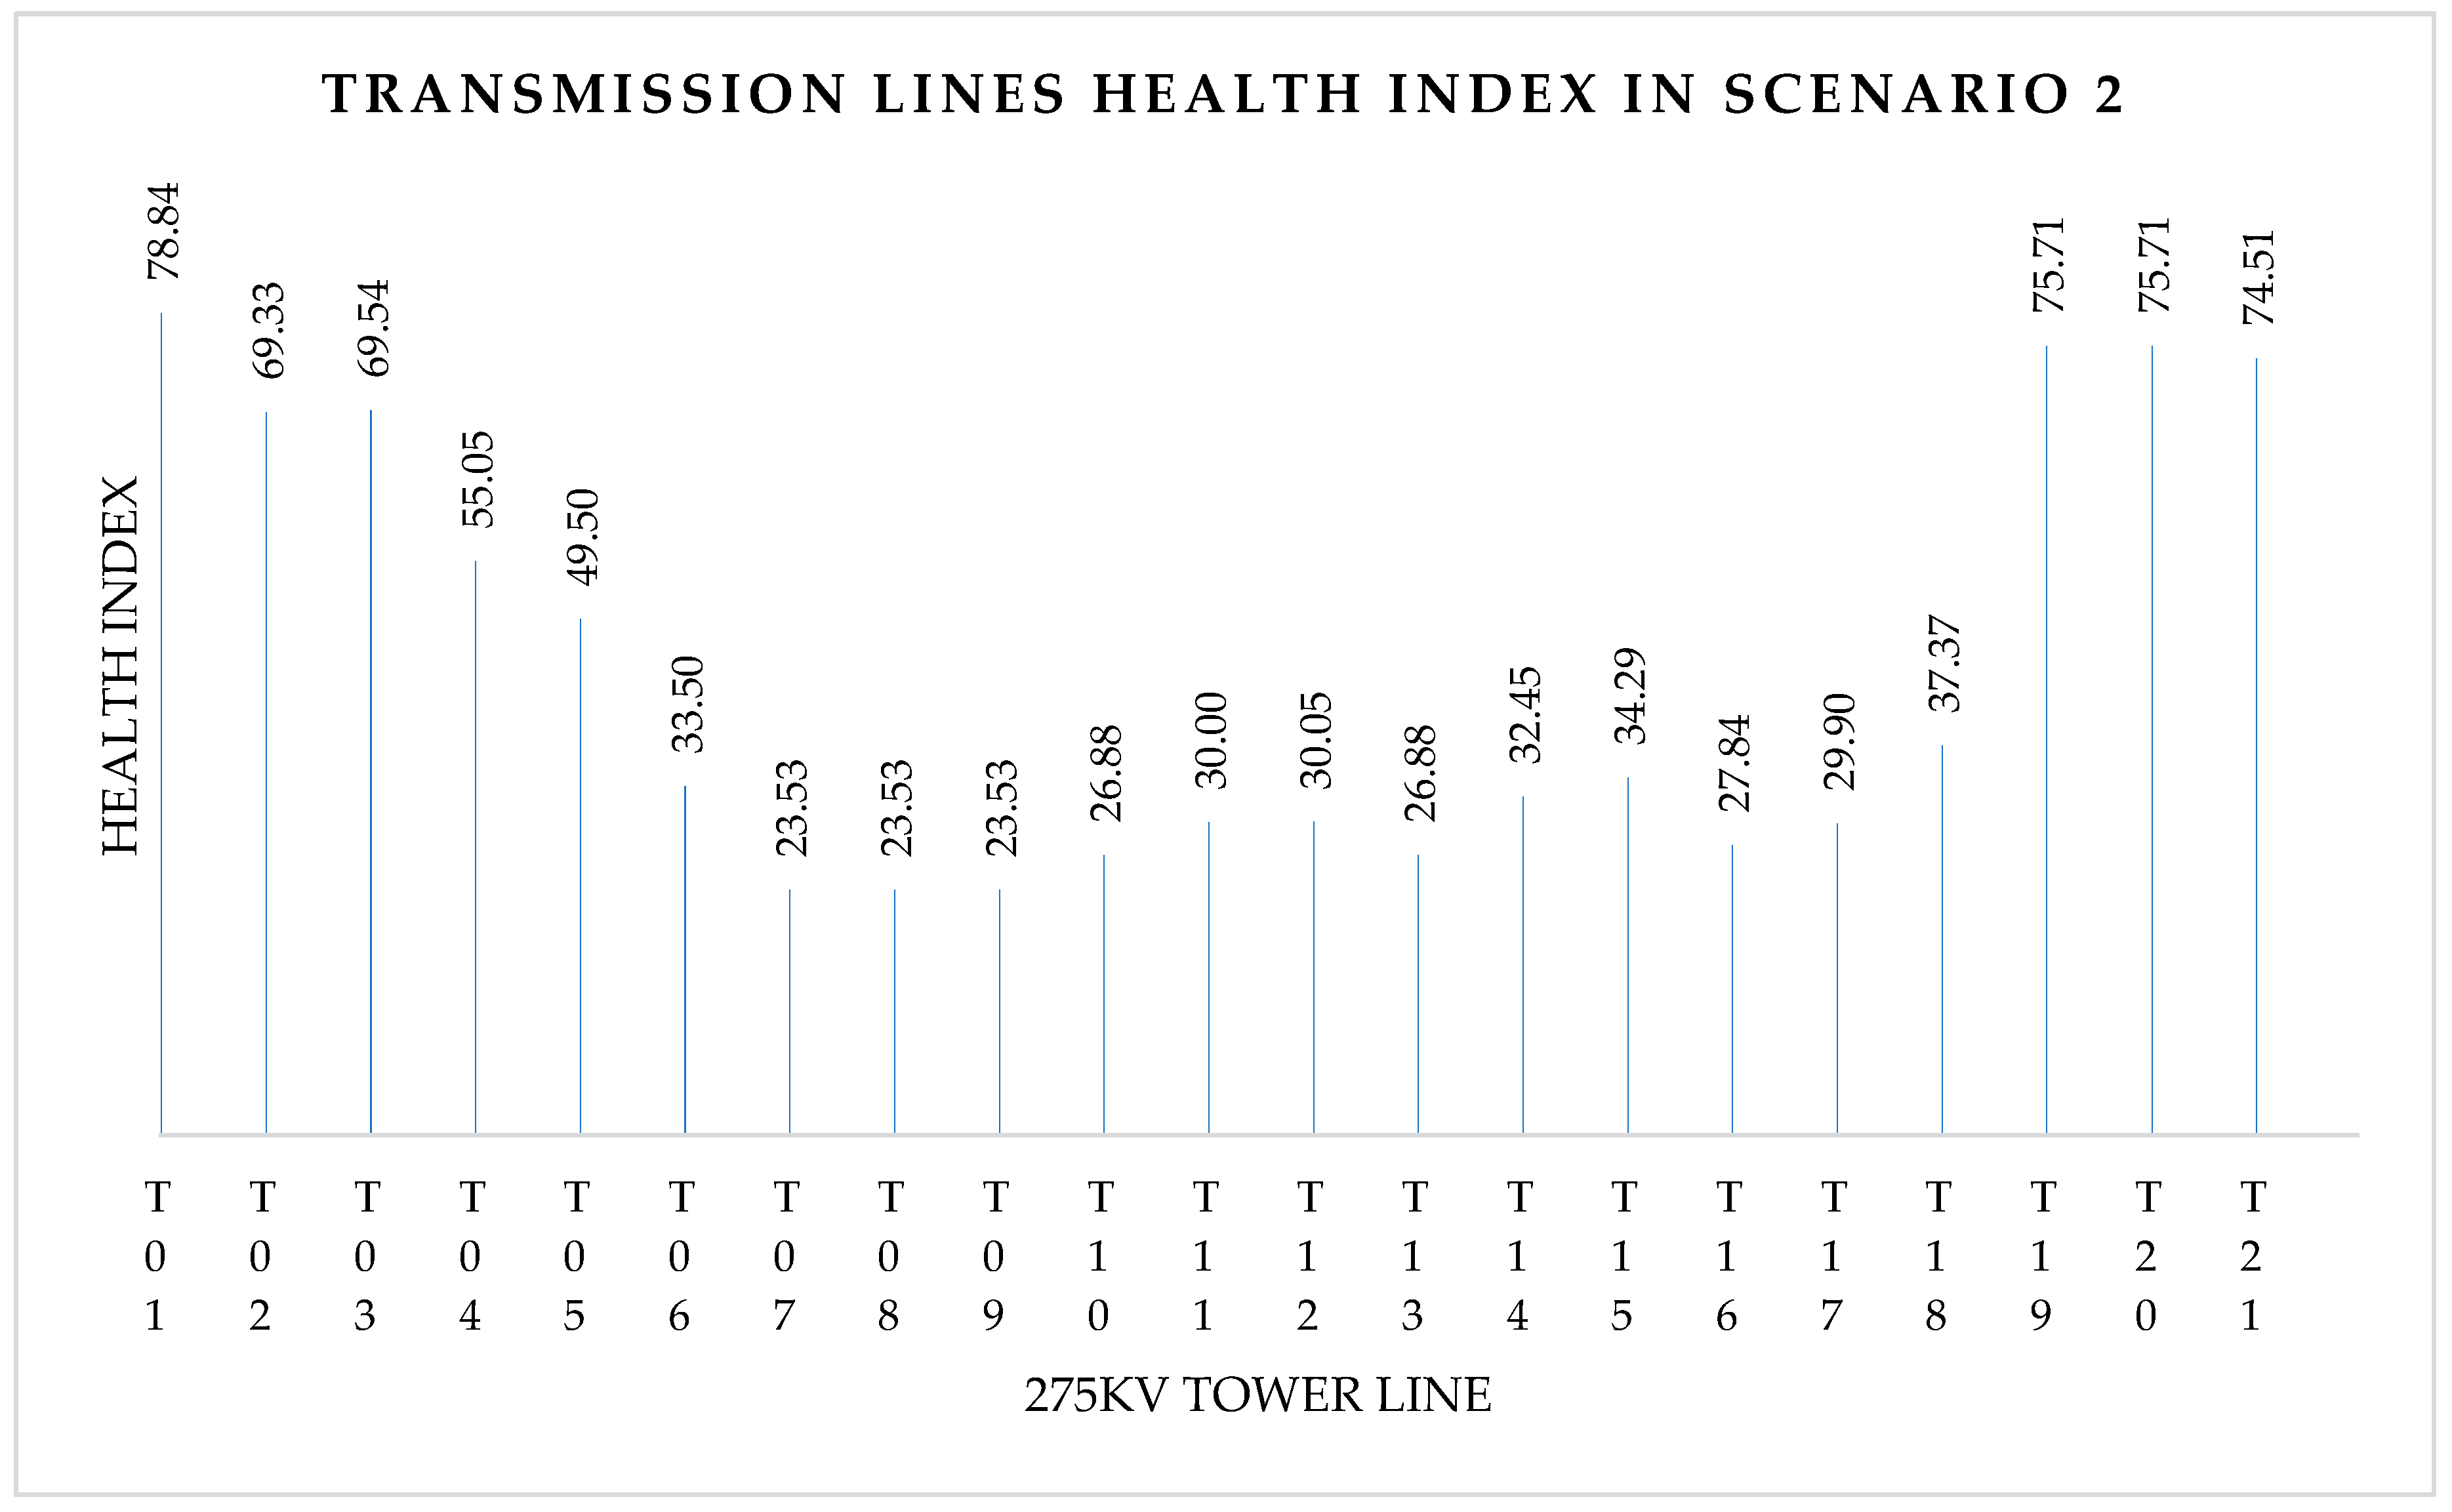
The proposal of health index in this study is adopted from Thongchai et. al. in Reference [14], Hjartarson et al. in Reference [17], and References [18,19,20,21,22,23] with additional sub-indicators incorporated in determining the transmission line health index. Figure 6 shows a proposal of the process of determine the health condition of overhead transmission lines. The data collection is based on a database collected in Peninsular Malaysia.
In this model, three main indicators are used which consists of structure, electrical and environment. Each indicator has several items. The structure indicator includes bracing, cross arm, tower leg, stub and foundation. The electrical indicator considers conductor, insulator, midspan joint spacer and damper. The environment consists of encroachment, grounding or lightning protection, landslide, soil erosion, the spatial condition of the transmission lines and ground clearance. After onsite data are collected, the assessment is conducted based on the assessed and measured condition scores. The item score depends on the impact of the item to the integrity, stability and service reliability of the overhead transmission lines. The major impact of the item will give a higher score. The method to set the impact of the item to the asset is achieved using historical collected data. The historical data is taken from the energy commission annual reports and service assessment report compiled by the electricity utility company. These historical data give the service life data for determining the age factor. The critical factor is a value which is set by the energy utility company in relation to the frequency of occurrence of service disturbance along a specific span of transmission line.
The critical factor is dictated by accessibility, environmental exposure and ground condition of the transmission tower where the span of the transmission line needs to be monitored more often compared to the non-critical lines. The value set for critical line is 0.5 and 1.0 for non-critical line. The mode score is the impact of the indicators to the overhead transmission lines. The mode score is determined by using the previous assessment of the component thru the historical data. The health index calculation is formulated as per Equation (9).
H I = i = 1 m C i × I i × C F i   x A F i
where I is the item score (total item score should be 100%), C is the condition score, CF is the critical factor, AF is age factor and m is a total number of items. Meanwhile, Total Health Index (THI) in the percentage of overall transmission lines can be determined in Equation (10).
T H I = j = 1 n H I i × M i 100
where HI is the health index per indicator, M is the mode score (must be total = 100%) and n is a total number of components. The health index is ranged relatively in a form of fraction of its best condition where HI = 100% which means a brand-new condition. It needs no maintenance or just requires normal maintenance. If the HI < 25%, it means very poor condition, which needs immediate action. Table 2 indicates the suggestion range of health index value and its meaning. The result of the health index shows the condition of the overhead transmission lines, whether they are in good condition or in very poor condition, and whether repair or maintenance is needed. Based on the result of the HI, the maintenance can be scheduled, and the cost can be estimated. Therefore, the life span of the overhead transmission lines can be increased.

3. Results

The case study of the overhead transmission lines, scoring and calculation, are taken from a transmission line located in two difference area. Table 3 shows an example of the health index scoring for a single span of the overhead transmission line. The condition scores of the component and item are filled by the patrolmen based on the visual assessment and non-destructive test. The data taken will be processed and normalized to the nominal number in order to calculate the health index as shown in Table 3. The normalization needed due to the checking sheet from the patrolmen comes in several types. The result is ranged from good to very poor where the maintenance plan can be strategized.
Figure 7 shows one of the health indices for the transmission line in the scenario 1. The case study in this scenario lies in the industrial area. The length of transmission lines depends on the range of substation to another substation. The results of transmission lines in the scenario 1 indicate that eight towers in the transmission lines are in poor condition, two towers are in fair condition and five towers are in good condition. The overall condition of transmission lines is calculated based on the median of all the health index in the transmission line. From the graph, the overall condition of transmission lines calculated in the scenario 1 is 49.5% where the condition is classified as poor condition based on ranking and indication in Table 2.
However, Figure 8 shows one of the case studies of the overall health index condition in the scenario 2. The case study in this scenario lies in the coastal area. The number of spans includes in this transmission line are 20, and the outcomes of the overall condition of overhead transmission lines in the scenario 2 are 33.5%, which is classified as poor condition. The results of transmission lines in scenario 2 indicate that three towers in the transmission lines are in very poor condition, 11 towers are in poor condition, four towers are in fair condition and three towers are in good condition. Based on Figure 7 and Figure 8, the poor condition cause in the lines is due to the low condition score and the spatial condition of the transmission lines. The corrosion of the item structure is more severe in these locations compared to other location. From this information, the maintenance team will acknowledge the name of the tower, location and condition of the transmission lines that reflect the health status which is needed for the maintenance work or any job required to be implemented. The results give the information to the owner on the severity of the transmission line whether repair works are required immediately or not.
This information helps the maintenance team plan how frequently inspection and maintenance needs to be done. Moreover, any sign of the item distress beyond the normal condition is a sign that the problem will induce the interruption of the service to the consumer. Based on the case study, the structural distress is the most common problem found, followed environmental conditions. The item shows the severity of the corrosion to the tower and the condition of the foundation which may lead to the interruption of the energy supply. The environmental criteria play a significant role in the total health index. Different environmental exposure of the overhead transmission lines provides different condition factor and give different health index results. This case study reflects a study by Fathoni et al. [38] on steel building material that revealed estimated service life of metallic materials in different environmental zones. The overall condition of health index can help operators to create a ranking list in order to determine which line should be prioritized to be renovated, exchange, remove and rebuild.

4. Discussion

A number of researchers have used the health index approach in their studies. Based on the previous research, it is clear that considering the impact factor, scoring and ranking method of the condition of the asset is the best practice. The component that leads to the failure of the asset gives the highest impact factor, scores, and ranking weightage. This consideration will optimize the condition of the asset. Moreover, the implementation of the risk indices to the health index improves accuracy to the asset management. From this application, the assessment can be made for maintenance, refurbish or replacement. The risk factor needs to be identified based on the location of the asset, and it varies depending on the location of the asset. The research concludes that the health indices provide the basis for assessing the overall condition of the asset.
In this paper, the proposed method of determining the health index is to take into consideration the critical factor and the age factor of the lines. The condition-based assessment is taken as a basis of developing the framework, as this assessment is conducted as part of a routine schedule. We found that there are a number of common areas where the health index of transmission lines has been calculated and determined by previous studies. However, they did not consider the environmental condition of the transmission lines in their parameter. Some of the researchers considered the foundation in their studies, but they did not include the environmental indicators. The health index parameter depends on the location of the asset. It is the reason the previous researchers have considered different parameters. In this proposed research, the foundation and the environmental factor are included in the indicators of the overhead transmission lines. Based on those findings, current practice in place and historical data gathered from the Energy Commission of Malaysia, three indicators with more than 14 specific items have been considered to be able to reflect the service condition of a transmission line in Peninsular Malaysia.
Furthermore, the critical factor and age are included in the calculation of health index due to the condition of Malaysia geographically. The critical factor is dictated by accessibility, environmental exposure and ground condition of the transmission tower. As the case study shows in Section 3, environmental exposure influences the severity of the corrosion to the tower and the condition of the foundation which may lead to the interruption of the energy supply. Different environmental exposure of the overhead transmission lines provides different condition factor and given different health index result. The health index is a solution where the cost in the maintenance and operation can be strategized. A cost-benefit analysis (CBA) is used to evaluate the appropriate transmission planning strategy, with the costs being the long-term investment costs in the operation and maintenance cost. A cost-benefit analysis is a process by which the operator can analyse decisions, systems or projects, or determine a value for intangibles. The model is built by identifying the benefits of action as well as the associated costs and subtracting the costs from benefits. When completed, a cost-benefit analysis will yield concrete results that can be used to develop reasonable conclusions around the feasibility and/or advisability of a decision or situation. Implementing the CBA analysis to the health index will benefit the operator by reducing the capital, operational and maintenance expenditures.

5. Conclusions

In conclusion, the health index is determined by taking into consideration the condition rating of three indicators, which are: structural, electrical and environmental. These three indicators cover almost all parameters relating to an overhead transmission line. The health index of these three indicators is combined and the overall health index of the transmission line on a specific span is identified. The overall condition of overhead transmission lines is based on the combination of all the health index results throughout the lines. The results of the health index can explain which items in the indicator, environment exposure, and the geographical condition influence the health of the transmission line. The goal of reducing the unscheduled interruption of the power supply can be reached by using the method of health index proposed by this study. This finding will be of advantage to the energy utility company and the consumer.
This study plays an essential role in the energy industry to identify which area, lines and towers need extra attention and which areas are in good condition. By calculation of the health index and implementation of cost-benefit analysis, the energy operator will gather information on the overall condition of overhead transmission lines in the Peninsular Malaysia. Overall, this study helps to reduce capital, operational and maintenance expenditures. What remains of the fund can be allocated towards investment in other projects and programs. The result of the health index and well-planned assessment and maintenance program is effective regulatory compliance, safety and less energy disruption during operating conditions, and a consistent return on investment. Further study on adding risk analysis and cost-benefit analysis into the health index will be expected to optimize the health index determination of the transmission lines. The risk analysis will include the hazard and criticality of the overhead transmission lines.

Author Contributions

Conceptualization, R.H., F.U. and I.N.Z.B.; Methodology, R.H; Validation, R.H., F.U.; Investigation, R.H.; Resources R.H, I.N.Z.B.; Data curation, R.H., F.U., I.N.Z.B.; Writing—original draft preparation, R.H.; Writing—review and editing, F.U., I.N.Z.B.; Supervision, F.U., I.N.Z.B.; project administration, R.H., F.U., I.N.Z.B.; funding acquisition, I.N.Z.B.

Funding

This research is funded by UNITEN R&D Sdn. Bhd under project U-TS-RD-18-14.

Acknowledgments

The authors gratefully acknowledge the contribution in administration and technical support from the department of Civil Engineering, Information Technology from University of Tenaga Nasional.

Conflicts of Interest

The authors declare no conflicts of interest.

References

  1. Election Commission of Malaysia. Performance and Statistical Information in Malaysia 2016; Election Commission of Malaysia: Putrajaya, Malaysia, 2016.
  2. Tenaga Nasional Berhad. Growing Better Together: Integrated Annual Report 2017; Tenaga Nasional Berhad: Kuala Lumpur, Malaysia, 2017. [Google Scholar]
  3. Election Commission of Malaysia. Performance of the Electricity Supply Services in Malaysia 2005; Election Commission of Malaysia: Putrajaya, Malaysia, 2005.
  4. Election Commission of Malaysia. Electricity Supply Industry in Malaysia: Performance and Statistical Information 2014; Election Commission of Malaysia: Putrajaya, Malaysia, 2014.
  5. Election Commission of Malaysia. Electricity Supply Industry in Malaysia: Performance and Statistical Information 2015; Election Commission of Malaysia: Putrajaya, Malaysia, 2015.
  6. Election Commission of Malaysia. Electricity Supply Industry in Malaysia: Performance and Statistical Information 2006; Election Commission of Malaysia: Putrajaya, Malaysia, 2006.
  7. Election Commission of Malaysia. Electricity Supply Industry in Malaysia: Performance and Statistical Information 2007; Election Commission of Malaysia: Putrajaya, Malaysia, 2007.
  8. Election Commission of Malaysia. Electricity Supply Industry in Malaysia: Performance and Statistical Information 2008; Election Commission of Malaysia: Putrajaya, Malaysia, 2008.
  9. Election Commission of Malaysia. Electricity Supply Industry in Malaysia: Performance and Statistical Information 2009; Election Commission of Malaysia: Putrajaya, Malaysia, 2009.
  10. Election Commission of Malaysia. Electricity Supply Industry in Malaysia: Performance and Statistical Information 2010; Election Commission of Malaysia: Putrajaya, Malaysia, 2010.
  11. Election Commission of Malaysia. Electricity Supply Industry in Malaysia: Performance and Statistical Information 2011; Election Commission of Malaysia: Putrajaya, Malaysia, 2011.
  12. Election Commission of Malaysia. Electricity Supply Industry in Malaysia: Performance and Statistical Information 2012; Election Commission of Malaysia: Putrajaya, Malaysia, 2012.
  13. Election Commission of Malaysia. Electricity Supply Industry in Malaysia: Performance and Statistical Information 2013; Election Commission of Malaysia: Putrajaya, Malaysia, 2013.
  14. Thongchai, P.; Pao-La-Or, P.; Kulworawanichpong, T. Condition-based health index for overhead transmission line maintenance. In Proceedings of the 2013 10th International Conference on Electrical Engineering/Electronics, Computer, Telecommunications, and Information Technology, ECTI-CON 2013, Krabi, Thailand, 15–17 May 2013. [Google Scholar]
  15. Zhang, D.; Li, W.; Xiong, X. Overhead line preventive maintenance strategy based on condition monitoring and system reliability assessment. IEEE Trans. Power Syst. 2014, 29, 1839–1846. [Google Scholar] [CrossRef]
  16. Tsimberg, Y.; Lotho, K.; Dimnik, C.; Wrathall, N.; Mogilevsky, A. Determining Transmission Line Conductor Condition and Remaining Life. In Proceedings of the 2014 IEEE PES T&D Conference and Exposition, Chicago, IL, USA, 14–17 April 2014; pp. 1–5. [Google Scholar]
  17. Hjartarson, T.; Jesus, B.; Hughes, D.; Godfrey, R.M. Development of Health Indices for Asset Condition Assessment. In Proceedings of the 2003 IEEE PES Transmission and Distribution Conference and Exposition (IEEE Cat. No.03CH37495), Dallas, TX, USA, 7–12 September 2003; Volume 2, pp. 541–544. [Google Scholar]
  18. Dorison, E.; Lesur, F.; Meurice, D.; Roinel, G. Health Index. In Proceedings of the JICABLE07, Versailles, France, 24–28 June 2007. [Google Scholar]
  19. Jahromi, A.N.; Piercy, R.; Cress, S.; Service, J.R.R.; Fan, W. An approach to power transformer asset management using health index. IEEE Electr. Insul. Mag. 2009, 25, 20–34. [Google Scholar] [CrossRef]
  20. Haema, J.; Phadungthin, R. Condition assessment of the health index for power transformer. In Proceedings of the 2012 Power Engineering and Automation Conference, Wuhan, China, 18–20 September 2012; pp. 2–5. [Google Scholar]
  21. Suwanasri, T.Y.; Suwanasri, C.; Phadungthin, R. Risk assessment based on condition and importance criteria for power transformer in Thailand transmission network. IEEJ Trans. Electr. Electron. Eng. 2015, 10, 18–27. [Google Scholar] [CrossRef]
  22. Murugan, R.; Ramasamy, R. Understanding the power transformer component failures for health index-based maintenance planning in electric utilities. Eng. Fail. Anal. 2018, 96, 274–288. [Google Scholar] [CrossRef]
  23. Hernanda, I.G.N.S.; Mulyana, A.C.; Asfani, D.A.; Negara, I.M.Y.; Fahmi, D. Application of health index method for transformer condition assessment. In Proceedings of the TENCON IEEE Region 10 Annual International Conference, Bangkok, Thailand, 22–25 October 2014. [Google Scholar]
  24. Suwanasri, T.; Phadungthin, R.; Suwanasri, C. Risk-based maintenance for asset management of power transformer: Practical experience in Thailand. Int. Trans. Electr. Energy Syst. 2014, 24, 1103–1119. [Google Scholar] [CrossRef]
  25. Pompili, M.; Scatiggio, F. Classification in iso-attention classes of hv transformer fleets. IEEE Trans. Dielectr. Electr. Insul. 2015, 22, 2676–2683. [Google Scholar] [CrossRef]
  26. German, M.O.; Molina, J.D.; Romero, A.A.; Gomez, H.D.; Garcia, E. Power asset management: Methods and experiences in Colombian power system. In Proceedings of the 2014 IEEE PES Transmission & Distribution Conference and Exposition, Medellin, Colombia, 10–13 September 2014. [Google Scholar]
  27. Martins, M.A. Condition and risk assessment of power transformers: A general approach to calculate a Health Index. Ciência Tecnologia dos Materiais 2014, 26, 9–16. [Google Scholar] [CrossRef]
  28. Vahidi, B.; Zeinoddini-Meymand, H. Health index calculation for power transformers using technical and economical parameters. IET Sci. Meas. Technol. 2016, 10, 823–830. [Google Scholar]
  29. Bayliss, C. Transmission and Distribution Electrical Engineering, 2nd ed.; Newnes: Oxford, UK, 1999. [Google Scholar]
  30. Tdc, K.; van der Wal, A.; Ross, A.A.H.J. B2-204 Condition Assessment of Overhead Lines; Assessment; CIGRE: Paris, France, 2004; pp. 1–8. [Google Scholar]
  31. Liu, Y.; Xv, J.; Yuan, H.; Lv, J.; Ma, Z. Health Assessment and Prediction of Overhead Line Based on Health Index. IEEE Trans. Ind. Electron. 2019, 66, 5546–5557. [Google Scholar] [CrossRef]
  32. Junaizee, M.; Noor, M.; Birtwhistle, D.; Bell, S.C. Application of Knowledge-Based Expert System to High-Voltage Transmission Line Maintenance. Master’s Thesis, Queensland University of Technology, Brisbane City, Australia, 2014. [Google Scholar]
  33. Gusavac, S.J.; Nimrihter, M.D.; Geric, L.R. Estimation of overhead line condition. Electr. Power Syst. Res. 2008, 78, 566–583. [Google Scholar] [CrossRef]
  34. Kamarudin, S.A. Review on analysis and design of lattice steel structure of overhead transmission tower. Int. J. Adv. Appl. Sci. 2018, 5, 73–80. [Google Scholar] [CrossRef]
  35. Persson, L.I. Corrosion Attack in Midspan Joints in ACSR Transmission Conductors. In Proceedings of the 10th International Conference on Electricity Distribution, CIRED, Brighton, UK, 8–12 May 1989. [Google Scholar]
  36. Duxbury, J. Foundation Steel Corrosion Inspection & Repair at BCHydro. In Proceedings of the 1st Annual Overhead Transmission Line Equipment, Inspection & Maintenance Practices Conference, Monterey, CA, USA, 14–16 May 2002. [Google Scholar]
  37. Usman, F.; Hamim, S.A. Electric Power Transmission Tower Assessment: The Needs and Current Practices. In Proceedings of the Seminar Nasional AVoER IX 2017, Palembang, Indonesia, 29 November 2017. [Google Scholar]
  38. Usman, F. Neural Network Model Development for Service Life Prediction of Building Components. Ph.D. Thesis, Universiti Teknologi Malaysia, Skudai, Malaysia, 2008. [Google Scholar]
Figure 1. Compilation of electrical interruption from 2000 to 2016 in Peninsular Malaysia.
Resources 08 00080 g001
Figure 2. Process of determining Health Index.
Resources 08 00080 g002
Figure 3. Process of determining the health index and remaining life.
Resources 08 00080 g003
Figure 4. Process of determining the asset health and risk index.
Resources 08 00080 g004
Figure 5. Process of determining the health index of the transformer.
Resources 08 00080 g005
Figure 6. Proposed Process of determining the condition of the overhead transmission lines.
Resources 08 00080 g006
Figure 7. Overall health index condition of transmission lines in scenario 1.
Resources 08 00080 g007
Figure 8. Overall health index condition of transmission lines in scenario 2.
Resources 08 00080 g008
Table 1. Common components of overhead transmission lines based on previous research.
ComponentParameterR1
[14]
R2
[15]
R3
[30]
R4
[31]
R5
[32]
R6
[33]
FoundationWide cracks--
Damage to concrete cover--
Rusting reinforcement---
Extensive damage----
Damage of slope protection -----
Flood control facilities-----
TowerTower crack condition
Tower inclination--
Corrosion--
Missing Component-----
ConductorWire sag--
Wire strand broken-
Wire loose strands----
Corrosion---
InsulatorInsulator pollution grade-
Insulator service time---
Cracked insulator---
EnvironmentConstruction condition near the tower--
Vehicles --
Forest/Tree barrier condition--
Thunder and lightning----
Strong wind Strong rainfall-----
Grounding/
Lightning System
Ground resistance--
No overhead ground wires-----
Broken overhead ground wire----
Table 2. Classification of Health Index (HI).
The Classification of Health Index %
Health IndexRanking or Indication
75 ≤ HI ≤ 100Good
50 ≤ HI < 75Fair
25 ≤ HI < 50Poor
HI < 25Very Poor
Table 3. Calculation of health index in scenario 1 on a critical span.
Scenario 1IndicatorSub-IndicatorItemMiIiCiCFiAFiHIiHITotal HIRating
T01StructureBracingBracing (Concern Area)307010.513538.751065POOR
Bracing (Corrosion Condition)300.250.513.75
Cross ArmCross Arm (Wood Condition) 5010.512537.5
Cross Arm (Composite Type) 500.50.5112.5
Tower LegTower Leg Condition1000.750.5137.537.5
StubStub (Immersed Condition)2010.511035
Stub (Bent Condition)400.750.5115
Stub (Rusty Condition)400.50.5110
FoundationFoundation (Condition)300.750.5111.2528.75
Foundation (Erosion Sign)300.50.517.5
Foundation (Landslide Sign)400.50.5110
ElectricalConductorConductor Condition201000.750.5137.537.5856.3
DamperDamper (Availability)7010.513542.5
Damper (Condition)300.50.517.5
Midspan JointMidspan Joint (Thermo Scan)10010.515050
InsulatorInsulator (Material)300.750.5111.2541.25
Insulator (Type)3010.5115
Insulator (Environmental Exposure)400.750.5115
EnvironmentEncroachmentSpatial Condition50400.750.5115301781
Encroachment Type400.250.515
Encroachment Width2010.5110
Ground ClearanceGround Clearance1000.750.5137.537.5
Tower FootingTower Footing Resistant5010.512550
Earth TapingEarth Taping Condition5010.5125
Slope AssessmentSlope Assessment1000.50.512525
Total (%) Health Index37.03

