Households’ Willingness-to-Pay for Fish Product Attributes and Implications for Market Feasibility of Wastewater-Based Aquaculture Businesses in Hanoi, Vietnam

Abstract
1. Introduction
2. Materials and Methods
2.1. Theoretical Framework
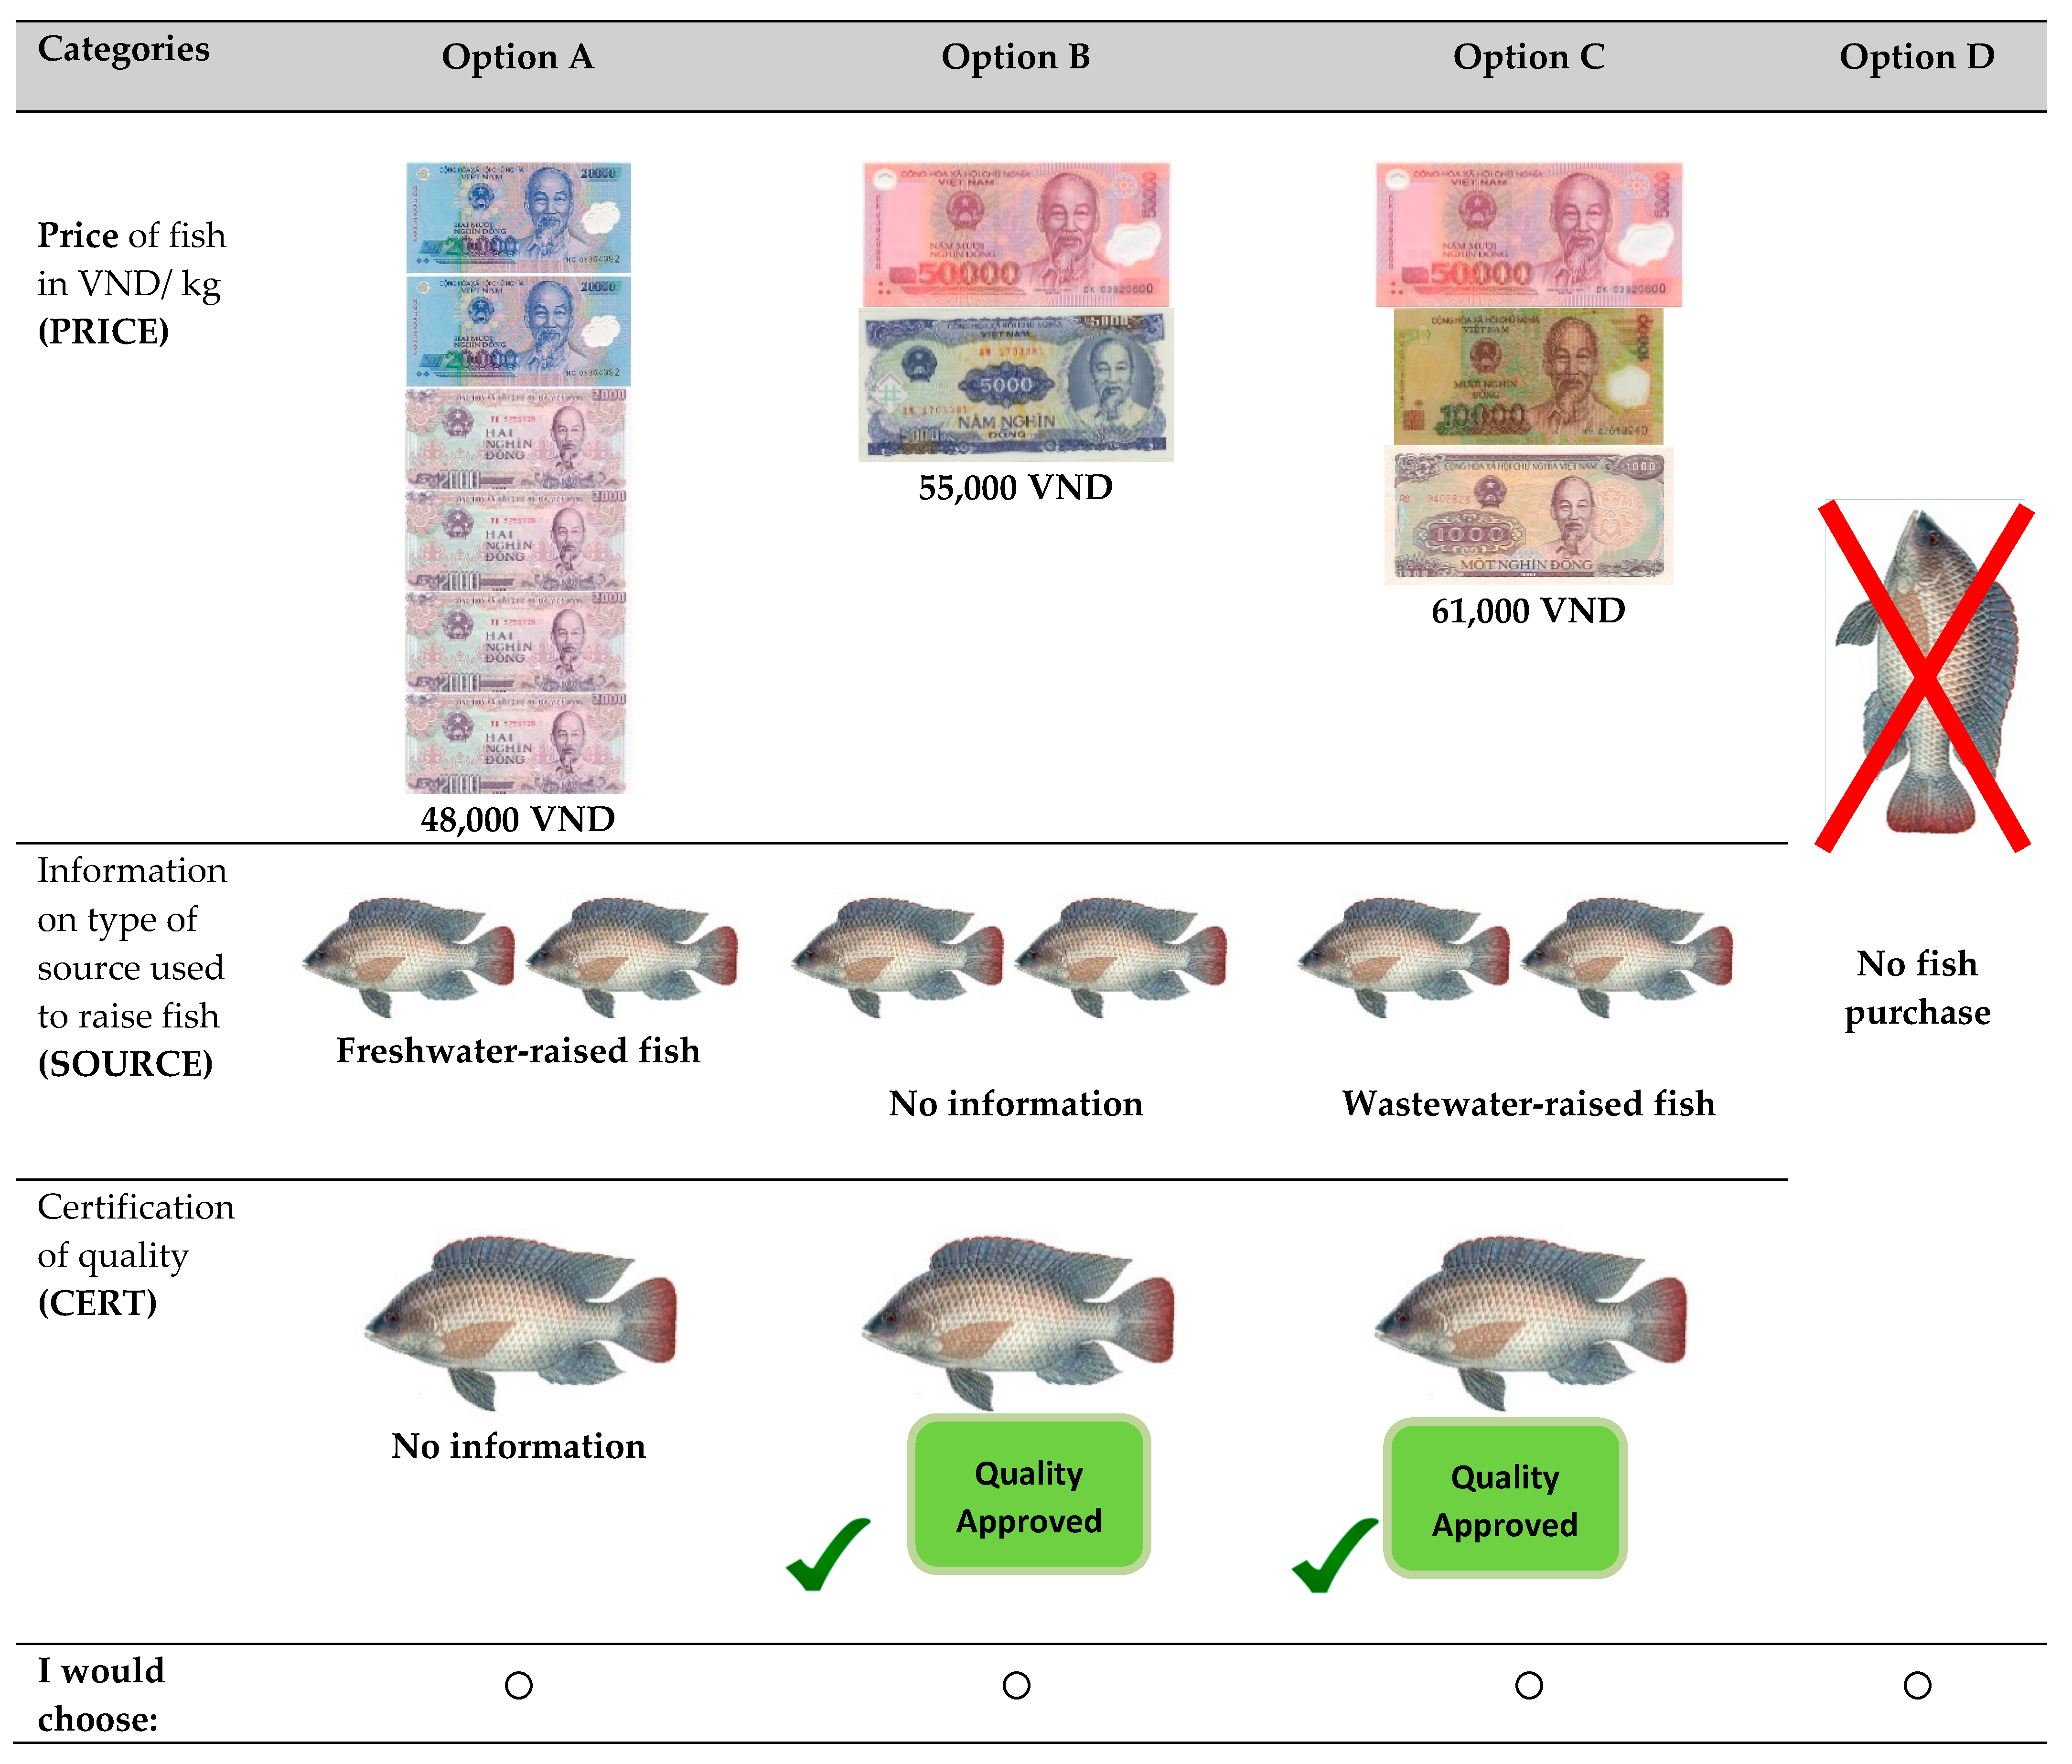
2.2. The Experiment Design
2.3. Study Area and Sampling Strategy
3. Results and Discussion
3.1. Socio-Demographic Characteristics of Households
3.2. Households' Fish Consumption Patterns and Purchasing Decisions
3.3. Households’ Perceptions of Wastewater-Raised Fish
3.4. Choice Modeling Results
3.4.1. Random Parameter Logit (RPL) Model Results
3.4.2. Latent Class Model (LCM) Results
Households’ Characteristics and Latent Class Segments
3.4.3. Households’ Marginal Willingness-to-Pay
4. Costs and Benefits of Certification
5. Conclusions
Acknowledgments
Author Contributions
Conflicts of Interest
Appendix A.
Appendix B


| Factors | Components | |||||
|---|---|---|---|---|---|---|
| 1 | 2 | 3 | 4 | 5 | 6 | |
| Taste is the most important factor | 0.050 | 0.688 | 0.178 | −0.201 | 0.014 | −0.091 |
| To know clearly the source of fish consumed | 0.050 | −0.183 | −0.023 | 0.826 | −0.080 | −0.252 |
| Having reliable sellers available | −0.017 | 0.110 | 0.079 | 0.790 | 0.207 | 0.071 |
| Safety in use is important | 0.095 | 0.278 | −0.040 | 0.315 | 0.678 | 0.000 |
| No negative impacts on health | −0.022 | −0.139 | 0.121 | −0.062 | 0.865 | 0.036 |
| Fresh gills are the most important factor | 0.327 | 0.552 | −0.106 | -0.052 | 0.490 | −0.016 |
| Fresh fin is an important factor | 0.913 | −0.014 | 0.082 | 0.019 | 0.092 | 0.036 |
| Fresh and clear eyes are important factors | 0.872 | 0.167 | −0.030 | 0.051 | 0.034 | −0.103 |
| Undamaged, unscratched fishtail is an important factor | 0.869 | −0.022 | 0.141 | 0.006 | 0.058 | 0.106 |
| It is important that the fish is healthy and can swim fast | 0.669 | 0.298 | 0.185 | 0.026 | −0.053 | 0.017 |
| Ease in processing is an important factor | 0.201 | 0.147 | 0.797 | −0.009 | 0.057 | 0.119 |
| Limited time needed to process and cook fish | 0.147 | −0.012 | 0.896 | 0.061 | −0.067 | 0.094 |
| How the sellers pre-process the fish is an important factor | −0.062 | 0.441 | 0.655 | 0.088 | 0.078 | −0.281 |
| A convenient location to purchase the fish is an important factor | 0.018 | 0.575 | 0.550 | −0.069 | 0.247 | 0.307 |
| Low price is an important factor | −0.002 | 0.086 | 0.091 | −0.112 | 0.040 | 0.925 |
| Stable price is an important factor | 0.181 | 0.756 | 0.172 | 0.282 | −0.003 | 0.291 |
| Factors | Components | ||||
|---|---|---|---|---|---|
| 1 | 2 | 3 | 4 | ||
| Current technology can treat wastewater for fish rearing | 0.137 | 0.124 | 0.081 | 0.806 | |
| I can observe the wastewater treatment technique | 0.083 | −0.187 | 0.806 | 0.298 | |
| Product safety certification is granted by authorities | 0.808 | −0.048 | 0.029 | 0.136 | |
| Investment and good management is safe | 0.040 | 0.195 | 0.163 | 0.760 | |
| I can directly observe the process | 0.148 | 0.067 | 0.830 | 0.255 | |
| The safety of fish is certified by authorities | 0.901 | 0.038 | 0.125 | 0.082 | |
| Relatives and friends can confirm that the fish is safe | 0.158 | 0.538 | 0.540 | −0.266 | |
| Official mass media can confirm that the fish is safe | 0.461 | 0.620 | −0.079 | 0.162 | |
| Wastewater-raised fish is labeled by supermarkets | 0.081 | 0.488 | 0.618 | −0.239 | |
| The fish is certified by authorities | 0.277 | 0.769 | 0.129 | 0.058 | |
| The fish is cheaper than other types of fish | 0.877 | 0.28 | 0.169 | −0.047 | |
| The fish is sold in central markets | −0.364 | 0.600 | 0.385 | 0.042 | |
| The fish is sold in supermarkets | −0.105 | 0.767 | 0.032 | 0.319 | |
| The fish is sold by the authorized stores | 0.181 | 0.834 | −0.074 | 0.137 | |
References
- Wichelns, D.; Drechsel, P.; Qadir, M. Wastewater: Economic Asset in an Urbanizing World. In Wastewater: Economic Asset in an Urbanizing World; Drechsel, P., Qadir, M., Wichelns, D., Eds.; Springer: Berlin, Germany, 2015; pp. 3–14. [Google Scholar]
- Edwards, P.; Pullin, R.S.V. Wastewater-Fed Aquaculture. In Proceedings of the International Seminar on Wastewater Reclamation and Reuse for Aquaculture, Calcutta, India, 6–9 December 1988; Environmental Sanitation Information Center, Asian Institute of Technology: Bangkok, Thailand, 1988. [Google Scholar]
- Edward, P. Wastewater and Excreta Use in Aquaculture; Asian Institute of Technology: Bangkok, Thailand, 2008; Volume 3. [Google Scholar]
- Vo, Q.H. Wastewater Reuse through Aquaculture in Hanoi: Status and Prospects. Master’s Thesis, Asian Institute of Technology, Bangkok, Thailand, 1996. [Google Scholar]
- World Health Organization (WHO). Guidelines for the Safe Use of Wastewater Excreta and Grey Water. Wastewater and Excreta Use in Aquaculture; World Health Organization: Geneva, Switzerland, 2006; Volume 3. [Google Scholar]
- Nguyen, L.H.; Nguyen, V.A.; Yamaji, E. Wastewater reuse in Thanh Tri District, Hanoi Suburb, Vietnam. In Guidelines for Water Reuse, Appendix E: International Case Studies; USEPA: Washington, DC USA, 2012; pp. E120–E122. [Google Scholar]
- Bunting, S. Confronting the realities of wastewater aquaculture in peri-urban Kolkata with bio economic modeling. Water Res. 2007, 41, 499–505. [Google Scholar] [CrossRef] [PubMed]
- Pal, D.; Das Gupta, C. Microbial pollution in water and its effect on fish. J. Aquat. Anim. Health 1992, 4, 32–39. [Google Scholar] [CrossRef]
- Easa, M.; El-S Shereif, M.M.; Shaaban, A.I.; Mancey, K.H. Public health implications of wastewater reuse for fish production. Water Sci. Tech. 1995, 32, 145–152. [Google Scholar] [CrossRef]
- Lan, N.T.; Dalsgaard, A.; Cam, P.D.; Mara, D. Microbiological quality of fish grown in wastewater-raised and non-wastewater fed fishponds in Hanoi, Vietnam: Influence of hygiene practices in local retail markets. J. Water Health 2007, 5, 209–218. [Google Scholar] [PubMed]
- Fattal, B.; Doan, A.; Tchorsh, Y. Rates of experimental microbiological contamination of fish exposed to polluted water. Water Res. 1992, 26, 1621–1627. [Google Scholar] [CrossRef]
- Edwards, P. Wastewater-raised aquaculture: State-of-the-art. In Proceedings of the International Conference on Ecological Engineering, Science City, Calcutta, India, 23–27 November 1998. [Google Scholar]
- Rao, K.; Taron, A.; Linh, N.D. Financial Assessment of Waste Reuse Business Models in Hanoi, Vietnam SDC Project Report; International Water Management Institute (IWMI): Colombo, Sri Lanka, 2015. [Google Scholar]
- Murray, A.; Cofie, O.; Drechsel, P. Efficiency indicators for waste-based business models: Fostering private-sector participation in wastewater and faecal sludge management. Water Int. 2011, 36, 505–521. [Google Scholar] [CrossRef]
- Mancy, K.H.; Fattal, B.; Kelada, S. Cultural implications of wastewater reuse in fish farming in the Middle East. Water Sci. Tech. 2000, 42, 235–239. [Google Scholar]
- Ortega, D.L.; Wang, H.L.; Wu, L.; Olynk, N. Modeling heterogeneity in consumer preferences for select food safety attributes in China. Food Policy 2011, 36, 318–324. [Google Scholar] [CrossRef]
- Olesen, I.; Alfnes, F.; Røra, M.B.; Kolstad, K. Eliciting consumers' willingness to pay for organic and welfare-labeled salmon in a non-hypothetical choice experiment. Livest. Sci. 2010, 127, 218–226. [Google Scholar] [CrossRef]
- Fonner, R.; Sylvia, G. Willingness to pay for multiple seafood labels in a Niche Market. Mar. Resour. Econ. 2015, 30, 51–70. [Google Scholar] [CrossRef]
- Roheim, C.A.; Sudhakaran, P.O.; Durham, C.A. Certification of shrimp and salmon for best aquaculture practices: Assessing consumer preferences in Rhode Island. J. Aquac. Econ. Manag. 2012, 16, 266–286. [Google Scholar] [CrossRef]
- Nguyen, Q.; Leung, P. Do fishermen have different attitudes towards risk? An application of prospect theory to the study of Vietnamese fishermen. J. Agric. Resour. Econ. 2009, 34, 518–538. [Google Scholar]
- Lusk, J.L.; Hudson, D. Willingness-to-pay estimates and their relevance to agribusiness decision making. Rev. Agric. Econ. 2004, 26, 152–169. [Google Scholar] [CrossRef]
- Kimenju, S.C.; Groote, H.D. Consumer willingness to pay for genetically modified food in Kenya. J. Agric. Econ. 2008, 38, 35–46. [Google Scholar] [CrossRef]
- Ibro, G.; Seydou, R.; Saley, K.; Everhart-Valentin, K.; Fulton, J.; Lowenberg DeBoer, J.; Otoo, M. Testing the Market Potential for a New Value-Added Cowpea Product to Improve the Well-Being of Women Entrepreneurs in West Africa. J. Int. Agric. Ext. Educ. 2008, 16, 43–55. [Google Scholar] [CrossRef]
- Umberger, W.J.; Feuz, D.M. The usefulness of experimental auctions in determining consumers' willingness-to-pay for quality-differentiated products. Rev. Agric. Econ. 2004, 26, 170–185. [Google Scholar] [CrossRef]
- Adamowicz, W.; Boxall, P.; Williams, M.; Louviere, J. Stated preference approaches for measuring passive use values: Choice experiments and contingent valuation. Am. J. Agric. Econ. 1998, 80, 64–75. [Google Scholar] [CrossRef]
- Lusk, J.L.; Schroeder, T.C. Are Choice Experiments Incentive Compatible? A Test with Quality Differentiated Steaks. Am. J. Agric. Econ. 2004, 86, 467–482. [Google Scholar] [CrossRef]
- Birol, E.; Karousakis, K.; Koundouri, P. Using a choice experiment to account for preference heterogeneity in wetland attributes: The case of Cheimaditida wetland in Greece. J. Ecol. Econ. 2006, 60, 145–156. [Google Scholar] [CrossRef]
- Ndunda, E.; Mungatana, E. Evaluating the welfare effects of improved wastewater treatment using a discrete choice experiment. J. Environ. Manag. 2013, 123, 49–57. [Google Scholar] [CrossRef] [PubMed]
- Honkanen, P.; Olsen, S.O. Environmental and animal welfare issues in food choice: The case of farmed fish. Br. Food J. 2009, 111, 293–309. [Google Scholar] [CrossRef]
- Vanhonacker, F.; Altintzoglou, J.; Luten, T.; Verbeke, W. Does fish origin matter to European consumers? Insights from a consumer survey in Belgium, Norway and Spain. Br. Food J. 2011, 113, 535–549. [Google Scholar] [CrossRef]
- Ubilava, D.; Foster, K. Quality certification vs. product traceability: Consumer preferences for informational attributes of pork in Georgia. Food Policy 2009, 34, 305–310. [Google Scholar] [CrossRef]
- Hensher, D.A.; Rose, J.M.; Green, W.H. Applied Choice Analysis: A primer; Cambridge University Press: New York, NY, USA, 2005. [Google Scholar]
- De Bekker-Grob, E.W.; Donkers, B.; Jonker, M.F.; Stolk, E.A. Sample size requirements for discrete-choice experiment in healthcare: A Practical Guide. Patient 2015, 8, 373–384. [Google Scholar] [CrossRef] [PubMed]
- General Statistics Office (GSO). The Vietnam Population and Housing Census, 2009; General Statistics Office: Hanoi, Vietnam, 2010; Available online: https://unstats.un.org/unsd/demographic/sources/census/wphc/Viet%20Nam/Vietnam-Findings.pdf (accessed on 17 May 2016).
- Swait, J.; Louviere, J. The role of the scale parameter in the estimation and comparison of multinomial logit models. J. Mark. Res. 1993, 30, 305–314. [Google Scholar] [CrossRef]
- Louviere, J.; Hensher, D.; Swait, J. Stated Choice Methods: Analysis and Applications, 1st ed.; Cambridge University Press: Cambridge, UK, 2002. [Google Scholar]
- Kline, P. An Easy Guide to Factor Analysis; Routledge: Abingdon, Oxon, 1994; pp. 14–42. [Google Scholar]
- Field, A. Discovering Statistics Using SPSS, 2nd ed.; SAGE: London, UK, 2005. [Google Scholar]
- Bechtold, K.B.; Abdulai, A. Combining attitudinal statements with choice experiments to analyze preference heterogeneity for functional dairy products. Food Policy 2014, 47, 97–106. [Google Scholar] [CrossRef]
- Hensher, D.A.; Green, W.H. The mixed logit model: The state of practice. J. Transp. 2003, 30, 133. [Google Scholar] [CrossRef]
- Marschke, M.; Wilkings, A. Is certification a viable option for small producer fish farmers in the global south? Insights from Vietnam. Mar. Policy 2014, 50, 197–206. [Google Scholar]
- Meijer, E.; Rouwendal, J. Measuring welfare effects in models with random coefficients. J. Appl. Econ. 2006, 21, 227–244. [Google Scholar] [CrossRef]
- Train, K.E. Discrete Choice Methods with Simulation; Cambridge Books; Cambridge University Press: Cambridge, UK; New York, NY, USA, 2003. [Google Scholar]
- Train, K.E. Recreation demand models with taste differences over people. Land Econ. 1998, 74, 230–239. [Google Scholar] [CrossRef]
- Boxall, P.; Adamowicz, W. Understanding heterogeneous preferences in random utility models. A latent class approach. J. Environ. Resour. Econ. 2002, 23, 421–446. [Google Scholar] [CrossRef]
- Ouma, E.; Abdulai, A.; Drucker, A. Measuring heterogeneous preferences for cattle traits among cattle-keeping households in East Africa. Am. J. Agric. Econ. 2007, 89, 1005–1019. [Google Scholar] [CrossRef]
- Lim, K.H.; Hu, W.; Maynard, L.J.; Goddard, E. U.S. consumers’ preference and willingness to pay for country-of-origin labeled beef streak and food safety enhancements. Can. J. Agric. Econ. 2013, 62, 93–118. [Google Scholar] [CrossRef]
- Krinsky, L.; Robb, A.L. On approximating the statistical properties of elasticities. Rev. Econ. Stat. 1986, 68, 715–719. [Google Scholar] [CrossRef]
| Categories | Attribute Levels | Description | Coding |
|---|---|---|---|
| 1. Price of fish in USD/kg (VND/kg) | 2.18; 2.50; 2.77 (48,000; 55,000; 61,000) | Refers to the retail price of fish or market price of fish where respondents typically shop. | Continuous variable |
| 2. Information on medium or source used to raise the fish - source of fish (SOURCE) | - None; - Farmed fish (freshwater); - Wastewater-raised fish (wastewater) | Fish product carries information regarding the medium used to rear the fish; - None denotes if there is no information on the source of water used to raise fish; - Farmed fish (freshwater) indicates that freshwater is used to raise fish; - Wastewater-raised fish indicates that wastewater is used to raise fish. | Dummy variables |
| 3. Certification for quality (CERT) | Yes; No | If present product carries a label issued by an organization a assuring that the product was inspected throughout the production process for safety and quality. | Dummy variable |
| Fish Attributes | Option A | Option B | Option C | Option D |
|---|---|---|---|---|
| Price in USD/ kg (VND/kg) | 2.18 (48,000) | 2.50 (55,000) | 2.77 (61,000) | If options A, B, and C were all that was available at my local shop I would not purchase fish from that shop. |
| Source | Freshwater | None | Wastewater | |
| Certification | No | Yes | Yes | |
| I would choose… | ○ | ○ | ○ | ○ |
| Respondents’ Characteristics | Variable | Percentage (%) | National Statistics |
|---|---|---|---|
| Gender | Male | 83 | 74.1 |
| Female | 17 | 25.9 | |
| Age | <25 | 8.1 | 24.3 |
| 26–35 | 20 | 17.8 | |
| 36–45 | 24.4 | 20 | |
| 46–55 | 26.7 | 24.8 | |
| 56–65 | 12.6 | 7.4 | |
| >65 | 6.7 | 5.7 | |
| Education level | Up to grade 12 | 72.6 | 77 |
| Some college | 10.4 | 23 | |
| University | 10.4 | ||
| Annual Household Income (in USD) | 0–455 | 71.1 | 6000 |
| 456–910 | 13.3 | ||
| 911–1364 | 1.5 | ||
| 1365–1818 | 2.2 | ||
| >1819 | 11.9 | ||
| Household size | <2 | 9.6 | 3.85 |
| 3 | 24.8 | ||
| 4 | 41.6 | ||
| 5 | 14.6 | ||
| 6 | 8 |
| Criteria | Five-Level Likert Scale Ranking | ||||
|---|---|---|---|---|---|
| True | True But Not Completely Correct | Maybe True | False | No Idea | |
| Percent of Surveyed Respondents | Percent of Surveyed Respondents | Percent of Surveyed Respondents | Percent of Surveyed Respondents | Percent of Surveyed Respondents | |
| 1. Taste is the most important factor | 78.7 | 14.0 | 3.7 | 2.9 | |
| 2. To know clearly the source of fish consumed | 50.7 | 22.8 | 21.3 | 2.2 | 2.2 |
| 3. Having reliable sellers available | 55.1 | 30.9 | 11.8 | 1.5 | |
| 4. Safety in use is important | 83.8 | 13.2 | 2.2 | ||
| 5. No negative impacts on health | 74.3 | 22.8 | 0.7 | 1.5 | |
| 6. Fresh gills are the most important factor | 49.3 | 36.8 | 11.8 | 1.5 | |
| 7. Fresh fin is an important factor | 19.1 | 47.8 | 27.9 | 3.7 | 0.7 |
| 8. Fresh and clear eyes are important factors | 24.3 | 50.1 | 22.1 | 1.5 | 0.7 |
| 9. Undamaged, unscratched fishtail is an important factor | 16.9 | 46.3 | 27.9 | 7.4 | 0.7 |
| 10. It is important that the fish is healthy and can swim fast | 51.5 | 33.1 | 12.5 | 12.5 | 2.2 |
| 11. Ease in processing is an important factor | 24.3 | 25.7 | 32.4 | 14.7 | 2.2 |
| 12. Limited time needed to process and cook fish | 5.9 | 30.9 | 39 | 19.1 | 4.4 |
| 13. How the sellers pre-process the fish is an important factor | 18.4 | 28.7 | 37.5 | 13.2 | 1.5 |
| 14. A convenient location to purchase the fish is an important factor | 43.4 | 22.8 | 23.5 | 9.6 | |
| 15. Low price is an important factor | 21.3 | 23.5 | 25.7 | 28.7 | |
| 16. Stable price is an important factor | 39.7 | 25.7 | 26.5 | 7.4 | |
| 17. Clear price tags are important factors | 27.9 | 23.5 | 36.8 | 9.6 | 1.5 |
| Criteria - I Would Buy Wastewater-Raised Fish If: | Five-level Likert scale ranking | ||||
|---|---|---|---|---|---|
| Strongly Disagree | Disagree | Neutral | Agree | Strongly Agree | |
| Percent of Surveyed Respondents | Percent of Surveyed Respondents | Percent of Surveyed Respondents | Percent of Surveyed Respondents | Percent of Surveyed Respondents | |
| 1. Current technology can treat wastewater for fish rearing | 3.7 | 5.9 | 21.3 | 59.6 | 8.8 |
| 2. I can observe the wastewater treatment technique | 14 | 31.6 | 43.4 | 10.3 | |
| 3. Product safety certification is granted by authorities | 1.5 | 2.9 | 5.9 | 53.7 | 35.3 |
| 4. Investment and good management is safe | 2.9 | 2.9 | 24.3 | 61 | 8.1 |
| 5. I can directly observe the process | 1.5 | 8.8 | 31.6 | 48.5 | 8.8 |
| 6. The safety of fish is certified by authorities | 1.5 | 3.7 | 3.7 | 55.1 | 35.3 |
| 7. Relatives and friends can confirm that the fish is safe | 1.5 | 14.7 | 23.5 | 54.4 | 5.1 |
| 8. Official mass media can confirm that the fish is safe | 1.5 | 7.4 | 21.3 | 59.6 | 9.6 |
| 9. Wastewater-raised fish is labeled by supermarkets | 2.2 | 14.7 | 30.1 | 44.1 | 8.1 |
| 10. The fish is certified by authorities | 0.7 | 4.4 | 1.5 | 51.5 | 41.2 |
| 11. The fish is cheaper than other types of fish | 22.8 | 29.4 | 25 | 18.4 | 3.7 |
| 12. The fish is sold in central markets | 5.9 | 19.1 | 28.7 | 41.9 | 3.7 |
| 13. The fish is sold in supermarkets | 5.9 | 9.6 | 36.8 | 39 | 8.1 |
| 14. The fish is sold by the authorized stores | 1.5 | 2.9 | 2.9 | 52.2 | 39.7 |
| Index | Description of Factor Aggregation |
|---|---|
| Perception 1 | Component 1: |
| Fresh fin is an important factor | |
| Fresh and clear eyes are important factors | |
| Undamaged, unscratched fishtails is an important factor | |
| It is important that the fish is healthy and can swim fast | |
| Component 2: | |
| Taste is the most important factor | |
| Fresh gills are the most important factor | |
| A convenient location to purchase the fish is an important factor | |
| Stable price is an important factor | |
| Clear price tags are important factors | |
| Component 4: | |
| To know clearly the source of fish consumed | |
| Having reliable sellers available | |
| Component 5: | |
| Safety in use is important | |
| No negative impacts on health | |
| Perception 2 | Component 3: |
| Ease in processing is an important factor | |
| Limited time need to process and cook fish | |
| How the seller pre-processed the fish is an important factor | |
| Perception 3 | Component 2: |
| Official mass media can confirm that the fish is safe | |
| The fish is labeled by supermarkets | |
| The fish is cheaper than other types of fish | |
| The fish is sold in central markets | |
| The fish is sold in supermarkets | |
| Component 3: | |
| I can observe the wastewater treatment technique | |
| I can directly observe the process | |
| Relative and friends can confirm that the fish is safe | |
| Perception 4 | Component 1: |
| Product safety certification is granted by authorities | |
| The safety of fish is certified by authorities | |
| The fish is certified by authorities | |
| The fish is sold by the authorized stores | |
| Component 4: | |
| Current technology can treat wastewater for fish rearing | |
| Investment and good management is safe |
| Variables | Description |
|---|---|
| Gender | Gender of the respondents; dummy variable where male is 1 and 0 for female: gender_wastewater (gender interaction with wastewater-raised fish source attribute); gender_freshwater (gender interaction with farmed-fish source variable), gender_certification (gender interaction with certification attribute) |
| Age | Age of the respondents in years; age_wastewater (age interaction with wastewater fed-fish source attribute); age_freshwater (age interaction with farmed fish source attribute); age_certification (age interaction with certification attribute) |
| Education | Respondents’ education in years; education_wastewater (education interaction with wastewater-raised fish source attribute); education_freshwater (education interaction with farmed-fish source attribute), education_certification (education interaction with certification attribute) |
| Income | Household annual income; income_wastewater (income interaction with wastewater-raised fish source attribute); income_freshwater (income interaction with farmed-fish source attribute); income_certification (income interaction with certification attribute) |
| Household size | Household size; household size_wastewater (household size interaction with wastewater-raised fish source attribute); household_freshwater (household size interaction with farmed-fish source attribute); household size_certification (household size interaction with certification attribute) |
| Perception 1 | Respondents’ perceptions whether safety of fish is assured; Perception1_wastewater (perception of fish safety interaction with wastewater-raised fish source attribute); Perception1_freshwater (perception of fish safety interaction with farmed-fish source attribute); Perception1_certification (perception of fish safety interaction with certification |
| Perception 2 | Respondents’ perceptions on the processing technology or treatment system for wastewater fed-fish farming; Perception2_wastewater (perception of fish on processing system interaction with wastewater-raised fish source attribute); perception2_freshwater (perception of fish on processing technology interaction with farmed-fish source attribute); perception2_certification (perception of fish on processing technology or system interaction with certification attribute) |
| Perception 3 | Respondents’ perceptions on information on the type of market the fish is sold in (supermarket, or central market); perception3_wastewater (perception of fish market types interaction with wastewater-raised fish source attribute); perception3_freshwater (perception of fish market types interaction with farmed-fish source attribute); perception3_certification (perception of fish market types interaction with certification attribute) |
| Perception 4 | Respondents’ perceptions if certification is done by relevant authority; perception4_wastewater(perception of fish certification by relevant authority interaction with wastewater-raised fish source attribute); perception 4_freshwater (perception of fish certification by relevant authority interaction with farmed-fish source attribute); perception4_certification (perception of fish certification by relevant authority interaction with certification attribute) |
| Models | Basic Models | Extended Models | ||
|---|---|---|---|---|
| Conditional Logit (CL) | Random Parameter Logit (RPL) | Conditional Logit (CL) | Random Parameter Logit (RPL) | |
| Variables | Coefficient (s.e.) | Coefficient (s.e.) | Coefficient (s.e.) | Coefficient (s.e.) |
| Price | −0.073 (0.001) *** | −0.077 (0.173) *** | −0.074 (0.006) *** | −0.074 (0.008) *** |
| Source wastewater | 1.195 (0.115) *** | 1.652 (0.107) *** | 1.456 (0.363) *** | 2.235 (0.544) *** |
| Source freshwater | 0.314 (0.106) *** | 0.269 (0.107) *** | 0.934 (0.476) ** | 1.583 (0.707) ** |
| Certification | 1.602 (0.107) *** | 1.974 (0.163) *** | 2.049 (0.356) *** | 2.369 (0.465) *** |
| Gender_wastewater | −0.134 (0.212) | −0.124 (0.323) | ||
| Gender_freshwater | −0.015 (0.218) | −0.519 (0.435) | ||
| Gender_certification | −0.457 (0.271) * | −0.026 (0.279) | ||
| Age_wastewater | −0.003 (0.005) | −0.004 (0.007) | ||
| Age_freshwater | −0.004 (0.005) | −0.017 (0.009) * | ||
| Age_certification | −0.009 (0.006) | −0.003 (0.006) | ||
| Education_wastewater | −0.012 (0.023) | −0.006 (0.036) | ||
| Education_freshwater | 0.004 (0.025) | 0.035(0.046) | ||
| Education_certification | 0.018 (0.031) | −0.012 (0.031) | ||
| Income_wastewater | 0.003 (0.002) | −0.006 (0.003) ** | ||
| Income_freshwater | 0.002 (0.002) | 0.003 (0.002) | ||
| Income_certification | 0.004 (0.002) ** | 0.003 (0.002) | ||
| Household size_wastewater | −0.081 (0.179) | −0.541 (0.250) ** | ||
| Household size_freshwater | −0.403 (0.177) ** | −0.570 (0.321) | ||
| Household size_certification | −0.302 (0.216) | −0.126 (0.224) | ||
| Perception1_wastewater | −0.012 (0.081) | −0.029 (0.118) | ||
| Perception1_freshwater | −0.262 (0.104) | −0.334 (0.156) ** | ||
| Perception1_certification | −0.076 (0.079) | −0.095 (0.100) | ||
| Perception2_wastewater | −0.205 (0.084) ** | −0.260 (0.120) ** | ||
| Perception2_freshwater | −0.240 (0.115) ** | −0.211 (0.179) | ||
| Perception 2_certification | 0.016 (0.085) | 0.037 (0.105) | ||
| Perception 3_wastewater | 0.128 (0.095) | 0.142 (0.138) | ||
| Perception 3_freshwater | 0.193 (0.122) | 0.261 (0.179) | ||
| Perpcetion3_certification | −0.042 (0.097) ** | 0.193 (0.118) *** | ||
| Perception 4_wastewater | −0.151 (0.089) *** | 0.072 (0.137) | ||
| Perception4_freshwater | 0.272 (0.123) ** | −0.036 (0.172) *** | ||
| Perception4_certification | 0.173 (0.093) *** | −0.213 (0.119) *** | ||
| Stdv (source_wastewater) | 0.888 (0.191) *** | |||
| Stdv (source_freshwater) | 1.064 (0.209) *** | |||
| Stdv (certification) | 0.462 (0.167) *** | |||
| Opt out | −0.602 (0.093) *** | −0.398 (0.131) *** | ||
| Log likelihood | −739.430 | −665.44 | −691.49 | −617.188 |
| McFadden R2 | 0.0627 | 0.31328 | 0.1235 | 0.36308 |
| AIC | 1486.9 | 1346.9 | 1445 | 1310.4 |
| Classes | Class 1 (Segment): “Moderate Certification Households” | Class 2 (Segment): “High Certification Households” |
|---|---|---|
| Variables | Coefficient (standard error) | Coefficient (standard error) |
| Price | −0.261 (0.061) *** | −0.032 (0.015) *** |
| Source_wastewater | 3.722 (1.007) *** | 1.944 (0.0.223) *** |
| Source_freshwater | 2.135 (0.732) *** | 1.211 (0.195) *** |
| Certification | 3.462 (0.699) *** | 2.072 (0.185) *** |
| Class Probability | 0.70 | 0.30 |
| Log Likelihood | −609.378 | |
| McFadden R2 | 0.371 | |
| AIC | 1246.8 |
| Respondents’ Characteristics | Class 1 (Segment N = 96): “Moderate Certification Households” | Class 2 (Segment N = 39): “High Certification Households” |
|---|---|---|
| Mean (s.d.) | Mean(s.d.) | |
| Age ** | 46.19 (16.60) | 37.29 (11.82) |
| Income | 284 (66.79) | 159.0 (22.81) |
| Household size ** | 4.39 (1.40) | 3.62 (0.74) |
| Percentage | ||
| Gender | ||
| - Male | 91.7 | 85.7 |
| - Female | 14.3 | 14.3 |
| Education | ||
| - Up to grade 12 | 83.8 | 71.4 |
| - Some college | 7.1 | 20.0 |
| - University | 9.1 | 8.6 |
| Perception variables | Mean (s.d.) | Mean (s.d.) |
| Perception 1 *** | 3.37 (0.85) | 3.92 (0.66) |
| Perception 2 *** | 3.34 (0.797) | 3.82 (0.79) |
| Perception 3 ** | 3.42 (0.92) | 3.74 (0.71) |
| Perception 4 ** | 3.10 (0.97) | 3.46 (0.96) |
| Attributes | Basic Models | Extended Models | ||
|---|---|---|---|---|
| Conditional Logit (CL) | Random Parameter Logit (RPL) | Conditional Logit (CL) | Random Parameter Logit (RPL) | |
| Source_wastewater | 0.744 (0.047) *** | 0.971 (0.079) *** | 0.765 (0.327) *** | 1.108 (0.104) *** |
| Source_freshwater | 0.195 (0.058) *** | 0.123 (0.035) ** | 0.539 (0.359) *** | 0.427 (0.100) *** |
| Certification | 0.997 (0.058) *** | 1.161 (0.098) *** | 1.144 (0.367) *** | 1.422 (0.302) *** |
| Attributes | Class 1 (Segment): “Moderate Certification Households” | Class 2 (Segment): “High Certification Households” |
|---|---|---|
| Source_wastewater | 0.65 (0.055) *** | 2.74 (1.34) ** |
| Source_freshwater | 0.37 (0.06) *** | 1.71 (0.87) ** |
| Certification | 0.60 (0.07) *** | 2.92 (1.40) *** |
| Marginal WTP for Certification (USD per kg) | Unit Cost of Certification (USD per kg) (Lower–Higher Limit) | Total Cost of Certification (in millions USD) | Total Estimated Benefits from Certification (in millions USD) | Net Benefit from Certification (in millions USD) |
|---|---|---|---|---|
| 1.42 | 0.19–0.24 | 23.03–33.94 | 172.24 | 138–149 |
© 2017 by the authors. Licensee MDPI, Basel, Switzerland. This article is an open access article distributed under the terms and conditions of the Creative Commons Attribution (CC BY) license (http://creativecommons.org/licenses/by/4.0/).
Share and Cite
Danso, G.K.; Otoo, M.; Linh, N.D.; Madurangi, G. Households’ Willingness-to-Pay for Fish Product Attributes and Implications for Market Feasibility of Wastewater-Based Aquaculture Businesses in Hanoi, Vietnam. Resources 2017, 6, 30. https://doi.org/10.3390/resources6030030
Danso GK, Otoo M, Linh ND, Madurangi G. Households’ Willingness-to-Pay for Fish Product Attributes and Implications for Market Feasibility of Wastewater-Based Aquaculture Businesses in Hanoi, Vietnam. Resources. 2017; 6(3):30. https://doi.org/10.3390/resources6030030
Chicago/Turabian StyleDanso, George K., Miriam Otoo, Nguyen Duy Linh, and Ganesha Madurangi. 2017. "Households’ Willingness-to-Pay for Fish Product Attributes and Implications for Market Feasibility of Wastewater-Based Aquaculture Businesses in Hanoi, Vietnam" Resources 6, no. 3: 30. https://doi.org/10.3390/resources6030030
APA StyleDanso, G. K., Otoo, M., Linh, N. D., & Madurangi, G. (2017). Households’ Willingness-to-Pay for Fish Product Attributes and Implications for Market Feasibility of Wastewater-Based Aquaculture Businesses in Hanoi, Vietnam. Resources, 6(3), 30. https://doi.org/10.3390/resources6030030