Article

Probability Assessment of Strategic and Total Rare Earth Element Supply for the EU Under the EU Critical Raw Materials Act


by
Melike Yildirim Ayyildiz
*,
Jasemin Ayse Ölmez
and
Christoph Hilgers
Structural Geology & Tectonics, Institute of Applied Geosciences, Karlsruhe Institute of Technology, 76131 Karlsruhe, Germany
*
Author to whom correspondence should be addressed.
Resources 2026, 15(6), 73; https://doi.org/10.3390/resources15060073
Submission received: 23 March 2026 / Revised: 13 May 2026 / Accepted: 15 May 2026 / Published: 25 May 2026

Abstract

The European Union aims to reduce its dependency on imported critical and strategic raw materials. Therefore, the EU’s Critical Raw Materials Act defines benchmarks for strategic raw materials on domestic mining, recycling, refining, and the diversification of import sources to be achieved by 2030. This study investigates the feasibility of the EU’s Critical Raw Materials Act mining benchmark for strategic rare earth elements, which aims for 10% of the EU’s annual demand to be met through domestic mining. We assess whether domestic rare earth element supply from mining within the EU can meet the projected future demand for 2030 and 2050. The study also examines the extent to which the total demand of rare earth elements for the EU could be met proportionally. An uncertainty estimation with Monte Carlo simulation with consideration of uniform and Gaussian distribution, based on individual project development stages, highlights that reaching the 10% benchmark for strategic rare earth elements is theoretically likely by 2030; however, with an incorporated nine-year lead time, meeting the 2030 benchmark is no longer feasible. Furthermore, obstacles such as social license to operate, mining permits and appeals in practice may additionally prolong procedures. The study concludes that in order to mine domestic rare earth elements and to reduce import dependency, the EU needs to invest in geological exploration and mining. Moreover, establishing a whole rare earth elements supply chain from mining to refining is highly complex and, as illustrated by the Japan–Australia partnership, which required 14 years without including the geological exploration phase.

1. Introduction

The global need for mineral and metallic raw materials is projected to double from 53 gigatons (Gt) in 2017 to 106 Gt by 2060 due to rising global population, increasing global prosperity and new technologies [1]. Low-carbon energy converters such as wind and solar power need a higher material demand per energy generated compared to coal, gas, biogas, and hydroelectric power, but consume a low share of the global carbon budget [2,3]. Similarly, energy transport, energy storage and products require an extension of exploration of raw materials from primary and secondary resources [4]. For example, electric vehicles require an average of 206.4 kg of minerals per vehicle, compared to 33.9 kg for internal combustion engine cars, excluding steel and aluminum [5]. Recycling and substitution are increasing globally, but cannot meet the demand for all raw materials and specific material qualities, as, e.g., needed for batteries or permanent magnets, e.g., for E-vehicles or wind turbine drives, e.g., [2,6,7,8]. The term “critical raw material” was first used in the U.S. “Strategic and Critical Materials Stock Piling Act” in 1939 [9]. The U.S.-Act aimed to secure strategic and critical materials for national defense by reducing dependence on foreign sources and ensuring a stable domestic supply in case of national emergency [9]. To date, REEs are classified as critical in lists, e.g., the EU27 (further called the EU), the U.S.A., Japan, India, Australia, the U.K., and South Korea [10,11,12,13,14,15,16].
In May 2024, the European Critical Raw Materials Act (CRMA) officially came into force to support the EU’s green deal agenda [17,18]. Furthermore, the EU defines strategic raw materials as a subset of critical raw materials. Critical raw materials are defined as raw materials with high economic importance and high supply chain risks [19]. Strategic raw materials, as defined by the EU, have the same criteria but are additionally crucial for strategic technologies such as defense and aerospace; however, specific qualities of a critical raw material are considered strategic, such as battery quality [19]. The EU set four key benchmarks for strategic raw materials by 2030: sourcing 10% of its annual raw material consumption from domestic mining within member states, processing 40% of the consumption domestically, recovering 25% from waste recycling, and ensuring that no more than 65% of any strategic raw materials are imported from a single third country [17]. These benchmarks are designed to reduce supply chain risks and improve resilience [17].
Among others, rare earth elements (REEs) are defined as “critical and strategic raw materials” for, e.g., the EU [16,20]. They are required in technologies ranging from permanent magnets, required in, e.g., electric vehicles and wind turbines, to consumer electronics [21]. Rare earth elements are a group of 17 elements, including the lanthanide group from lanthanum (La) to lutetium (Lu), scandium and yttrium, and are classified either as light rare earth elements (LREEs, atomic numbers 57–61) or heavy rare earth elements (HREEs, atomic numbers >62) based on their atomic weights [22]. Geological deposits of LREEs are more abundant globally than HREEs [23]. The latter are almost exclusively limited to ionic clays and are therefore considered more critical than LREEs [23]. The criticality also relies on use-cases, i.e., neodymium (Nd) and praseodymium (Pr) are LREEs, but they are being used in permanent magnet applications; therefore, these may be evaluated as more critical than, e.g., the HREE gadolinium (Gd) [23].
To forecast future raw material supplies and the demand as a function of technical factors, e.g., price volatility, or resource availability [24], including their uncertainties, statistical assessments, such as, e.g., Monte Carlo simulation (MCS) can be applied. MCS has already been applied to examine economic uncertainties such as market prices, operating costs, and ore grades in phosphate mining in Egypt [25], and will be implemented in this study. The uniform and the Gaussian distributions have been used to represent parameter uncertainty and assess the impact of different probability assumptions. The main objective of this study is to quantitatively evaluate the probability of meeting the CRMA benchmark for 10% domestic mine supply for strategic REEs by 2030 for the REE mining project in Norra Kärr, Sweden, which to date has published the only publicly available report within the EU member states. The study examines the extent to which the project can meet the EU’s total demand for rare earth elements, even if the 10% benchmark is only valid for strategic raw materials. Furthermore, the analyses were conducted with and without a nine-year lead time to include possible delays due to permitting procedures. For this, three demand scenarios (EU published values [26], low demand and high demand for the EU from the literature [27]) and the proposed mining target values are considered. By combining trade data with industry reports, the study aims to highlight different scenarios for future supply of REEs in the EU, and investigates what steps may be needed for the EU to reduce its dependency on imports in the long term. This article briefly addresses mining permits in Sweden and discusses a legislative issue that previously occurred in the mining area as a contextual discussion. This is particularly relevant since the planned mining project is located in the same place. Additionally, to illustrate the time and effort required to develop a complete supply chain from mining to refining of HREEs, the successfully accomplished Japan–Australia REEs partnership is examined, providing contextual support to the main analysis of this study. An analysis based on trade data is conducted to assess how this investment has affected supply diversification and to examine its effectiveness as a strategic approach. This example provides an empirical reference point for the time required to establish a fully integrated REE supply chain, which is a critical factor in assessing the feasibility of similar efforts within the EU.

2. EU’s Critical Raw Materials Strategy

The “Critical Raw Materials Act” provides opportunities for companies, such as promoting strategic projects within the EU member states and third countries [28]. Strategic projects can benefit from easier access to financing and faster permitting processes once put into law in the member countries [28]. The extraction permits are planned to be expedited to 24 months, and processing and recycling permits are reduced to 12 months [28]. This aims to simplify the often complex and prolonged procedures for project approvals, facilitating faster progress [28]. The EU’s selected strategic projects for REEs within EU member states cover two processing projects in Poland and France, two recycling projects in France and Italy and one integrated (extraction and processing) project in Sweden for strategic REEs [29]. All the selected projects within member states are expected to be operational by 2030 for REEs [30,31,32,33,34]. The CRMA also emphasizes the need to avoid relying on a single third country for more than 65% of imports [19]. Therefore, two extraction projects are located outside of the EU member states and outside of China, the current main supplier of REE to the EU, remain important to ensure diversification and reduce dependence on any single country [35,36]. These selected ongoing extraction projects are based in Malawi and South Africa [29,37].
The EU adopted the RESourceEU Action Plan in 2025, aiming to speed up and strengthen efforts to secure the supply of critical raw materials (CRM) [38]. RESourceEU aims to fast-track strategic projects by easing regulatory barriers and deploying financial de-risking instruments, with the goal of reducing the EU’s dependence on critical raw materials by up to 50% by 2029 [38]. To support near-term alternative supply projects, the EU will allocate up to €3 billion within 2026 to support strategic projects and is creating a CRM financing hub [38]. Expected benefits for the EU’s REE supply are reducing the dependency on a single 3rd country for REE extraction from 95% to 42%, for REE processing/recycling from 100% to 60% and permanent magnet dependency from 90% to 80% from 2025 to 2030 [39].

3. Materials and Methods

3.1. Terminology and Units

A resource is defined by the USGS [40] as “a naturally occurring accumulation of solid, liquid, or gaseous materials in the Earth’s crust that exists in a form and quantity sufficient to make the economic extraction of a commodity either currently or potentially viable”. A reserve is defined by the USGS [40] as being “economically extractable materials identified at the time of assessment, consisting only of recoverable resources. They are dynamic, changing with mining activities, exploration, technological advancements, and economic conditions, and serve as a working inventory for mining companies”. Therefore, a resource refers to a concentration of material in/on the Earth’s crust that has the potential to become economically extractable in the future, whereas a reserve is a measured or indicated mineral resource that is already proven and more readily available for economic extraction [41].
Mining or trading volumes are displayed as metric tonnes (t, 1000 kg). REE evaluation results are usually reported as rare earth oxide (REO) compounds [42]. The total rare earth oxides are given as TREO. REO grades are converted to REE grades using a conversion factor based on the atomic weights of the elements in each REE compound to align with the demand projections (Table 1). Oxide-to-element conversion factors are calculated as follows. FE→O is the element-to-oxide conversion factor, where FO→E is the oxide-to-element conversion factor.
FEO = 1/FOE
Data used in this study is collected from research and review articles, industry reports, company announcements, news articles, and the UN Comtrade database. The peer-reviewed literature, government and institutional documents, and international trade databases were used as the primary data sources due to their high reliability. Company reports, including PERC-compliant reports (PERC is the Pan-European Reserves & Resources Reporting Committee), highlight operational and production-related data. News articles capture timely information as a supplementary context that is often not yet available in the peer-reviewed literature. The trade analysis was based on HS Codes for “Compounds, inorganic or organic, of rare-earth metals, of yttrium or of scandium or of mixtures of these metals (HS2846)”, and “Rare-earth metals, scandium, and yttrium, whether or not intermixed or interalloyed (HS280530)” to assess REE import and export flows between countries.

3.2. Uncertainty for Mine Production

Currently, only one company within the EU (Leading Edge Materials, Norra Kärr, Sweden) aims to mine REO and announced to supply 5340 t/a mixed REO from 2025, including details on individual REO composition and a projected start date for mining production [45]. As this project has published the only publicly available report within the EU providing a higher level of detail, the analyses presented in this paper are based on this project. This report, prepared in accordance with the PERC reporting standard [46], ensures a relatively high level of reliability despite the inherent uncertainty of company-provided information. Furthermore, the ReeMAP project in Sweden also aims for REO mining [30]. However, the ReeMAP project is not included in this paper’s simulation as the company (LKAB, Luleå, Sweden) only published the TREO content, and has not published a timeline that indicates when production for REOs may start [47].
To estimate the success rate of the announced project, the PERC standard is applied. The PERC standard is subdivided into three categories: scoping, pre-feasibility and feasibility study stage of an exploration study [46] (PERC, 2021). According to the PERC standard, scoping studies’ resource estimation can be ±25–50% [46]. Therefore, the accuracy range and thus the outcome may fluctuate between 50% and 150% of the projected values in scoping studies [48] (Table 2). The announced Swedish project Norra Kärr is currently in the scoping study stage after PERC. Thus, the accuracy range for a scoping study is applied for projected annual production, and the probability of achieving the annual REEs production capacity is evaluated. The company is expected to release a pre-feasibility study in 2026 [49], and its scoping study dates back approximately five years (2021). For this reason, a five-year interval is applied to estimate mining production.
The average lead time for mining projects increases globally [50]. For instance, mines that became operational between 2020 and 2024 required an average of 17.8 years to reach production, compared to only 6.4 years for projects initiated between 1990 and 1999 [50]. From 2025 onward, geological exploration and discovery are expected to take approximately 19.4 years, followed by an additional 7 years between the completion of feasibility studies and the receipt of necessary permits, and 1.6 years from construction to production [50]. Since Norra Kärr is located in Sweden, the Swedish permitting context is particularly relevant. For example, obtaining an exploitation permit for the Kallak iron ore deposit required nine years [51] and references therein [52]. Based on this case and the company’s statement that it plans to be ready for production by 2025, a nine-year lead time was applied, resulting in the simulation period beginning in 2034.
Leading Edge Materials’ project in Norra Kärr in Sweden reported 110 Mt at 0.5% TREO inferred resources and potential annual production of 5340 t/a of TREO (used to calculate REOt in Equation (2)) starting from 2025 [45]. The individual proportion of total REO for Nd, Dy, Pr, Tb, Ce, Gd, Er, Eu, Ho, La, Lu, Sm, Tm, Y, Yb of 0.5% is 0.110, 0.050, 0.030, 0.007, 0.210, 0.030, 0.034, 0.004, 0.01, 0.1, 0.005, 0.03, 0.005, 0.34, 0.033, respectively [45]. To estimate the proportion of these REE within the total REO production, the following equation (Equation (2)) was applied. Ki: Annual production of the individual REE, REOt: annual total REO production, Pi: proportion of the individual element in total REO, Ci: conversion factor for oxide-to-element according to Table 1, where “i” refers to Nd, Dy, Pr, Tb, Ce, Gd, Er, Eu, Ho, La, Lu, Sm, Tm, Y, Yb.
Ki = REOt × Pi × Ci
For the low and high-demand scenarios, we calculate the REEsum Nd, Dy, Pr, Tb, Ce, Gd, while for the total REE EU scenario, we include all elements from Nd to Yb.
R E E s u m = i n K i
The input data are calculated using Equation (3). Here, REEsum represents the total of all individual REE values, i denotes each individual REE, and Ki is obtained from Equation (2). For the calculation of strategic REEs, the elements Nd, Pr, Dy, Tb, Ce, and Gd are included, as these are identified as strategic REEs in the CRMA framework [19]. Thus, the input value is 2000 t/a of strategic REEs (Nd, Pr, Dy, Tb, Ce and Gd), which is part of the potential annual production out of 5340 t/a of TREO. These strategic elements are used as supply inputs under both the low-demand and high-demand scenarios. In the EU published demand scenario, the total supply input is based on the combined values of Nd, Dy, Pr, Tb, Ce, Gd, Er, Eu, Ho, La, Lu, Sm, Tm, Y and Yb, because this scenario does not specify demand exclusively for strategic REEs. Thus, the input value is 4450 t/a.

3.3. Selected Projections for the Monte Carlo Simulations

The probability of the annual strategic REE values is calculated from Leading Edge Materials’ expected annual REO production data. This allows us to assess whether the EU could meet the 10% of the annual EU demand from 2030 to 2050 for strategic REEs. Demand projections (Table 3) are based on a demand forecast subdivided into a low-demand scenario (LDS) and a high-demand scenario (HDS) after [27]. The high-demand scenario assumes rapid technology development, whereas the low-demand scenario assumes slow technology development, and both of them consider material intensities and market share [27]. Additionally, the HDS considers ambitious climate and energy targets, such as wind power, while the LDS is based on historical trends [27]. For this scenario, Nd, Dy, Pr, Tb, Ce and Gd are used in line with the CRMA strategic raw materials benchmarks, which include these REE as strategic raw materials in the EU list of 2023 [19].
The projections by [27] provide individual demand estimates for strategic REE identified under the CRMA (excluding Sm) for the EU’s five strategic sectors and 15 key technologies. The five strategic sectors are E-mobility, renewables, aerospace and defense, industry and ICT (information, communication and digital technologies), whereas the 15 technologies include Li-ion batteries, electrolyzers, fuel cells, traction motors, solar photovoltaics, wind turbines, hydrogen direct reduction iron (H2-DRI), heat pumps, data storage and servers, data transmission networks, additive manufacturing, robotics, space launchers and satellites, drones, and smartphones, tablets and laptops [27]. Furthermore, the projections include a specific demand forecast for the EU. The EU highlights the importance of Ce for ICT, Dy and Nd for renewable energy, E-mobility and ICT, Gd for ICT, Pr and Tb for renewable energy and ICT [27]. For ICT technologies, the outlook is restricted to 2030, as the rapid and unpredictable pace of technological change in this sector makes reliable projections not possible beyond the current decade [27]. Therefore, the demand for Ce and Gd appears as 0 t in 2050, as these elements are not included in the long-term projections; a summary of the demand scenarios is presented in Table 3.
The EU currently imports about 12,900 t of total rare earth elements each year under HS Codes 2846 and 280530 [26,53,54]. The EU’s demand for total REEs (12,900 t) is projected to rise six-fold by 2030 (77,400 t) and seven-fold by 2050 (90,300 t), according to the EU demand scenario [26]. In the EU scenario, the total REE quantity was calculated rather than only strategic REEs. This approach also allows us to observe and highlight the supply and demand balance difference between total REEs and strategic REEs. Although an additional demand projection exists for the EU, it is limited to only three REEs (Nd, Dy, and Pr) [55].

3.4. Monte Carlo Simulations

The Monte Carlo simulation (MCS) is a statistical method used to estimate potential outcomes by relying on probability estimates and defined input parameters [56]. Parameters used for MCS are typically assumed to follow a particular probability distribution or are restricted to a predetermined set of values, and rely on iterative data sampling and computing the outcomes through the model [56]. This approach allows for deeper comprehension of system dynamics, as well as the prediction of future scenarios [57]. Monte Carlo simulations reveal a probabilistic behavior of the model outputs instead of a single deterministic result.
Since the Norra Kärr mining project in Sweden is currently in the scoping study stage, the accuracy range between 50% and 150% is applied for the projected annual TREO production [46]. Therefore, the parameter uncertainty was represented by a uniform distribution and a Gaussian distribution between 0.5 and 1.5. A uniform distribution was chosen to represent uncertainty, as no value within the defined range was considered more likely than others. A Gaussian distribution was chosen to represent a different probability structure, where values close to the central estimate have a higher likelihood, while extreme deviations occur with lower probability. The simulation was performed using 10,000 iterations to ensure the statistical stability and convergence of the simulation results. All simulations were conducted in Python 3.13.9 using NumPy (v2.4.0) [58], SciPy (v1.16.3) [59], matplotlib (v3.10.8) [60] and pandas (v3.0.0.) [61]. Results above the 95% and below the 5% percentiles were excluded from the graphs in order to minimize the impact of outliers. Mode represents the most frequently occurring number, and mode repeat count represents the number of times the mode appears. The input values for the MCS are given in Table 4 and are used to calculate REEsum using Equation (3). The 90% confidence interval derived from the simulation results is defined as the range between the 5th and 95th percentiles. This approach prevents potential outliers from disproportionately influencing the confidence interval. The p0 and p100 values represent such outliers.

4. Results

4.1. Uncertainty Estimation for an EU-Based Case Study: CRMA Mining Benchmark

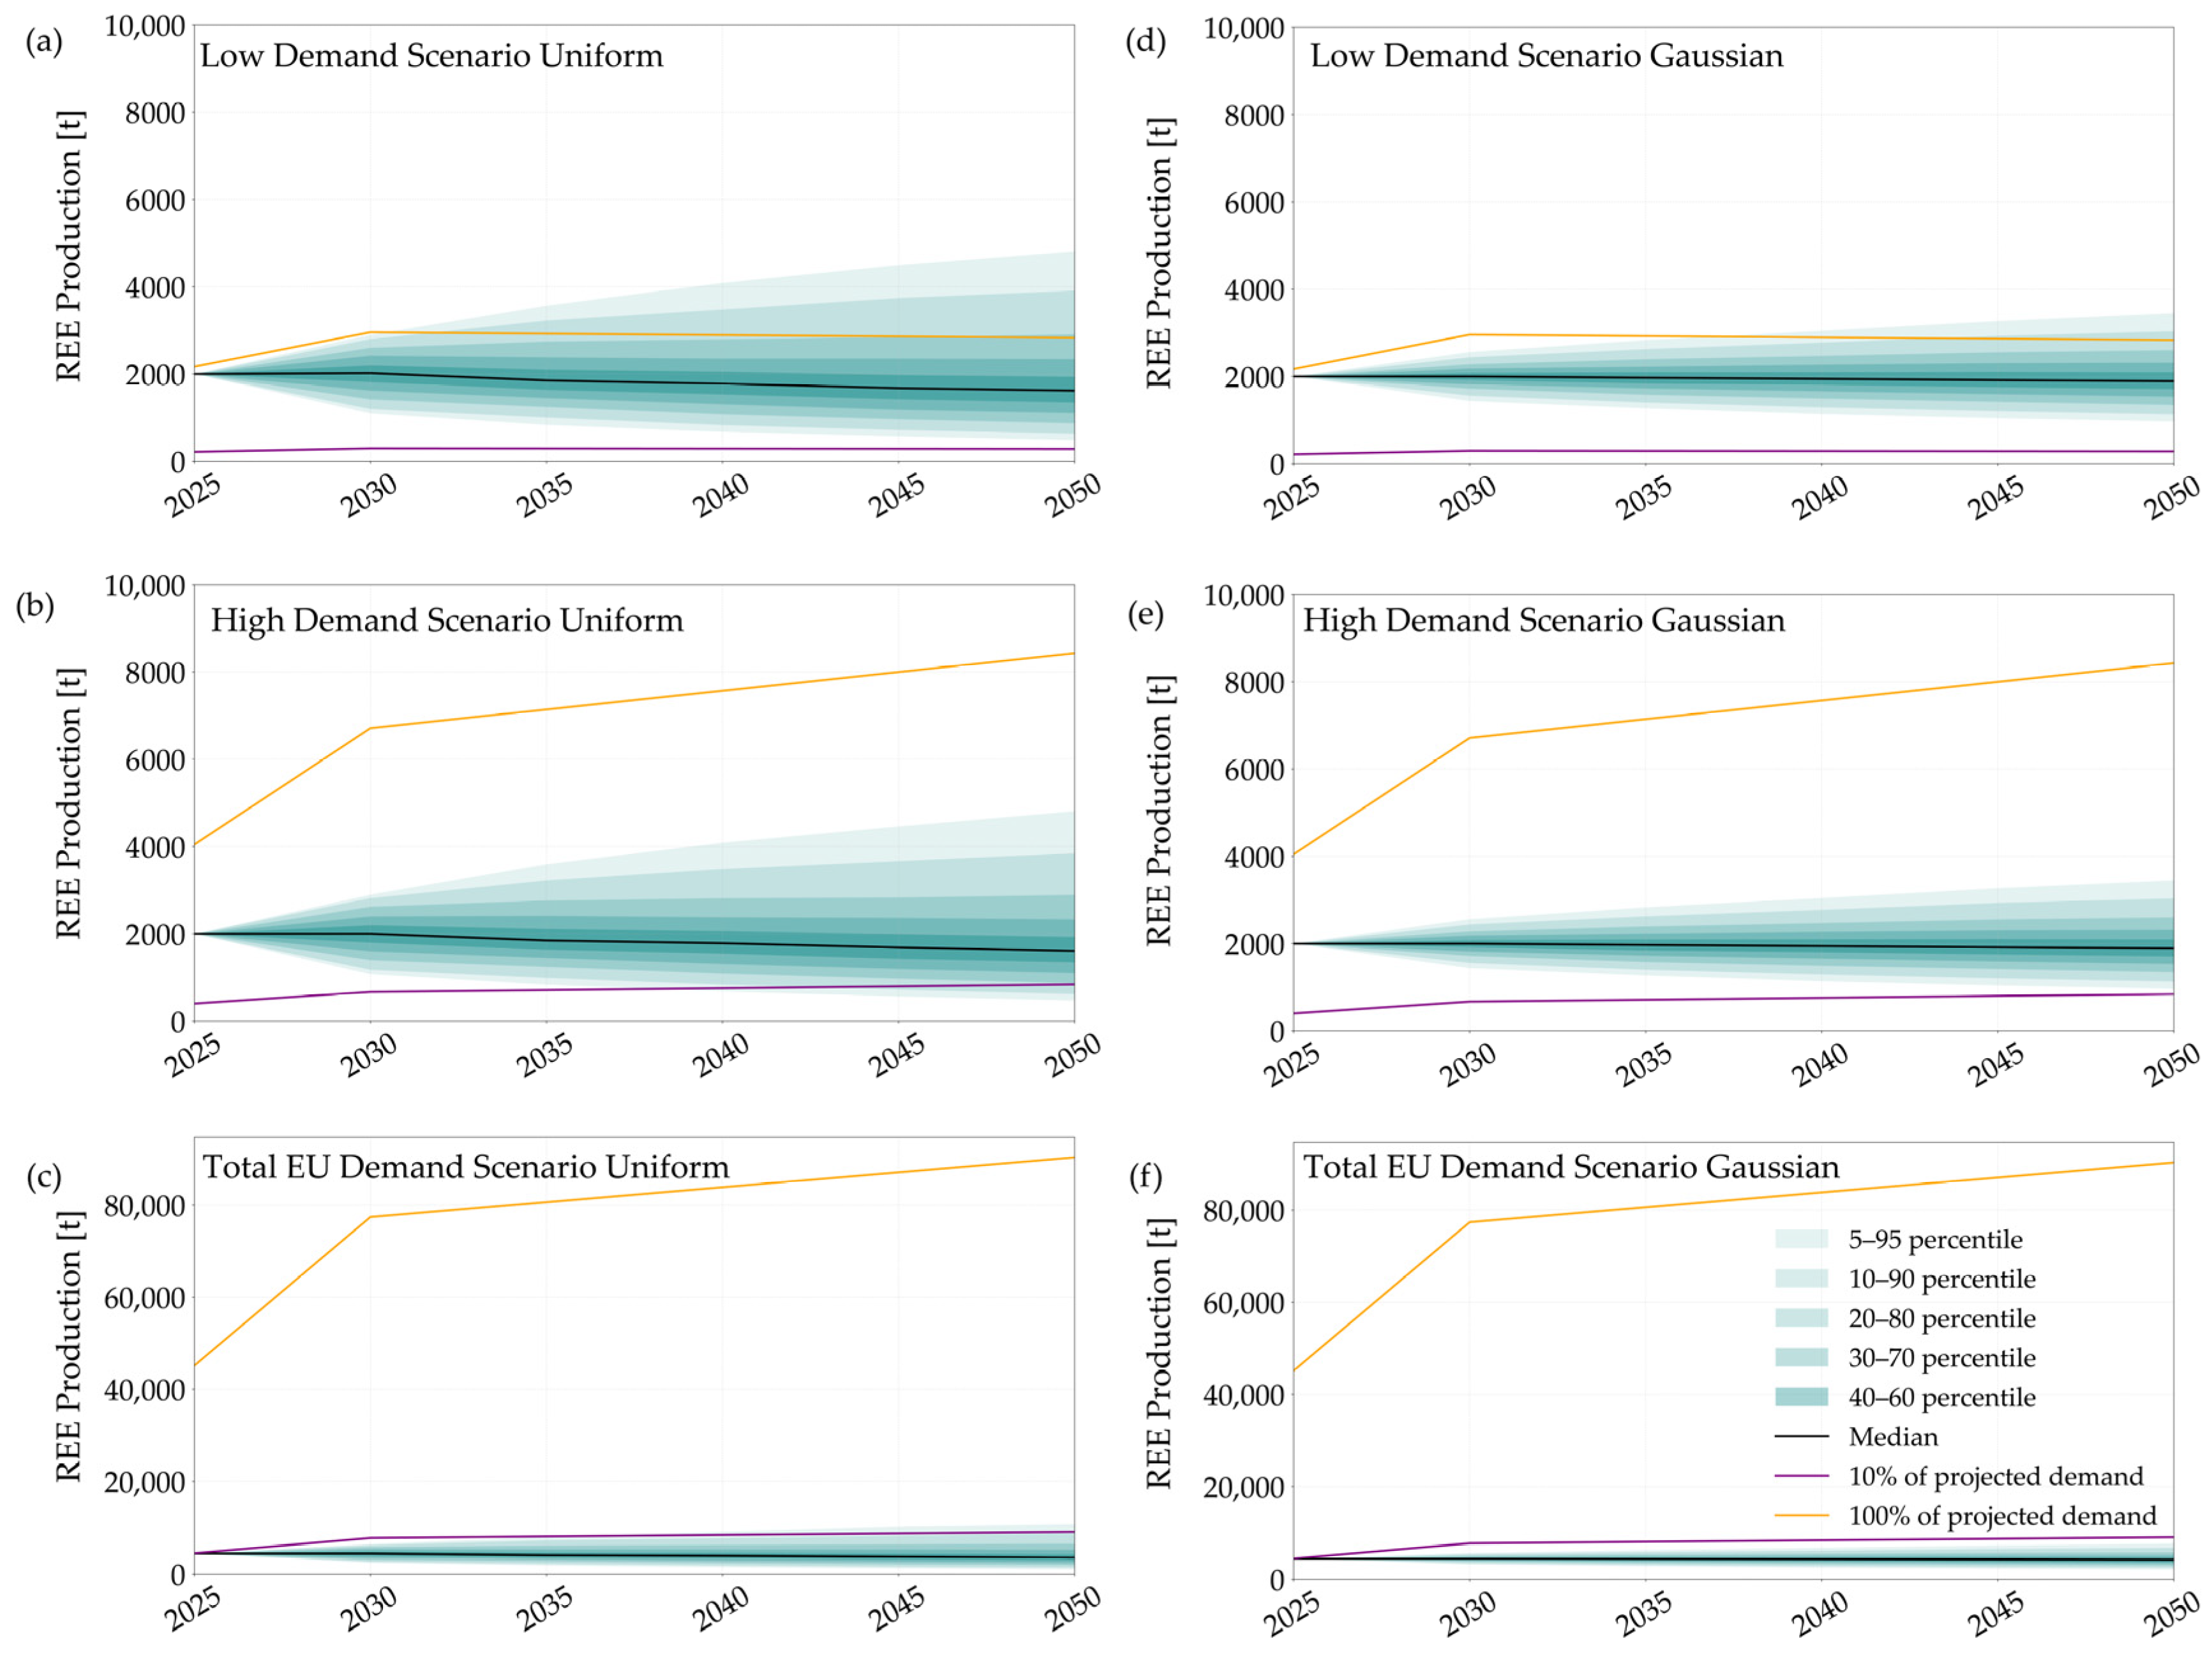
In the low-demand scenario (LDS) with a uniform distribution, the median values (p50) are 2020 t/a, 1863 t/a, 1788.2 t/a, 1706.2 t/a, 1643.3 t/a in 2030, 2035, 2040, 2045 and 2050, respectively. In the high-demand scenario (HDS) with a uniform distribution, the median values are 2000 t/a, 1843.2 t/a, 1786.6 t/a, 1717.9 t/a, 1649.5 t/a in 2030, 2035, 2040, 2045 and 2050, respectively. In the EU demand scenario with a uniform distribution, the median values are 4450 t/a, 4107.4 t/a, 3931.5 t/a, 3772.8 t/a, 3600.5 t/a in 2030, 2035, 2040, 2045 and 2050, respectively. A gradual decrease in the median values is observed over the years. This downward trend suggests a gradual reduction in anticipated supply availability over the analyzed period. The projected strategic REE demand in the LDS is 2959.76 t/a in 2030 and 2832.01 t/a in 2050 (Table 3) [27]. Ten percent of these correspond to approximately 300 t/a and 280 t/a, respectively. In the HDS, the projected values are 6714.62 t/a in 2030 and 8421.58 t/a in 2050, with 10% corresponding to 670 t/a and 840 t/a. The simulated medians exceed these 10% projections in both scenarios. In LDS with a uniform distribution, the 2030 median (2020 t/a) is 573% higher than the projected 300 t/a, while the 2050 median (1643.3 t/a) is approximately 487% higher than the projected 280 t/a. In the HDS with a uniform distribution, the 2030 median (2000 t/a) exceeds the projected 670 t/a by 198%, and the 2050 median (1649.5 t/a) is 96% higher than the projected 840 t/a.
In the total REE scenario for the EU, the situation differs. Currently, the EU’s REE imports (under the HS Codes 2846, 280530) are around 12,900 t/a, expected to increase sixfold by 2030 (approximately 77,400 t/a) and sevenfold by 2050 (approximately 90,300 t/a) [26]. Ten percent of these values correspond to approximately 7700 t/a in 2030 and 9000 t/a in 2050. The calculated medians with a uniform distribution, however, are 4450 t/a in 2030 (a 42.2% deviation from 7700 t/a) and 3600.5 t/a in 2050 (a 60% deviation from 9000 t/a).
In the low-demand scenario with a uniform distribution, the p0 value in 2040 is 208.9 t/a, whereas the p5 value is 700 t/a, an increase of approximately 235%. In 2045, p0 is 189.3 t/a and p5 is 571.7 t/a, corresponding to an increase of about 202%. Additionally, the p95 value of 4507.7 t/a and the p100 value of 9010.5 t/a differ by approximately 100% in 2045. In 2050, the p0 value 137.8 t/a increases to 488 t/a at p5, representing a 254% difference, while p95 (4799.4 t/a) and p100 (11,443.4 t/a) diverge by around 138%. In contrast, the difference between p0 and p5, and p95 and p100 in 2030 and in 2035 is smaller. For instance, in 2030, p0 is 1000 t/a, and p5 is 1100 t/a (10% difference), while p95 (2920 t/a) and p100 (3000 t/a) differ by 2.7%. The reason for these widening gaps over time is that the iteration starts from a single value in 2025 (2000 t/a), while each subsequent year’s value becomes the input for another iteration. Consequently, the uncertainty grows over time.
In the high-demand scenario with a uniform distribution, the projected production values are similar to the low-demand scenario and can be found in Table A1. The simulation inputs are generated independently of HDS and LDS, and the reason both results are presented is caused by different simulations which were conducted for two separate graphs (Figure 1).
In the EU demand scenario, the percentage differences between p0–p5 and p95–p100 vary by year. In 2030, p0 is 2225 t/a and p5 is 2403 t/a, a 8% increase; p95 is 6497 t/a and p100 is 6675 t/a, differing by 2.7%. In 2035, p0 is 1112.5 t/a and p5 is 1864.1 t/a, showing 67% difference, while p95 (8049.2 t/a) and p100 (10,012.5 t/a) differ by 24.4%. By 2050, the divergence becomes enhanced: p0 is 341.5 t/a, and p5 is 1074.4 t/a (215% increase), and p95 (10,695.6 t/a) and p100 (24,553.8 t/a) differ by 130% (Table A1).
The ranges obtained using the Gaussian distribution are narrower compared to the uniform distribution, as the Gaussian distribution assigns a higher probability to values around the median and a lower probability to extreme values. Consequently, the percentage differences between p0 and p5, as well as between p95 and p100, are smaller than those observed under the uniform distribution, e.g., in LDS, p0 is 1000 t/a, and p5 is 1440 t/a in 2030 (44% difference), p95 is 2560 t/a, and p100 is 2980 t/a in the same year (16.4% difference). The medians are the same for both LDS and HDS with the Gaussian distribution, 2000 t/a, 1971.2 t/a, 1946.2 t/a, 1919.2 t/a and 1894.7 t/a in 2030, 2035, 2040, 2045 and 2050, respectively. For the EU demand scenario including a Gaussian distribution, the medians are 4450 t/a, 4385.9 t/a, 4330.4 t/a, 4270.1 t/a, and 4215.7 t/a in 2030, 2035, 2040, 2045 and 2050, respectively (Table A3).

4.2. Uncertainty Calculation with Nine Years Lead Time

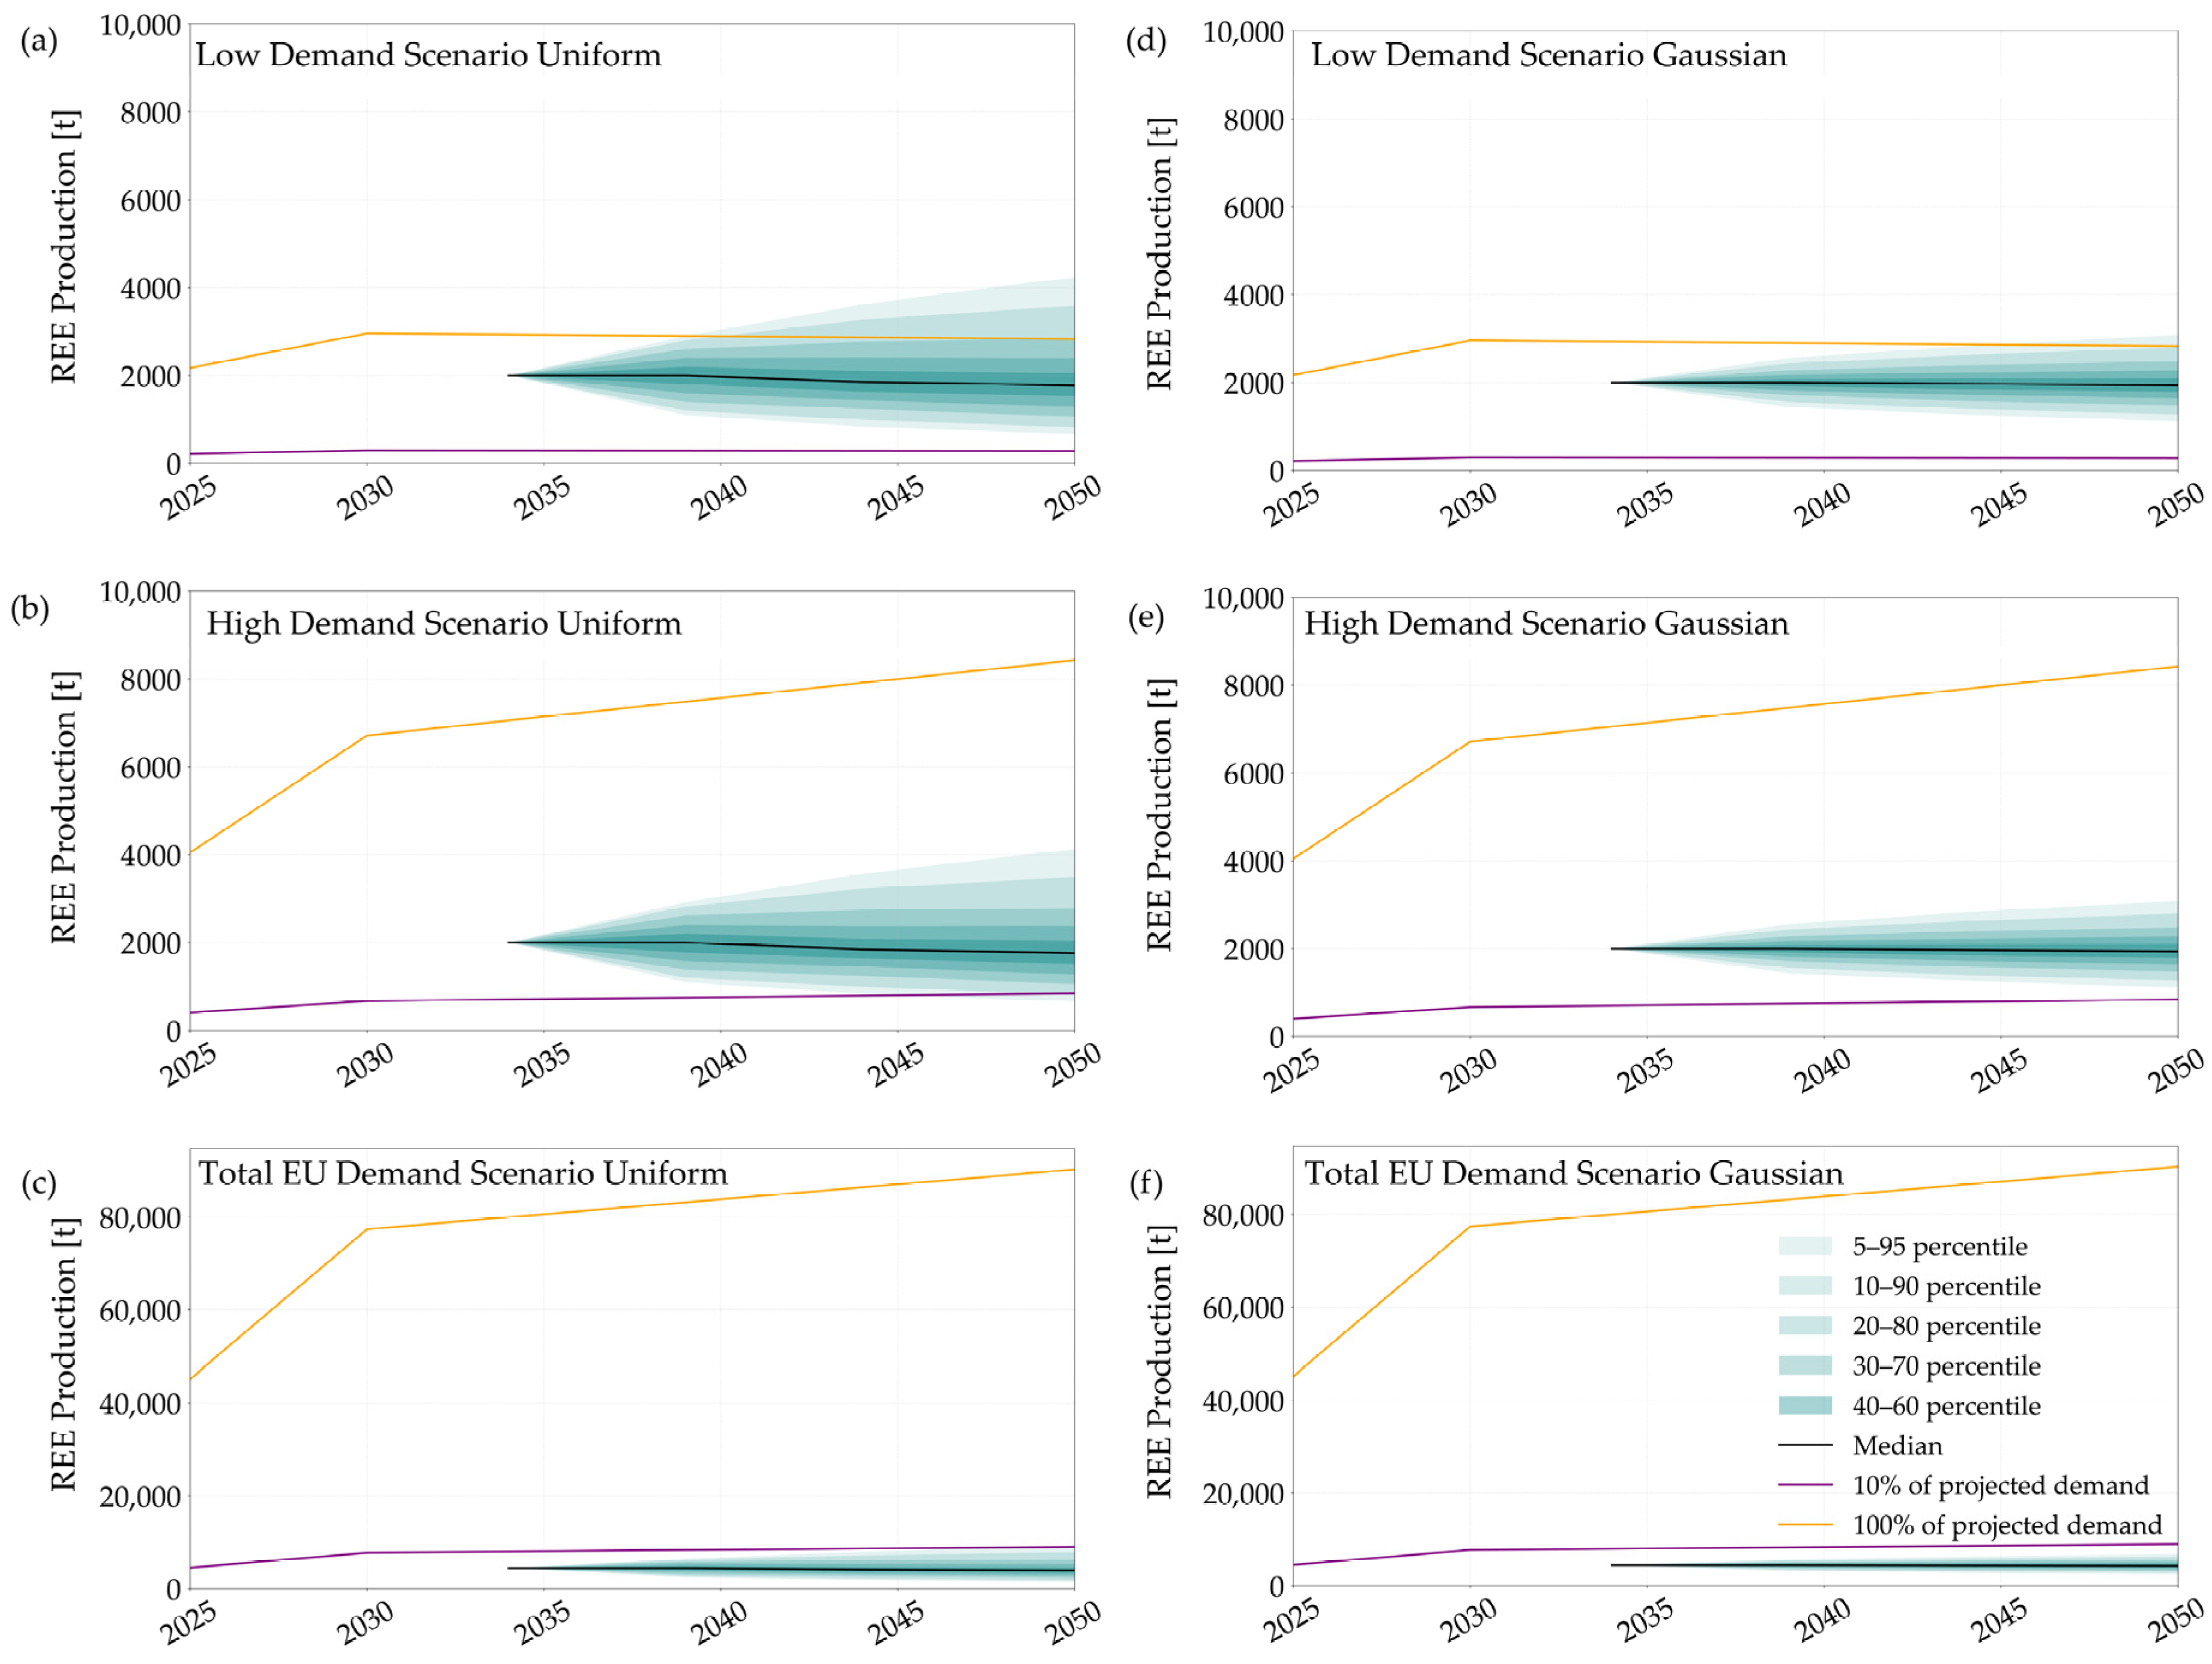
In the low-demand scenario with a uniform distribution, the median values (p50) are 2000 t/a, 1854.2 t/a, 1784.6 t/a in 2039, 2044 and 2049, respectively. In the high-demand scenario with a uniform distribution, the median values are 2020 t/a, 1874.9 t/a, 1811.6 t/a in 2039, 2044 and 2049, respectively. In the EU demand scenario with a uniform distribution, the median values are 4450 t/a, 4145.2 t/a, 3964.7 t/a in 2039, 2044 and 2049, respectively. In all three scenarios, after a nine-year lead time, the median declines gradually over time (Figure 2). This pattern is similar to the earlier simulations without lead time, particularly with respect to the widening spread between the outlier values. Under the applied lead time, the median values exceed 10% of the projected EU demand for strategic REEs of the LDS and HDS. However, they remain below 10% of the projected EU’s total REE demand between the years 2034–2050 of the EU demand scenario. In the low-demand scenario with a uniform distribution, the p0 value for 2039 is 1000 t/a, while the p5 value is 1100 t/a, corresponding to an increase of approximately 10%. The p95 value for the same year is 2900 /a, and the p100 value is 3000 t/a, reflecting a 3.4% difference. In 2049, the p0 value is 301.6 t/a, and the p5 value rises to 692 t/a, which represents an increase of about 129.4%. For the same year, the p95 value is 4102.3 t/a, whereas the p100 value reaches 6526.8 t/a, indicating a 59.1% difference.
In the high-demand scenario with a uniform distribution, the simulated production outcomes closely resemble those of the low-demand scenario, as both rely on identical input data; however, the results are presented separately in two distinct graphs. The corresponding percentile values are provided in Table A2.
In the EU demand scenario with a uniform distribution, the p0 value for 2039 is 2225 t/a, while the p5 value reaches 2403 t/a, corresponding to an increase of approximately 8%. In the same year, the p95 value is 6452.5 t/a, and the p100 value rises to 6675 t/a, indicating a 3.4% difference. For 2049, the p0 value is 624.8 t/a, and the p5 value increases to 1548 t/a, reflecting a 147.8% rise. In the same year, the p95 value is 9140.5 t/a, while the p100 value reaches 14,620.3 t/a, resulting in a 59.9% difference.
The results of the simulation on the REE mining production probability obtained, including lead times with the Gaussian distribution (Table A4), are identical to those without lead times (Table A3), as lead times only shift the results temporally without affecting their distribution because input parameters do not change. The standard deviation indicates the extent to which the results are dispersed around the mean (Table A2). In the short term, in uniform distribution, this dispersion remains relatively narrow (e.g., 582.8 in LDS in 2039), whereas in the long term it widens (e.g., 1054.1 in LDS in 2049). In the Gaussian distribution, the standard deviation shows a similar trend, but the variation over time is narrower compared to the uniform distribution (e.g., 335 in LDS in 2039, whereas 584.9 in LDS in 2049 (Table A4)). This pattern demonstrates that uncertainty increases in all calculations as the projection horizon extends. The high level of uncertainty observed in the results is primarily due to the ±50% uncertainty that was applied to the initial input parameters. Under the lead time applied scenarios (Table A2 and Table A4), achieving the 2030 benchmarks for mining for REEs (both for strategic and total) is not feasible. This is because, once the lead time is applied, production cannot commence before 2034 in any of the scenarios.

5. Discussion

5.1. Possibility of Achieving the CRMA Mining Benchmark

For strategic technologies and strategic REEs, achieving 10% of the projected annual REE demand of the EU from mining would have been feasible by 2030, provided that the mining company had commenced production in 2025 (Figure 1a,b,d,e). In contrast, meeting 10% of the projected EU’s total REE demand appears unfeasible when considering the median of the simulation outcomes (Figure 1c,f). However, the upper bound outlier values suggest that such levels might still be possible in 2030 and 2050. This would require revisions to the resource estimates of the deposit, and production levels would need to exceed current expectations, even when applying a 50% uncertainty conforming with the PERC standard.
The simulation results show an increase in uncertainty over time, which is consistent with the modeling structure. Initial iterations begin from a single deterministic value in each case, whereas the following years rely on values generated by previous simulation rounds, thereby increasing variance cumulatively. To obtain a comprehensive probability assessment, three demand projections (LDS, HDS, and total EU) were used (Table 3). The projected strategic REE demand in the LDS is 2959.76 t/a in 2030 and 2832.1 t/a in 2050, and in the HDS, the projected demand is 6714.62 t/a in 2030 and 8421.58 t/a in 2050 [27]. The CRMA benchmark for domestic mining is to cover 10% of the annual demand by 2030 [19]. In the LDS, 10% of the demand corresponds to approximately 300 t/a for 2030 and 280 t/a in 2050 (Table 3), while 10% for the HDS corresponds to 670 t/a for 2030 and 840 t/a in 2050. In both scenarios, the simulated medians exceed the 10% projections, for the LDS with uniform distribution in 2030 by 573.3% (2020 t/a), while in 2050, the median is approximately 486.9% higher (1643.3 t/a) and for the LDS with Gaussian distribution in 2030 by 566.7% (2000 t/a), whereas in 2050, 576.7% higher (1894.7 t/a). For the HDS with uniform distribution, the median in 2030 is 2000 t/a, which is the same as the Gaussian distribution and therefore 198.5% higher than the projected 670 t/a. The median for HDS with uniform distribution in 2050 is 1649.5 t/a and thus 96.4% higher than the projected 840 t/a, and with the Gaussian distribution, the median is 1894.7 t/a in 2050, which is 125.6% higher than the projected 840 t/a. The Gaussian distribution results indicate more concentrated outcomes, as extreme values are less influential compared to the uniform distribution. This affects the overall spread of the results, while the median values remain similar across both distributions.
The EU’s REEs imports (under the HS Codes 2846, 280530) are approximately 12,900 t/a as of 2024 [26]. It is expected that the import increases sixfold by 2030 (approximately 77,400 t/a) and sevenfold by 2050 (approximately 90,300 t/a) [26]. The calculated medians with the uniform distribution (Table A1) using MCS are 4450 t/a in 2030 (same as the Gaussian distribution), which is a 42.2% deviation from 7700 t/a (10% of imports in 2030). In 2050, with the uniform distribution, the median value is 3600.5 t/a, in 2050 and therefore a 60% deviation from 9000 t/a (10% of imports in 2050). With the Gaussian distribution, it is 4215.7 t/a which is 53.2% deviation from 9000 t/a. Therefore, they only represent approximately 5.8% and 4% of domestic mine production within EU member states. Even the highest outlier value with uniform distribution (p100 = 6675 t/a) in 2030 does not reach 7700 t/a (which would be 10% according to the CRMA domestic mining benchmark for strategic raw materials), whereas in 2050, the p95 and p100 values appear capable of meeting the projected requirement. However, the 10% benchmark is given for strategic raw materials in the CRMA list [19]. Nevertheless, the results emphasize that a minor part of the EU’s growing demand can also be met by the project’s contribution within the EU.
Another major factor influencing the possibility of achieving the CRMA 10% mining benchmark is the long lead time for mining projects. Geological exploration, resource estimation, and the transition to production constitute a highly complex and long process [50]. On average, it has taken 15.5 years from discovery to production between 1990 and 2025, and this lead time has consistently increased over decades [50]. For example, the average was 10.6 years for mines developed between 2000 and 2009, whereas it reached 17.8 years for those developed between 2020 and 2024 [50]. In this study, a lead time of nine years was implemented, e.g., [51] and references therein, [52]. Additionally, the projected outputs depend on factors, such as the time required for approval of mining permits, appeals in the permitting process, social license to operate, geological uncertainties in ore modeling (e.g., how closely the estimated ore tonnage matches the actual mining performance), potential conflicts or wars, natural hazards and unexpected shocks such as pandemics (e.g., COVID-19) [62,63,64]. Therefore, a lead time of nine years incorporated into the simulation shows that meeting the 2030 CRMA benchmark for mining is not feasible, as the mine would not yet have entered production. A lead time of nine years for a mining project in Sweden seems realistic, as shown in the Kallak iron ore mine in Sweden [51] and references therein [52]. Under this scenario, the earliest possible start of mine production would fall around 2034/2035. Moreover, even in an already operating mine, achieving the planned production levels is often not guaranteed. Overall, costs and schedules for large open-pit and underground mines with an investment of $0.3 to $5.0 billion (e.g., copper, iron, alumina) over two to eight years suffered a cost overrun of 40% and schedule overrun of 25%, respectively [65].

5.2. Limitations

For the EU demand scenario, the actual REE imports decrease. Between 2020 and 2024, imports were 10,725 t/a, 16,918 t/a, 18,382 t/a, 18,296 t/a, and 12,936 t/a, respectively [66]. This corresponds to an overall reduction of approximately 30% from 2023 to 2024, indicating a decline. In contrast, it is stated that the EU demand will increase sixfold by 2030 and sevenfold by 2050 [26].
Although the simulation results with LDS and HDS show that meeting the mining benchmark appears feasible, these scenarios themselves have limitations. First, the assessment includes 15 technologies across five sectors; for certain elements such as Ce and Gd, only the ICT sector is considered, but projecting ICT-related demand to 2050 is highly uncertain due to the sector’s rapid and unpredictable technological evolution [27]. As a result, the 2050 demand projection for Ce and Gd was set to zero in these scenarios. Furthermore, both Ce and Gd have other applications outside the ICT sector. Cerium, for instance, is used in metallurgy as a stabilizer in alloys, as well as in glass polishing, ceramics, and catalytic applications [67]. Gadolinium is used in medical imaging as a contrast agent in magnetic resonance imaging (MRI) [68]. These additional uses are not captured in the LDS and HDS projections, thereby contributing to an underestimation of future demand for these elements.
Furthermore, mining decisions are sensitive to market prices, environmental regulations and geopolitical factors [69,70,71]. These influence market dynamics by affecting, e.g., production levels and delaying investments, thereby affecting the competitiveness of the mining sector [72]. For example, due to strong competition from China and environmental constraints, the Mountain Pass REE mine in the U.S. experienced declining sales, which led to the shutdown of its separation plant in 1998 and a halt in mining operations between 2002 and 2010 [73,74]. Additionally, the sharp increase in REE prices between 2010 and 2011, driven by China’s export quotas [75], led to an exploration boom, with increased global exploration investments outside of China. However, many projects later proved economically unfeasible as prices for REE again declined due to a WTO (World Trade Organization) ruling against China’s export quotas [76,77]. Therefore, the development of mining projects depends not only on ore grade but also on market, regulatory, and geopolitical factors.
Considering the ambitious green transition targets set by the EU parliament, the projected increase in demand would be plausible. For example, the German government aims to expand the number of electric vehicles on its roads from 1 million in 2021 to 15 million by 2030 [78]. In addition, the country plans to increase its onshore wind power capacity from 68 GW to 115 GW between 2025 and 2030, and its offshore wind capacity from 9.2 GW to 30 GW within the same timeframe [79,80]. REE demand per MW is estimated to range between approximately 51 and 208 kg [81]. Even when considering only Germany’s wind energy expansion targets for 2030, the required REE demand already amounts to about 3458 t at minimum (68 GW to 115 GW onshore and 9.2 GW to 30 GW offshore for 51 kg), and up to 14,102 t at maximum (68 GW to 115 GW onshore and 9.2 GW to 30 GW offshore for 208 kg).

5.3. Fluctuated Production Numbers: An Example of Lynas, Australia

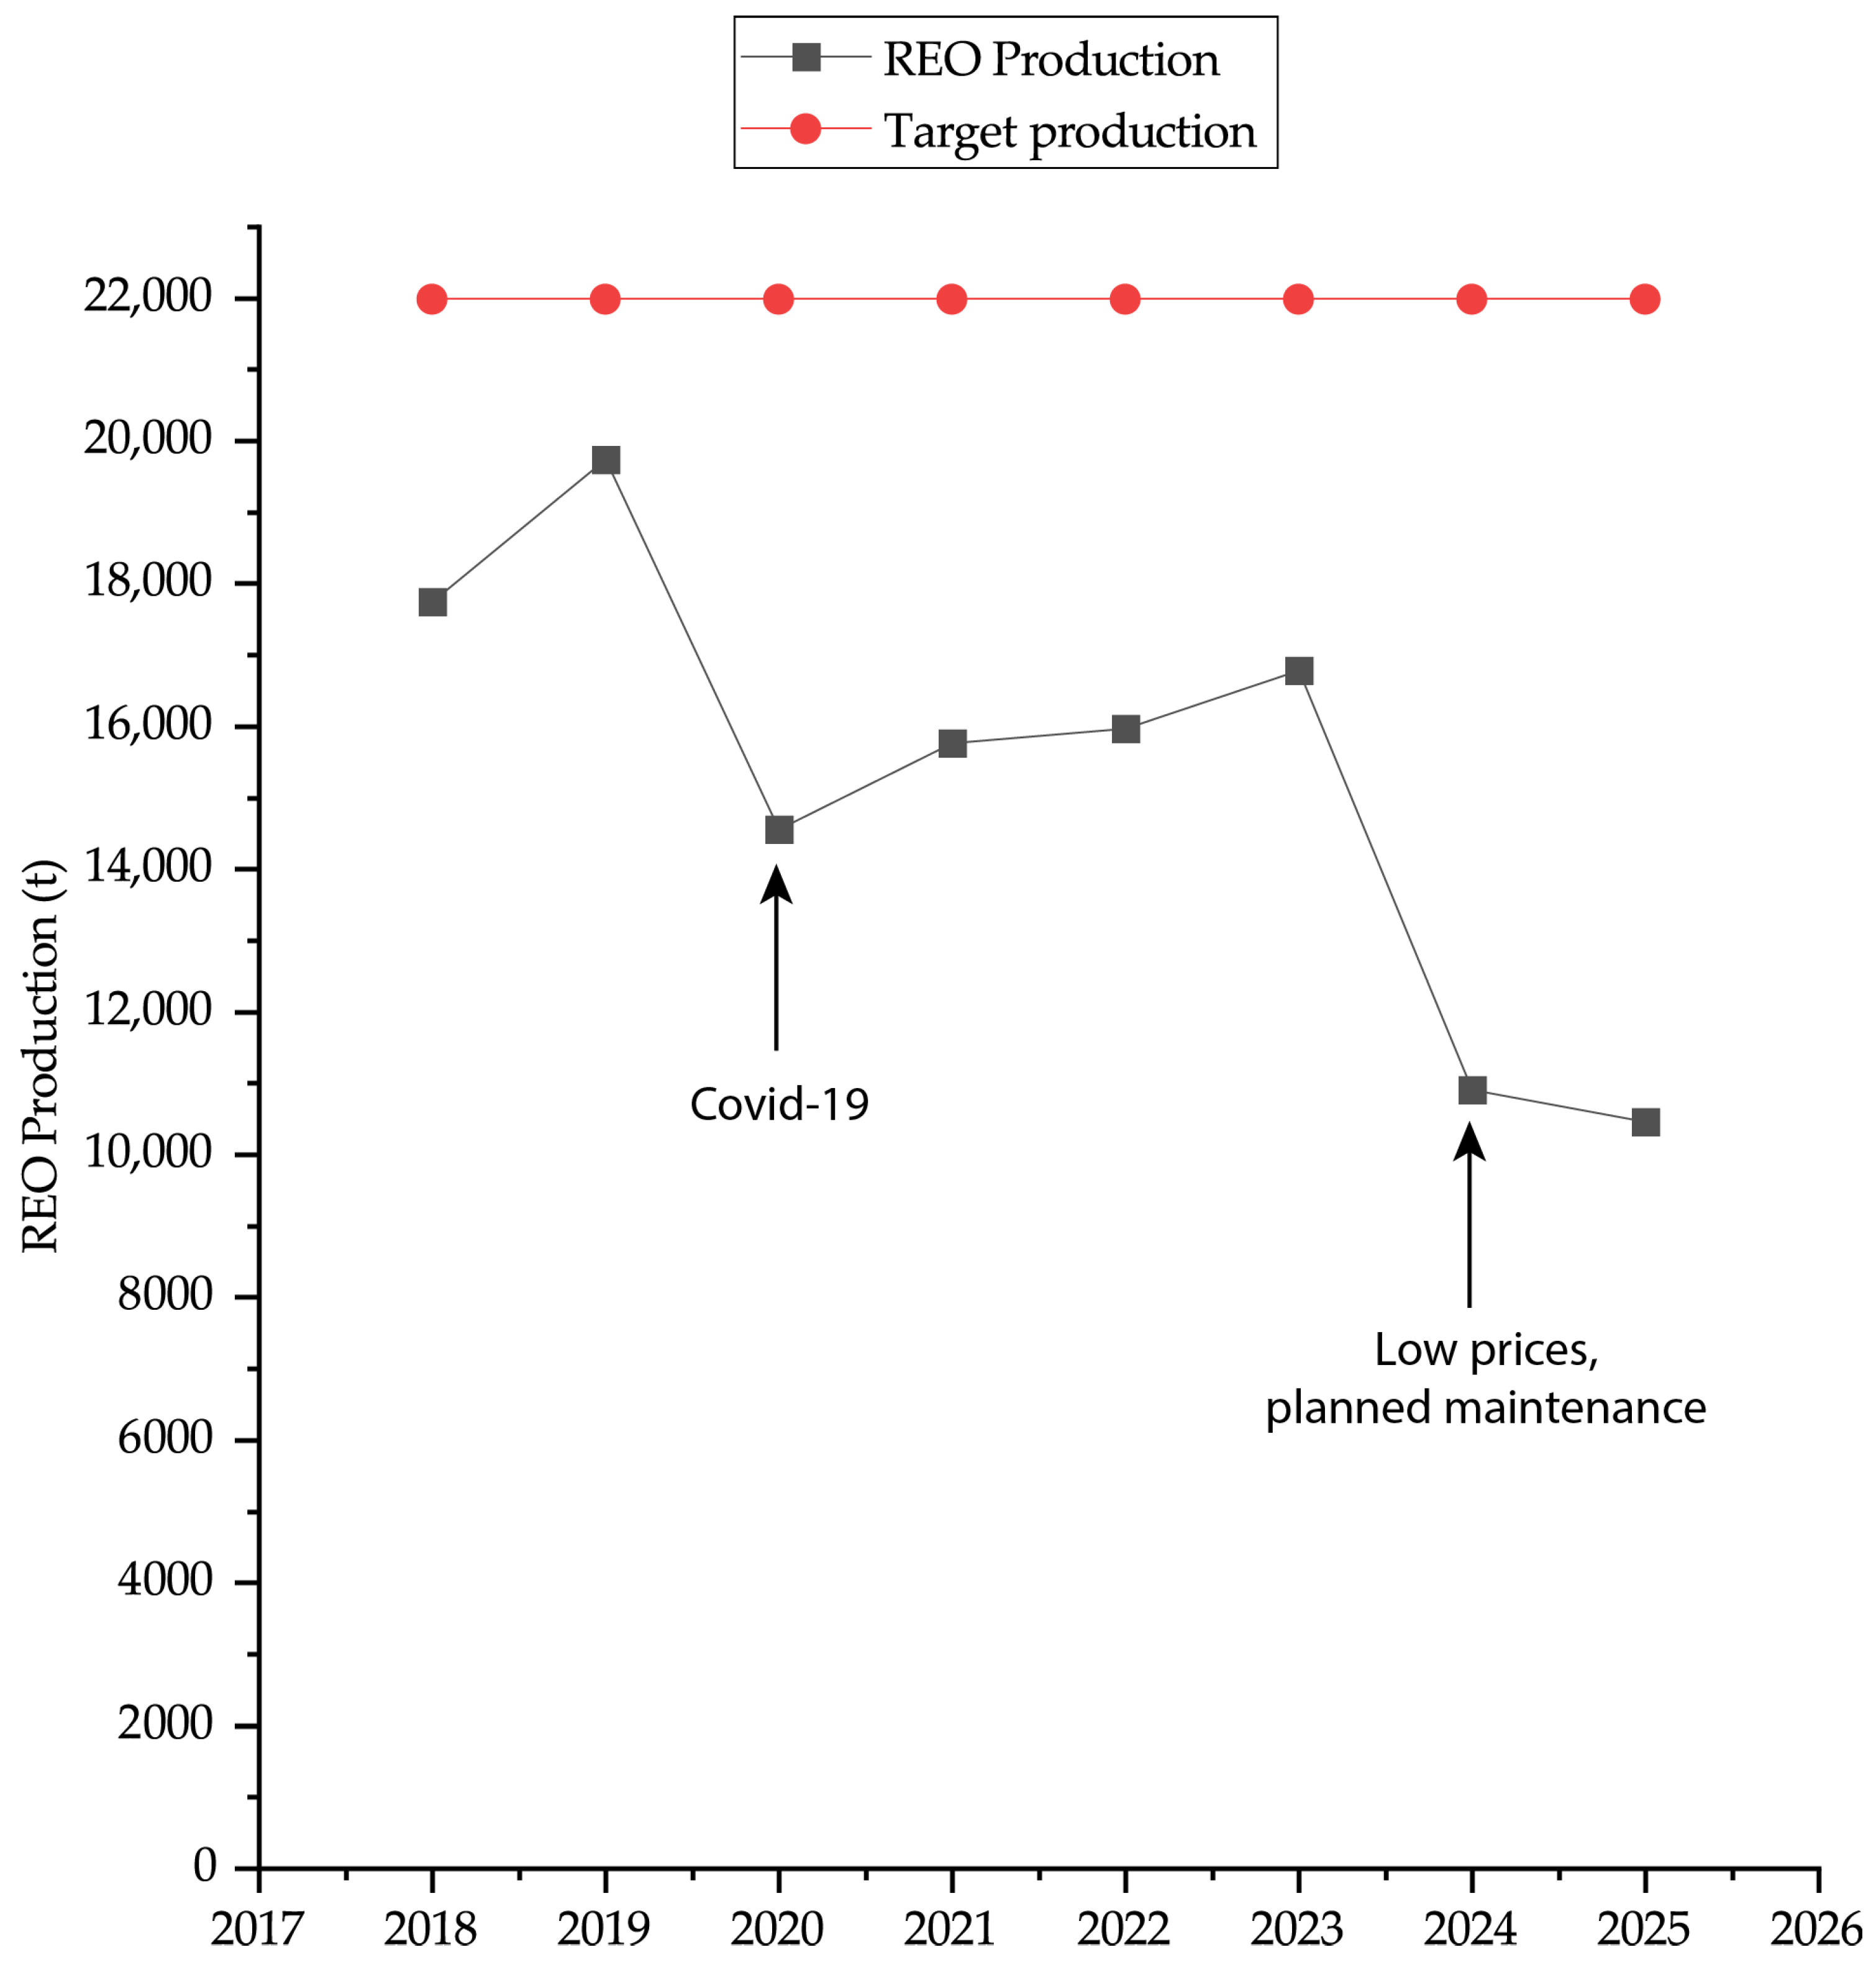
Uncertainty in mining operations is an important research topic in the scientific literature, e.g., [82], and arises from geological and operational factors, as well as from delays caused by, e.g., insufficient operational planning [83,84]. In mining operations, production at the desired grade and tonnage cannot always be guaranteed due to the uncertainty associated with, e.g., rock properties, orebody geometry, and ore grades [85]. The last stage of geological exploration, which is a feasibility study, usually includes infrastructure requirements with mining and process designs that form the basis to evaluate investment viability and supporting project financing [46]. Furthermore, all relevant environmental, social and governmental permits and agreements should either be secured or be close to finalization within the projected development schedule [46]. However, in an operating mine, the actual amount of ore produced may be lower or higher than the planned production tonnages, which also affected Lynas Rare Earth in the REE sector (Figure 3). In 2015, Lynas Rare Earths stated that the production is estimated to be 22,000 t/a of TREO [86]. However, an evaluation of the company’s annual reports shows that this target was never achieved. From FY2018 (Fiscal Year) to FY2025, total REO production was 17,753 t/a in 2018 to 10,462 t/a in 2025, respectively (Figure 3) [64,87,88,89,90,91].
Over the same period, from 2018 to 2024, the company reported a 92% increase in its mineral resources, from 55.4 Mt to 106.6 Mt, and a 63% increase in its ore reserves, from 19.7 Mt to 32.0 Mt [92]. Even though both resources and reserves increased, the annual TREO production in 2024 is almost 40% less compared to the 2018 annual TREO production. The sharp decrease in production from 2019 to 2020 is related to COVID-19-related shutdowns [64]. The COVID-19 pandemic caused transport disruptions and widespread operational shutdowns, resulting in more than 1600 mines worldwide, including many small-scale and artisanal sites ceasing production, which subsequently affected smelting and refining activities as well [93,94,95]. The reason for this sharp decrease between 2023 and 2024 was the lower rare earth prices [96]. In addition, the company conducted a six-week shutdown at its processing facility in Malaysia because of maintenance in the factory [96]. As seen in the example, even though the resources and reserves upgrade, the annual production still could decrease because of the lower prices in the market, unexpected events, or related to planned shutdowns in facilities [96].

5.4. Mining Permits

Mining directly affects both the environment and local communities [97]. As a result, the permitting process includes multiple factors affecting society and the ecosystem, including the “Social License to Operate” and may involve conflicts arising from competing land uses [97]. The need for a “social license” emerged in the late 1990s, when mining companies began to better understand the challenges they faced in managing the political and social risks associated with their projects [98]. To preserve biodiversity and water resources, the EU has policies that must be implemented across all member states, such as Natura 2000 and the Water Framework Directive [97]. The Natura 2000 is a network of natural areas, which aims to preserve the EU’s valuable habitats and wildlife [99], whereas the Water Framework Directive focuses on decreasing pollution and securing water to sustain wildlife [100]. In onshore Sweden, 12.9% are protected by Natura 2000 [101], in onshore Germany, 15.5% (and 45% offshore) are covered by Natura 2000 [102].
Although Sweden has a long history in mining, land use conflicts between forestry, mining and reindeer herding have intensified over the past 15 years [51]. In Sweden, mineral exploitation requires a comprehensive environmental impact assessment, although environmental permits are not required for exploration activities [51]. The environmental permitting phase is one of the most time-consuming stages of the mining process, mainly due to detailed environmental and socio-economic impact assessments and the possibility of appeals, which can further extend the overall permitting timeline [51].
The Norra Kärr case in Sweden in 2016 was subject to legal challenges and had an impact on the regulatory framework for mining permitting processes [63,103]. The case was initiated due to the potential negative effects of the proposed mine on Natura 2000 areas, and the Swedish Supreme Administrative Court decided that evaluating the mining concession only within the concession area was against the law [63]. As a result of this case, neighboring activities and infrastructure must now be included in the mining concession assessment and the environmental impact assessment process [63]. Although Leading Edge Materials had projected that they could start REE production in 2025, they are waiting for mining permits (as of April 2026) [45,103], and the permitting processes are getting more complicated due to appeals of stakeholders such as landlords, local communities and environmental organizations both locally and globally [51]. Furthermore, specifically this area and also other areas in Sweden have their indigenous Sami people and reindeer herding, which is a traditional, nomadic cultural practice of the Sami people [63]. Overall, areas used for Sami reindeer herding make up 55% of Sweden’s territory [104]. Mining permits and the environmental and social impacts of mining are widely debated. At the same time, extracting domestic resources is strategically important in order to reduce dependence on third countries. In this regard, the decisions must be comprehensive from environmental, social, and strategic perspectives. These different perspectives were recently summarized as STEEL-PEG (social, technological, economic, environmental, legal, political, ethical and geological [105].

5.5. Overseas Mine Investment: An Example of the Japan–Australia Partnership

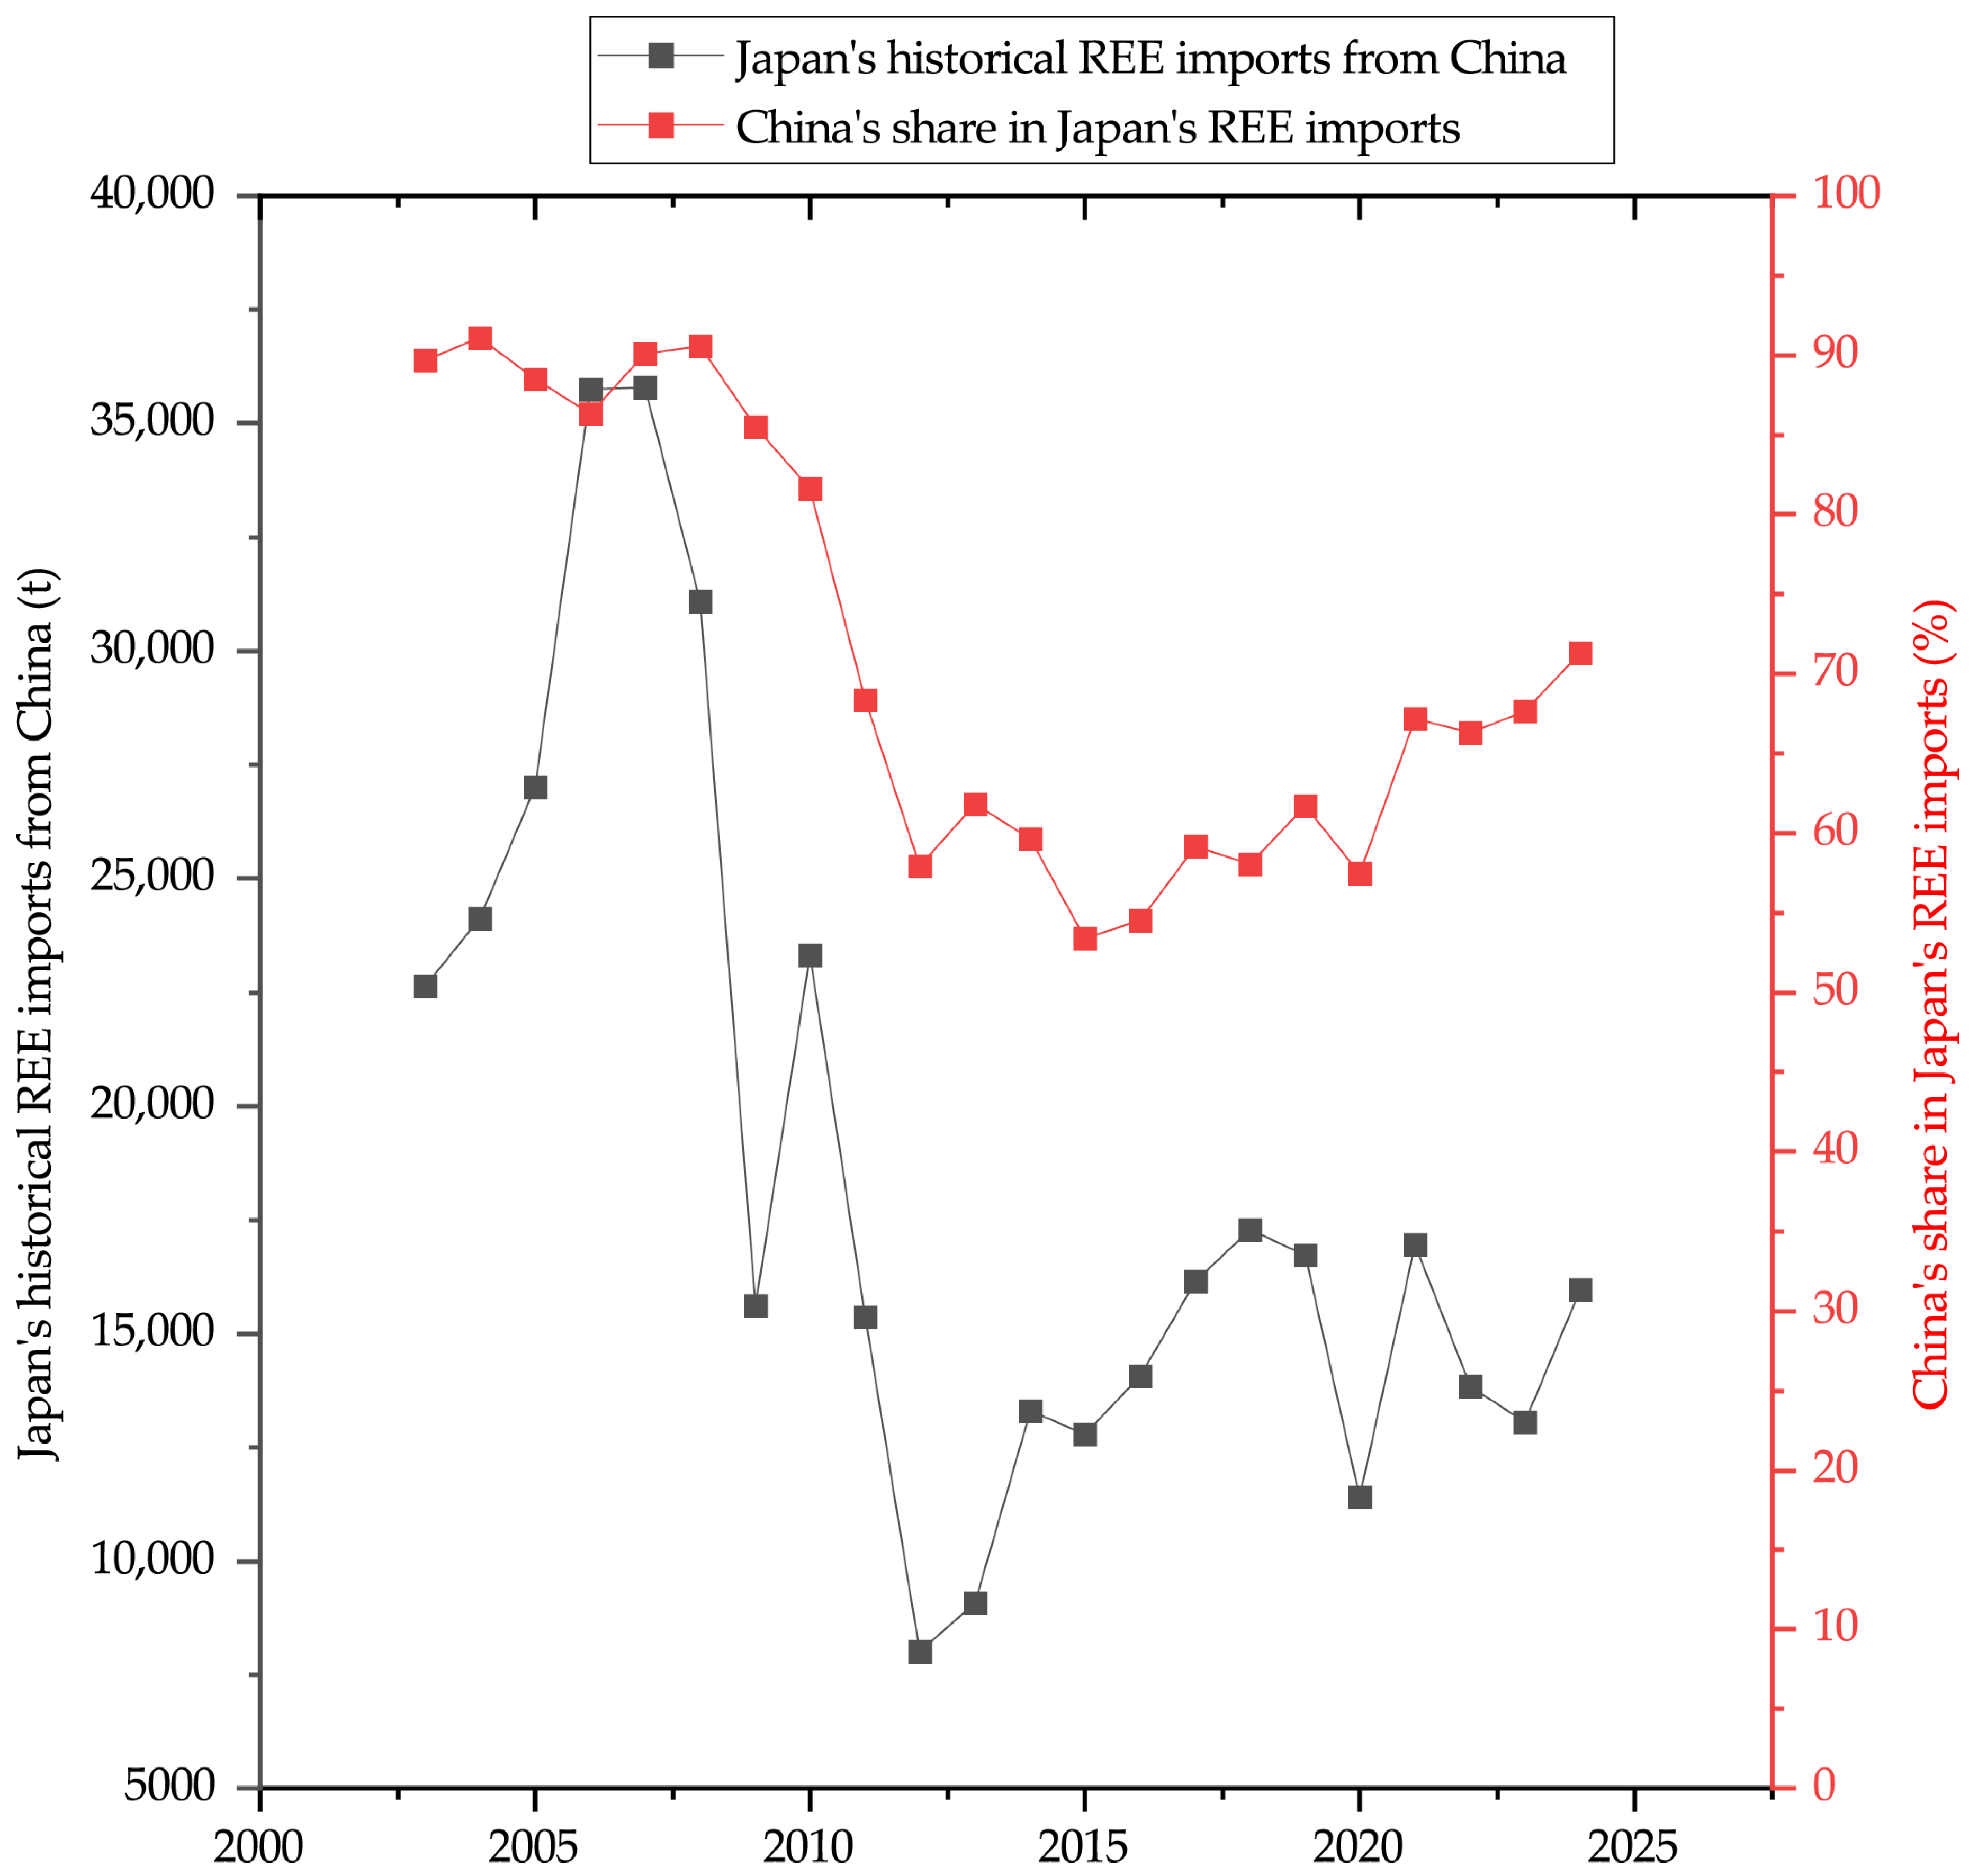
After the 2010 dispute between Japan and China, during which China halted REE exports, Japan sought to diversify and strengthen its supply chain, as 81% of its REE imports came from China in 2010 (Figure 4) (HS Code: 2846 and 280530) [106,107]. As part of this strategy, Japanese Sojitz Corporation and state-owned JOGMEC (Japan Organization for Metals and Energy Security) established Japan Australia Rare Earth in 2011 and invested in the Australia-based company Lynas Rare Earths [108].
Australian-based Lynas Rare Earths operates the rare earth mine Mount Weld in Western Australia through a joint venture of the company and Japan [108]. Mining operations for rare earths began at Mount Weld in 2008, followed by the opening of the Mount Weld concentrator in 2011 [113]. That same year, Japan invested $250 million in Lynas Rare Earths via a loan agreement [108]. In 2022, Japan made an additional $9 million investment and beyond financial support, they also provided technical assistance, including geologists and technical professionals [114]. As of 2023, Japan has invested another $134 million; this funding is aimed at expanding Lynas Rare Earths’ LREE production capacity and initiating HREE separation [115,116]. This investment is to secure up to 65% of the heavy rare earth elements dysprosium and terbium produced at Mount Weld for Japan [116]. The company achieved the first HREE separation in May 2025 in Malaysia [117].
The case of Japan’s investment illustrates that developing a commercial-scale rare earth production from resource extraction to processing technology is a long-term endeavor, as it took fourteen years (2011–2025) to produce HREEs. However, geological exploration is not included, which, on a global average, increases the lead time to approximately two decades from discovery to mine production [118]. Similarly, the refining process is also challenging since industry and intellectual properties were transferred to China [119]. In addition, the technology separating REEs is challenging [120]. For instance, Neo Performance Materials required seven years to master the complex 100-step chemical process necessary to produce ultrapure dysprosium, which is used in the manufacturing of, e.g., microcapacitors required for AI-data center components [121].
However, dependence on a single country for REE supply can be reduced, as seen in Japan’s decreased reliance on China from 81% in 2010 to 64% in 2023 [109,110,111,112]. This example highlights that diversification is achievable but requires long-term effort, emphasizing the importance of long-term strategies when evaluating similar objectives in the EU context.

6. Conclusions

Input parameters used for the Monte Carlo simulation are defined over wide uncertainty ranges, primarily because the only publicly available report in Norra Kärr for REEs is at the scoping study level. Therefore, the input data of this study are based on this specific project and are used to assess its potential to contribute to the EU’s future domestic supply of strategic and total REEs from mining.
Although the CRMA benchmark to meet 10% of the EU demand for strategic REEs by mining within the EU member states appears theoretically achievable by 2030 under the low- and high-demand scenarios, incorporating a realistic nine-year lead time demonstrates that they are unlikely to be met in practice. Achieving these benchmarks for total REEs under the given scenarios is not achievable by 2030.
Lead times and regulatory constraints affect domestic production capacity for REEs. Therefore, responsible mining practices must be promoted in the EU for REEs, and public acceptance of mining activities should be strengthened to reduce the dependency on REEs from a single third country. Nevertheless, it is essential to emphasize that any expansion in mining must comply with social and environmental standards. The long duration between initial geological exploration and the commencement of production, combined with the extended waiting periods for mining permits, makes it challenging for REE mining to begin in the EU before 2030. However, the EU has taken concrete steps through “Strategic Projects” under the CRMA and the “RESourceEU Plan”.
To improve future assessments, the EU should enhance geological exploration efforts to obtain more accurate knowledge of its domestic reserves and compliant reports for REEs.
Dependence on a single country for REEs can be reduced, but it requires a strategy that requires more than a decade to build up expertise and high investments, as in the example of the Japan–Australia partnerships. This indicates for the EU that achieving the CRMA mining benchmarks for REEs will depend on long-term commitment, building up expertise, sustained investment, and coordinated engagement with strategic partners.

Author Contributions

Conceptualization, M.Y.A., J.A.Ö. and C.H.; methodology, M.Y.A. and J.A.Ö.; software, M.Y.A.; formal analysis, M.Y.A.; investigation, M.Y.A.; resources, C.H.; data curation, M.Y.A.; writing—original draft preparation, M.Y.A. and J.A.Ö.; writing—review and editing, C.H.; visualization, M.Y.A.; supervision, C.H. All authors have read and agreed to the published version of the manuscript.

Funding

This research was funded by the scholarship KLIREC. The APC was funded by KLIREC.

Data Availability Statement

The original contributions presented in this study are included in the article. Further inquiries can be directed to the corresponding author.

Acknowledgments

Melike Yildirim Ayyildiz gratefully acknowledges the scholarship support provided by KLIREC. The authors thankfully acknowledge four anonymous reviewers for constructive and detailed review comments.

Conflicts of Interest

The authors declare no conflicts of interest. The funders had no role in the design of the study; in the collection, analyses, or interpretation of data; in the writing of the manuscript; or in the decision to publish the results.

Abbreviations

The following abbreviations are used in this manuscript:
CRMACritical Raw Materials Act
CRMCritical Raw Material
HDSHigh-demand scenario
HREEHeavy rare earth elements
HS CodeHarmonized System Code
ICTInformation, communication and digital technologies
LDSLow-demand scenario
LREELight rare earth elements
MCSMonte Carlo simulation
REERare earth element
REORare earth element oxides
TREOTotal rare earth element oxides
E-vehiclesElectronic vehicles
E-mobilityElectromobility
USGSU.S. Geological Survey
PERCPan European Reserves & Resources Reporting Committee
FYFiscal Year
JOGMECJapan Organization for Metals and Energy Security

Appendix A

Table A1. Results of Monte Carlo simulation of the projected production of strategic REEs (LDS and HDS) and projected production of total REEs (EU demand scenario) with uniform distribution. The p-values represent percentiles of the simulated production outcomes. P0 and p100 represent the minimum and maximum values of the simulation, while p5 and p95 indicate the bounds of the 90% confidence interval. P50 is the median. Data is given REE t/a, input parameter from [26,27].
Low-Demand Scenario (LDS)
Yearsp0p5p50p95p100ModeMode repeat countStandard deviation
202520002000200020002000200010,0000
2030100011002020292030002220133581.6
203550084818633628.94500138012846.3
2040280.97001788.24114670542931062
2045189.3571.71706.24507.79010.51122.431254.4
2050137.84881643.34799.411,443.463121412.9
High-Demand Scenario (HDS)
Yearsp0p5p50p95p100ModeMode repeat countStandard deviation
202520002000200020002000200010,0000
2030100010802000292030002700129587.6
20355108191843.236404500151218857
2040291.5681.21786.64179.26308.1729.641077.7
2045184.7567.91717.94543.39462.1545.321269.1
205094.2483.61649.54851.710,681.12068.331426.5
EU Demand Scenario
Yearsp0p5p50p95p100ModeMode repeat countStandard deviation
202544504450445044504450445010,0000
20302225240344506497667523141231304.3
20351112.51864.14107.48049.210,012.52242.8181887.5
20406231539.93931.59121.914,4241816.742348.3
20453311265.13772.89991.118,4554517.632761.1
2050341.51074.43600.510,695.624,553.81039.123107.4
Table A2. Results of the Monte Carlo simulation of the projected production of strategic REEs (LDS and HDS) and projected production of total REEs (EU demand scenario) with the nine years lead time and with uniform distribution. The p-values represent percentiles of the simulated production outcomes. P0 and p100 represent the minimum and maximum values of the simulation, while p5 and p95 indicate the bounds of the 90% confidence interval. P50 is the median. Data is given REE t/a, input parameter from [26,27].
Low-Demand Scenario (LDS)
Yearsp0p5p50p95p100ModeMode repeat countStandard deviation
203420002000200020002000200010,0000
2039100011002000290030002900125582.8
2044500843.61854.23616.84500201616840.7
2049301.66921784.64102.36526.81663.261054.1
High-Demand Scenario (HDS)
Yearsp0p5p50p95p100ModeMode repeat countStandard deviation
203420002000200020002000200010,0000
2039100011002020290030002900136584.4
2044500837.41874.93635.24500187216851.3
2049285.6680.11811.64072.66436.8668.341051.1
EU Demand Scenario
Yearsp0p5p50p95p100ModeMode repeat countStandard deviation
203444504450445044504450445010,0000
20392225240344506452.566753248.51261297.3
20441134.81902.44145.280109945.84485.6151864.1
2049624.815483964.79140.514,620.34421.562351.7
Table A3. Results of Monte Carlo simulation of the projected production of strategic REEs (LDS and HDS) and projected production of total REEs (EU demand scenario) with a Gaussian distribution. The p-values represent percentiles of the simulated production outcomes. P0 and p100 represent the minimum and maximum values of the simulation, while p5 and p95 indicate the bounds of the 90% confidence interval. P50 is the median. Data is given REE t/a, input parameter from [26,27].
Low-Demand Scenario (LDS)
Yearsp0p5p50p95p100ModeMode repeat countStandard deviation
202520002000200020002000200010,0000
2030100014402000256029801960254335
20355941272.81971.22830.43834237627475.9
2040496.71141.11946.230474765.51693.45584.9
2045479.21044.21919.23268.85813.91581.13687.1
2050355.4969.41894.73449.16537.11609.43771.8
High-Demand Scenario (HDS)
Yearsp0p5p50p95p100ModeMode repeat countStandard deviation
202520002000200020002000200010,0000
2030100014402000256029801960254335
20355941272.81971.22830.43834237627475.9
2040496.71141.11946.230474765.51693.45584.9
2045479.21044.21919.23268.85813.91581.13687.1
2050355.4969.41894.73449.16537.11609.43771.8
EU Demand Scenario
Yearsp0p5p50p95p100ModeMode repeat countStandard deviation
202544504450445044504450445010,0000
203022253204445056966630.54361254745.5
20351321.728324385.96297.68530.74485.6301058.9
20401105.125394330.46779.510,603.34440.761301.3
20451066.22323.34270.17273.112,9363336.331528.7
2050790.721574215.77674.314,545358131717.3
Table A4. Results of the Monte Carlo simulation of the projected production of strategic REEs (LDS and HDS) and projected production of total REEs (EU demand scenario) with the nine years lead time and with a Gaussian distribution. The p-values represent percentiles of the simulated production outcomes. P0 and p100 represent the minimum and maximum values of the simulation, while p5 and p95 indicate the bounds of the 90% confidence interval. P50 is the median. Data is given REE t/a, input parameter from [26,27].
Low-Demand Scenario (LDS)
Yearsp0p5p50p95p100ModeMode repeat countStandard deviation
203420002000200020002000200010,0000
2039100014402000256029801960254335
20445941272.81971.22830.43834237627475.9
2049496.71141.11946.230474765.51693.45584.9
High-Demand Scenario (HDS)
Yearsp0p5p50p95p100ModeMode repeat countStandard deviation
203420002000200020002000200010,0000
2039100014402000256029801960254335
20445941272.81971.22830.43834237627475.9
2049496.71141.11946.230474765.51693.45584.9
EU Demand Scenario
Yearsp0p5p50p95p100ModeMode repeat countStandard deviation
203444504450445044504450445010,0000
203922253204445056966630.54361254745.5
20441321.728324385.96297.68530.74485.6301058.9
20491105.125394330.46779.510,603.34440.761301.3

References

  1. OECD. Global Material Resources Outlook to 2060: Economic Drivers and Environmental Consequences; OECD: Paris, France, 2019. [Google Scholar]
  2. Wang, S.; Hausfather, Z.; Davis, S.; Lloyd, J.; Olson, E.B.; Liebermann, L.; Núñez-Mujica, G.D.; McBride, J. Future demand for electricity generation materials under different climate mitigation scenarios. Joule 2023, 7, 309–332. [Google Scholar] [CrossRef]
  3. Vidal, O.; Goffé, B.; Arndt, N. Metals for a low-carbon society. Nat. Geosci. 2013, 6, 894–896. [Google Scholar] [CrossRef]
  4. IEA. The Role of Critical Minerals in Clean Energy Transitions; IEA: Paris, France, 2021. [Google Scholar]
  5. IEA. Minerals Used in Electric Cars Compared to Conventional Cars; IEA: Paris, France, 2021. [Google Scholar]
  6. Hilgers, C.; Kolb, J.; Becker, I. Ist Die Deutsche Ressourcenstrategie Resilient? Bergbau—Verhüttung—Recycling; THINKTANK Industrielle Ressourcenstrategien: Stuttgart, Germany, 2021; p. 76. Available online: https://sgt.agw.kit.edu/downloads/Publikationen/Think%20Tank/Hilgers_Kolb_Becker_2021_THINKTANK_Brosc.pdf (accessed on 14 May 2026).
  7. Ölmez, J.A.; Hilgers, C. Rohstoffe für Deutschland und Auswirkungen des Russland-Ukraine Konflikts; THINKTANK Industrielle Ressourcenstrategien: Stuttgart, Germany, 2023; Available online: https://www.thinktank-irs.de/wp-content/uploads/2024/01/RZ_THINKTANK_US_UKR_A4_DE_12I23.pdf (accessed on 14 May 2026).
  8. Hund, K.; Porta, D.; Fabregas, T.; Laing, T.; Drexhage, J. Minerals for Climate Action: The Mineral Intensity of the Clean Energy Transition; World Bank Group: Washington, DC, USA, 2023. [Google Scholar]
  9. Legislative Council. Strategic and Critical Materials Stock Piling Act; Technical Report, 50 U.S.C. 98; Legislative Council: Washington, DC, USA, 1939. Available online: https://www.govinfo.gov/content/pkg/COMPS-674/pdf/COMPS-674.pdf (accessed on 14 May 2026).
  10. Lusty, P.A.J.; Shaw, R.A.; Gunn, A.G.; Idoine, N.E. UK Criticality Assessment of Technology Critical Minerals and Metals; CR/21/120; British Geological Survey: Keyworth, UK, 2021; p. 76. [Google Scholar]
  11. Burton, J. US Geological Survey Releases 2022 List of Critical Minerals, United States Geological Survey (USGS). 2022. Available online: http://usgs.gov/news/national-news-release/us-geological-survey-releases-2022-list-critical-minerals (accessed on 6 February 2025).
  12. Ministry of Mines. Critical Minerals for India. Report of the Committee on Identification of Critical Minerals. 2023. Available online: https://mines.gov.in/admin/storage/app/uploads/649d4212cceb01688027666.pdf (accessed on 15 February 2025).
  13. Seok-Min, O.S. Korea Designates 10 ‘Strategic’ Minerals, Introduces Early Warning System for Stable Supplies. 2023. Available online: https://en.yna.co.kr/view/AEN20230227003300320 (accessed on 6 February 2025).
  14. Critical Minerals Office. Australia’s Critical Minerals List and Strategic Materials List. 2024. Available online: https://www.industry.gov.au/publications/australias-critical-minerals-list-and-strategic-materials-list (accessed on 6 February 2025).
  15. Nogimori, M. Restructuring of Critical Mineral Supply Chain Faces “Trilemma”, Economic risks to surge by pursuing de-risking from China and decarbonization. JRI Res. J. 2024, 7, 1–12. [Google Scholar]
  16. European Commission. Study on the Critical Raw Materials for the EU 2023—Final Report; European Commission: Luxembourg, 2023. [Google Scholar]
  17. European Commission. An EU Critical Raw Materials Act for the Future of EU Supply Chains. 2025. Available online: https://www.consilium.europa.eu/en/infographics/critical-raw-materials/ (accessed on 15 June 2025).
  18. European Commission Directorate-General for Internal Market Industry Entrepreneurship and SMEs. European Critical Raw Materials Board. Available online: https://single-market-economy.ec.europa.eu/sectors/raw-materials/areas-specific-interest/critical-raw-materials/critical-raw-materials-act/board_en (accessed on 13 May 2026).
  19. European Parliament Council of the European Union. Regulation (EU) 2024/1252 of the European Parliament and of the Council of 11 April 2024 establishing a framework for ensuring a secure and sustainable supply of critical raw materials and amending Regulations (EU) No 168/2013, (EU) 2018/858, (EU) 2018/1724 and (EU) 2019/1020. 2024. Available online: https://eur-lex.europa.eu/legal-content/EN/TXT/?uri=CELEX%3A02024R1252-20240503 (accessed on 14 May 2026).
  20. DERA. DERA-Rohstoffliste 2023: Angebotskonzentration bei Mineralischen Rohstoffen und Zwischenprodukten: Potentielle Preis-und Lieferrisiken; DERA Rohstoffinformationen 56; DERA—Deutsche Rohstoffagentur in der Bundesanstalt für Geowissenschaften und Rohstoffe: Berlin, Germany, 2023; p. 122. [Google Scholar] [CrossRef]
  21. Schönfeldt, M.; Diehl, O.; Gassman, J. Recycling of NdFeB Magnets in Germany; DERA Rohstoffinformationen 60; DERA—Deutsche Rohstoffagentur in der Bundesanstalt für Geowissenschaften und Rohstoffe: Berlin, Germany, 2024; p. 45. [Google Scholar]
  22. Van Gosen, B.S.; Verplanck, P.L.; Seal, I.I.R.R.; Long, K.R.; Gambogi, J. Rare-earth elements, chap O. In Critical Mineral Resources of the United States—Economic and Environmental Geology and Prospects for Future Supply; U.S. Geological Survey Professional Paper; Schulz, K.J., DeYoung, J.H., Seal, R.R., Bradley, D.C., Eds.; USGS: Reston, VA, USA, 2017; p. 44. [Google Scholar]
  23. Guyonnet, D.; Planchon, M.; Rollat, A.; Escalon, V.; Tuduri, J.; Charles, N.; Vaxelaire, S.; Dubois, D.; Fargier, H. Material flow analysis applied to rare earth elements in Europe. J. Clean. Prod. 2015, 107, 215–228. [Google Scholar] [CrossRef]
  24. Mirakovski, D.; Krstev, B.; Krstev, A.; Petrovski, F. Mine project evaluation techniques. Nat. Resour. Technol. 2009, 3, 7. Available online: https://eprints.ugd.edu.mk/3735/1/MINE%20PROJECT%20EVALUATION%20TECHNIQUES.pdf (accessed on 14 May 2026).
  25. Kamel, A.; Elwageeh, M.; Bonduà, S.; Elkarmoty, M. Evaluation of mining projects subjected to economic uncertainties using the Monte Carlo simulation and the binomial tree method: Case study in a phosphate mine in Egypt. Resour. Policy 2023, 80, 103266. [Google Scholar] [CrossRef]
  26. European Climate Infrastructure and Environment Executive Agency. Life Inspiree: Mining for Valuable Metals in our Waste at Large Scale. 2025. Available online: https://cinea.ec.europa.eu/news-events/news/life-inspiree-mining-valuable-metals-our-waste-large-scale-2025-04-28_en (accessed on 30 April 2025).
  27. Carrara, S.; Bobba, S.; Blagoeva, D.; Alves Dias, P.; Cavalli, A.; Georgitzikis, K.; Grohol, M.; Itul, A.; Kuzov, T.; Latunussa, C.; et al. Supply Chain Analysis and Material Demand Forecast in Strategic Technologies and Sectors in the EU—A Foresight Study; Publications Office of the European Union: Luxembourg, 2023. [Google Scholar] [CrossRef]
  28. IEA. European Critical Raw Materials Act. 2024. Available online: https://www.iea.org/policies/17662-european-critical-raw-materials-act (accessed on 30 October 2024).
  29. European Commission. Selected Strategic Projects. 2025. Available online: https://single-market-economy.ec.europa.eu/sectors/raw-materials/areas-specific-interest/critical-raw-materials/strategic-projects-under-crma/selected-projects_en (accessed on 15 June 2025).
  30. European Commission: Directorate-General for Internal Market, Industry, Entrepreneurship and SMEs. In Strategic Project—REEMap Project; Publications Office of the European Union: Luxembourg, 2025.
  31. European Commission: Directorate-General for Internal Market, Industry, Entrepreneurship and SMEs. In Strategic Project—Pulawy Rare Earths Separation Plant; Publications Office of the European Union: Luxembourg, 2025.
  32. European Commission: Directorate-General for Internal Market, Industry, Entrepreneurship and SMEs. In Strategic Project—MagFactory; Publications Office of the European Union: Luxembourg, 2025.
  33. European Commission: Directorate-General for Internal Market, Industry, Entrepreneurship and SMEs. In Strategic Project—LIFE-22-ENV-IT-INSPIREE; Publications Office of the European Union: Luxembourg, 2025.
  34. European Commission: Directorate-General for Internal Market, Industry, Entrepreneurship and SMEs. In Strategic Project—CAREMAG; Publications Office of the European Union: Luxembourg, 2025.
  35. European Commission: Directorate-General for Internal Market, Industry, Entrepreneurship and SMEs. In Strategic Project—Songwe Hill Rare Earths; Publications Office of the European Union: Luxembourg, 2025.
  36. European Commission: Directorate-General for Internal Market, Industry, Entrepreneurship and SMEs. In Strategic Project—Zandkopsdrift Rare Earths and Battery Grade Manganese Project; Publications Office of the European Union: Luxembourg, 2025.
  37. European Commission. ANNEX to the Commisison Decision Recognising Certain Critical Raw Material Projects Located in Third Countries and in Overseas Countries or Territories as Strategic Projects Under Regulation (EU) 2024/1252 of the European Parliament and of the Council; European Commission: Brussels, Belgium, 2025. [Google Scholar]
  38. European Commission Directorate-General for Communication. Commission Adopts RESourceEU to Secure Raw Materials, Reduce Dependencies and Boost Competitiveness. 2025. Available online: https://ec.europa.eu/commission/presscorner/detail/en/ip_25_2891 (accessed on 27 December 2025).
  39. European Commission. RESourceEU Action Plan Factsheet; Publications Office of the European Union: Luxembourg, 2025. [Google Scholar]
  40. USGS. Mineral Commodity Summaries 2025; USGS: Reston, VA, USA, 2025; p. 212. [Google Scholar]
  41. CRIRSCO. International Reporting Template for the Public Reporting of Exploration Targets, Exploration Results, Mineral Resources and Mineral Reserves; Committee for Mineral Reserves International Reporting Standards, 2019; pp. 1–79. Available online: https://crirsco.com/wp-content/uploads/2023/10/The-CRIRSCO-International-Reporting-Template.pdf (accessed on 14 May 2026).
  42. Sides, E. An Introduction to Rare Earth Elements (REEs). 2020. Available online: https://news.thedigbee.com/an-introduction-to-rare-earth-elements-rees/ (accessed on 10 July 2025).
  43. Yan, D.; Ro, S.; Sunam, O.; Kim, S. On the Global Rare Earth Elements Utilization and Its Supply-Demand in the Future. IOP Conf. Ser. Earth Environ. Sci. 2020, 508, 012084. [Google Scholar] [CrossRef]
  44. James Cook University Australia. Element-to-Stoichiometric Oxide Conversion Factors. 2026. Available online: https://www.jcu.edu.au/advanced-analytical-centre/resources/element-to-stoichiometric-oxide-conversion-factors (accessed on 24 February 2026).
  45. Bowell, R.J.; Chapman, C.; McDougall, C.; Martindale, R.; Pittuck, M. Preliminary Economic Assessment of Norra Kärr Rare Earth Deposit and Potential By-Products, Sweden; NI 43-101 Technical Report Prepared For Leading Edge Materials; SRK Consulting: Wales, UK, 2021; pp. 1–328. [Google Scholar]
  46. PERC. PERC Reporting Standard. Pan-European Standard for the Public Reporting of Exploration Results, Mineral Resources and Mineral Reserves; PERC: Brussels, Belgium, 2021. [Google Scholar]
  47. LKAB. LKAB 2024 Mineral Resource Estimation Summary Report; LKAB: Luleå, Sweden, 2024; p. 116. [Google Scholar]
  48. You, G.G. (Ed.) Feasibility Studies. In Mining Project Value Optimization; Springer Nature: Singapore, 2025; pp. 49–67. [Google Scholar]
  49. Brewski, C. Leading Edge Materials Advances Towards Production as European Supply Security Demands Domestic Sources. 2025. Available online: https://www.cruxinvestor.com/posts/leading-edge-materials-advances-towards-production-as-european-supply-security-demands-domestic-sources (accessed on 26 December 2025).
  50. Manalo, P. From 6 Years to 18 Years: The Increasing Trend of Mine Lead Times. 2025. Available online: https://www.spglobal.com/market-intelligence/en/news-insights/research/from-6years-to-18years-the-increasing-trend-of-mine-lead-times (accessed on 30 August 2025).
  51. Johnson, E.L.; Ericsson, M.; Löf, A. The mining permitting process in selected developed economies. Land Use Policy 2023, 131, 106762. [Google Scholar] [CrossRef]
  52. Naringsdepartemente. Regeringen Beviljar Bearbetningskoncession för Kallak K nr 1. 2022. Available online: https://jokkmokkiron.se/upload/images/dokument/presentationsbilder-regeringen-beviljar-bearbetningskoncession-for-kallak-k-nr-157.pdf (accessed on 25 December 2025).
  53. UN Comtrade Database. Trade Data—HS: 2846, Reporters: European Union, Partners: All, Periods: Recent Periods, Trade Flows: Import. 2025. Available online: https://comtradeplus.un.org/TradeFlow?Frequency=A&Flows=M&CommodityCodes=2846&Partners=all&Reporters=97&period=recent&AggregateBy=none&BreakdownMode=plus (accessed on 27 June 2025).
  54. UN Comtrade Database. Trade Data—HS: 280530, Reporters: European Union, Partners: All, Periods: Recent Periods, Trade Flows: Import. 2025. Available online: https://comtradeplus.un.org/TradeFlow?Frequency=A&Flows=M&CommodityCodes=280530&Partners=0&Reporters=97&period=recent&AggregateBy=none&BreakdownMode=plus (accessed on 27 June 2025).
  55. Gregoir, L.; van Acker, K. Metals for Clean Energy: Pathways to Solving Europe’s Raw Materials Challenge; KU Leuven and Europe’s Metals Association: Brussels, Belgium, 2022. [Google Scholar]
  56. Kissell, R.L. (Ed.) Chapter 8—Nonlinear Regression Models. In Algorithmic Trading Methods, 2nd ed.; Academic Press: Cambridge, MA, USA, 2021; pp. 197–219. [Google Scholar]
  57. Fávero, L.P.; Belfiore, P. (Eds.) Chapter 20—Simulation and Risk Analysis. In Data Science for Business and Decision Making; Academic Press: Cambridge, MA, USA, 2019; pp. 919–931. [Google Scholar]
  58. Harris, C.R.; Millman, K.J.; van der Walt, S.J.; Gommers, R.; Virtanen, P.; Cournapeau, D.; Wieser, E.; Taylor, J.; Berg, S.; Smith, N.J.; et al. Array programming with NumPy. Nature 2020, 585, 357–362. [Google Scholar] [CrossRef]
  59. Virtanen, P.; Gommers, R.; Oliphant, T.E.; Haberland, M.; Reddy, T.; Cournapeau, D.; Burovski, E.; Peterson, P.; Weckesser, W.; Bright, J.; et al. SciPy 1.0: Fundamental algorithms for scientific computing in Python. Nat. Methods 2020, 17, 261–272. [Google Scholar] [CrossRef]
  60. Hunter, J.D. Matplotlib: A 2D Graphics Environment. Comput. Sci. Eng. 2007, 9, 90–95. [Google Scholar] [CrossRef]
  61. McKinney, W. Data Structures for Statistical Computing in Python. In Proceedings of the 9th Python in Science Conference, Austin, TX, USA, 28 June–3 July 2010. [Google Scholar]
  62. Schnebele, E.; Jaiswal, K.; Luco, N.; Nassar, N.T. Natural hazards and mineral commodity supply: Quantifying risk of earthquake disruption to South American copper supply. Resour. Policy 2019, 63, 101430. [Google Scholar] [CrossRef]
  63. Raitio, K.; Allard, C.; Lawrence, R. Mineral extraction in Swedish Sápmi: The regulatory gap between Sami rights and Sweden’s mining permitting practices. Land Use Policy 2020, 99, 105001. [Google Scholar] [CrossRef]
  64. Lynas Rare Earths. Annual Report. 2020. Available online: https://wcsecure.weblink.com.au/pdf/LYC/02290013.pdf (accessed on 13 February 2026).
  65. Mencarini, E.; Dussud, M.; Piotr, P.; Fuchs, S.; Ariztia, S. The Capex Crystal Ball: Beating the Odds in Mining Project Delivery; McKinsey & Company, 2024; p. 7. Available online: https://www.mckinsey.com/industries/metals-and-mining/our-insights/the-capex-crystal-ball-beating-the-odds-in-mining-project-delivery (accessed on 14 May 2026).
  66. Destatis. Ein Großteil der Importierten Seltenen Erden Kamen 2024 aus China. 2025. Available online: https://www.destatis.de/DE/Presse/Pressemitteilungen/2025/04/PD25_N019_51.html (accessed on 5 January 2026).
  67. Gad, S.C. Cerium. In Encyclopedia of Toxicology, 3rd ed.; Wexler, P., Ed.; Academic Press: Oxford, UK, 2014; pp. 773–775. [Google Scholar]
  68. Blomqvist, L.; Nordberg, G.A.-O.; Nurchi, V.A.-O.; Aaseth, J.A.-O. Gadolinium in Medical Imaging-Usefulness, Toxic Reactions and Possible Countermeasures-A Review. Biomolecules 2022, 12, 742. [Google Scholar] [CrossRef]
  69. Zhu, M.; Zhang, H.; Xing, W.; Zhou, X.; Wang, L.; Sun, H. Research on price transmission in Chinese mining stock market: Based on industry. Resour. Policy 2023, 83, 103727. [Google Scholar] [CrossRef]
  70. Söderholm, K.; Söderholm, P.; Pettersson, M.; Svahn, N.; Viklund, R. Environmental Regulation and Mining Sector Competitiveness. 2014. Available online: https://www.diva-portal.org/smash/get/diva2:995343/FULLTEXT01.pdf (accessed on 6 May 2026).
  71. Mariev, O.; Blueschke, D. Interplay of Chinese rare earth elements supply and European clean energy transition: A geopolitical context analysis. Renew. Energy 2025, 238, 121986. [Google Scholar] [CrossRef]
  72. Söderholm, K.; Söderholm, P.; Helenius, H.; Pettersson, M.; Viklund, R.; Masloboev, V.; Mingaleva, T.; Petrov, V. Environmental regulation and competitiveness in the mining industry: Permitting processes with special focus on Finland, Sweden and Russia. Resour. Policy 2015, 43, 130–142. [Google Scholar] [CrossRef]
  73. Castor, S.B. Rare Earth Deposits of North America. Resour. Geol. 2008, 58, 337–347. [Google Scholar] [CrossRef]
  74. Wübbeke, J. Rare earth elements in China: Policies and narratives of reinventing an industry. Resour. Policy 2013, 38, 384–394. [Google Scholar] [CrossRef]
  75. Eggert, R.; Wadia, C.; Anderson, C.; Bauer, D.; Fields, F.; Meinert, L.; Taylor, P. Rare Earths: Market Disruption, Innovation, and Global Supply Chains. Annu. Rev. Environ. Resour. 2016, 41, 199–222. [Google Scholar] [CrossRef]
  76. Paulick, H.; Machacek, E. The global rare earth element exploration boom: An analysis of resources outside of China and discussion of development perspectives. Resour. Policy 2017, 52, 134–153. [Google Scholar] [CrossRef]
  77. Mancheri, N.A.; Sprecher, B.; Bailey, G.; Ge, J.; Tukker, A. Effect of Chinese policies on rare earth supply chain resilience. Resour. Conserv. Recycl. 2019, 142, 101–112. [Google Scholar] [CrossRef]
  78. BMWk. The Trend Towards Electric Mobility. 2021. Available online: https://energiewende.bundeswirtschaftsministerium.de/EWD/Redaktion/EN/Newsletter/2021/08/Meldung/direkt-answers-infographic.html (accessed on 23 February 2026).
  79. Kyllmann, C. Germany Approves Record Capacity for New Onshore Wind Turbines in 2025. 2026. Available online: https://www.cleanenergywire.org/news/germany-approves-record-capacity-new-onshore-wind-turbines-2025 (accessed on 5 February 2026).
  80. Foundation Offshore Wind Energy. 1.639 Offshore Wind Turbines (OWT) 9,2 GW Capacity of Offshore Wind Turbines. 2025. Available online: https://www.offshore-stiftung.de/en/status-quo-offshore-windenergy.php (accessed on 5 February 2026).
  81. Imholte, D.D.; Nguyen, R.T.; Vedantam, A.; Brown, M.; Iyer, A.; Smith, B.J.; Collins, J.W.; Anderson, C.G.; O’Kelley, B. An assessment of U.S. rare earth availability for supporting U.S. wind energy growth targets. Energy Policy 2018, 113, 294–305. [Google Scholar] [CrossRef]
  82. Polo Salinas, J.; Marquina-Araujo, J.; Cotrina-Teatino, M. Uncertainty in underground mining operations: A bibliometric and systematic literature review analysis. World J. Eng. 2024, 22, 1328–1343. [Google Scholar] [CrossRef]
  83. Hou, J.; Li, G.; Wang, H.; Hu, N. Genetic algorithm to simultaneously optimise stope sequencing and equipment dispatching in underground short-term mine planning under time uncertainty. Int. J. Min. Reclam. Environ. 2020, 34, 307–325. [Google Scholar] [CrossRef]
  84. Hou, J.; Li, G.; Hu, N.; Wang, H. Simultaneous integrated optimization for underground mine planning: Application and risk analysis of geological uncertainty in a gold deposit. Gospod. Surowcami Miner.-Miner. Resour. Manag. 2019, 35, 153–174. [Google Scholar] [CrossRef]
  85. Dowd, P.A.; Xu, C.; Coward, S. Strategic mine planning and design: Some challenges and strategies for addressing them. Min. Technol. 2016, 125, 22–34. [Google Scholar] [CrossRef]
  86. Lynas Corporation Ltd. Mount Weld Mineral Resource and Ore Reserve Update 2015. 2015. Available online: https://lynasrareearths.com/wp-content/uploads/2019/05/151005-Ore-Reserves-and-Resources-1481136.pdf (accessed on 14 February 2026).
  87. Lynas Rare Earths. Annual Report. 2021. Available online: https://wcsecure.weblink.com.au/pdf/LYC/02434182.pdf (accessed on 13 February 2026).
  88. Lynas Rare Earths. Annual Report. 2022. Available online: https://wcsecure.weblink.com.au/pdf/LYC/02581455.pdf (accessed on 13 February 2026).
  89. Lynas Rare Earths. Annual Report. 2023. Available online: https://wcsecure.weblink.com.au/pdf/LYC/02724575.pdf (accessed on 13 February 2026).
  90. Lynas Rare Earths. Annual Report. 2024. Available online: https://wcsecure.weblink.com.au/pdf/LYC/02865113.pdf (accessed on 13 February 2026).
  91. Lynas Rare Earths. Annual Report. 2025. Available online: https://wcsecure.weblink.com.au/pdf/LYC/02985262.pdf (accessed on 13 February 2026).
  92. Lynas Rare Earths. 2024 Mineral Resource and Ore Reserve Update. 2024. Available online: https://wcsecure.weblink.com.au/pdf/LYC/02835257.pdf (accessed on 14 May 2026).
  93. Jowitt, S.M. COVID-19 and the Global Mining Industry. SEG Discov. 2020, 122, 33–41. [Google Scholar] [CrossRef]
  94. Perks, R.; Schneck, N. COVID-19 in artisanal and small-scale mining communities: Preliminary results from a global rapid data collection exercise. Environ. Sci. Policy 2021, 121, 37–41. [Google Scholar] [CrossRef] [PubMed]
  95. Giese, E.C. Strategic minerals: Global challenges post-COVID-19. Extr. Ind. Soc. 2022, 12, 101113. [Google Scholar] [CrossRef]
  96. Argus Media. Australia’s Lynas Produces Less Rare Earth in FY2023-24. 2024. Available online: https://www.argusmedia.com/en/news-and-insights/latest-market-news/2602311-australia-s-lynas-produces-less-rare-earth-in-fy2023-24 (accessed on 23 December 2025).
  97. Streit, S.; Passarella, M.; Tost, M. The influence of environmental policies on mineral permitting in Europe: Challenges and insights from Spain and Sweden. Extr. Ind. Soc. 2025, 24, 101727. [Google Scholar] [CrossRef]
  98. Cooney, J. Reflections on the 20th anniversary of the term ‘social licence’. J. Energy Nat. Resour. Law 2017, 35, 197–200. [Google Scholar] [CrossRef]
  99. European commission Directorate-General for Environment. Natura 2000: Largest Network of Protected Areas in the World. Available online: https://environment.ec.europa.eu/topics/nature-and-biodiversity/natura-2000_en (accessed on 28 December 2025).
  100. European Commission Directorate-General for Environment. Water Framework Directive. 2025. Available online: https://environment.ec.europa.eu/topics/water/water-framework-directive_en (accessed on 28 December 2025).
  101. Statistics Sweden. Formally Protected Nature in Sweden. 2025. Available online: https://www.scb.se/en/finding-statistics/statistics-by-subject-area/housing-construction-and-building/land-use/protected-nature/pong/tables-and-graphs/formally-protected-nature-in-sweden-31122024/ (accessed on 24 February 2026).
  102. BMUKN. Natura 2000. 2025. Available online: https://www.bundesumweltministerium.de/themen/naturschutz/gebietsschutz-und-vernetzung/natura-2000/schutzgebietsnetz-natura-2000 (accessed on 24 February 2026).
  103. Leading Edge Materials. Projects Norra Karr HREE. 2026. Available online: https://www.leadingedgematerials.com/projects (accessed on 14 March 2026).
  104. Sandström, P. A Toolbox for Co-Production of Knowledge and Improved Land Use Dialogues: The Perspective of Reindeer Husbandry. Umea, Sweden, 2015; p. 80. Available online: https://pub.epsilon.slu.se/11881/1/sandstrom_p_150213.pdf (accessed on 14 May 2026).
  105. Hilgers, C. Rohstoffbedarf, Energie und Klima. In Handbuch Rohstoffwirtschaft; Frenz, W., Ed.; Erich Schmidt Verlag: Berlin, Germany, 2025; pp. 55–110. [Google Scholar]
  106. Duchâtel, M. Resilience, Not Decoupling: Critical Supply Chains in China-Japan Relations. 2020. Available online: https://www.institutmontaigne.org/en/expressions/resilience-not-decoupling-critical-supply-chains-china-japan-relations (accessed on 12 January 2025).
  107. UN Comtrade Database. Trade Data—HS: 2846, Reporters: Japan, Partners: All, Periods: 2010, Trade Flows: Import. 2025. Available online: https://comtradeplus.un.org/TradeFlow?Frequency=A&Flows=M&CommodityCodes=2846&Partners=all&Reporters=392&period=2010&AggregateBy=none&BreakdownMode=plus (accessed on 27 June 2025).
  108. JOGMEC. Sojitz and JOGMEC Enter into Definitive Agreements with Lynas Including Availability Agreement to Secure Supply of Rare Earths Products to Japanese Market. 2011. Available online: https://www.jogmec.go.jp/english/news/release/release0069.html (accessed on 29 January 2025).
  109. UN Comtrade Database. Trade Data—HS: 2846, Reporters: Japan, Partners: All, Periods: Recent Periods, Trade Flows: Import. 2025. Available online: https://comtradeplus.un.org/TradeFlow?Frequency=A&Flows=M&CommodityCodes=2846&Partners=all&Reporters=392&period=recent&AggregateBy=none&BreakdownMode=plus (accessed on 27 June 2025).
  110. UN Comtrade Database. Trade Data—HS: 2846, Reporters: Japan, Partners: All, Periods: 2013, 2012, 2011, 2010, 2009, 2008, 2007, 2006, 2005, 2004, 2003, Trade Flows: Import. 2025. Available online: https://comtradeplus.un.org/TradeFlow?Frequency=A&Flows=M&CommodityCodes=2846&Partners=all&Reporters=392&period=2012&AggregateBy=none&BreakdownMode=plus (accessed on 27 June 2025).
  111. UN Comtrade Database. Trade Data—HS: 280530, Reporters: Japan, Partners: All, Periods: Recent Periods, Trade Flows: Import. 2025. Available online: https://comtradeplus.un.org/TradeFlow?Frequency=A&Flows=M&CommodityCodes=280530&Partners=all&Reporters=392&period=recent&AggregateBy=none&BreakdownMode=plus (accessed on 27 June 2025).
  112. UN Comtrade Database. Trade Data—HS: 280530, Reporters: Japan, Partners: All, Periods: 2013, 2012, 2011, 2010, 2009, 2008, 2007, 2006, 2005, 2004, 2003, Trade Flows: Import. 2025. Available online: https://comtradeplus.un.org/TradeFlow?Frequency=A&Flows=M&CommodityCodes=280530&Partners=all&Reporters=392&period=2012&AggregateBy=none&BreakdownMode=plus (accessed on 27 June 2025).
  113. Lynas Rare Earths. About Lynas Rare Earths. 2025. Available online: https://lynasrareearths.com/about-us/about-lynas-rare-earths/ (accessed on 14 January 2025).
  114. JOGMEC. JARE Supports Lynas’ Development with Additional Equity Investment. 2022. Available online: https://www.jogmec.go.jp/english/news/release/news_10_00010.html (accessed on 28 January 2025).
  115. Jain, E.; Obayashi, Y. Lynas Gets $134 Million Funding from Japan to Boost Output. 2023. Available online: https://www.mining.com/web/lynas-gets-134-million-funding-from-japan-to-boost-output/ (accessed on 12 January 2025).
  116. Sojitz. Securing Supply of Heavy Rare Earths to Japan with Additional Investment to Lynas. 2023. Available online: https://www.sojitz.com/en/news/article/20230307.html (accessed on 28 January 2025).
  117. Lynas Rare Earths. Lynas Achieves First Separated Heavy Rare Earths Production. 2025. Available online: https://wcsecure.weblink.com.au/pdf/LYC/02947190.pdf (accessed on 12 May 2026).
  118. Manalo, P. Average Lead Time Almost 18 Years for Mines Started in 2020–2023. 2024. Available online: https://www.spglobal.com/market-intelligence/en/news-insights/research/average-lead-time-almost-18-years-for-mines-started-in-2020-23 (accessed on 16 June 2025).
  119. Park, S.; Tracy, C.L.; Ewing, R.C. Reimagining US rare earth production: Domestic failures and the decline of US rare earth production dominance—Lessons learned and recommendations. Resour. Policy 2023, 85, 104022. [Google Scholar] [CrossRef]
  120. Mat Suli, L.; Ibrahim, W.; Abdul Aziz, B.; Deraman, M.R.; Ismail, N. A Review of Rare Earth Mineral Processing Technology. Chem. Eng. Res. Bull. 2017, 19, 20. [Google Scholar] [CrossRef]
  121. Bradsher, K. China Tightens Its Hold on Minerals Needed to Make Computer Chips. The New York Times. 2024. Available online: https://www.nytimes.com/2024/10/26/business/china-critical-minerals-semiconductors.html (accessed on 26 January 2025).
Figure 1. Monte Carlo simulation for the (a) uniform distribution low demand, (b) uniform distribution high demand, (c) uniform distribution total EU demand, (d) Gaussian distribution low demand, (e) Gaussian distribution high demand, (f) Gaussian distribution total EU demand. The orange line represents 100% of projected REE demand, the purple line represents 10% of the projected REE demand, and the black line represents the median of the Monte Carlo simulation values of the projected production. All values are within the 90% confidence interval. For low-demand and high-demand scenarios, data is based on [27]; for the total EU demand scenario, data is based on [26].
Resources 15 00073 g001
Figure 2. Monte Carlo simulation with a nine-year lead time for the (a) uniform distribution low demand, (b) uniform distribution high demand, (c) uniform distribution total EU demand, (d) Gaussian distribution low demand, (e) Gaussian distribution high demand, (f) Gaussian distribution total EU demand. The orange line represents 100% of projected REE demand, the purple line represents 10% of the projected REE demand, and the black line represents the median of the Monte Carlo simulation values of the projected production. All values are within the 90% confidence interval. For low-demand and high-demand scenarios, data is based on [27]; for the total EU demand scenario, data is based on [26].
Resources 15 00073 g002
Figure 3. Lynas Rare Earth’s target production (red line) and annual production (black line) between years 2018–2025. Data compiled from [64,86,87,88,89,90,91].
Resources 15 00073 g003
Figure 4. Japan’s REE imports from China decreased between 2003 and 2024 due to Japan’s strategy to diversify (black line). The percentage of China’s share of Japan’s total imports also decreased (red line). A decline in imports from China is observed after the 2011 rare earth crisis. Japan’s dependency on China decreased to approximately 60% by 2023 (data combined for HS codes 2846 and 280530). Data compiled from [109,110,111,112].
Resources 15 00073 g004
Table 1. Overview of naturally occurring rare earth elements and their oxides, element-to-oxide conversion factor, oxide-to-element conversion factor, and examples of industrial utilization. Oxide- to-element conversion factor is calculated according to Equation (1) after [42,43,44].
Element (REE)Oxide (REO)Element-to-Oxide Conversion FactorOxide-to-Element Conversion FactorExamples of Utilization
Cerium CeCe2O31.1710.853Polishing powders, catalysts, ceramics
DysprosiumDyDy2O31.1480.871Lasers, permanent magnets, alloys, ceramics, phosphors
GadoliniumGdGd2O31.1530.868Alloys, medical devices, superconductors, fuel cells 
NeodymiumNdNd2O31.1660.857Permanent magnets, medical devices, lasers, and catalysts
PraseodymiumPrPr2O31.1700.854Permanent magnets, alloys, catalysts, pigments
ScandiumScSc2O31.5330.652Al-Sc alloys
TerbiumTbTb2O31.1510.868Permanent magnets, lasers, alloys, phosphors
ErbiumErEr2O31.1430.874Lasers, steel alloys, fiber optics, pigments
EuropiumEuEu2O31.1580.864Phosphors and lighting, medical devices, lasers
HolmiumHoHo2O31.1450.873Lasers, ceramics, pigments
LanthanumLaLa2O31.1730.853Glass, hydrogen storage, catalysts, phosphors, pigments
LutetiumLuLu2O31.1370.880Catalysts, LED light
SamariumSmSm2O31.1590.862Magnets, lasers
ThuliumTmTm2O31.1420.875Lasers, X-ray machines 
YttriumYY2O31.2690.787Lasers, superconductors, fuel cells, glass, phosphors
YtterbiumYbYb2O31.1380.878Lasers, alloys
Table 2. The geological exploration stages and their resource and reserve categories and accuracy range after PERC. Data compiled from [46].
ItemScoping StudyPre-Feasibility StudyFeasibility Study
Resource CategoriesMostly InferredMostly IndicatedMeasured and Indicated
Reserve CategoriesNoneMostly ProbableProved and Probable
Accuracy Range (Order of Magnitude)±25–50%±15–25%±10–15%
Table 3. Projected individual REEs for the EU in the low-demand scenario (LDS) and high-demand scenario (HDS). Values are given in tons per annum (t/a). Numbers are rounded. The demand value for Dy in the LDS is 124.51 t/a, but in the HDS, given as 125.51 t/a in the cited document, we assumed that the demand is identical and thus used 124.51 t/a. Data compiled from [27].
REEScenarioUnit202020302050
Ce LDSt/a10.018.620
DyLDSt/a124.51202.66170.31
GdLDSt/a1.461.210
NdLDSt/a1102.642550.202583
PrLDSt/a123.65162.5562.53
TbLDSt/a23.1234.5116.18
TotalLDSt/a1385.402959.762832.01
CeHDSt/a10.0112.240
DyHDSt/a124.51713.11916.49
GdHDSt/a1.461.760
NdHDSt/a1102.645448.706896
PrHDSt/a123.65445.97510.33
TbHDSt/a23.1292.85104.77
TotalHDSt/a1386.406714.628427.58
Table 4. The projected annual TREO production from [45] is 5340 t. Tonnes per annum is given as t/a. Projected projection of individual REE calculated through Equation (2). Numbers are rounded. The value is reported as 5340 t in the original report; however, a recalculation yields 5329 t, which may be due to rounding differences in the decimal values in the original data. Data compiled from [45].
REOIndividual Proportion of REOs Projected Production Individual REO (t/a)Projected Production Individual REE (t/a) Using Equation (2)
Nd 0.11587503
Dy0.05267233
Pr0.03160137
Tb0.0073732
Ce0.211121957
Gd0.03160139
Er0.034182159
Eu0.0042118
Ho0.015347
La0.1534455
Lu0.0052723
Sm0.03160138
Tm0.0052723
Y0.3418161430
Yb0.033176155
Total0.9985329 (Report: 5340)4450
Disclaimer/Publisher’s Note: The statements, opinions and data contained in all publications are solely those of the individual author(s) and contributor(s) and not of MDPI and/or the editor(s). MDPI and/or the editor(s) disclaim responsibility for any injury to people or property resulting from any ideas, methods, instructions or products referred to in the content.