1. Introduction
Forest ecosystems in Sub-Saharan Africa (SSA) face unprecedented pressures from agricultural expansion, population growth, and economic development. Mozambique, with approximately 40 million hectares of natural forests, representing 51% of its territory [
1], exemplifies this challenge. The country lost approximately 4.6 million hectares of forest between 2001 and 2024, corresponding to an average annual deforestation rate of 0.58% [
2,
3]. Concurrently, Mozambique experienced notable economic growth, with GDP per capita increasing by 90.5% during the same period [
4]. This coexistence of rapid deforestation and economic expansion raises a fundamental question: what is the nature of the temporal relationship between agricultural land-use change and economic development?
Theoretical frameworks offer contrasting perspectives on this relationship. The Environmental Kuznets Curve (EKC) hypothesis, originally proposed for pollution [
5] and later adapted to deforestation [
6,
7], postulates an inverted U-shaped relationship between environmental degradation and per capita income. Empirical assessments of the EKC in the context of deforestation have been conducted predominantly using cross-country and panel-data approaches, which allow for greater statistical power and control for structural heterogeneity across countries and regions [
6,
7]. According to this framework, early-stage economic development accelerates forest conversion as agriculture expands to feed growing populations and generate export revenues. However, as economies mature and structural transformation progresses—shifting from agriculture to industry and services—deforestation decelerates and eventually reverses through forest transition [
8,
9]. Historical evidence from developed countries supports this pattern, with inflection points typically occurring at GDP per capita levels of USD 3000–5000 (2010 constant prices), when agriculture represents less than 15% of GDP and urbanization exceeds 50% [
7,
10,
11].
However, African contexts present distinct characteristics that challenge the universality of these patterns. Unlike Latin America and Southeast Asia, where commercial agriculture dominates forest conversion [
12,
13], smallholder subsistence agriculture constitutes the primary deforestation driver in SSA, generating substantially lower economic value per hectare converted [
14,
15]. Additionally, agricultural productivity in SSA remains critically low—cereals average 1.2–1.5 tons per hectare, representing only 20–30% of Asian yields [
16]—perpetuating reliance on extensive land expansion rather than intensification. Institutional weaknesses further distinguish African trajectories: 85–95% of agricultural land operates under customary tenure without formal titles [
17], discouraging long-term investments in soil improvement and sustainable land management practices that have characterized agricultural intensification elsewhere [
18,
19].
Mozambique’s recent trajectory adds complexity to this landscape. Between 2001 and 2024, the country underwent partial structural transformation, with agriculture declining from 29% to 26% of GDP while services expanded from 42% to 50% [
4]. However, this transformation exhibited a dual character: growth concentrated in capital-intensive extractive sectors (coal, natural gas, aluminum) and urban services that generated limited rural employment [
20,
21]. The agricultural sector expanded cultivated area by 116.4% but experienced a 25.3% decline in average productivity, contradicting Boserup’s [
22] prediction that population pressure induces agricultural intensification. Moreover, despite successive government programs promoting agricultural intensification—PEDSA (2010–2019), PNISA (2013–2017), and SUSTENTA (2020–present)—the extensive expansion pattern persisted [
23,
24].
Existing research on Mozambican forest dynamics has primarily focused on quantifying deforestation rates and identifying proximate drivers [
25,
26,
27], but systematic analysis of temporal patterns linking agricultural expansion, economic growth, and forest cover change over extended periods remains scarce. Ribeiro et al. [
27] documented that deforestation in Zambézia province (2000–2009) showed no significant association with local welfare improvements, suggesting that forest conversion may not translate into development benefits. Ryan et al. [
26] identified that 60% of deforestation in Manica province resulted from subsistence agriculture, with newly cleared areas exhibiting 40% lower productivity than established agricultural land. However, these studies covered relatively short periods (5–10 years) and provincial scales, proving insufficient for detecting structural changes predicted by forest transition theory, which typically unfold over 20–40 years [
9,
28].
The aim of this paper is to analyze the temporal relationship between agricultural deforestation and economic growth in Mozambique from 2001 to 2024. The study integrates remote-sensing-derived forest cover data with socioeconomic indicators across three consecutive 8-year sub-periods (2001–2008, 2009–2016, and 2017–2024). Specifically, it examines whether Mozambique exhibits patterns of association or decoupling between forest conversion and economic growth comparable to those observed in other regions during structural transformation processes, or whether dependence on extensive agricultural expansion persists. In addition, the study investigates the paradox of agricultural development in which cultivated area expanded substantially while average productivity declined, contrary to theoretical expectations of land-use intensification under increasing demographic and economic pressure.
2. Materials and Methods
2.1. Study Area Description
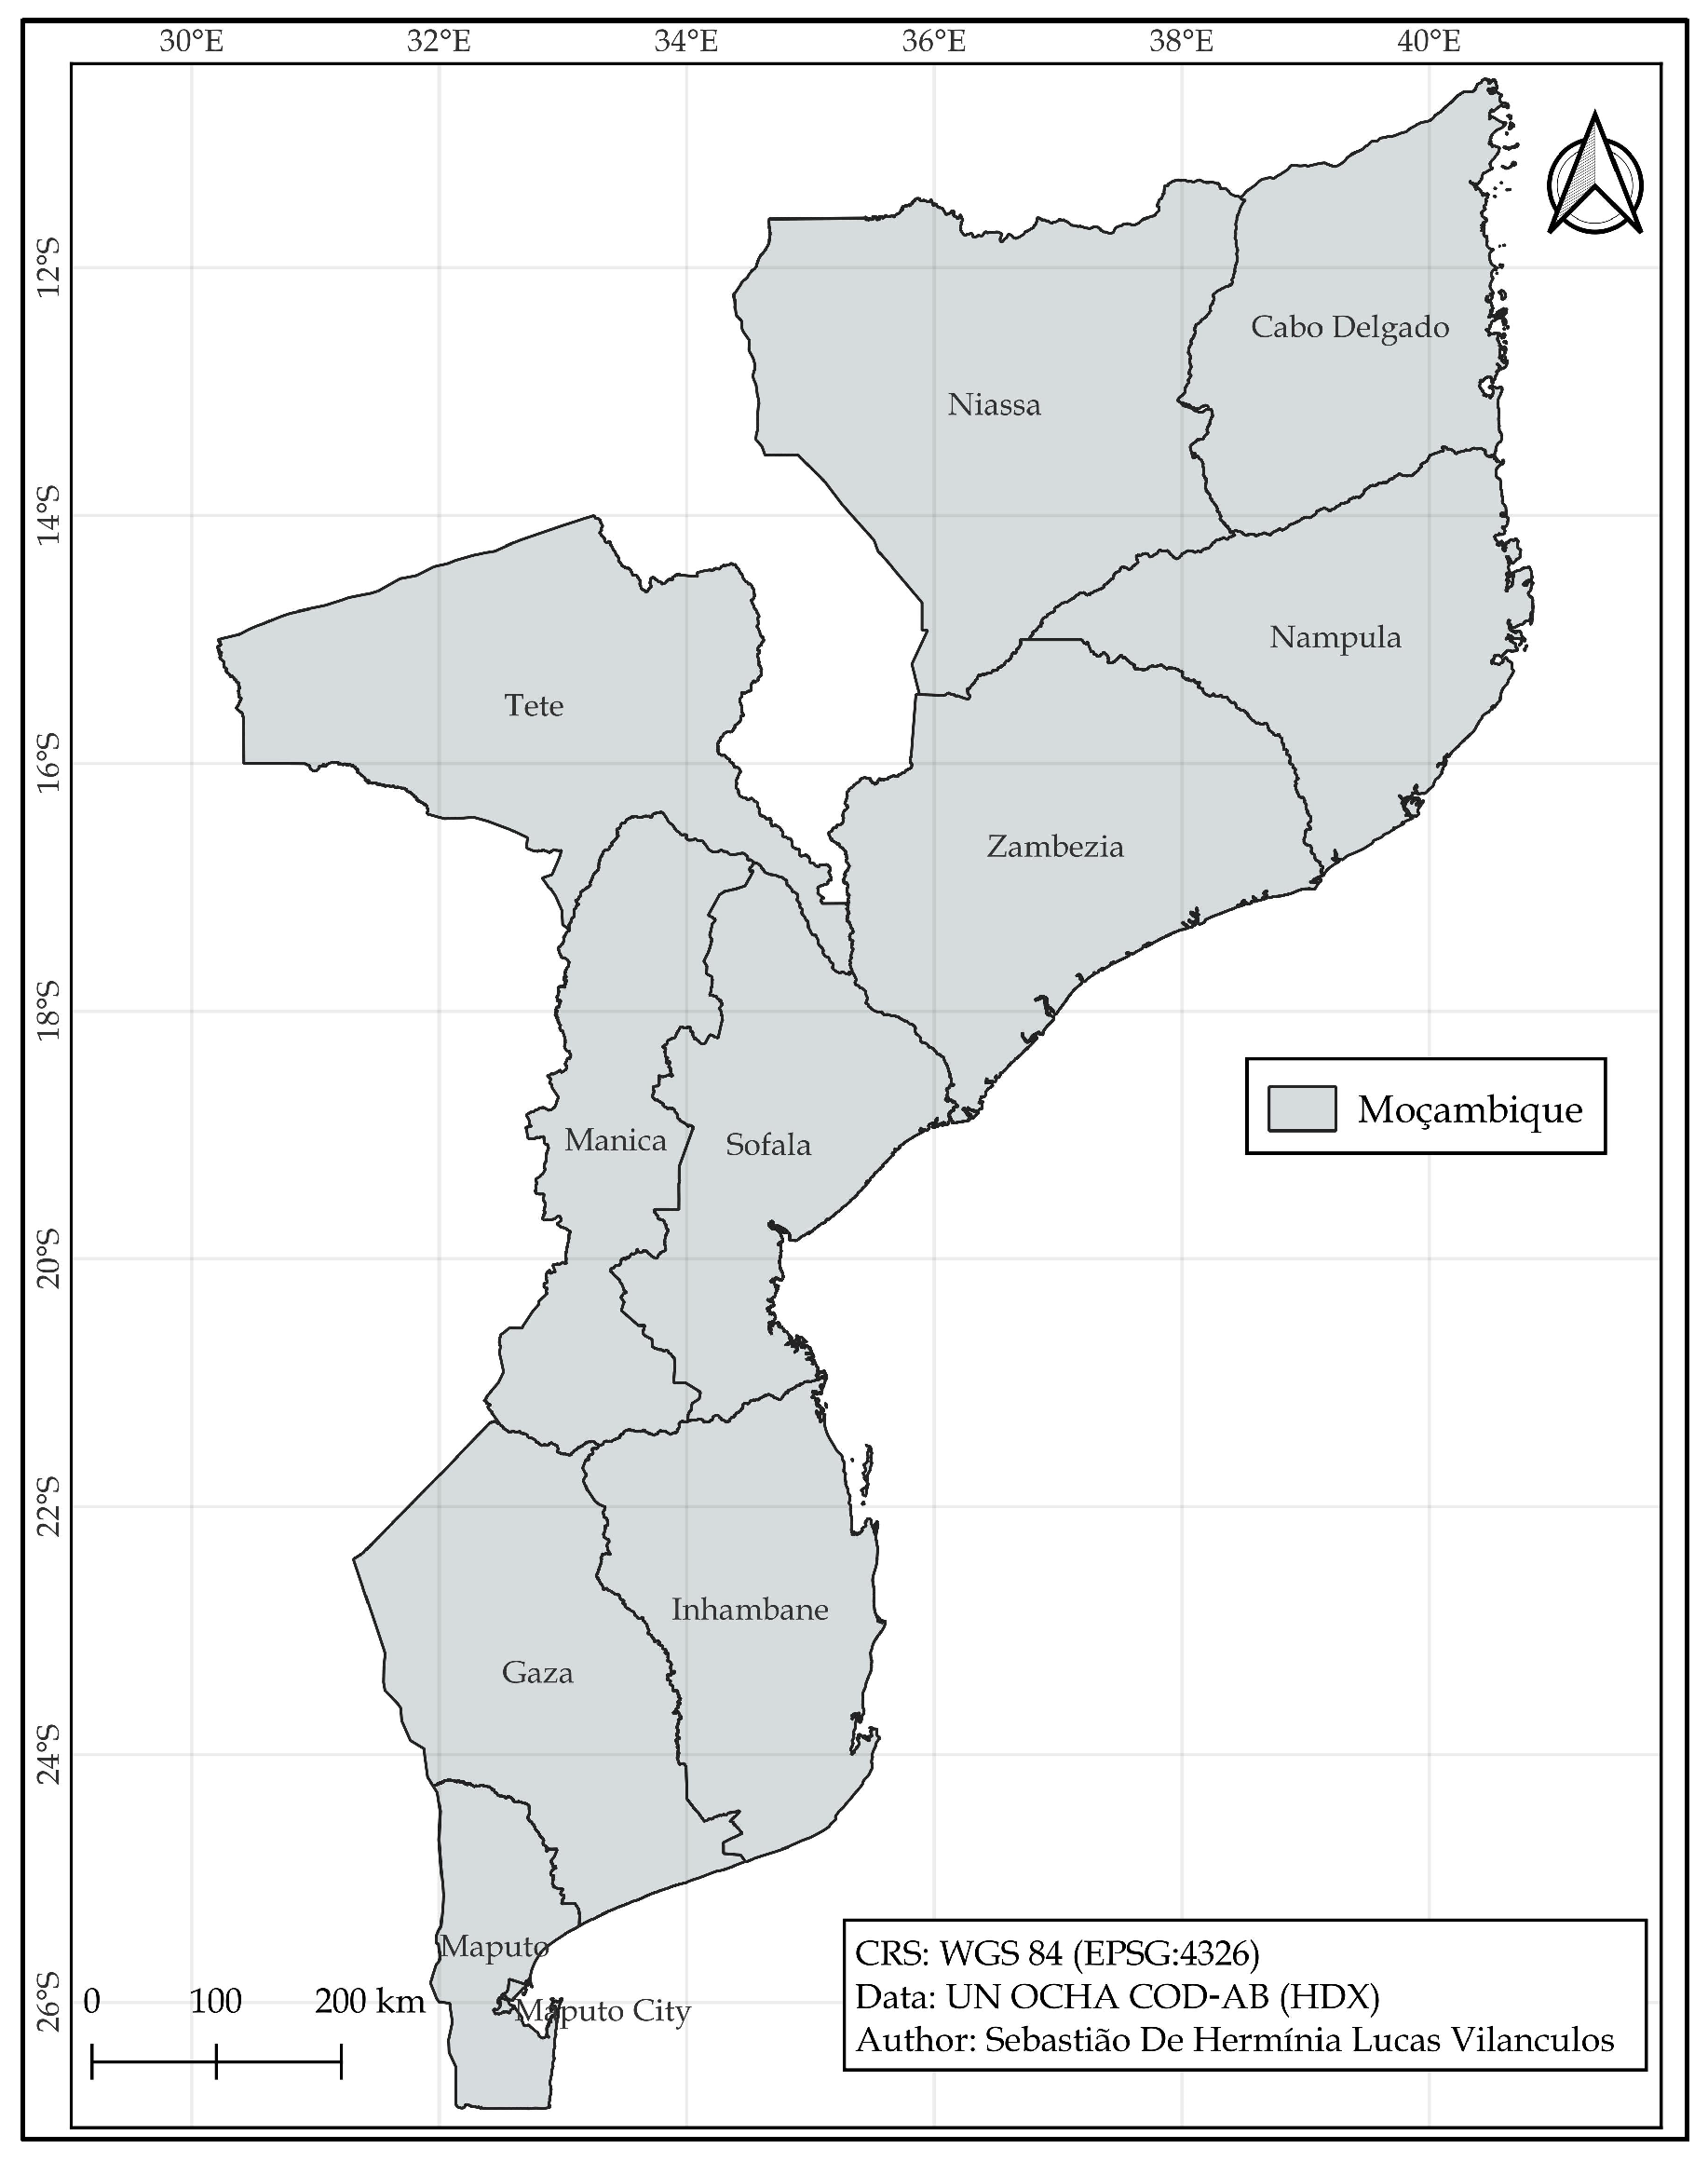
Mozambique is located on the southeastern coast of Africa, between latitudes 10°27′ S–26°52′ S and longitudes 30°12′ E–40°51′ E, covering a total area of 799,380 km
2 [
4] (
Figure 1). The country borders Tanzania to the north, Malawi and Zambia to the northwest, Zimbabwe to the west, South Africa and Eswatini to the southwest, and the Indian Ocean to the east, with a coastline of approximately 2700 km.
The climate is predominantly tropical, characterized by a wet season (November–April) and a dry season (May–October), with mean annual precipitation varying from 300 mm in the southern interior to 2000 mm in the central highlands [
29,
30].
Vegetation is distributed across five main zones: coastal forest (3% of territory), Mi-ombo woodland savanna (65%), mixed Mopane savanna (15%), montane forest (2%), and riparian vegetation (15%) [
31]. Miombo woodland, dominated by
Brachystegia,
Julbernardia, and
Isoberlinia genera, constitutes the predominant ecosystem, covering approximately 26 million hectares and sustaining 60% of the rural population through ecosystem services including timber, fuelwood, wild foods, and grazing [
27,
32].
Mozambique’s population is approximately 33 million inhabitants with a growth rate of 2.5% per year, characterized by high rurality (64% rural) and regional heterogeneity: population density varies from 5.1 inhabitants/km
2 in Niassa to 138.5 inhabitants/km
2 in Maputo City [
33]. The economic structure is fundamentally based on the primary sector, which employs 70% of the economically active population and contributes approximately 26% of GDP [
33]. A GDP per capita of USD 604 in 2024 places Mozambique among low-income countries, with 65% of the population living below the poverty line [
4].
The agricultural system is characterized by structural dualism between subsistence family farming and emerging commercial agriculture. Family farming—practiced in 95% of farms and in plots averaging 1.6 hectares—uses traditional technologies with low modern input use: only 4% of farmers use inorganic fertilizers, 8% improved seeds, and 12% have access to agricultural credit [
23]. Commercial agriculture—although representing 5% of farms—accounts for 30% of cultivated area and contributes significantly to export crop production (cotton, tobacco, sugar), geographically concentrated in Manica, Sofala, and Nampula provinces [
34].
Spatial analysis of forest cover was based on the Hansen/UMD Global Forest Change dataset accessed and processed in Google Earth Engine (GEE) for the period 2000–2024 [
2]. A threshold of 30% tree canopy density was used for operational forest definition, consistent with methodological guidelines for tropical regions [
35].
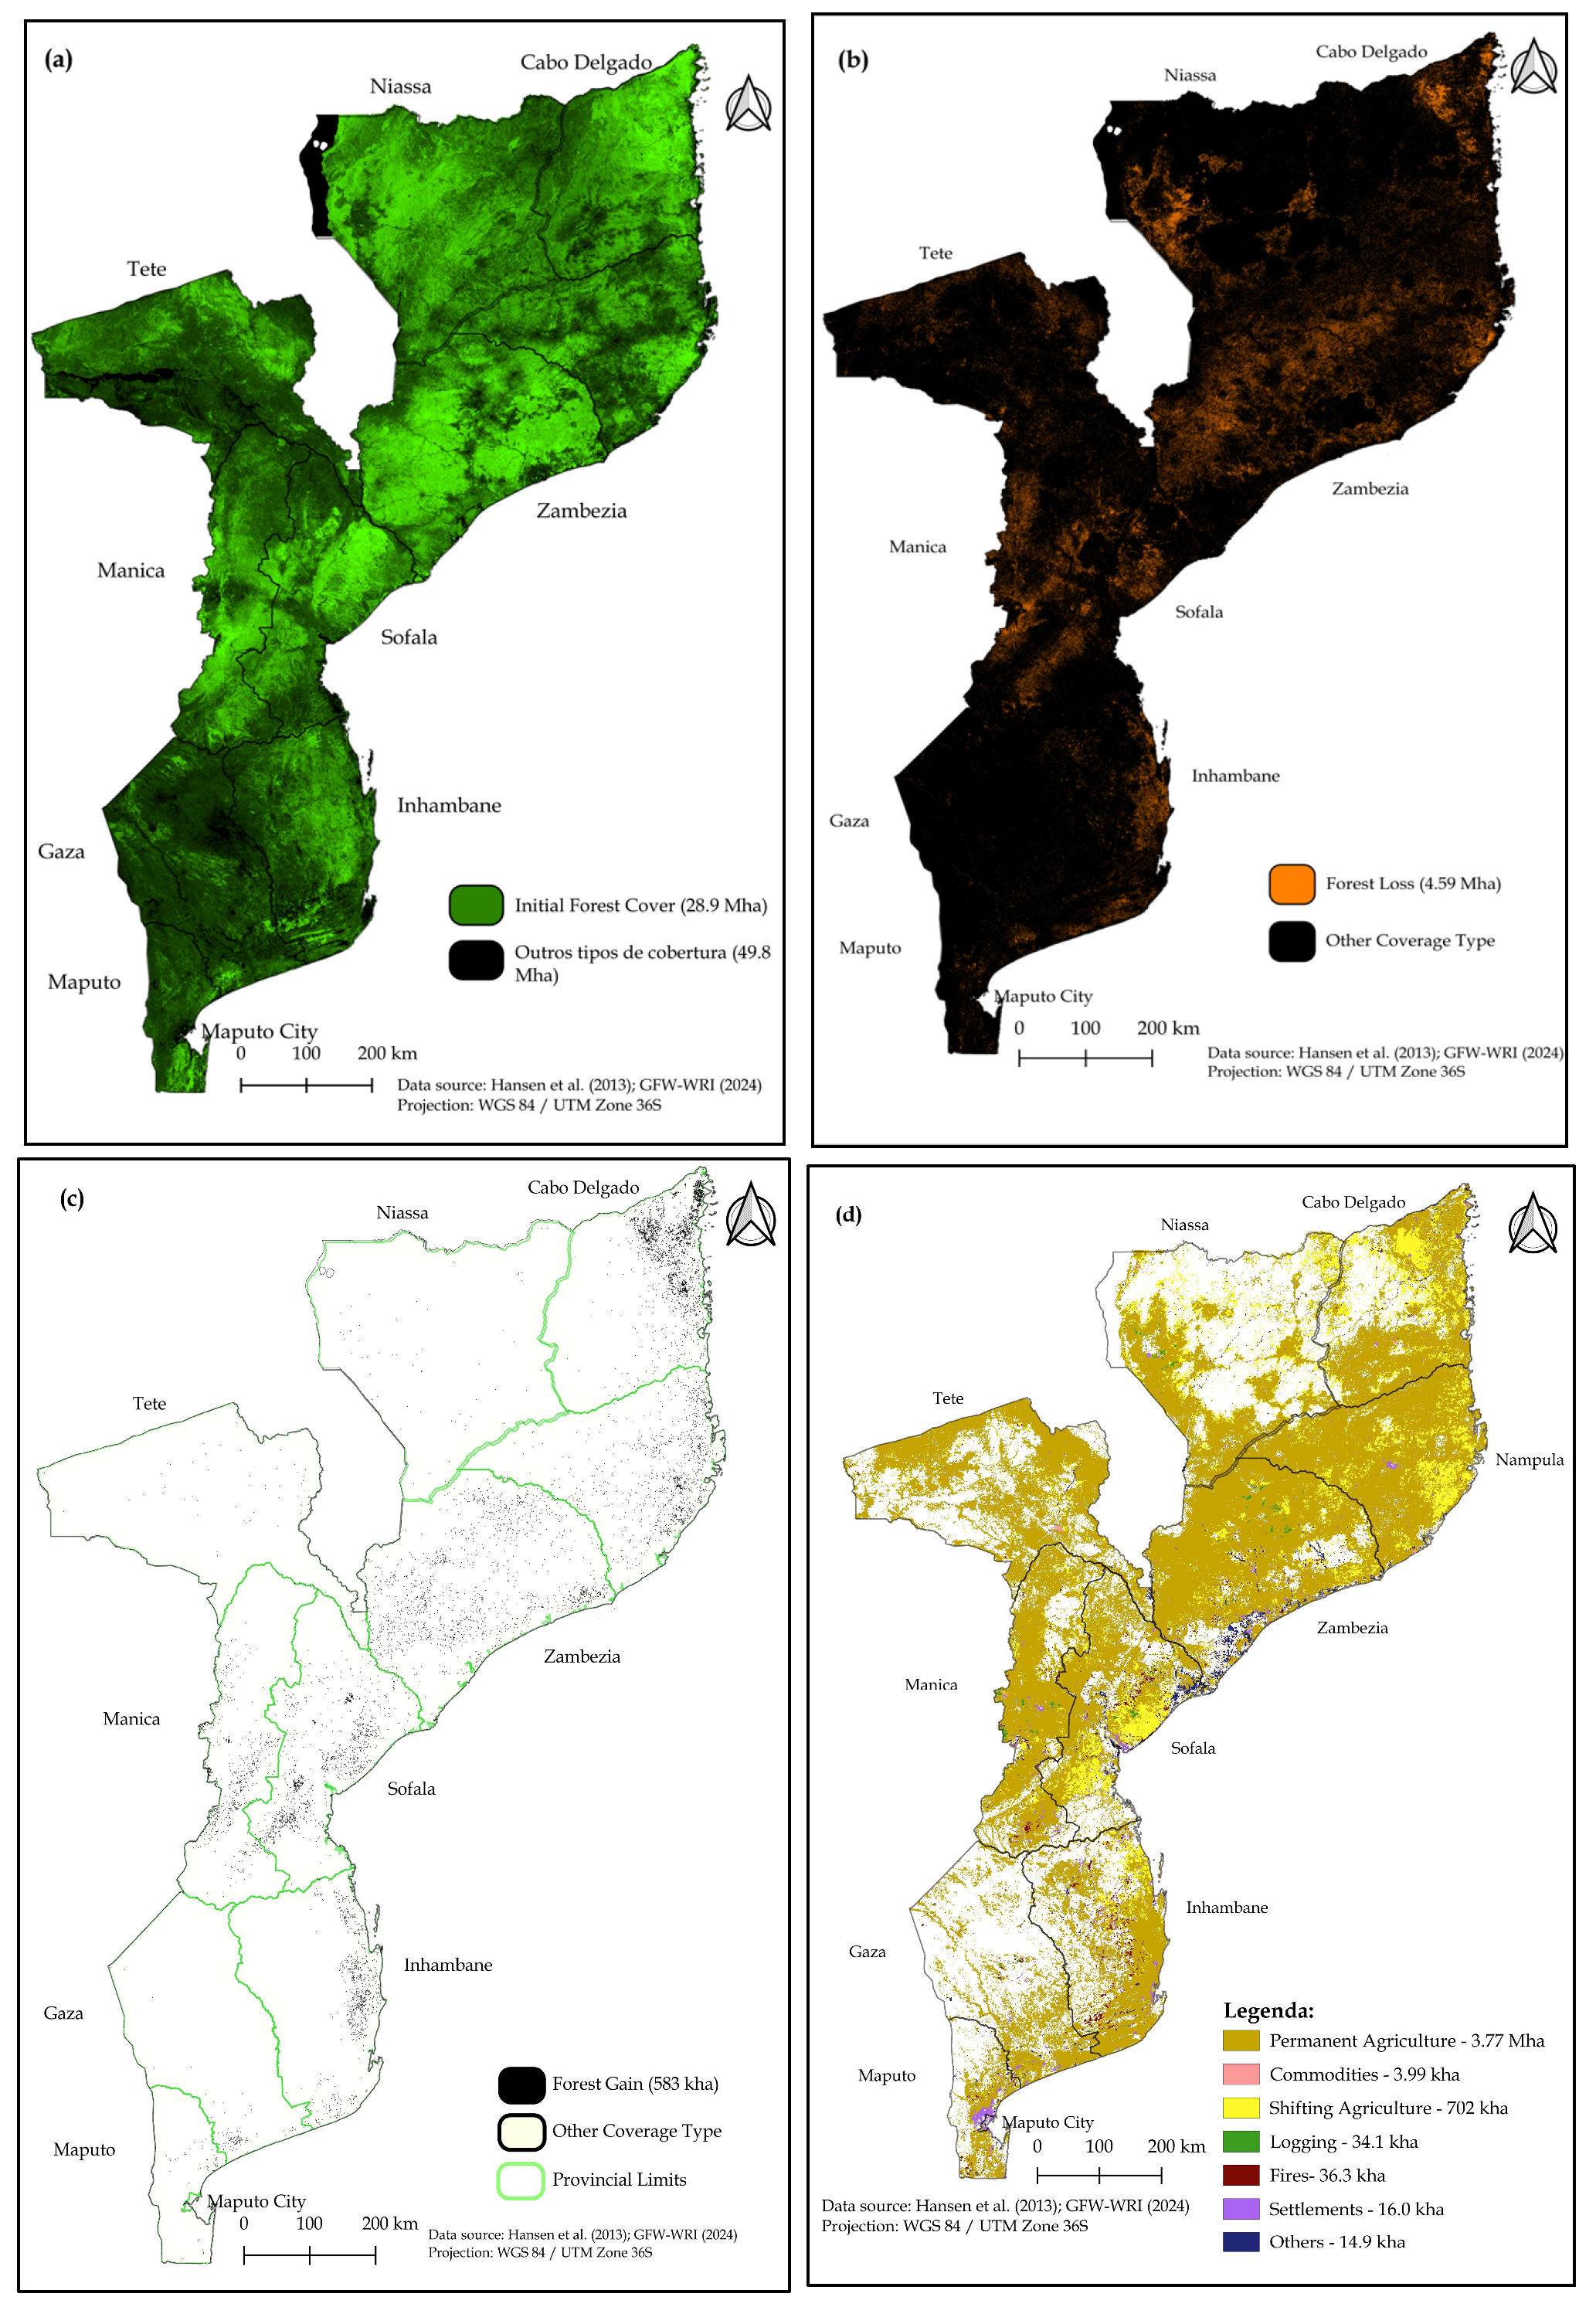
In 2000, Mozambique possessed approximately 28.9 million hectares of forest cover (
Figure 2a). By 2024, a cumulative loss of 4.6 million hectares (15.9% of initial cover) was verified, while forest gain was limited to 583 thousand hectares (2.0% of initial cover), resulting in a net loss of 4.0 million hectares (
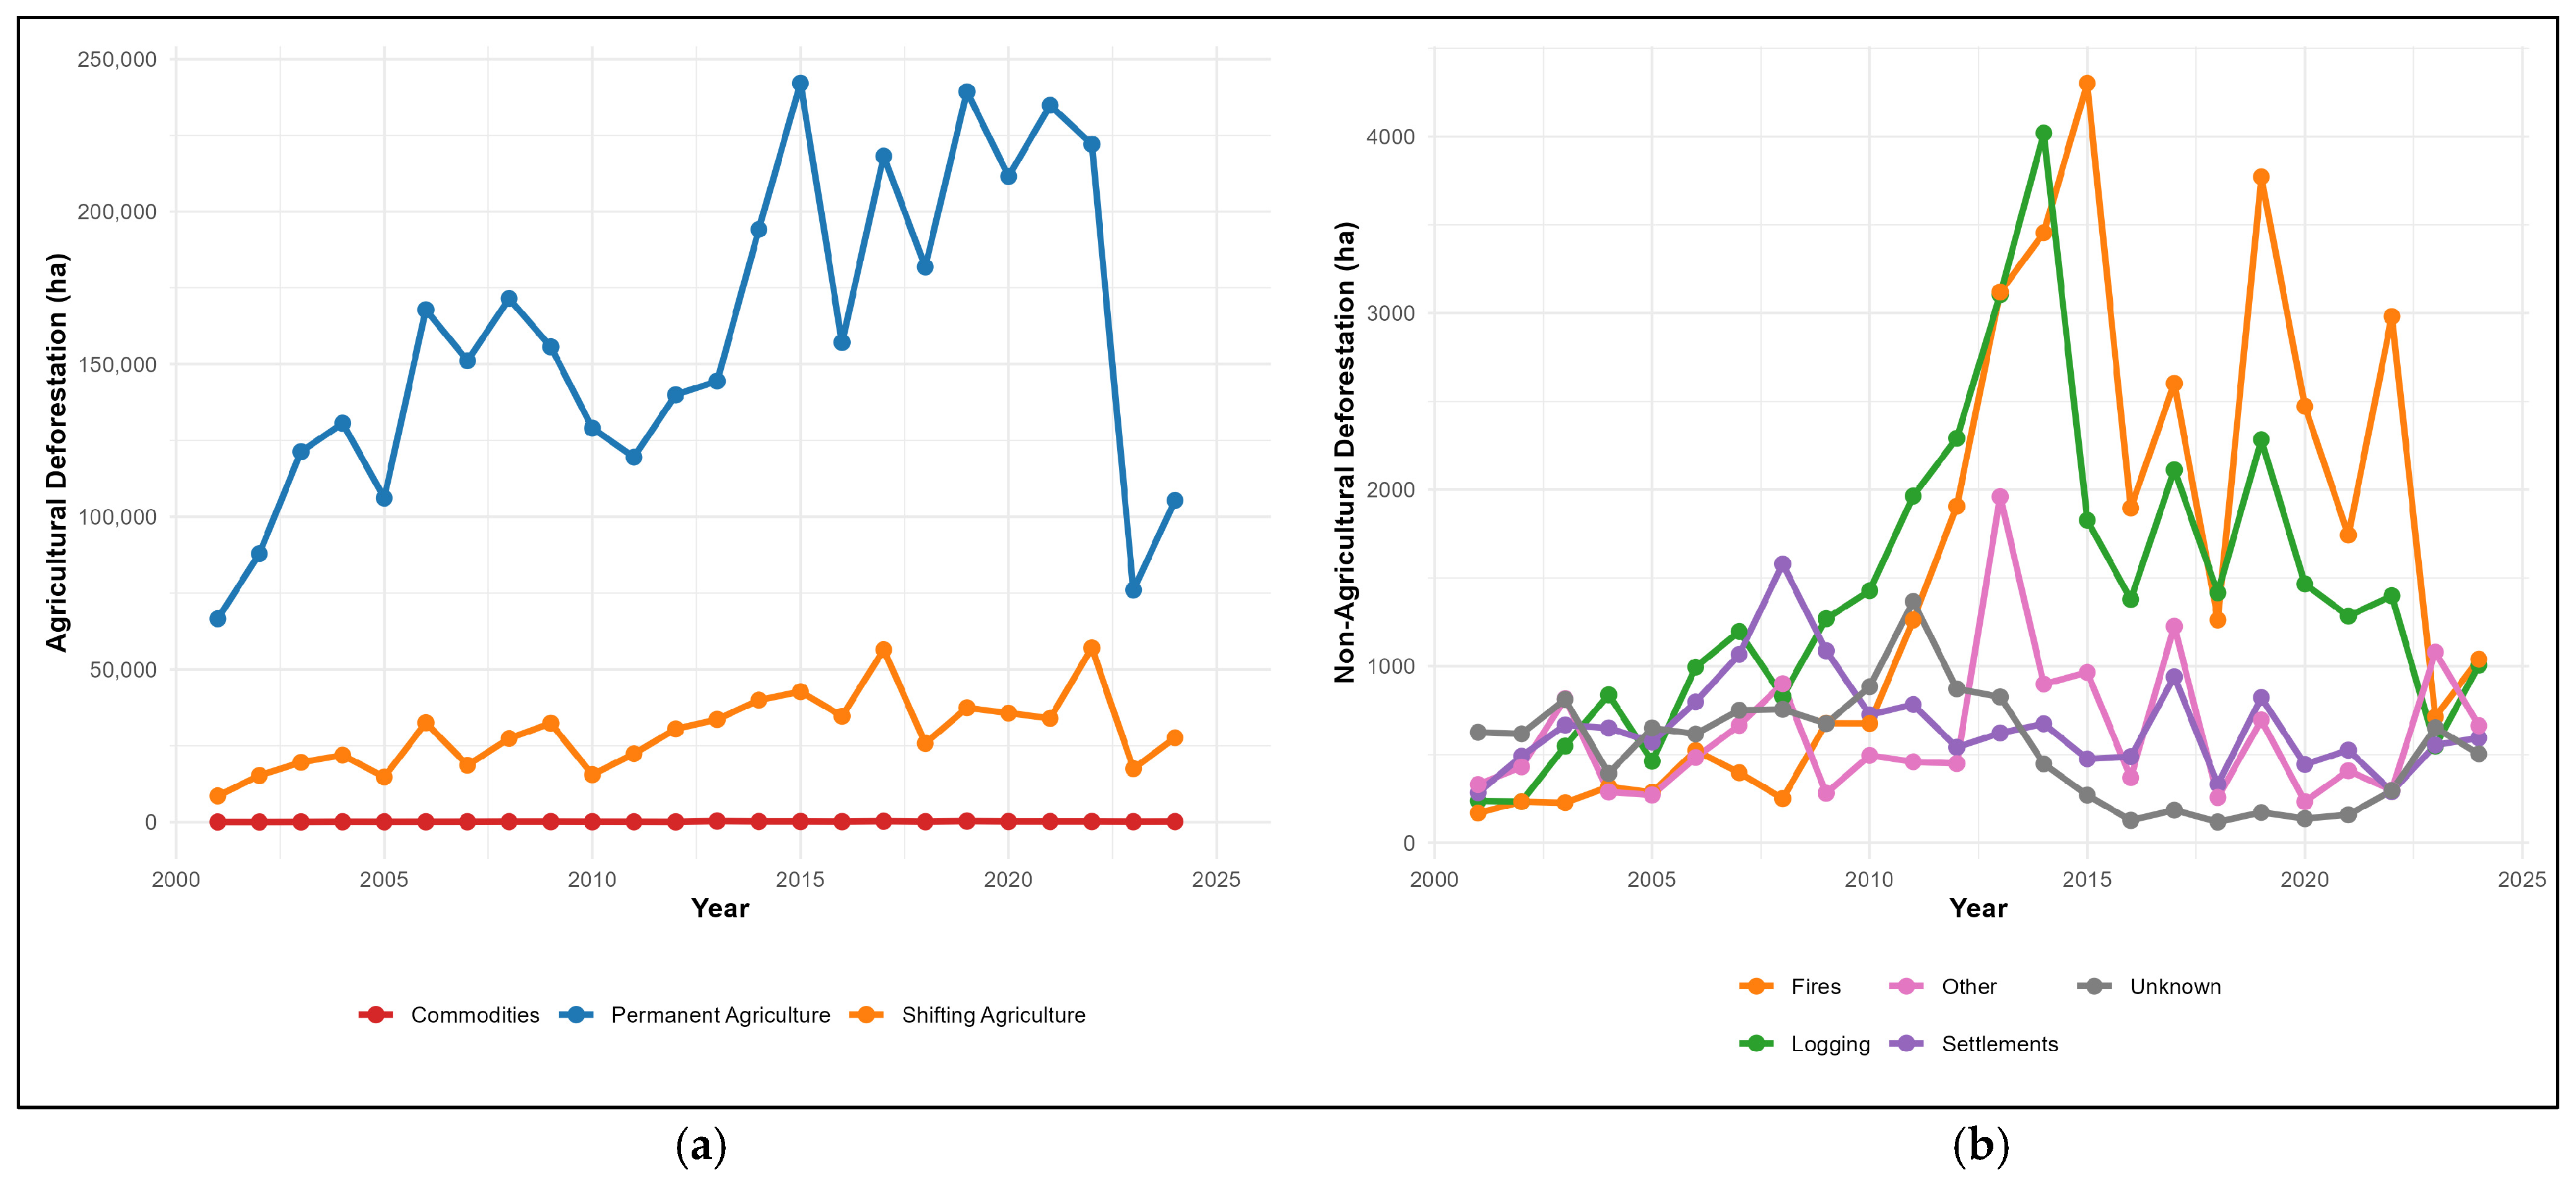
Figure 2b,c). Drivers analysis reveals that agriculture constitutes the main deforestation inductor, responsible for 97.4% of total conversion: permanent agriculture represents 84.5% (3.77 million ha) and shifting agriculture 15.5% (702 thousand ha) (
Figure 2d). Other drivers include logging (1.1%), forest fires (1.3%), and urban settlements (0.4%).
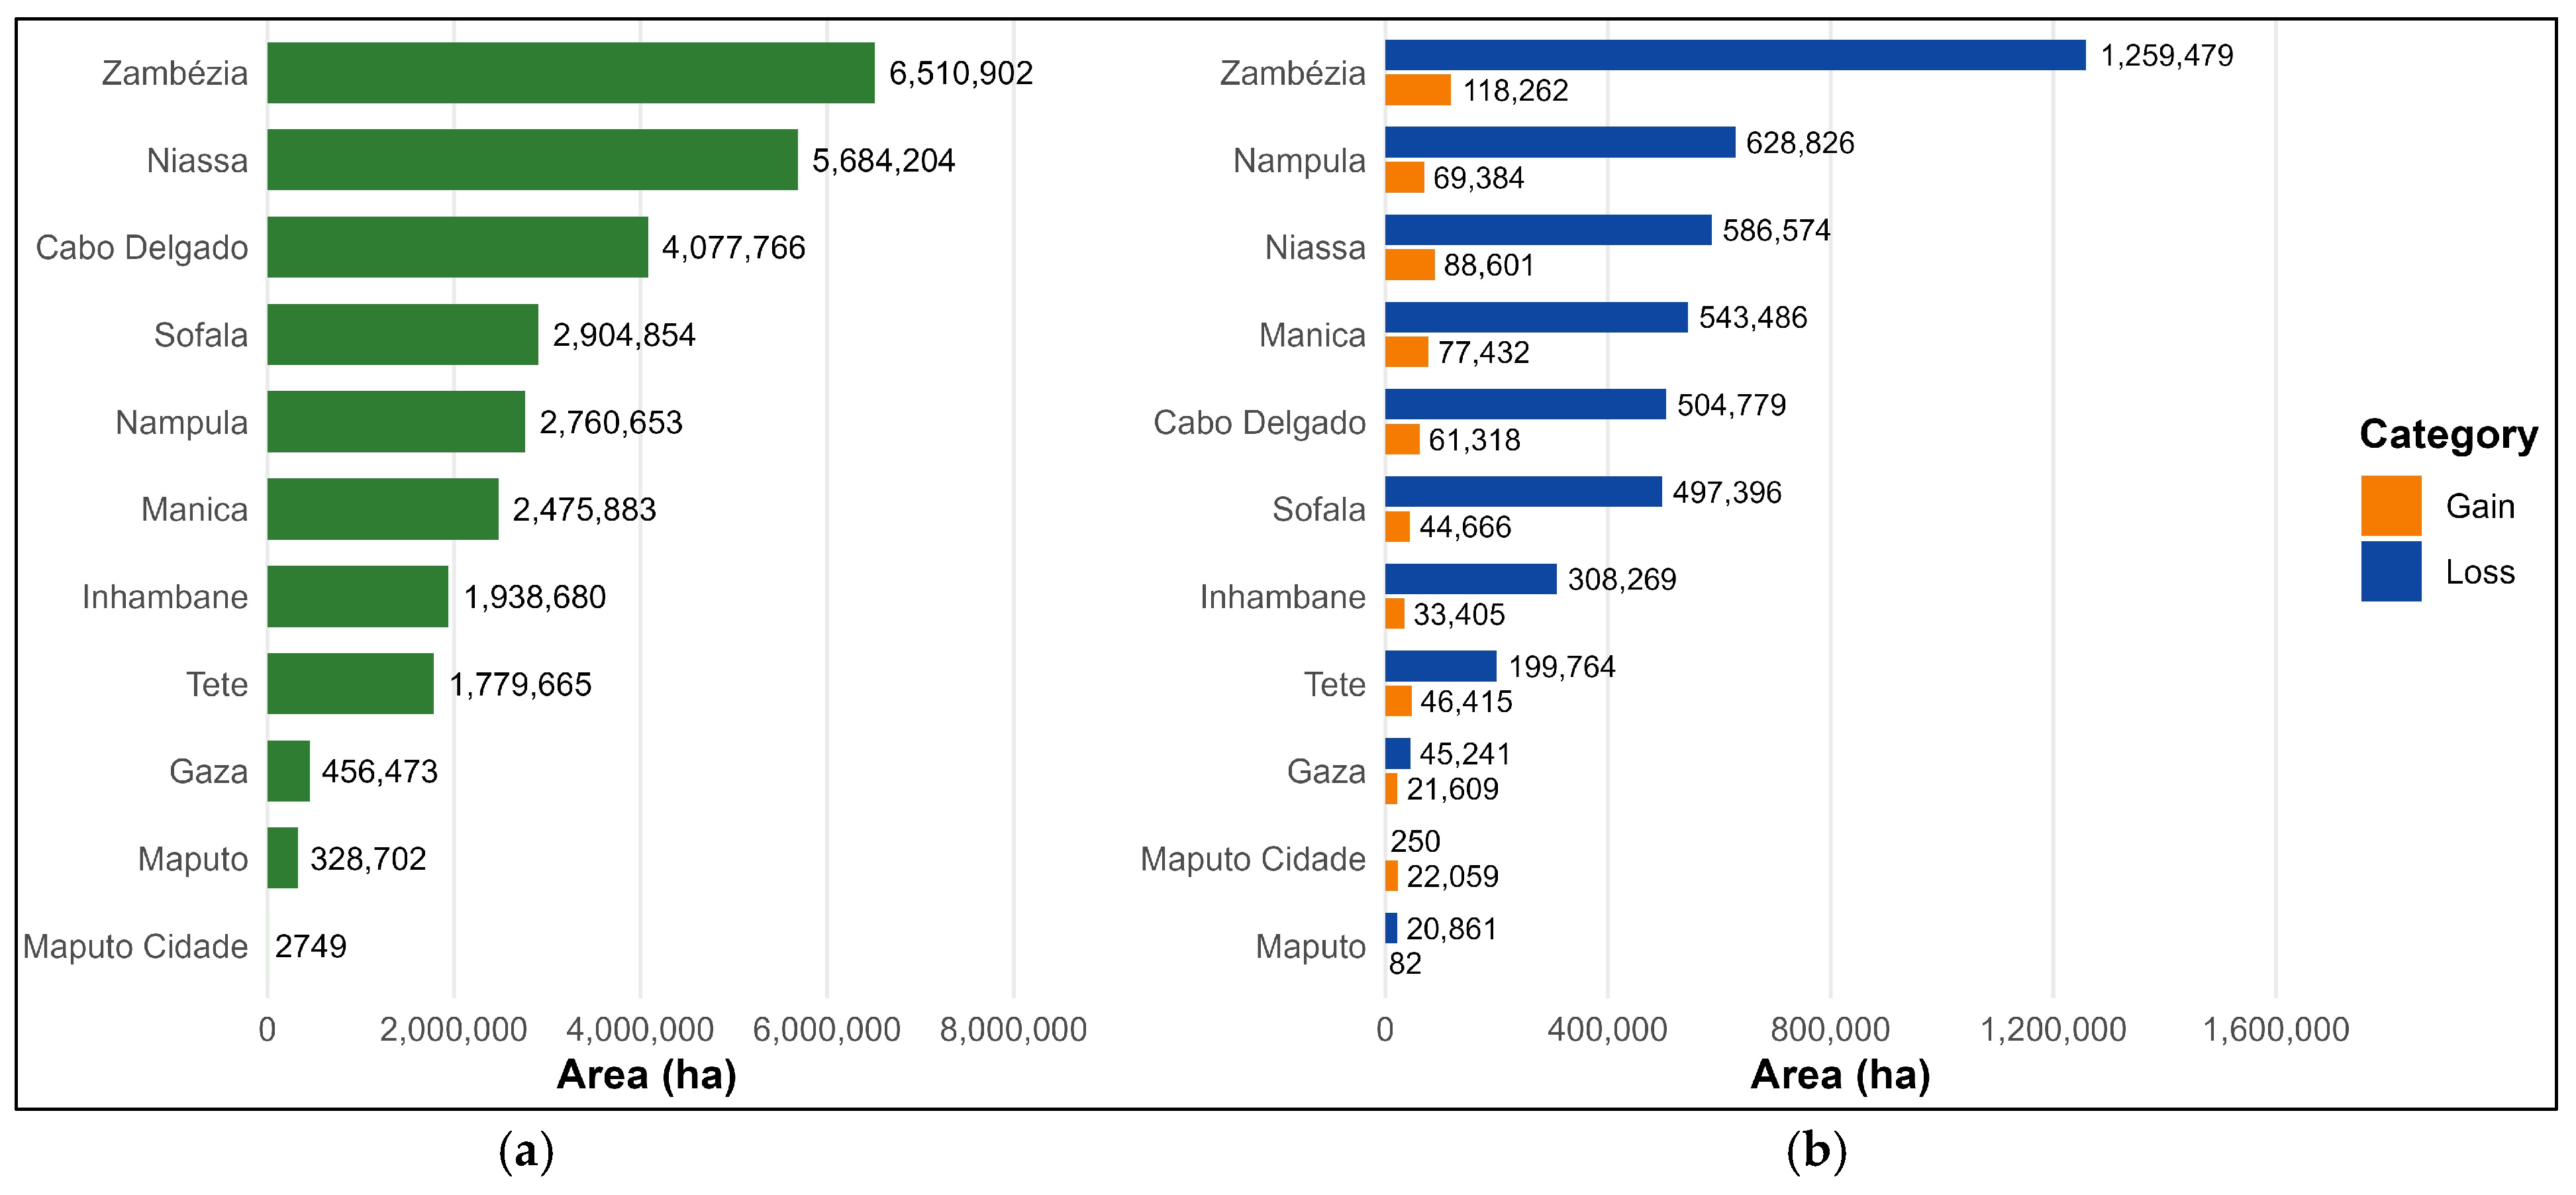
The provincial distribution of deforestation presents marked spatial heterogeneity (
Figure 3). Zambézia concentrates the largest absolute loss (1.26 million ha, 19% of provincial initial cover), followed by Nampula (629 thousand ha, 23%) and Manica (543 thousand ha, 22%). In relative terms, Nampula and Manica present the highest conversion rates, indicating intense pressure on forest.
2.2. Data Sources and Acquisition
This study integrated multiple data sources covering the 2001–2024 period:
Forest cover data: deforestation and gain data were obtained from GEE, based on Hansen et al. [
2] methodology using Landsat 7 ETM+ and Landsat 8 OLI imagery at 30 m resolution. A 30% canopy cover threshold was adopted to define “forest,” consistent with recommended practices for tropical regions [
35]. Deforestation is operationally defined as “stand replacement disturbance,” representing complete canopy removal at the pixel scale, regardless of underlying cause [
2,
36]. The dataset’s global accuracy is 99.6% for tree cover (2000) and 97.1% for loss detection, with regional validations for Mozambican Miombo ecosystems exceeding 92% accuracy [
37,
38]. Deforestation drivers (permanent agriculture, shifting agriculture, forestry, commodities, wildfire, settlements, unknown) were obtained from Curtis et al. [
36] classification, which uses machine-learning algorithms trained on spaciotemporal persistence patterns to distinguish conversion types.
Socioeconomic data: GDP per capita data were obtained from the World Bank’s World Development Indicators (WDI) database [
4], expressed in constant 2015 USD to ensure temporal comparability through inflation adjustment. The World Bank employs methodologies aligned with the UN System of National Accounts (SNA) 2008 [
39], ensuring international consistency and comparability. Sectoral GDP composition variables (agriculture, industry, services as percentages of GDP) were extracted from FAOSTAT [
40].
Agricultural data: cultivated area (hectares), total production (tons), and crop-specific data were extracted from FAOSTAT [
40], which compiles official agricultural statistics reported by national governments through standardized questionnaires following System of Economic Accounts for Food and Agriculture (SEAFA) guidelines [
41]. Agricultural productivity (kg/ha) was calculated as productivity = (total production in tons × 1000)/cultivated area in hectares. Additional agricultural economic data, including production values and agricultural trade, were obtained from FAOSTAT Agricultural Development and Rural Indicators series [
40].
Climate data: climate variables (precipitation, temperature, Standardized Precipitation Index—SPI) were extracted through Google Earth Engine (GEE) using the Climate Hazards Group InfraRed Precipitation with Station data (CHIRPS) dataset [
42]. CHIRPS provides quasi-global precipitation coverage (50° S–50° N) at 0.05° spatial resolution (~5.5 km at the equator) from 1981 to present with near-real-time updates [
42]. Validation studies in Southern Africa report correlation coefficients exceeding 0.85 for monthly accumulations and mean absolute errors of approximately 20 mm/month [
43], indicating suitability for agricultural drought monitoring and climate variability analysis.
2.3. Analytical Framework
The study employed an exploratory–descriptive time series design analyzing secondary annual data from 2001 to 2024 for Mozambique. The analytical framework combined visual exploratory analysis with statistical variance analysis to identify temporal patterns and sub-period changes in the relationship between agricultural deforestation and economic growth.
Variables: Eight key variables were analyzed, grouped into six categories: (i) land use dynamics (agricultural deforestation (hectares/year)); (ii) economic growth (total GDP per capita and agricultural GDP per capita (constant 2015 USD)); (iii) agricultural expansion (cultivated area (hectares) and agricultural productivity (kg/ha)); (iv) demographic pressure (total population (millions)); (v) structural transformation (agricultural employment (% of population)); and (vi) capital access (agricultural credit (millions USD)).
Temporal subdivision: the 24-year period was subdivided into three consecutive 8-year sub-periods: 2001–2008 (early period), 2009–2016 (intermediate period), and 2017–2024 (recent period). This subdivision, while maintaining sufficient observations per sub-period (8 years each one), allows identification of temporal patterns in relationships between variables across development phases.
Visual exploratory analysis: time series visualizations were produced using Microsoft Excel and R 4.4.2 in RStudio 2025.09.0 + 387 with the Quarto 1.7.32 publishing system, while maps were created in QGIS 3.38.3–Grenoble. The visualization strategy prioritized (i) temporal evolution of complete series identifying trends and inflection points; (ii) indexed comparisons (base 2001 = 100) enabling proportional growth assessment across variables with different scales; (iii) scatter plots exploring bivariate relationships between agricultural deforestation and economic indicators; and (iv) quadrant analysis examining credit–deforestation–GDP relationships across sub-periods.
Statistical analysis: in this study, the EKC is employed as a conceptual framework for interpreting long-term relationships between economic growth and environmental change, rather than as an econometrically estimated model. Empirical tests of the EKC in the context of deforestation have predominantly relied on cross-country or subnational panel data, which expand degrees of freedom and facilitate the identification of non-linear income–environment relationships [
6,
7]. In contrast, the present analysis focuses on a single-country national time series comprising 24 annual observations (2001–2024). Under such conditions, formal econometric estimation of non-linear EKC specifications would be statistically fragile, given the limited number of observations, low-income variability over time, and high sensitivity to short-term shocks or structural breaks. Moreover, Mozambique remains at a very low-income level (USD 604 in 2024), which further constrains the empirical identification of an income turning point. Accordingly, EKC income thresholds reported in panel-based studies of developed and emerging economies are treated here as comparative reference benchmarks, rather than as estimable parameters. The analytical strategy therefore adopts an exploratory and structural approach, assessing whether observed forest–growth dynamics across sub-periods approximate, deviate from, or exhibit early similarities to patterns predicted by the EKC and forest transition theories.
The statistical significance of differences between sub-periods was evaluated using variance analysis, preceded by verification of statistical assumptions following the protocols of Zar [
44] and Field et al. [
45]. Normality was tested using the Shapiro–Wilk test [
46] at α = 0.05, while homogeneity of variances was assessed using Levene’s test [
47]. For variables violating these assumptions, the non-parametric Kruskal–Wallis test [
48] was applied, followed by Dunn’s post hoc test [
49] with Bonferroni correction. When assumptions were satisfied, one-way ANOVA was used, followed by Tukey’s HSD test [
50]. Post hoc groupings are indicated by lowercase superscript letters (a, b, c), where sub-periods sharing the same letter do not differ significantly (α = 0.05)—a notation widely adopted in agricultural and environmental studies [
51].
All analyses were conducted in R using packages readxl for data import, dplyr and tidyr for data manipulation, ggplot2 for visualization, scales for axis formatting, patchwork for multi-panel composition, RColorBrewer for color palettes, car for Levene’s test, rstatix for Dunn’s post hoc test, and knitr/quarto for dynamic report generation.
3. Results
3.1. Demographic, Macroeconomic and Climate Context
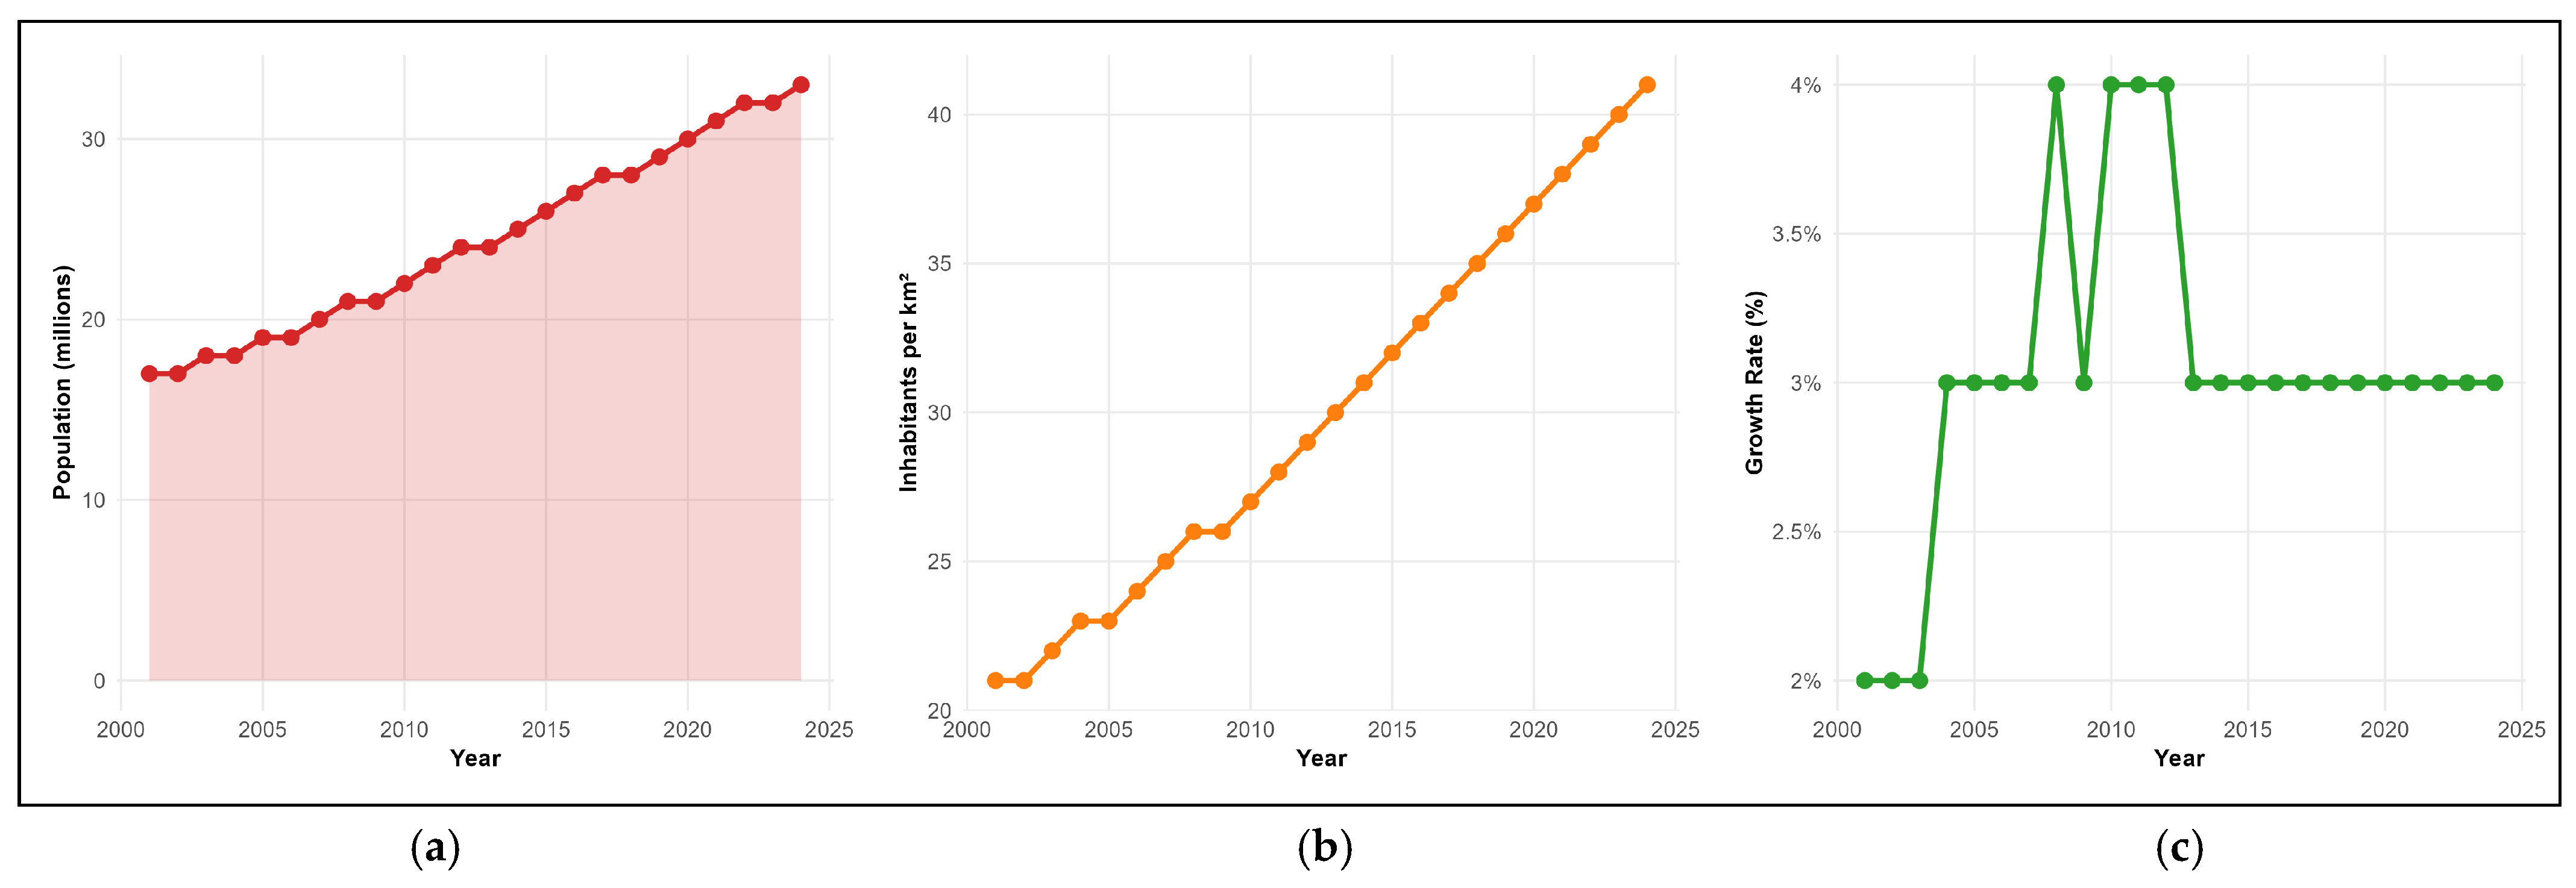
Mozambique’s population nearly doubled during the analysis period, growing from 17.0 to 33.0 million inhabitants at an average rate of 3.0% per year, resulting in a 95.2% increase in population density from 21 to 41 inhabitants per km
2 (
Figure 4a,b). Population growth rate exhibited a distinct pattern, remaining at only 2% during 2001–2003, abruptly jumping to 3–4% between 2004–2015 and stabilizing again at 3% after 2015 (
Figure 4c).
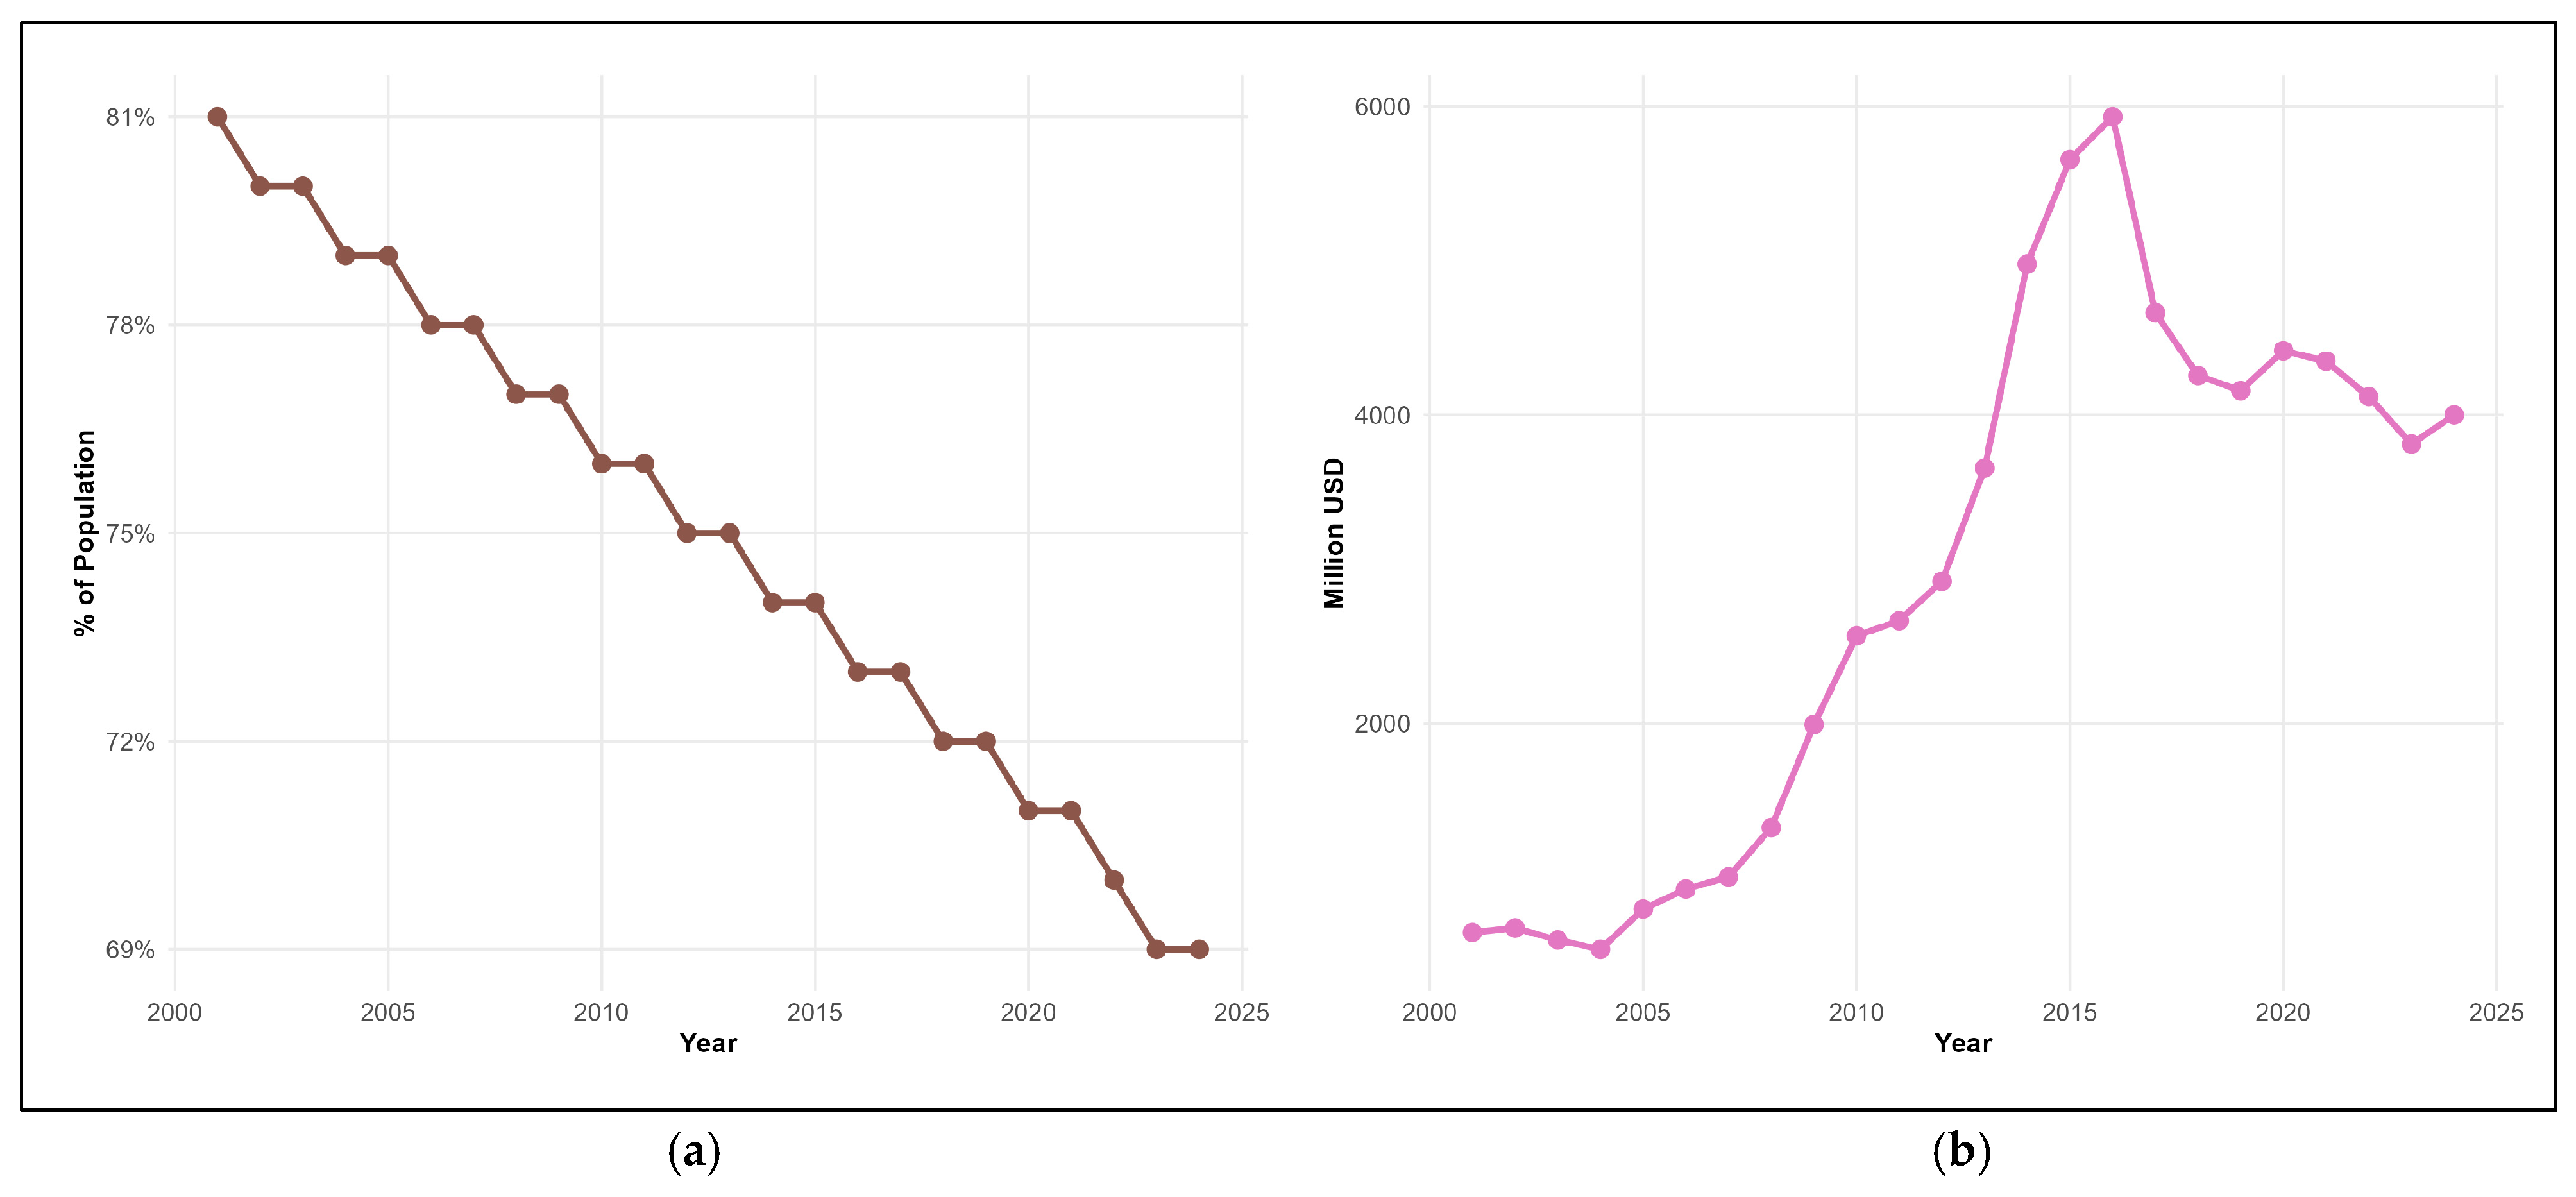
Despite relative decline in agricultural employment (from 81% in 2001 to 69% in 2024 of total population), absolute rural population dependent on agriculture increased by approximately 9 million people due to overall population growth. This demographic pressure constitutes a fundamental driver of pressure on forest resources, particularly when combined with structural limitations in non-agricultural sector absorption of rural labor.
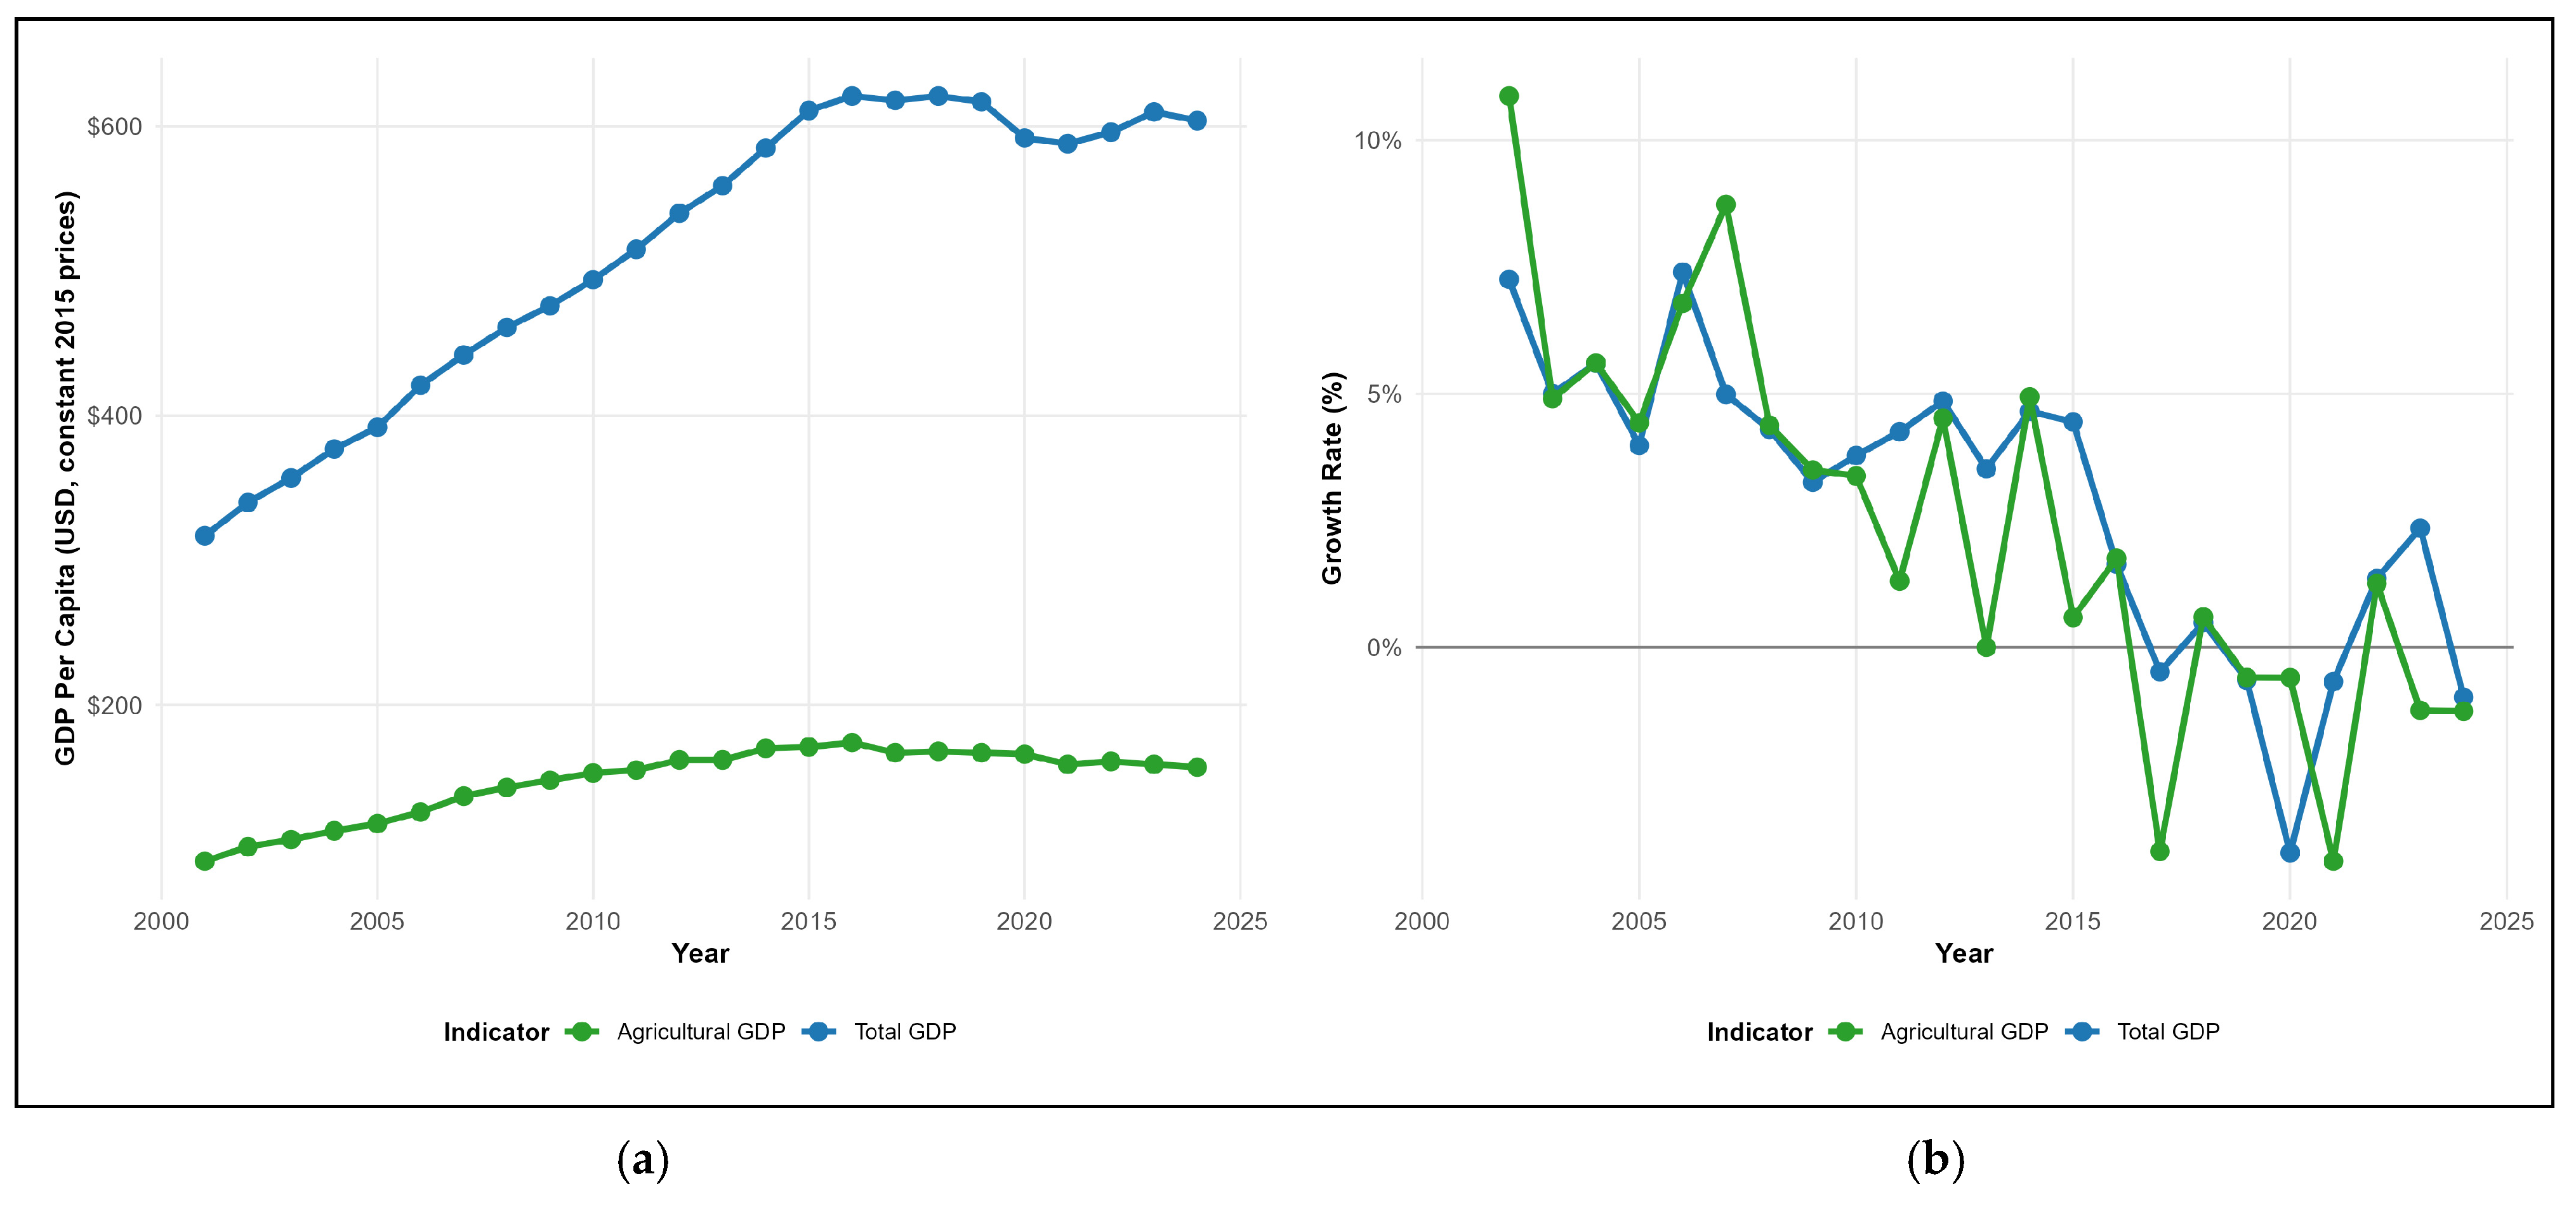
The macroeconomic context was characterized by sustained economic growth from a very low per capita base (
Figure 5). Total GDP per capita increased by 90.5%, rising from USD 317 in 2001 to USD 604 in 2024, following a markedly linear and ascending trajectory. Agricultural GDP per capita also registered growth, although at a more moderate pace (70.7%), rising from USD 92 to USD 157. This differential in expansion rates (90.5% vs. 70.7%) indicates that national economic growth was primarily driven by non-agricultural sectors.
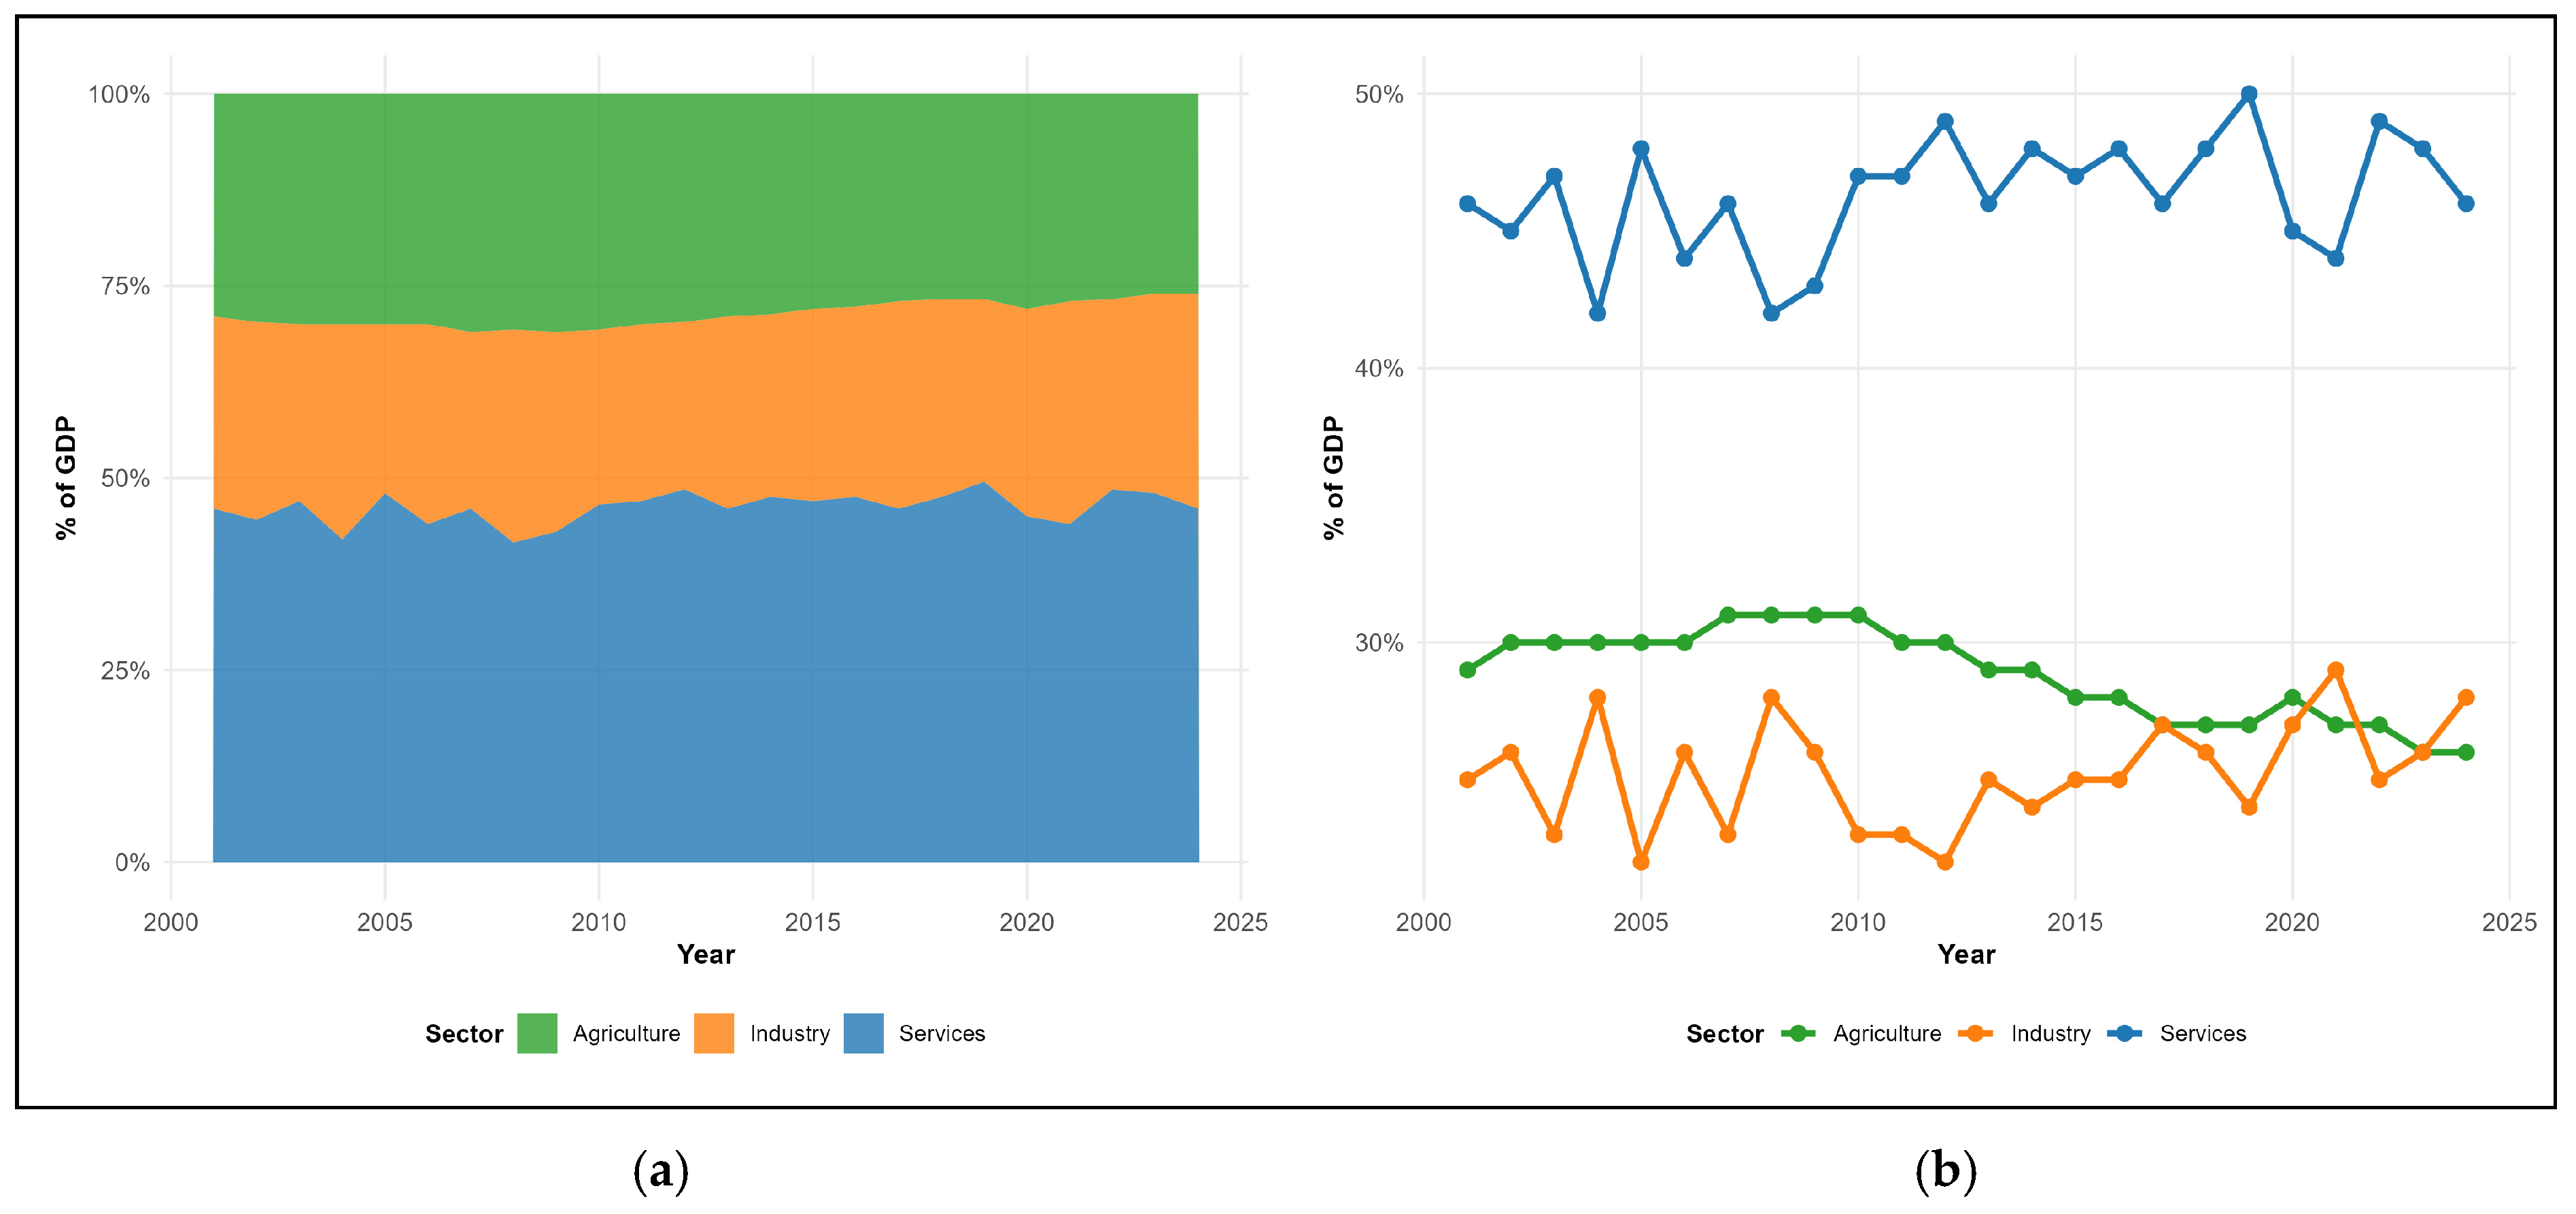
Sectoral composition analysis confirms moderate structural transformation: the services sector maintained its position as the largest GDP contributor, oscillating between 42% and 50%; agriculture showed a decline of 3 percentage points (from 29% to 26%); industry gained equivalent participation (from 25% to 28%) (
Figure 6a). Annual growth rates revealed differentiated patterns between sectors: total GDP exhibited greater volatility, with peaks in 2004 (15.5%), 2010 (18.3%), and 2015 (12.8%), frequently associated with investments in mining and services sectors; agricultural GDP, in turn, exhibited more stable but systematically inferior growth, with maximums of 9–10% in the same periods (
Figure 6b). From 2016 onward, both trajectories show structural deceleration, with total GDP registering the only negative value in the series in 2020 (−3.2%), likely related to the COVID-19 pandemic, and agricultural GDP registering −2.1% in 2022, associated with severe droughts and conflicts in the northern region.
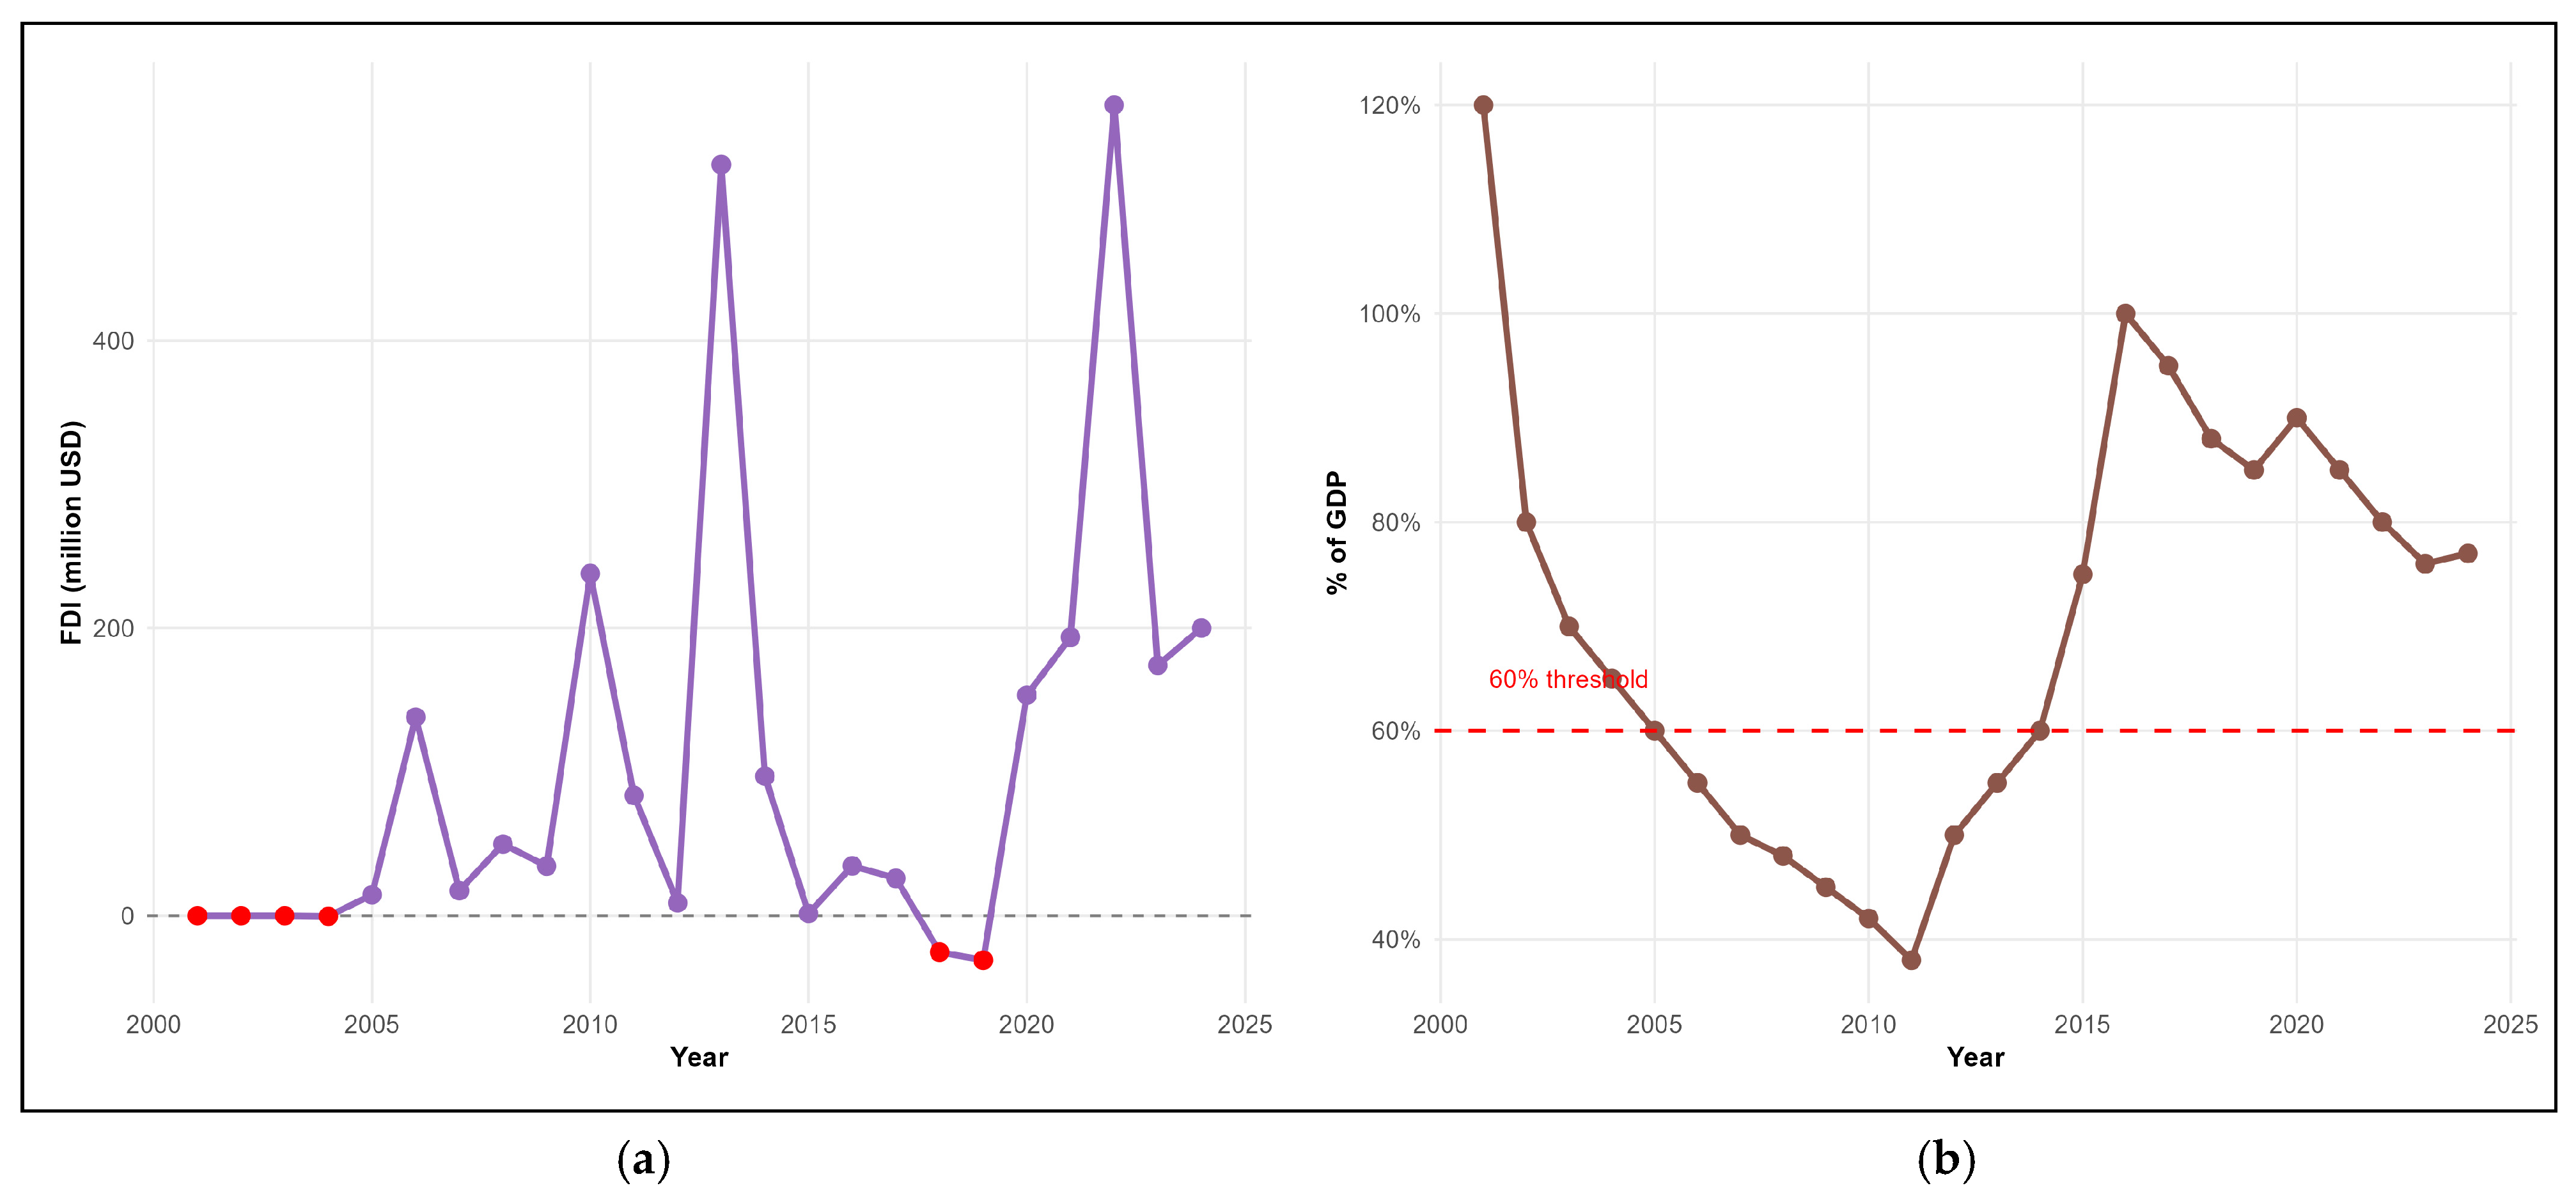
However, the macroeconomic context was also marked by extreme volatility in foreign direct investment (FDI) and significant challenges in fiscal sustainability (
Figure 7a). FDI presented average values of USD 103.9 million/year but oscillated between −USD 30.9 million (2019) and USD 563.7 million (2022). Three years presented negative FDI (2004, 2018, 2019), indicating net capital outflow. FDI peaks in 2010 (USD 237.9 million), 2013 (USD 522.3 million), and 2022 (USD 563.7 million) suggest relationship with mega-investment projects, possibly in the natural resources sector.
Public debt presented a concerning trajectory: a sharp decline from 120% of GDP (2001) to a minimum of 38% (2010), followed by rapid escalation to 100% (2016) and subsequent reduction to 77% (2024). Debt exceeded the prudential limit of 60% of GDP in 14 of the 24 years analyzed. The 2016 peak coincides with the revelation of the “hidden debts” crisis, which resulted in the suspension of international support and had significant implications for financing rural development and environmental conservation programs.
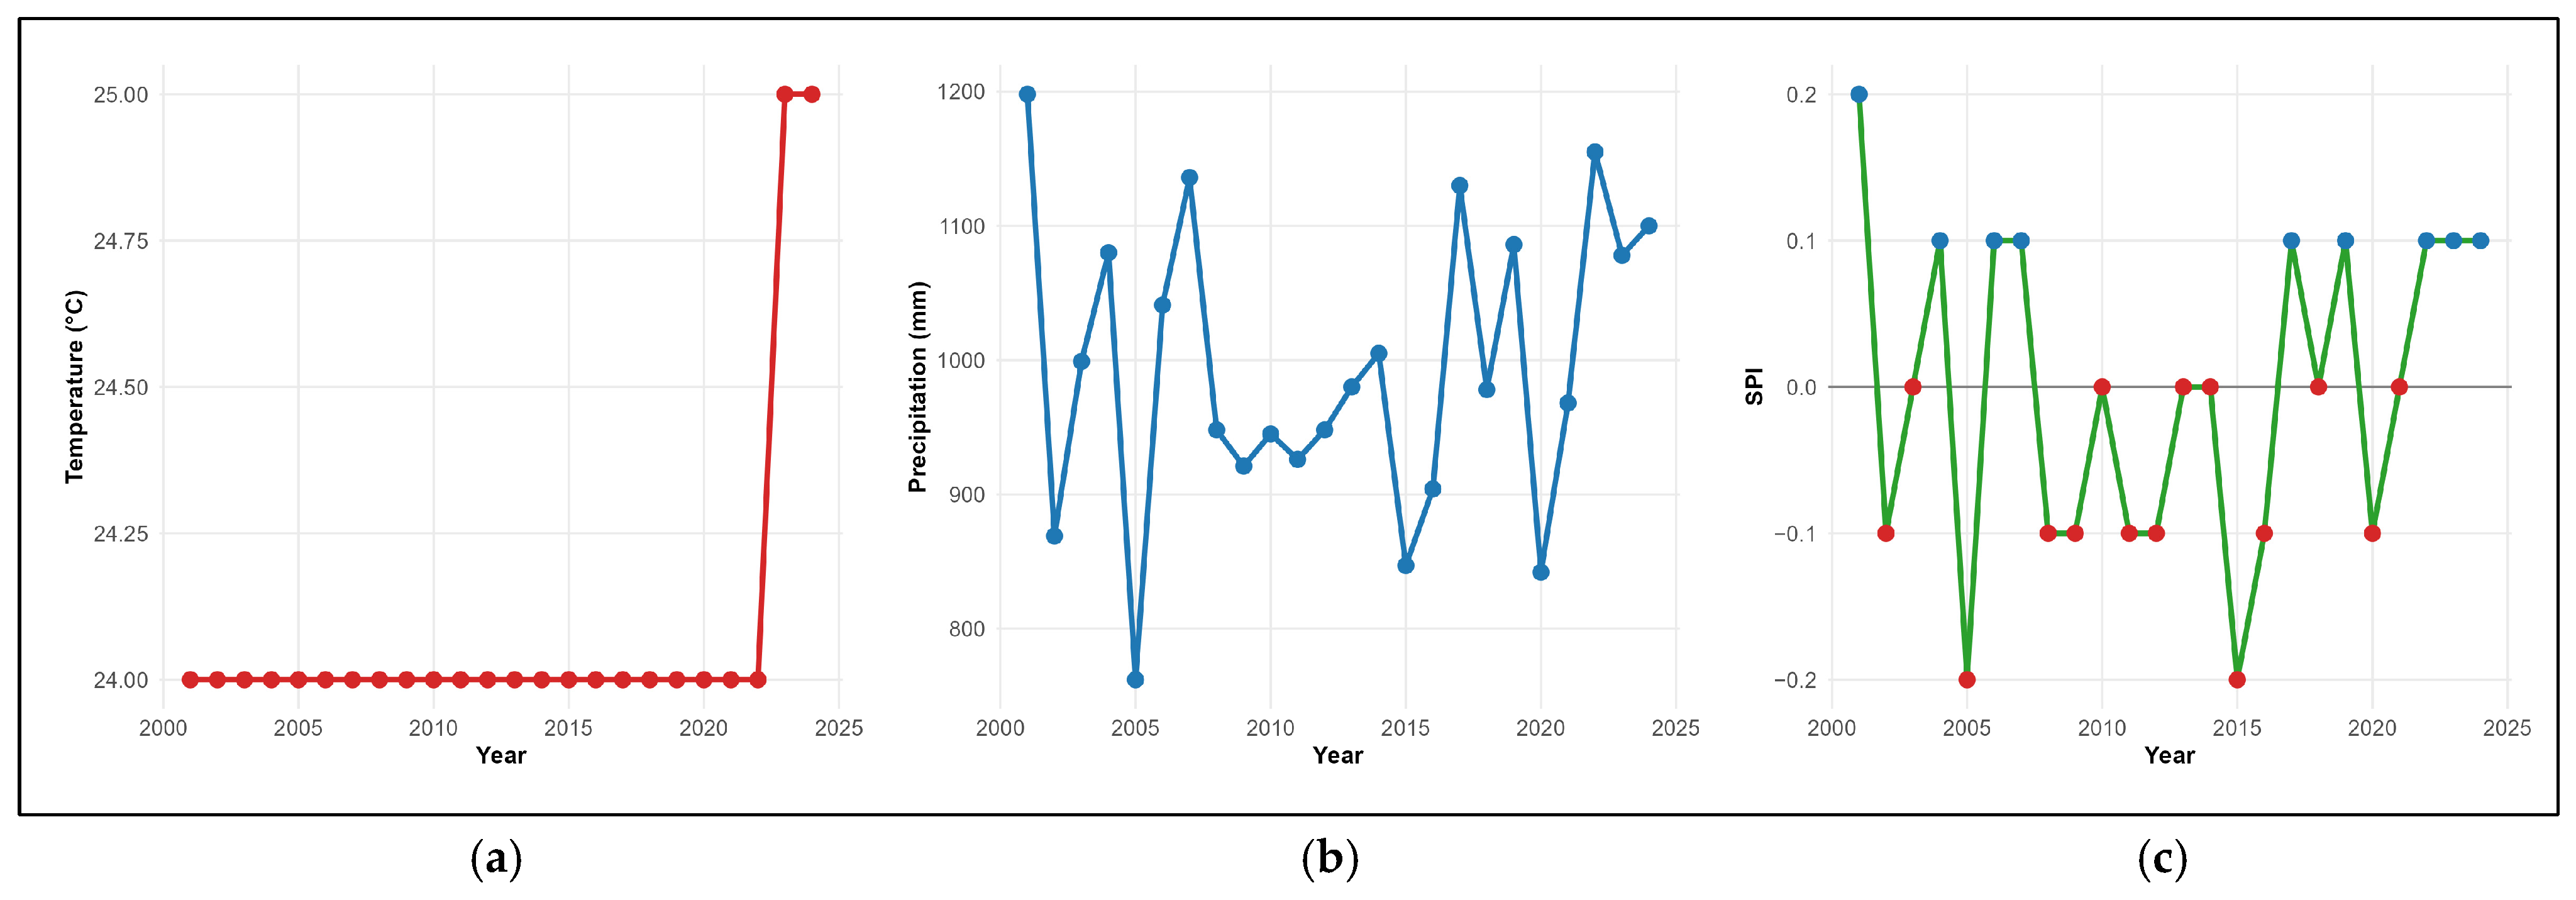
The climate context presented relative stability in terms of temperature but with significant inter-annual variability in precipitation. Mean temperature remained at 24.0–24.1 °C during 2001–2022, with an abrupt jump to 25.0 °C in 2023–2024, possibly reflecting climate change effects or El Niño phenomena (
Figure 8a).
Precipitation oscillated between 762 mm (2005) and 1198 mm (2001), with an average of 994 mm/year (
Figure 8b). The Standardized Precipitation Index (SPI) shows balanced alternation between dry years (9 years with SPI < 0) and wet years (9 years with SPI > 0), with average SPI close to zero (
Figure 8c). Particularly dry years occurred in 2002, 2005, 2015, 2016, and 2020, while wet years stood out in 2001, 2004, 2006, 2017, and 2022.
This climate variability constitutes an important contextual factor, since drought years (negative SPI) may intensify conversion of forests to agricultural areas due to need to compensate for productivity losses, while wet years may facilitate shifting agriculture in new areas.
3.2. Agricultural Sector Performance
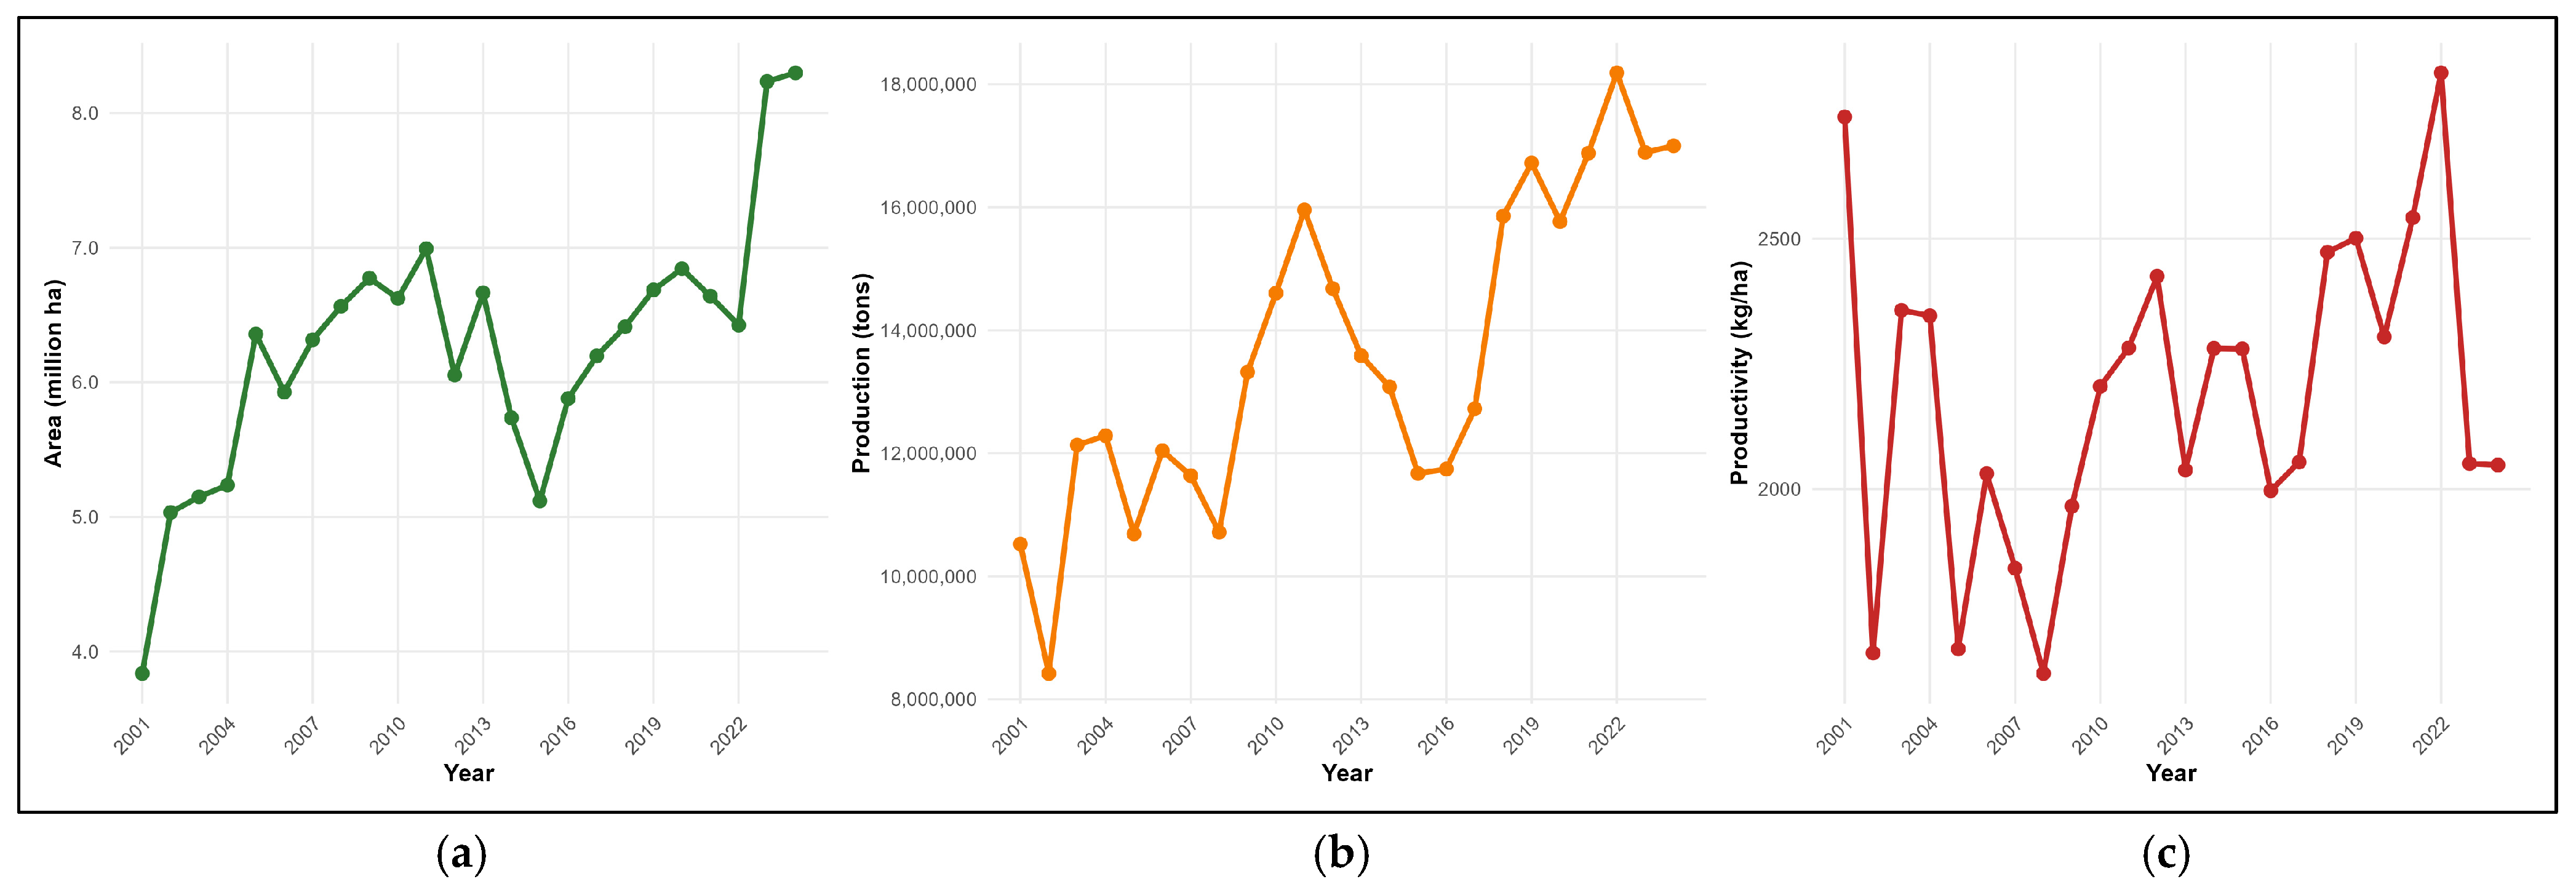
Cultivated area more than doubled during the analysis period, growing 116.4% from 3.8 million hectares (2001) to 8.30 million hectares (2024) (
Figure 9a). This expansion was not linear: accelerated growth is observed between 2001–2005, followed by relative stabilization (around 6–7 million hectares in 2005–2014), and a new phase of significant expansion after 2020, reaching historical values in 2023–2024.
Total agricultural production grew 61.5%, from 10.52 to 17.00 million tons (
Figure 9b). However, this expansion was irregular: significant drops occurred in 2002 (8.42 million tons) and 2005 (10.69 million tons), followed by growth, until peaking in 2019 (16.72 million tons) and 2022 (18.19 million tons).
Agricultural productivity (kg/ha) presents a counterintuitive pattern (
Figure 9c): it decreased by 25.3% over the period, from 2743 kg/ha (2001) to 2048 kg/ha (2024). This reduction occurred despite growth in total production (61.5%) and cultivated area (116.4%). Analysis of the paradox reveals that (i) total production growth (61.5%) was inferior to cultivated area growth (116.4%); (ii) mathematically, productivity declined because area expanded faster than production increased. This pattern suggests that agricultural expansion in Mozambique occurred predominantly through incorporation of marginal or less fertile lands, or by extension of low-intensity technological practices to new areas, resulting in dilution of national average productivity.
Agricultural employment as a percentage of total population declined linearly from 81% (2001) to 69% (2024), representing a reduction of 12 percentage points (
Figure 10a). This average reduction of 0.5 percentage points per year reflects the economy’s structural transformation, with labor migration to urban sectors and services. Agricultural credit exhibited notable expansion of 519.2%, growing from USD 646 million (2001) to USD 4000 million (2024) (
Figure 10b). However, this expansion was not uniform: accelerated growth occurred between 2005–2015 (from USD 797 to USD 5656 million), followed by a sharp reduction in 2016–2019 and gradual recovery after 2020.
3.3. Forest Cover Dynamics
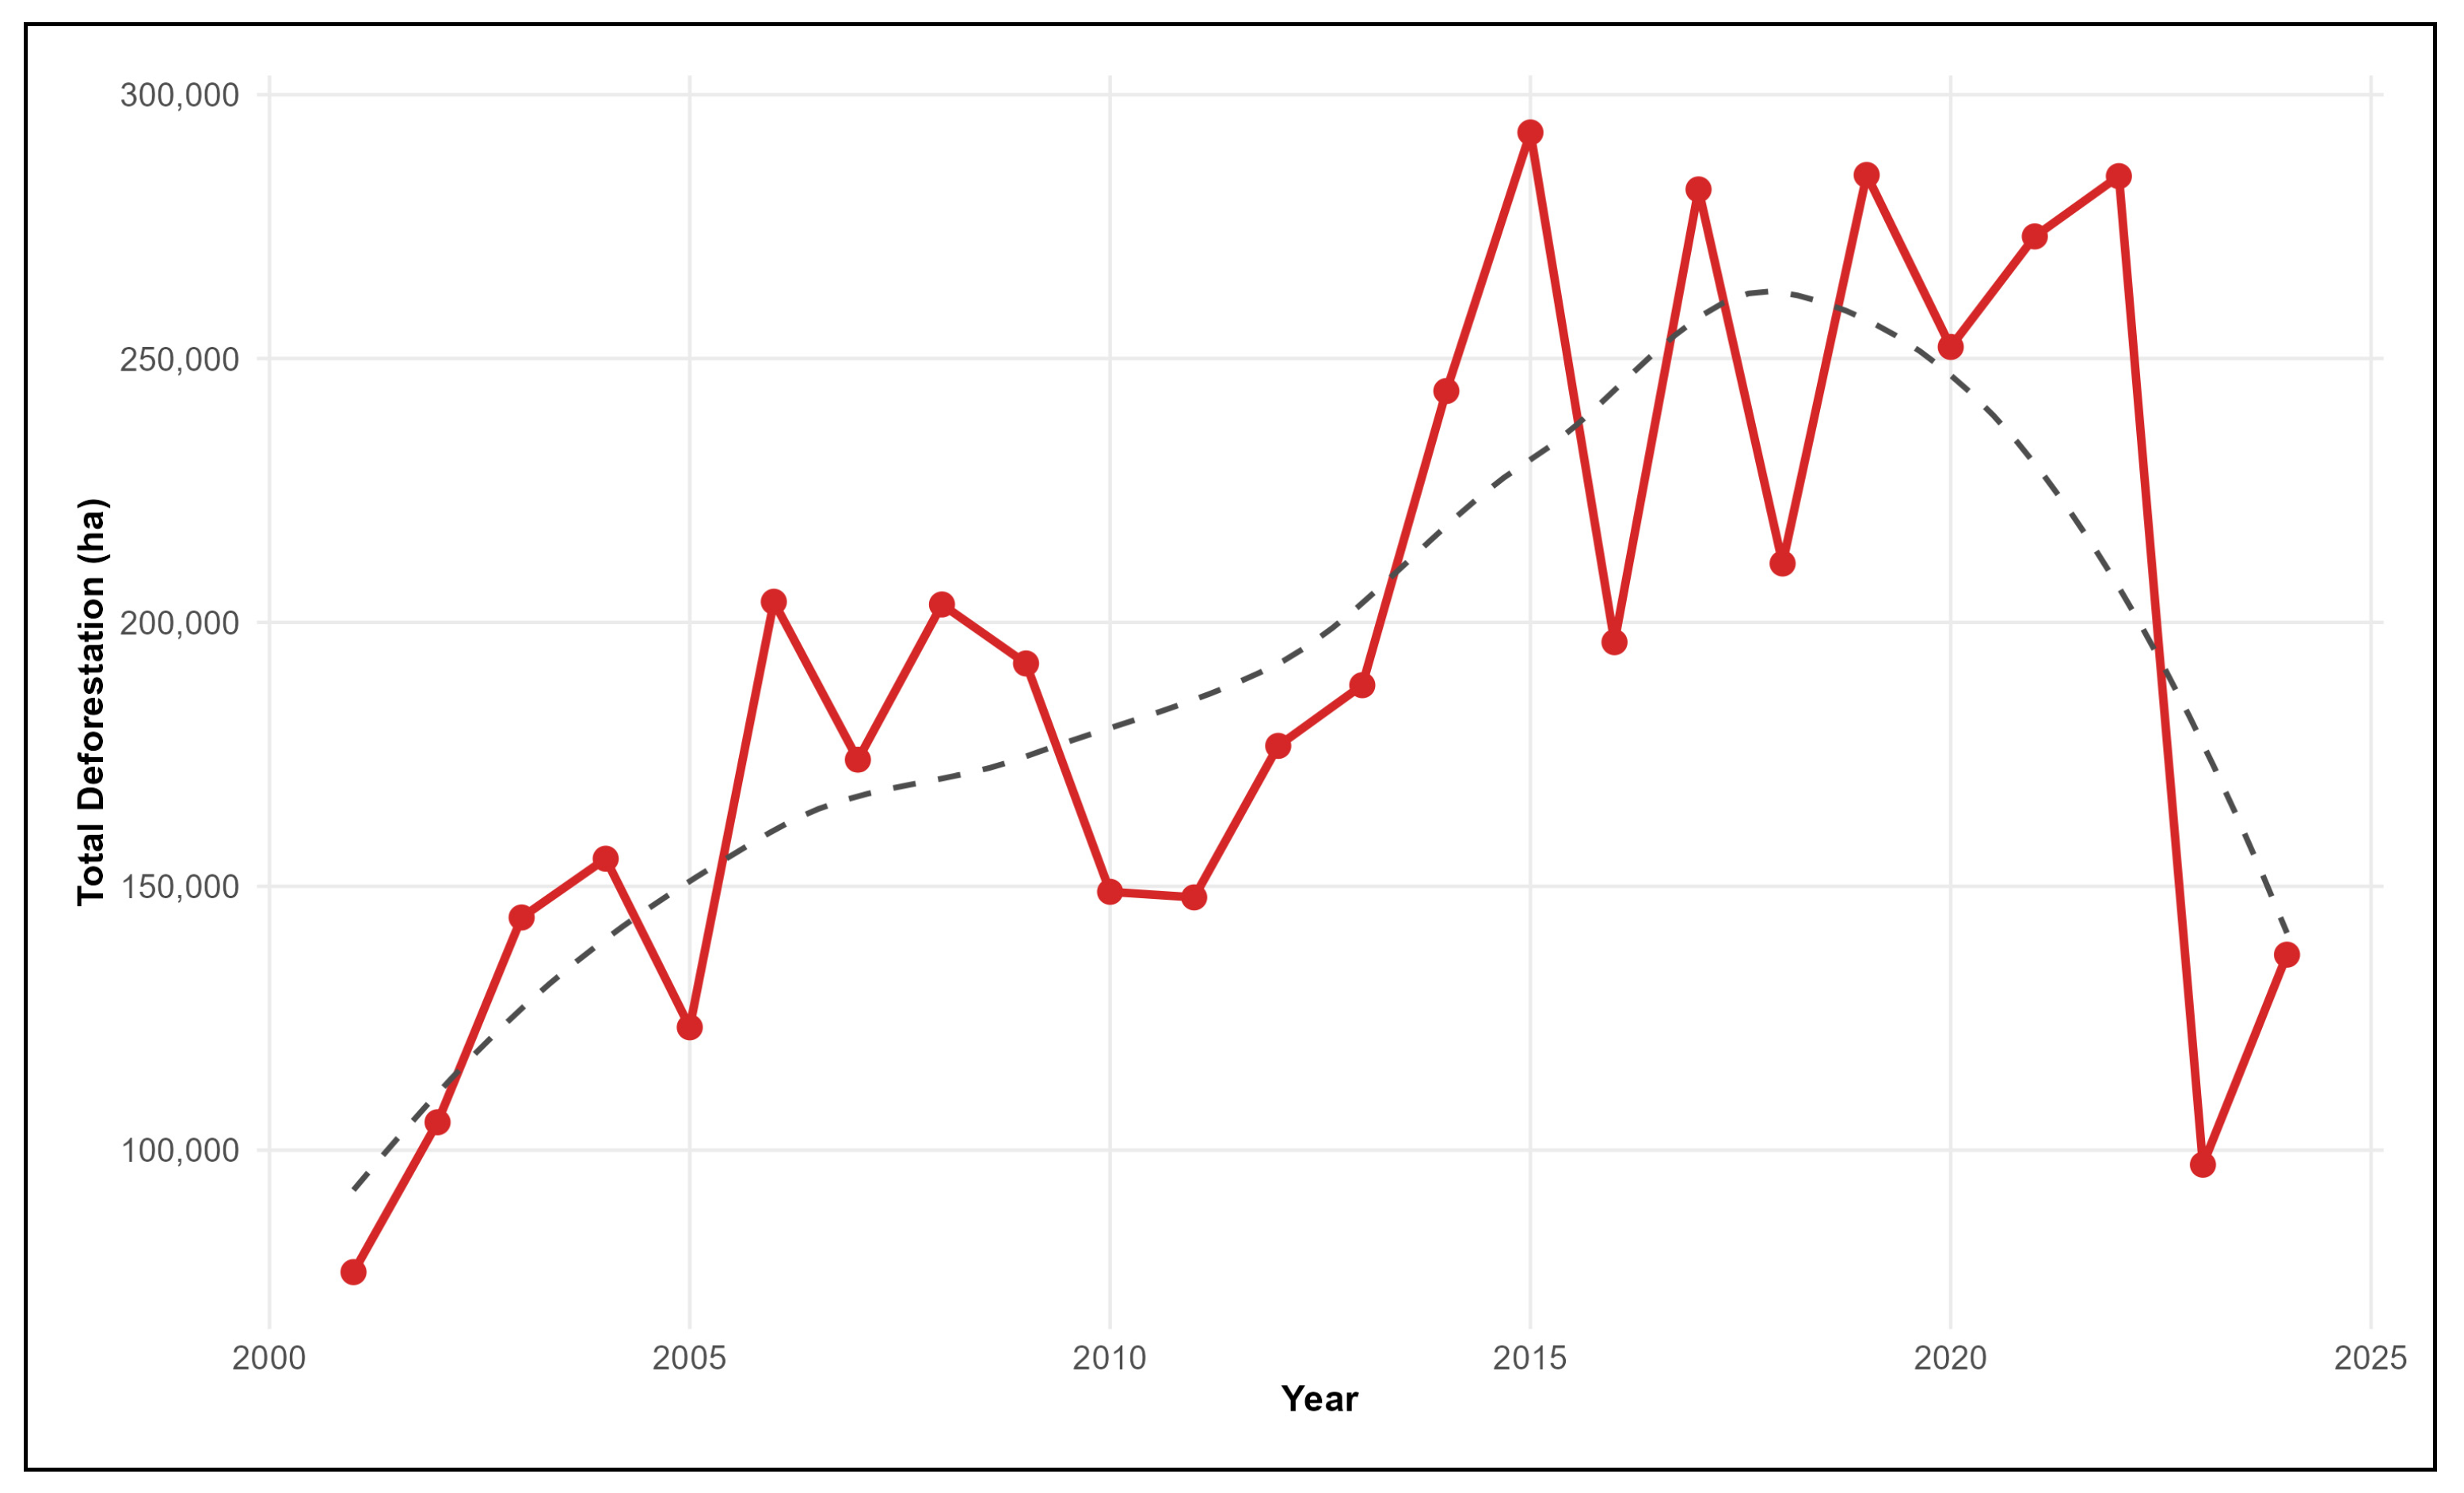
Analysis of total deforestation evolution in Mozambique reveals an ascending trajectory between 2001 (76,889 ha) and 2015, when it reached a maximum of 292,844 ha (
Figure 11). This growth period was followed by a phase of high variability (2016–2022), with sharp oscillations between 196,250 and 284,561 ha. An abrupt drop is observed in 2023 (97,237 ha), representing a 66% reduction compared to the previous year, followed by partial recovery in 2024 (137,040 ha).
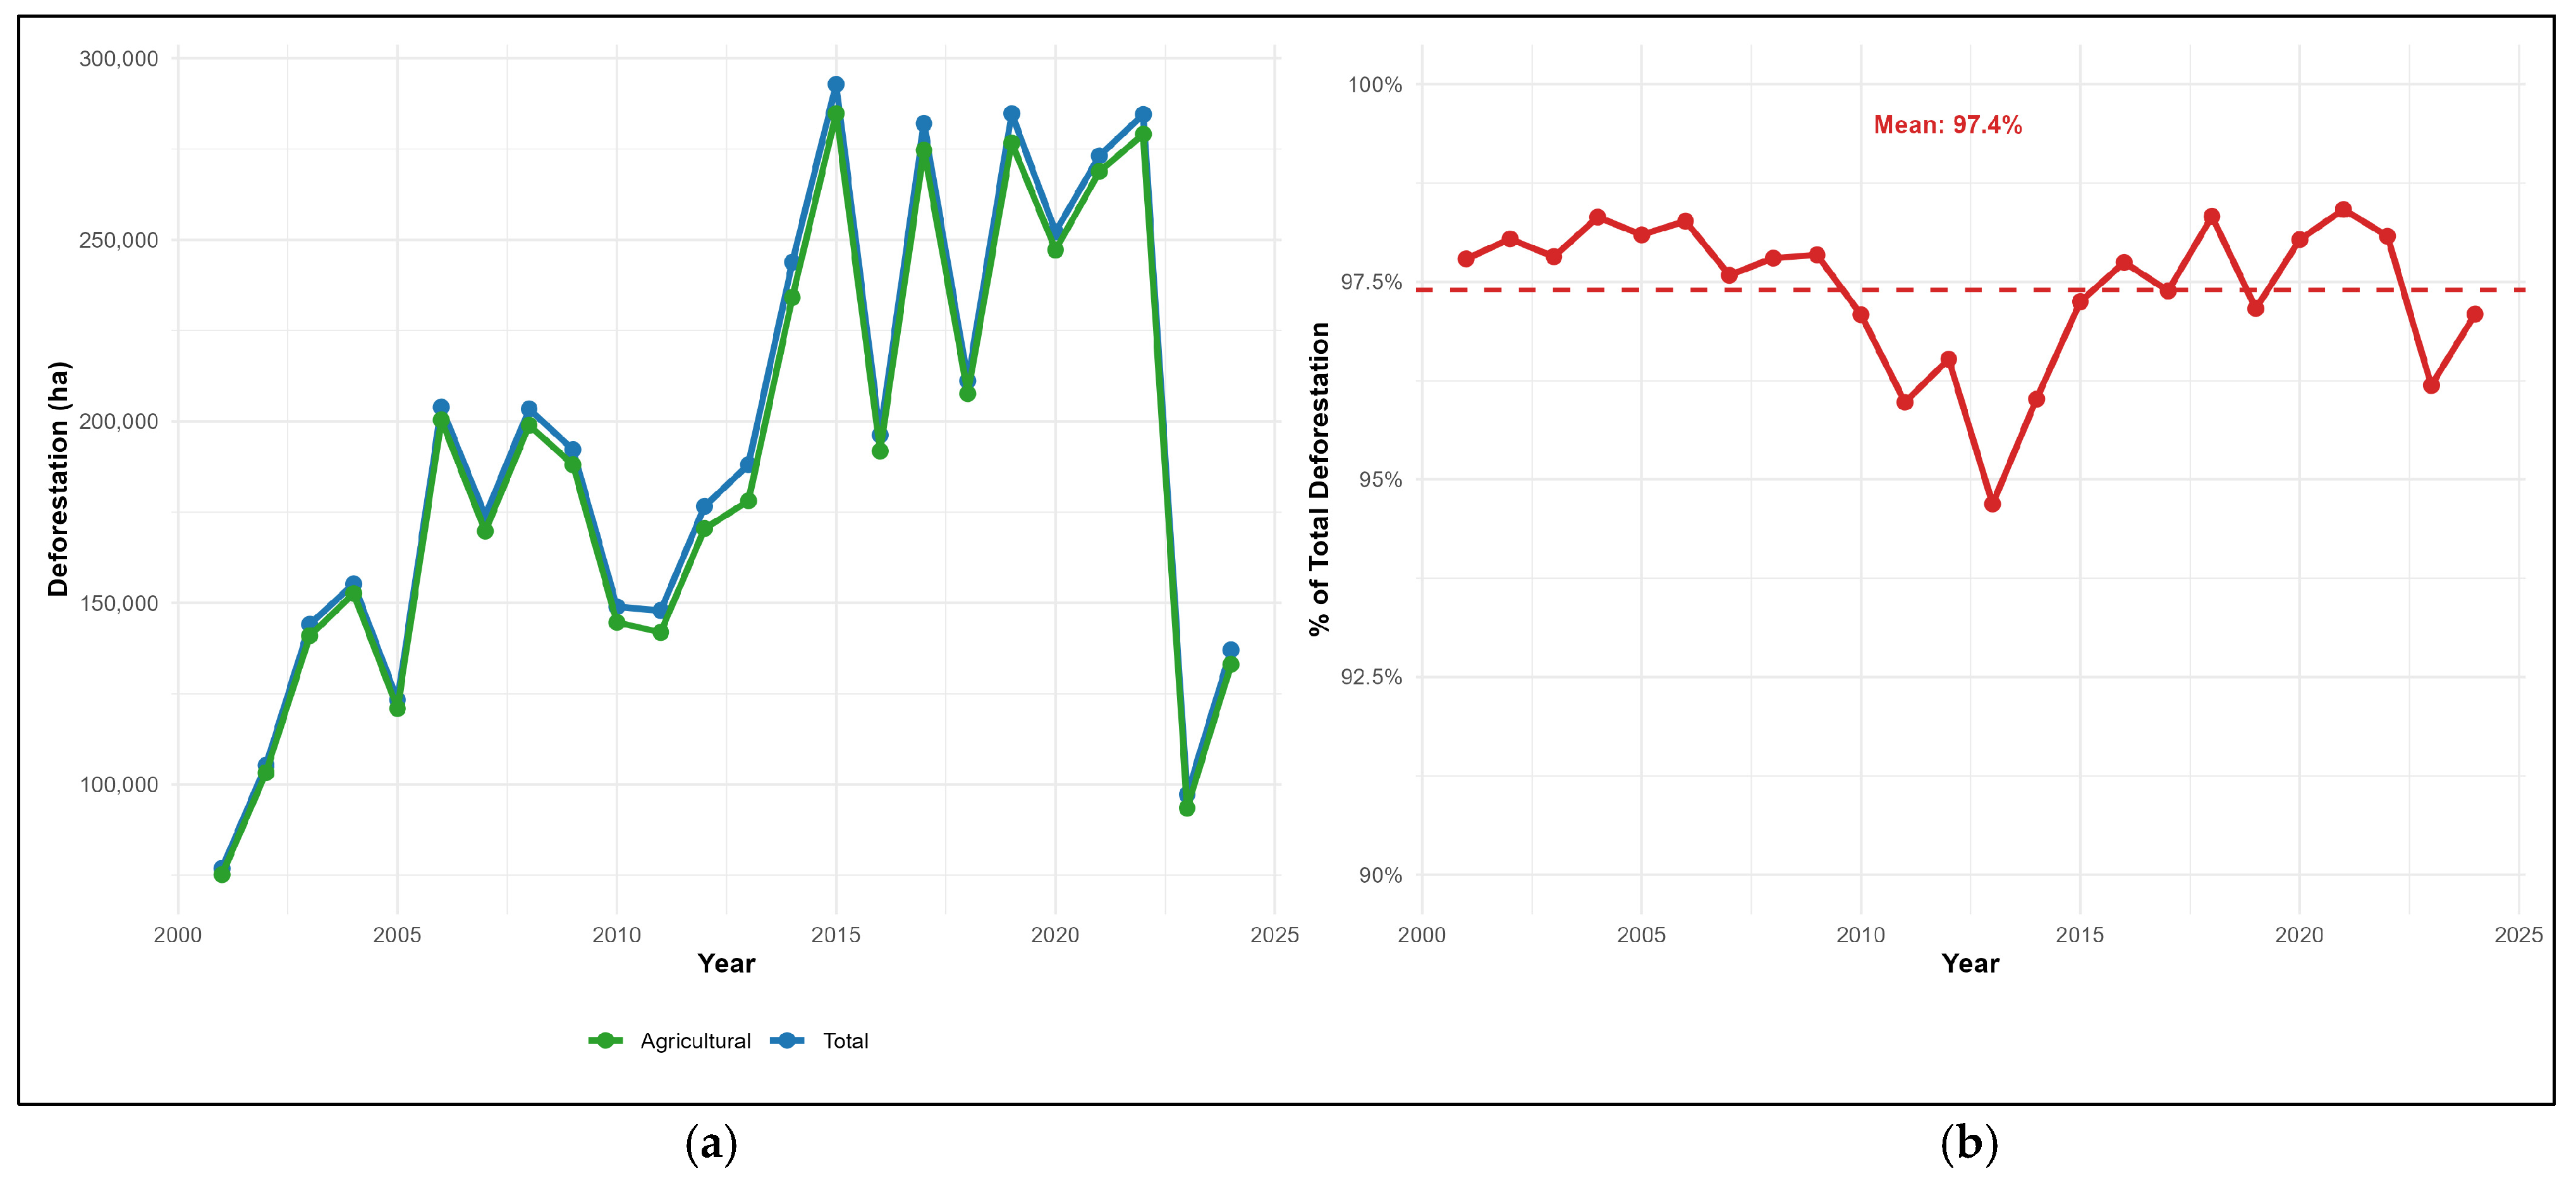
Agricultural deforestation markedly dominates total deforestation, with an average proportion of 97.4% remaining stable throughout the entire period, oscillating minimally between 94.7% (2013) and 98.4% (2021) (
Figure 12b). This proportional stability contrasts strongly with high absolute variability of deforestation, suggesting that non-agricultural factors maintain a consistent marginal contribution.
Decomposition of agricultural deforestation reveals that permanent agriculture is the predominant factor, representing 84.3% of total accumulated agricultural deforestation (3,774,346 ha out of a total of 4,476,655 ha) (
Figure 13a). Shifting agriculture contributes 15.7% (702,309 ha), while commodities represent only 0.1% (3993 ha). This result, indicating predominance of permanent over shifting agriculture, contrasts with previous studies that pointed to shifting agriculture as the main deforestation driver in Mozambique [
25]. This apparent contradiction can be explained by methodological and temporal differences: GFW classification uses machine-learning algorithms trained to distinguish conversion patterns based on temporal persistence of agricultural use [
36]; demographic pressure (population doubling between 2001–2024) may be inducing progressive shortening of fallow cycles in traditionally shifting agriculture, leading to reclassification as “permanent” even while maintaining low-intensity agronomic characteristics [
52,
53].
Although marginal, non-agricultural factors present specific dynamics (
Figure 13b). Logging shows gradual growth up to 2014 (4020 ha), followed by significant reduction. Fires exhibit the most volatile pattern, with peaks in 2013 (3120 ha), 2014 (3455 ha), 2015 (4302 ha), and 2019 (3772 ha). Settlements remain relatively stable and low (average of 667 ha/year). Importantly, “unknown” and “other” factors jointly represented only 27,833 ha over 24 years.
3.4. Patterns of Association Between Deforestation and Economic Growth
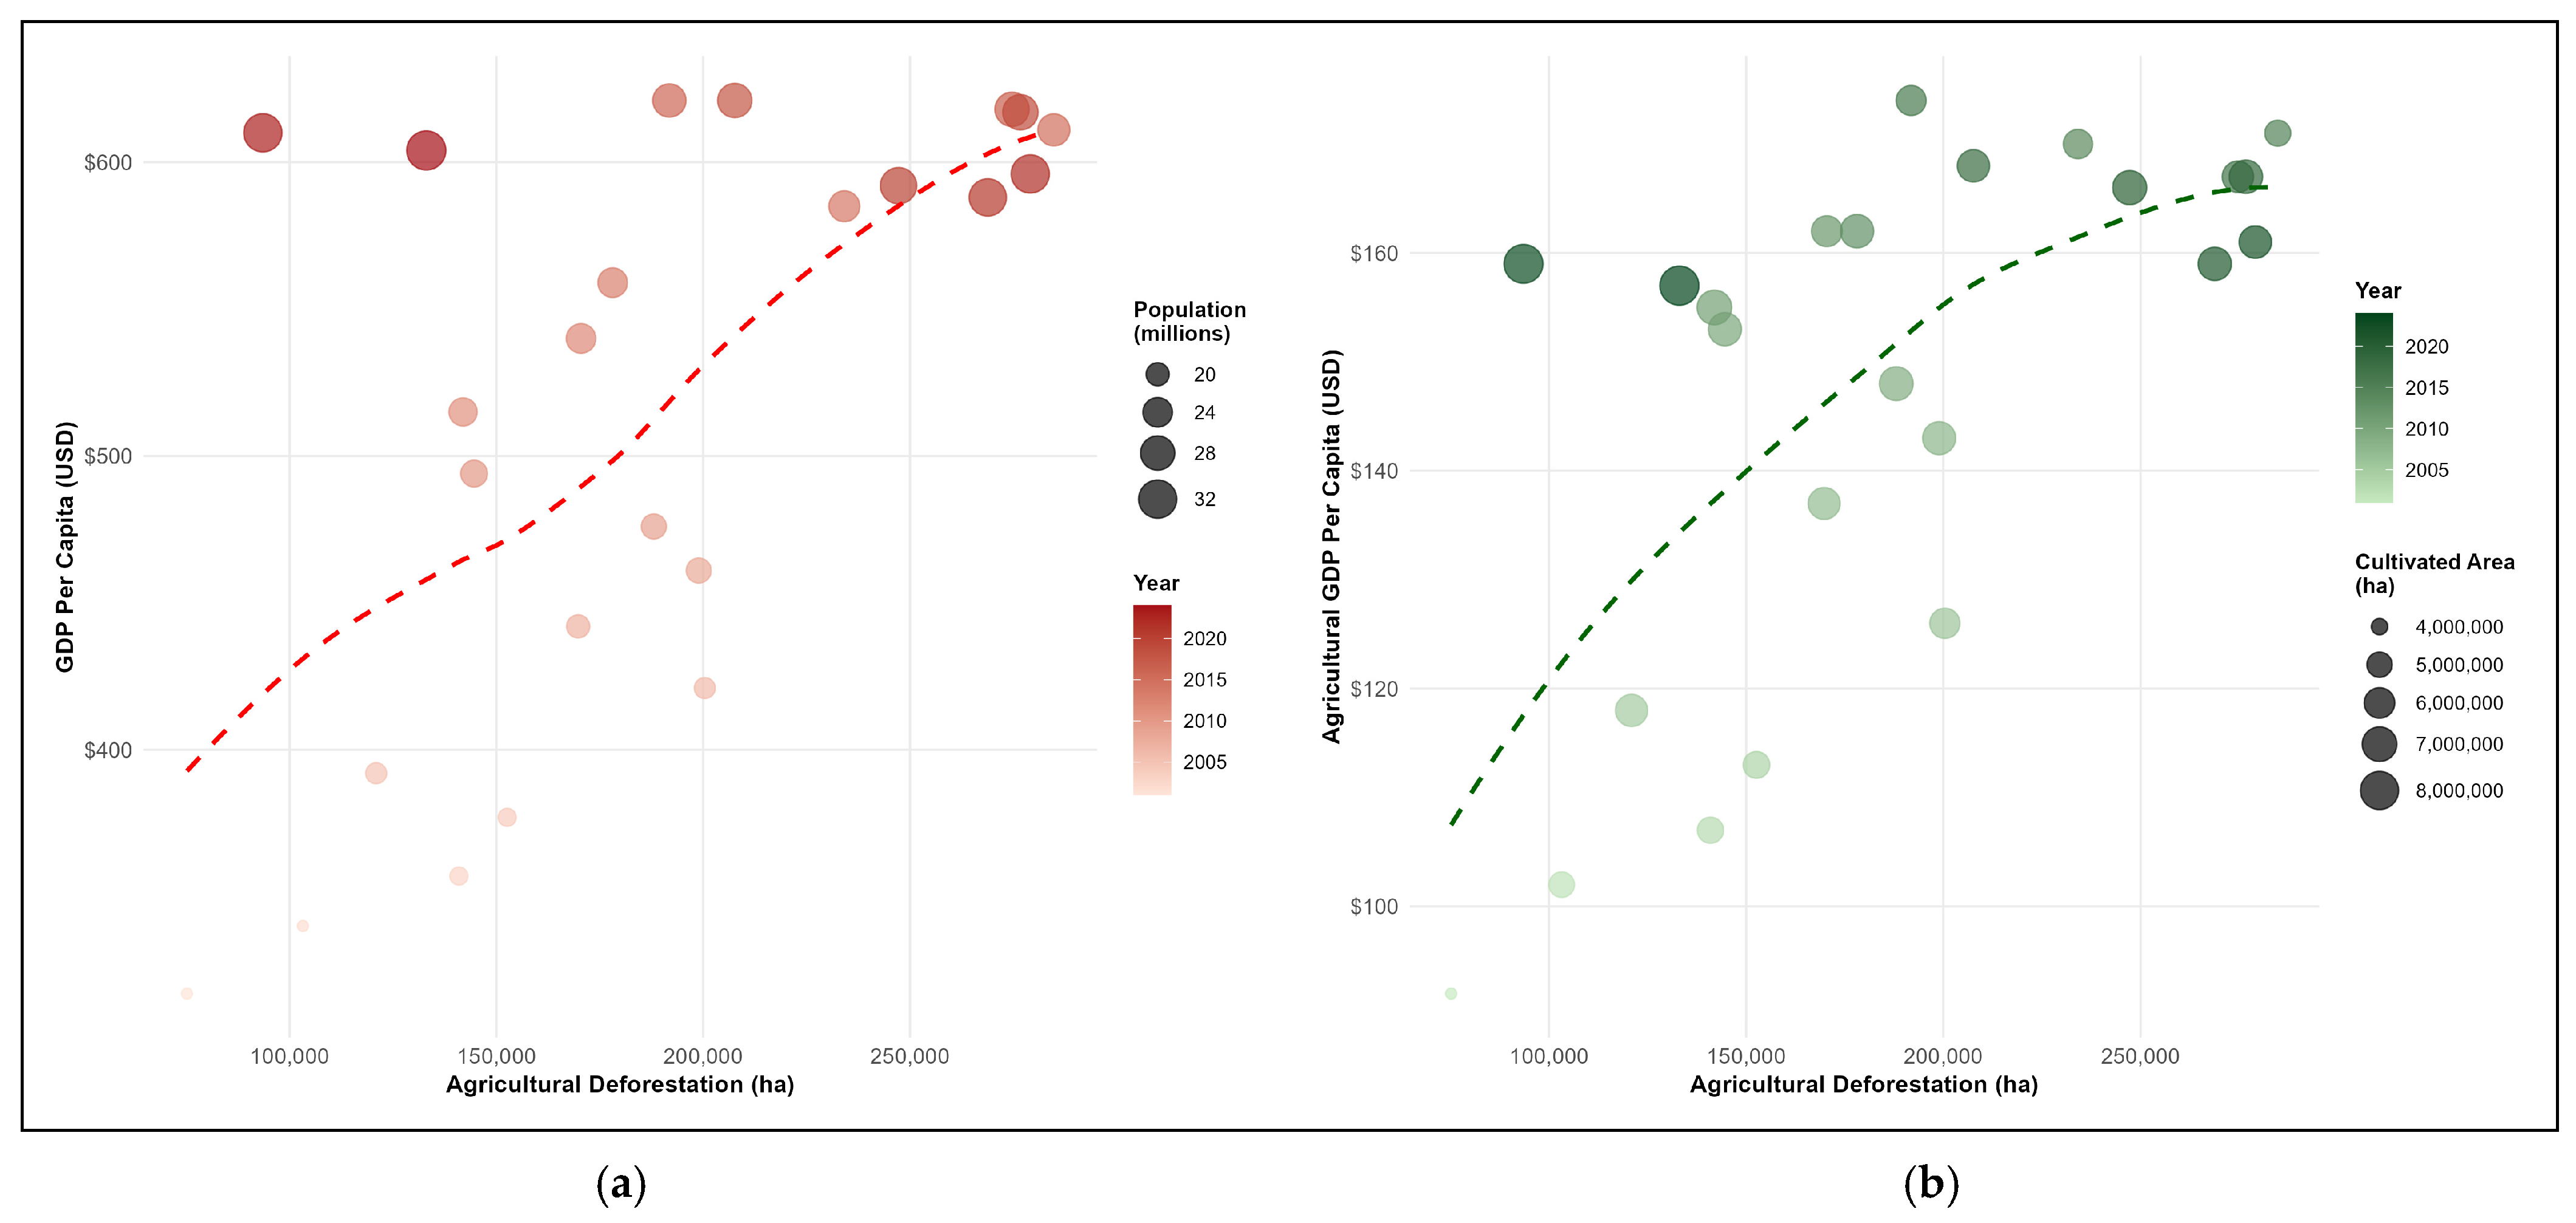
The relationship between agricultural deforestation and total GDP per capita reveals non-linear patterns across sub-periods (
Figure 14). The early years of the first sub-period (2001–2008) concentrate in the lower-left corner of the scatter plot, with low deforestation and low GDP per capita, presenting relatively close points indicating joint behavior. In the second period (2009–2016), dispersion increases dramatically, with years presenting similar deforestation but GDP per capita varying between USD 450–550, suggesting that factors beyond deforestation explain economic growth. In the third sub-period (2017–2024), notable divergence is observed: GDP per capita continues growing linearly while deforestation presents high variability, with points further right (high deforestation) not corresponding to higher GDP values.
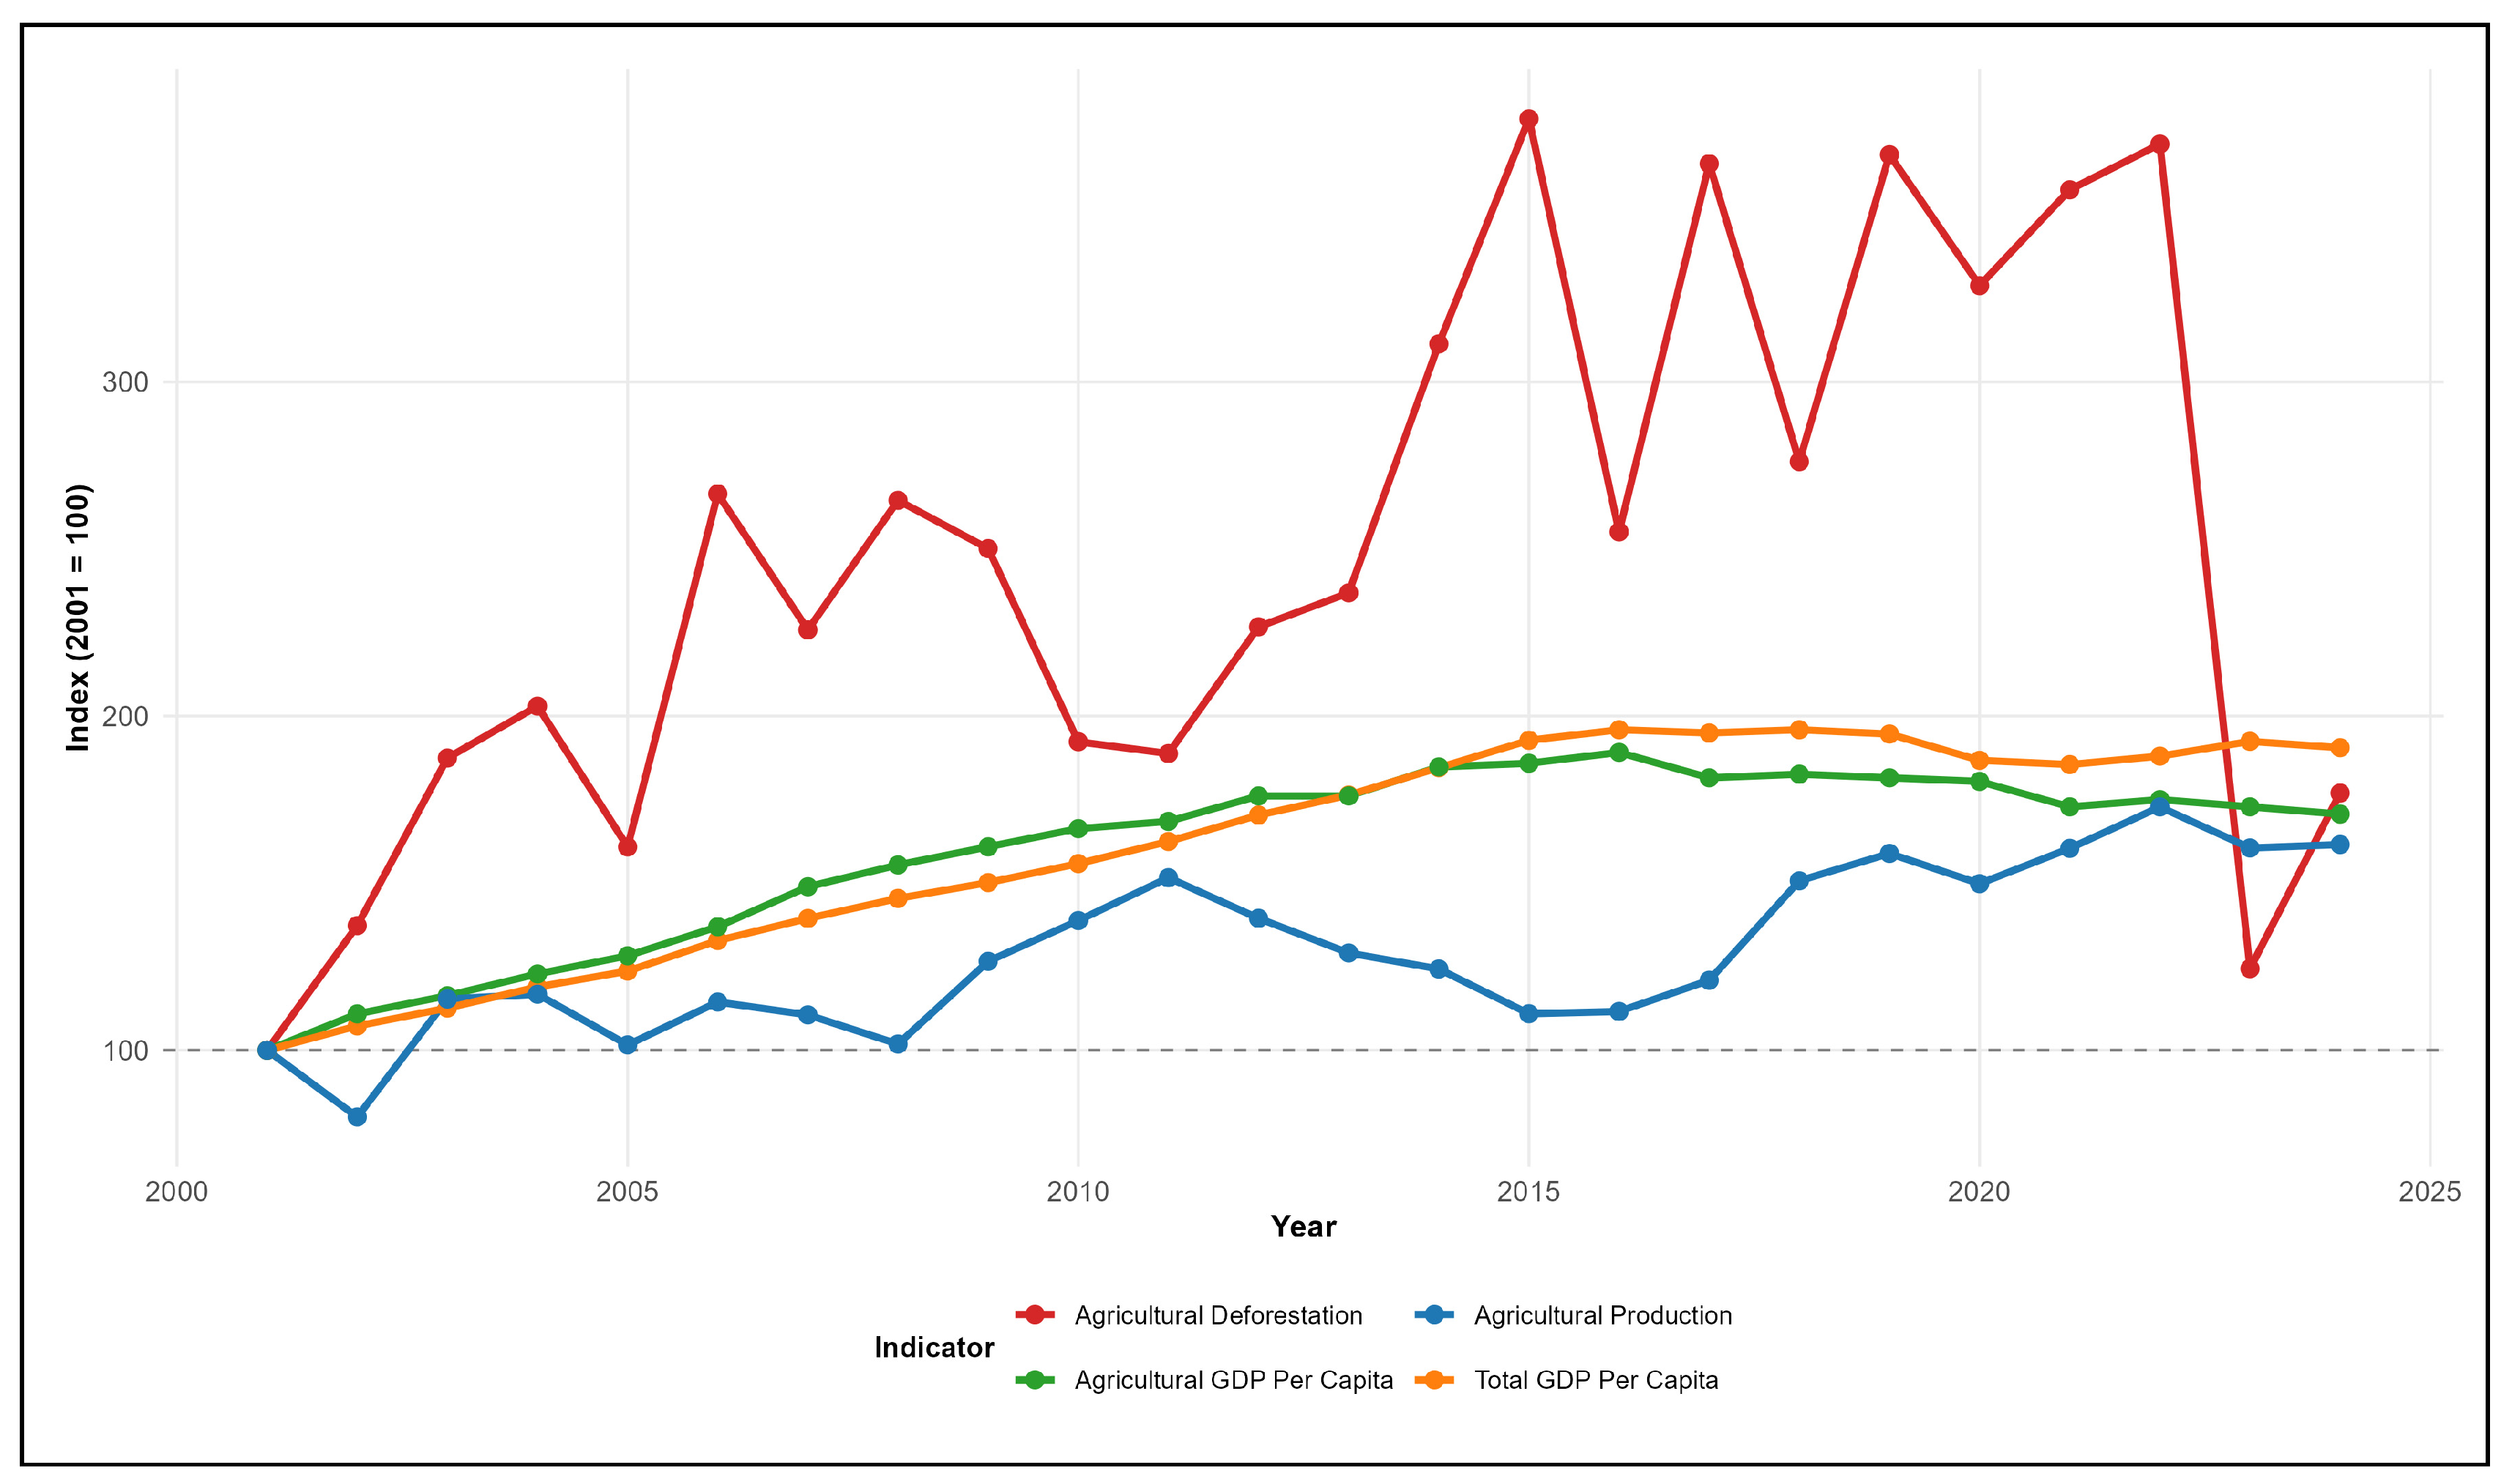
Indexed comparative evolution (base 2001 = 100) offers synthetic analysis of decoupling between deforestation and economic growth (
Figure 15). Agricultural deforestation presents extremely volatile trajectory, growing to an index of approximately 380 in 2015, followed by oscillations between 130 and 380, ending at index 177 in 2024 (total variation of +77%). In contrast, total GDP per capita presents linear and constant growth, from index 100 to 191, practically without significant oscillations (total variation of +91%). Agricultural GDP per capita also shows smooth and progressive growth, from index 100 to 171 (total variation of +71%), while total agricultural production grows moderately with some volatility, from index 100 to 162 (total variation of +62%).
Temporal analysis reveals three distinct phases: First sub-period (2001–2008): all variables grow jointly, suggesting that agricultural expansion via deforestation contributed simultaneously to GDP; Second sub-period (2009–2016): Initial decoupling is observed: agricultural deforestation shoots up to index 380 while total and agricultural GDP per capita grows moderately to indices 160–170, indicating that more deforestation does not generate proportionally more economic growth; Third sub-period (2017–2024): Decoupling consolidates: deforestation oscillates violently while total and agricultural GDP per capita continue stable ascending trajectories. Of particular note is year 2023, when deforestation falls to index 124 (below 2001 level) as total GDP reaches index 193 (nearly double 2001).
3.5. Deforestation and Cultivated Area: Asymmetric Dynamics
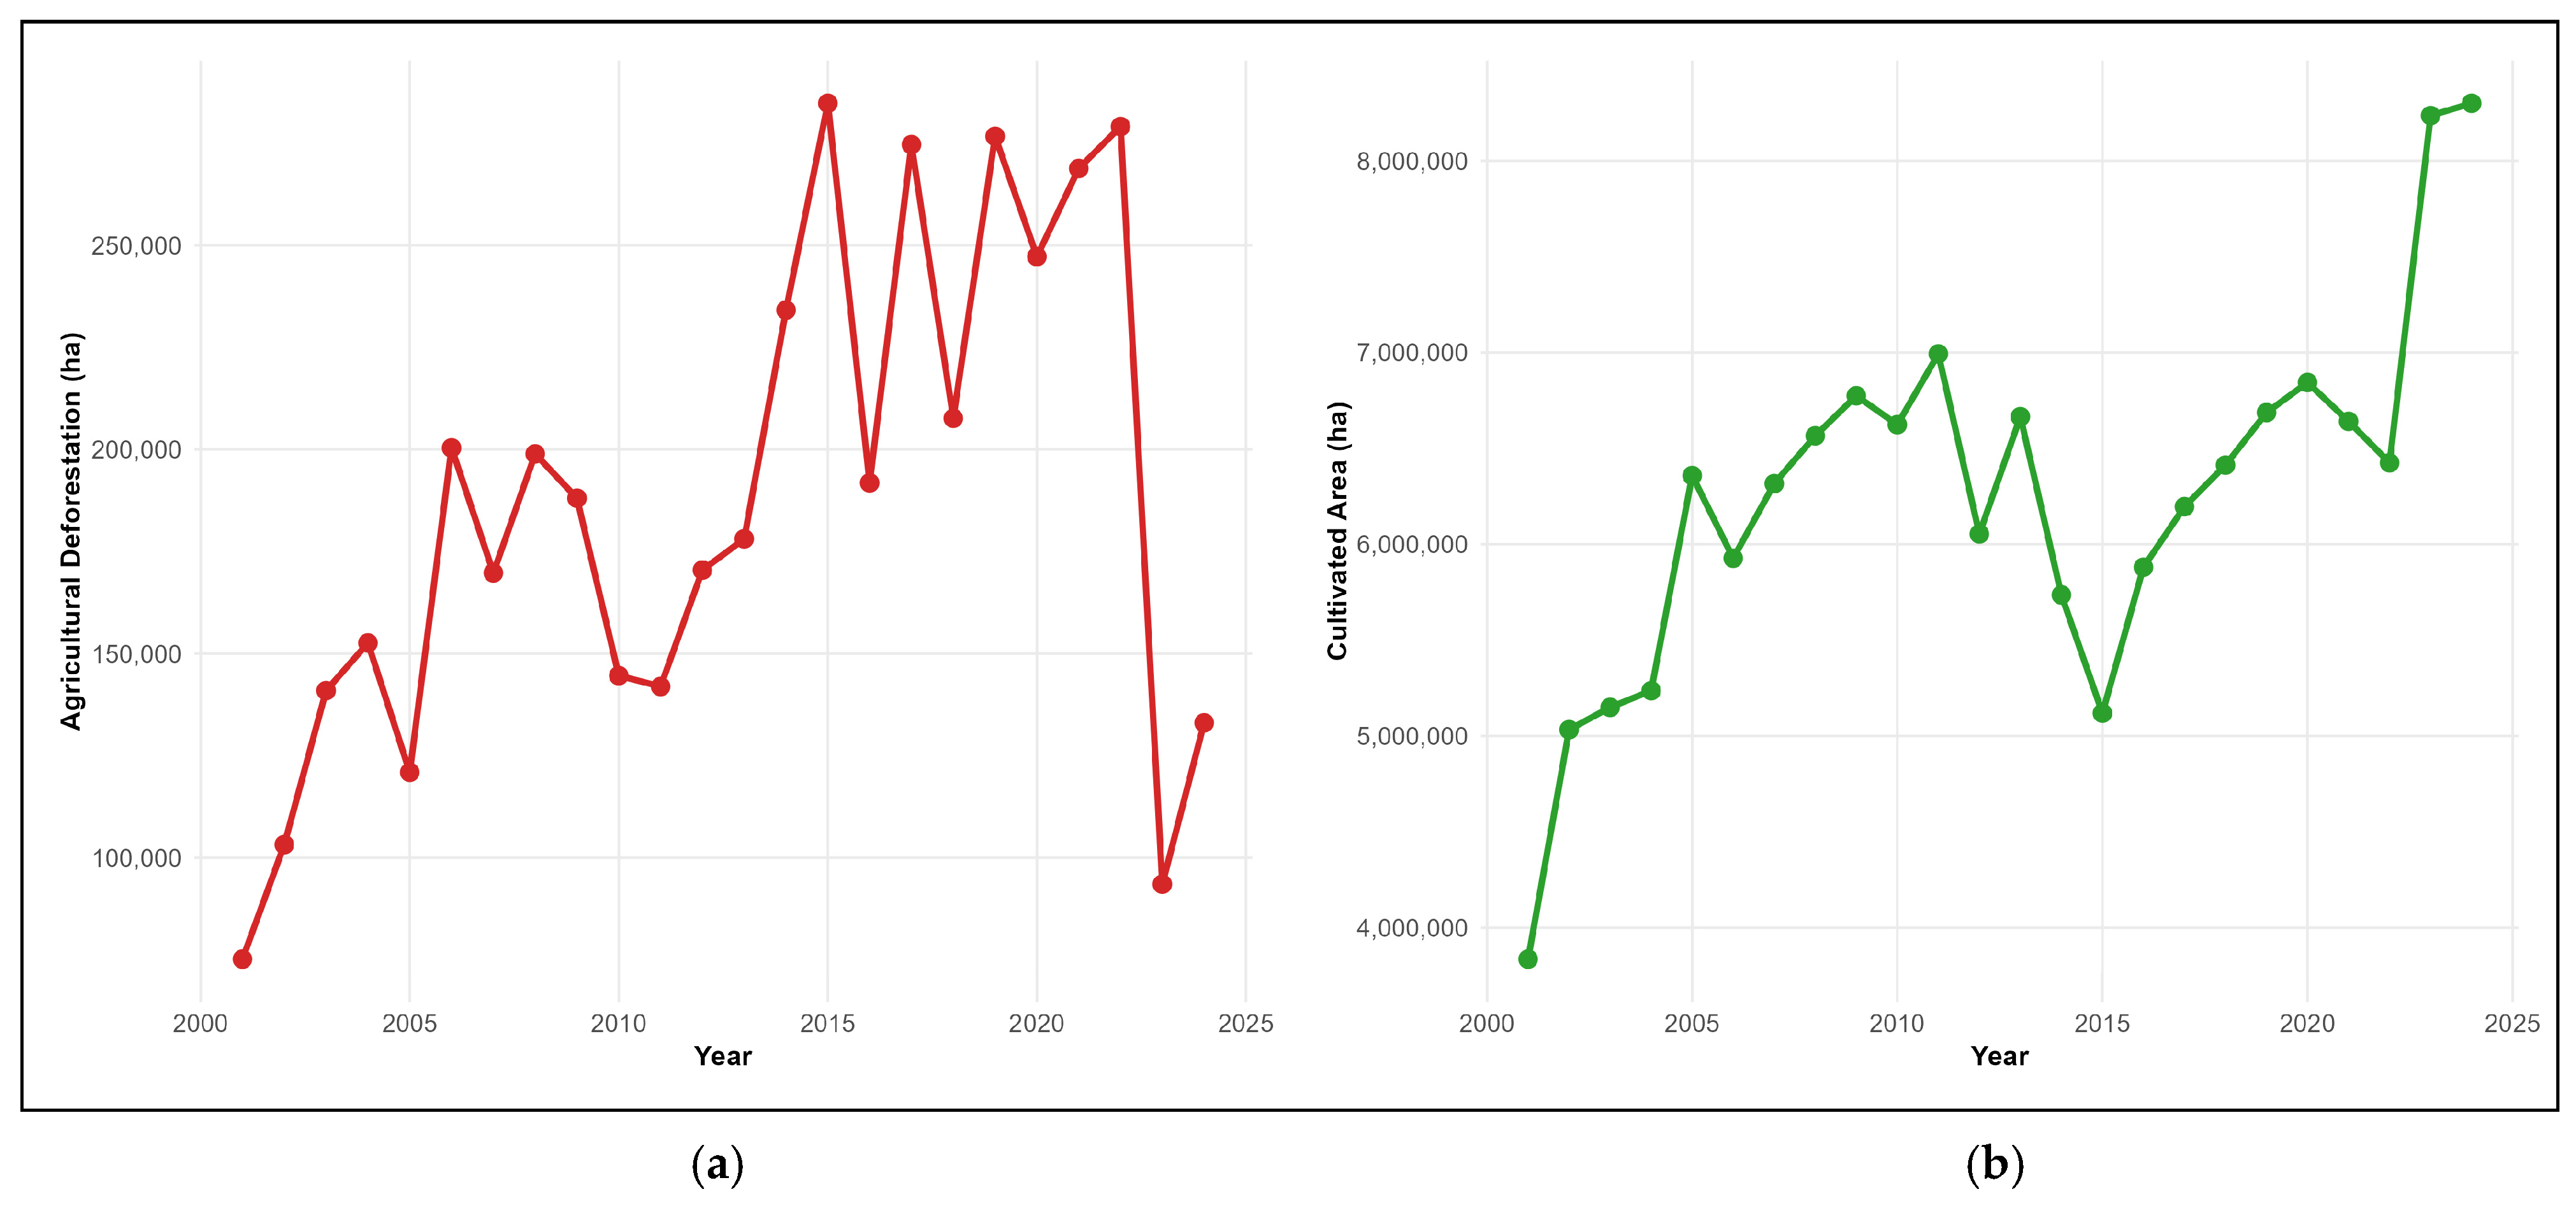
Juxtaposition of agricultural deforestation and cultivated area evolutions reveals important temporal asymmetries (
Figure 16). Deforestation presents high inter-annual variability, with peaks in 2006, 2015, 2017, 2019, and 2022, alternated with valleys in 2001, 2011, and 2023, generating a variation amplitude of 3.7 times between minimum and maximum (
Figure 16a). In contrast, cultivated area presents predominantly monotonic growth, with only two significant drops in 2012 and 2015, with expansion especially sharp after 2020, when it reaches historical values (
Figure 16b).
Temporal comparison reveals specific disconnections: between 2001 and 2005, deforestation grew approximately 100% while cultivated area grew 80%, suggesting proportional relationship; in 2006, deforestation surged 31% compared to the previous year, but cultivated area reduced 6%, characterizing negative disconnection; during 2009–2010, deforestation reduced 23%, but cultivated area remained stable, indicating maintenance of agriculture without new forest conversion; year 2015 registered the highest deforestation in the series (292,844 ha), however cultivated area was only 5.12 million ha (average value), evidencing that massive deforestation did not translate into equivalent cultivated area expansion; more recently, between 2023 and 2024, deforestation fell 66% and then recovered 41%, but cultivated area grew 29% in the period, reaching a historical maximum of 8.30 million ha.
These patterns demonstrate that cultivated area can grow without proportional deforestation through intensification, use of already cleared lands, or conversion of non-forest vegetation. The capacity of long time series (24 years) to detect recurrence and multi-annual patterns reveals that the relationship between annual deforestation and cultivated area is neither linear nor contemporary. Deforestation in a given year (
t) creates a stock of cultivable land that can be used and reused in years
t + 1,
t + 2 …
t +
n, explaining why cultivated area can grow 116.4% while annual deforestation remains relatively stable [
54,
55].
3.6. Variation and Effects of Deforestation by Sub-Period
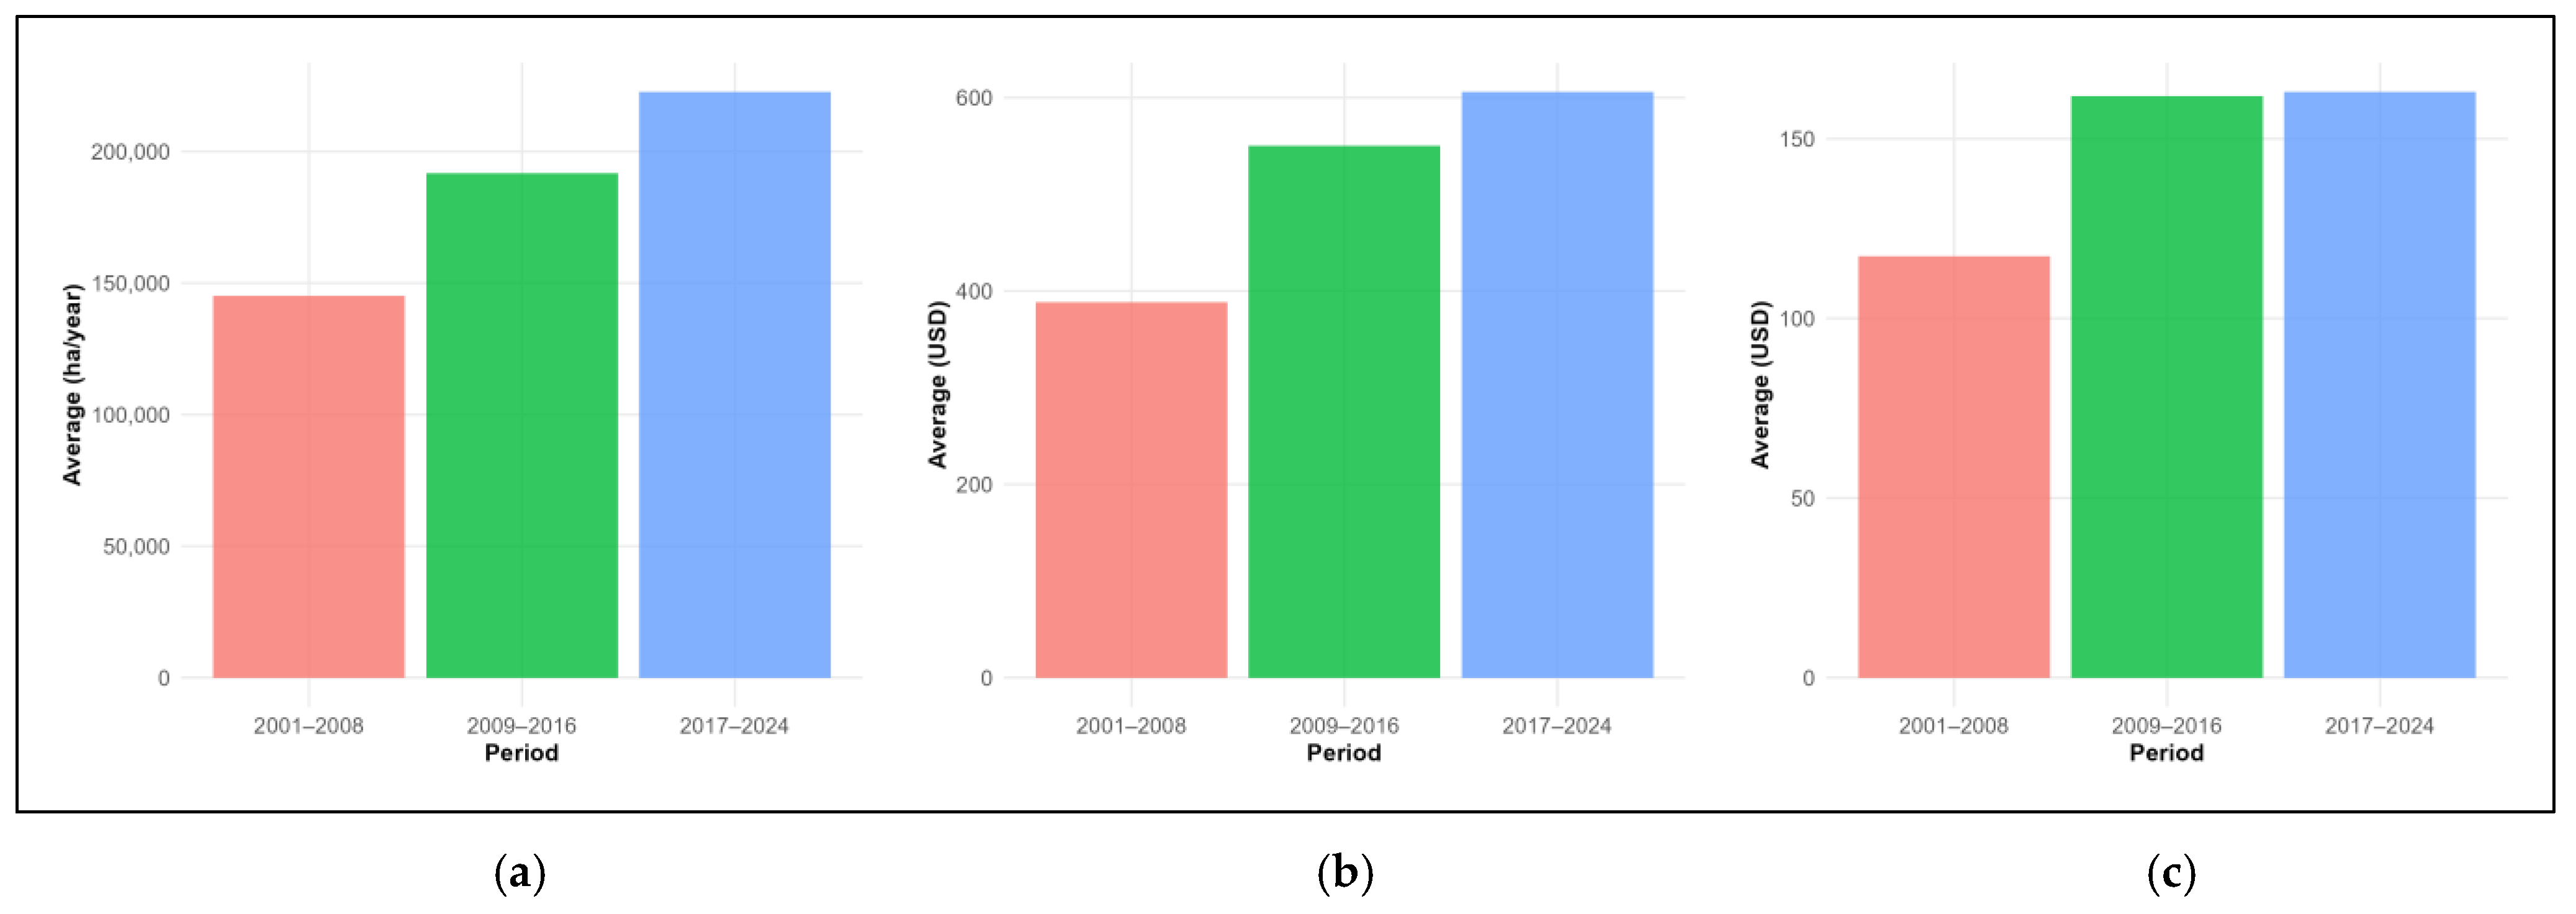
Comparison of means between three consecutive 8-year sub-periods systematizes structural changes (
Figure 17). Average agricultural deforestation grew from 145,248 ha/year in the first sub-period to 191,742 ha/year in the second (+32.0%) and 222,592 ha/year in the third (+16.1% compared to previous, representing +53.2% compared to initial sub-period) (
Figure 17a). Average total GDP per capita evolved from USD 388 to USD 550 (+41.8%) and, subsequently, to USD 606 (+10.2%, totaling +56.0% compared to initial sub-period) (
Figure 17b). Average agricultural GDP per capita grew from USD 117 to USD 162 (+38.5%) and practically stagnated at USD 163 (+0.6%, accumulating +39.0% since initial sub-period) (
Figure 17c).
Statistical analysis of the significance of observed differences between three sub-periods was preceded by rigorous verification of statistical assumptions for all eight analyzed variables (detailed results in
Appendix A). Normality tests (Shapiro–Wilk) revealed violations for agricultural deforestation in sub-period 2017–2024 (W = 0.799,
p = 0.028) and for cultivated area in the same sub-period (W = 0.775,
p = 0.016), suggesting the presence of outliers or asymmetric distributions caused by an abrupt deforestation drop in 2023 and accelerated cultivated area expansion in 2023–2024. Homogeneity of variances tests (Levene) identified heterogeneity for GDP per capita (F = 5.88,
p = 0.009), agricultural GDP per capita (F = 4.98,
p = 0.017), and agricultural credit (F = 10.48,
p = 0.001).
Table 1 presents the consolidated results of expanded variance analysis.
Statistical comparison reveals differentiated patterns: (i) Agricultural deforestation: no statistically significant differences were detected between three sub-periods (H(2) = 5.47; p = 0.065), indicating that observed numerical growth of 53% is within expected variability, reinforcing interpretation of the relative stability of deforestation over two decades and supporting the decoupling hypothesis; (ii) GDP per capita and agricultural GDP per capita: highly significant differences (p < 0.001) in the first sub-period presented significantly lower values than subsequent ones, which did not differ from each other. Stagnation of agricultural GDP per capita between sub-periods 2 and 3 contrasts strongly with the continuous growth of total GDP per capita, evidencing a reduction in agriculture’s proportional contribution to national economic growth; (iii) Cultivated area presented significant differences (H(2) = 8.61, p = 0.013), but post hoc tests did not identify specific pairs differing significantly, suggesting gradual and continuous expansion; (iv) Agricultural productivity did not present significant differences (F(2,21) = 2.13, p = 0.144), confirming that the observed 15% growth is within expected variability and does not configure statistically robust structural change, combined with significant cultivated area expansion, confirming the predominance of the extensive agricultural growth model; (v) Population presented highly significant differences with all sub-periods differing from each other (F(2,21) = 85.80; p < 0.001), evidencing continuous, accelerated, and statistically robust demographic growth that practically doubled national population (+95%); (vi) Agricultural employment presented the clearest pattern of structural transformation, with all sub-periods differing significantly from each other (F(2,21) = 71.33; p < 0.001), indicating consistent and accelerated labor migration to urban, industrial, and service sectors; (vii) Agricultural credit presented highly significant differences (H(2) = 15.68; p < 0.001), with explosive growth from the first to second sub-period (+367%), followed by stabilization in the third (+11%).
4. Discussion
4.1. Progressive Decoupling and Structural Transformation
Results demonstrate a process of relative decoupling between economic expansion and deforestation in Mozambique, characterized by the statistical stability of agricultural deforestation (
p = 0.065) despite significant growth in total GDP per capita (+56.0%) and agricultural GDP per capita (+39.0%) over nearly two-and-a-half decades. This pattern contrasts with the classical hypothesis that initial growth in agrarian economies necessarily intensifies pressure on forest resources [
56,
57].
Mozambique’s economic structural transformation provides the explanatory context for this phenomenon. Agriculture’s relative participation in national GDP declined from approximately 29% in 2001 to 26% in 2024, while industrial sectors (from 25% to 28%) and especially services (from 42% to 50%) expanded. This sectoral transition, although still in an early phase, is consistent with development economic patterns described by Kuznets [
58] and Chenery and Syrquin [
59], in which GDP per capita growth correlates with economic diversification and reduction of dependence on land-intensive primary sectors.
This partial decoupling can be interpreted through the EKC lens, which postulates an inverted U-shaped relationship between per capita income and environmental degradation [
5]. From this perspective, Mozambique, with a GDP per capita of USD 604 in 2024, would still be expected to remain at low-income stages typically associated with increasing environmental pressure. However, signs of deforestation stabilization (especially the abrupt drop in 2023–2024) suggest premature inflection, possibly driven by institutional and technological factors absent in the historical transitions of developed countries. The observed stabilization of agricultural deforestation at income levels far below historical EKC thresholds does not indicate a completed EKC turning point but, rather, an early and fragile phase of relative decoupling. Mozambique’s recent growth has been driven largely by capital-intensive extractive sectors and services, generating GDP expansion without broad-based rural transformation.
Empirical studies in similar contexts reinforce this interpretation. Culas [
7] documented an inflection point in Vietnam’s deforestation at GDP per capita of USD 1400, significantly below the USD 8000–10,000 threshold identified by Mather and Needle [
8] in developed economies. Bhattarai and Hammig [
6], analyzing 66 developing countries in Latin America, observed inflection points varying between USD 1000 and USD 3500, depending on specific institutional and structural characteristics. Cropper and Griffiths [
60], in an analysis of 64 African and Latin American countries, identified thresholds between USD 4760 and USD 5420 for deforestation. DeFries et al. [
10] argue that urbanization and economic diversification reduce dependence on agricultural expansion before even reaching high incomes, particularly when accompanied by governance improvements and access to non-agricultural markets.
For Mozambique, three specific mechanisms of structural transformation appear to have contributed to the observed decoupling: (i) Rural–urban migration and income diversification: agricultural employment proportion declined significantly from 79.0% (2001–2008) to 70.9% (2017–2024) of national labor force, indicating that a growing portion of the population obtains income outside agriculture, reducing per capita pressure on forest lands. This process is consistent with the “structural transition” described by Timmer and Akkus [
61], in which growing agricultural productivity allows labor reallocation to non-agricultural sectors; (ii) Services sector growth and informal urban economy: services expansion from 42% to 50% of GDP reflects growth in commercial activities, transport, communications, and financial services, particularly in urban centers. This growth absorbs part of the labor force that would otherwise pressure agricultural and forest resources; (iii) Aggregate economic productivity growth: although agricultural productivity stagnated (
p = 0.144), total economic productivity, measured by GDP per capita, grew substantially. This suggests that Mozambique’s economic growth is increasingly disconnected from mere physical agricultural expansion—a pattern observed by Rudel et al. [
9] in countries initiating forest transitions.
However, it is crucial to emphasize that this decoupling is relative and incipient. Annual agricultural deforestation, although statistically stable in trend terms, remains elevated in absolute terms (average of 185,860 ha/year during 2001–2024), and observed stabilization in 2023/24 does not yet represent net reversal (reforestation) as in advanced stages of forest transition [
8]. Mozambique’s trajectory suggests an initial stabilization phase, characteristic of what Rudel et al. [
9] denominate “forest transition via economic development,” in contrast with “transition via forest scarcity” observed in regions with already extensively degraded forests.
4.2. Extensive Expansion Paradox: Divergence from Boserup Predictions
The identified agricultural efficiency paradox, where cultivated area grew 116.4%, total production grew 61.5%, but productivity fell 25.3%, is evidence that challenges central predictions of Boserup’s [
22] induced innovation theory and Hayami and Ruttan’s theory [
18]. Boserup’s theory postulates that growing demographic pressure (population doubled from 17 to 33 million) should induce agricultural intensification through adoption of land-saving technologies, resulting in increased productivity per hectare. However, results demonstrate the opposite trajectory: Mozambique responded to demographic pressure through persistent extensive expansion, incorporating marginal lands that diluted national average productivity.
This divergence can be explained through Binswanger and Pingali’s [
62] theoretical framework on necessary conditions for induced intensification. The authors identified that transition from extensive to intensive agriculture simultaneously requires (1) growing land scarcity making expansion more costly than intensification; (2) transport infrastructure enabling market access; (3) availability of appropriate technologies; (4) functional credit and extension institutions; (5) secure property rights incentivizing long-term investments.
The Mozambican context lacks adherence to several of Binswanger and Pingali’s [
62] conditions. First, land remains abundant in aggregate terms: a population density of 41 inhabitants/km
2 in 2024 is substantially below thresholds where land scarcity typically induces intensification (>150–200 inhabitants/km
2) [
63]. This abundance makes extensive expansion economically rational given costs and risks of intensification. Second, transport infrastructure remains deficient, with a road density of 0.17 km/km
2 versus 0.50–1.00 in countries that completed intensification [
4], elevating fertilizer transport costs to rural regions and making intensification economically unviable.
Third, technological adoption remains critically low: fertilizer use by <4% of farmers, improved seeds <12%, irrigation <2% [
16], and these are precisely the technologies that enabled the Asian green revolution, where cereal production grew 135% with only 15% area expansion between 1965–1990 [
64]. This low adoption reflects not only credit constraints but also the absence of appropriate technologies in African contexts: improved seed varieties developed for irrigation and intensive fertilization present inferior performance to local varieties under rainfed agriculture conditions with minimal fertilization [
16].
Fourth, land tenure insecurity documented by Byerlee et al. [
17], where 85–95% of land operates under non-titled customary regimes, disincentivizes long-term investments in soil improvement. Without guarantee of future use rights, farmers rationally prefer expansion strategies through conversion of new areas (where they establish customary rights through cultivation) instead of investing in already-cultivated lands that may be contested.
This persistence of extensive expansion despite successive intensification programs (PEDSA 2010–2019, PNISA 2013–2017, SUSTENTA 2020–present) suggests a need for fundamental reorientation. Instead of vertical short-medium-term programs with ambitious quantitative targets, sustainable transformation may require long-term horizontal investments in structural fundamentals: universal land titling, extensive rural infrastructure, adaptive agricultural research, and gradual construction of human capital through rural education. Through establishment of these foundations, agricultural financing may effectively catalyze intensification instead of perpetuating extensive expansion.
Additionally, the Mozambican experience contrasts dramatically with the “Machakos paradox” documented by Tiffen et al. [
65] in Kenya, where population density quadrupling between 1930–1990 was accompanied by a simultaneous increase in tree cover and productivity through terracing, agroforestry, and soil management. This divergence suggests that institutional and political context, not only demographic pressure, determines whether intensification occurs: Machakos benefited from substantial public investments in agricultural extension, infrastructure, subsidized credit, and land tenure security that facilitated transition—elements absent in Mozambique [
27].
4.3. Structural Transformation and Fragility of Decoupling
While statistical evidence points to progressive decoupling between economic growth and deforestation, deeper analysis reveals the structural fragility of this pattern. Mozambique’s economic growth during 2001–2024 concentrated in capital-intensive extractive sectors (aluminum, coal, natural gas) and urban services that generated macroeconomic modernization without absorbing rural population [
20,
21]. This dual structural duality produces a paradox where statistical decoupling coexists with persistence of microeconomic pressures on forests.
Jones and Tarp [
21] argue that Mozambique’s foreign direct investment (FDI) profile is characterized by low integration with local productive chains: mega-projects operate as enclaves importing equipment, technology, and even food, generating GDP growth through mineral exports without structural transformation that absorbs rural population in productive non-agricultural activities. The extreme volatility of FDI, oscillating between −USD 30.9 million (2019) and USD 563.7 million (2022), reflects this pattern of investment concentrated in capital-intensive natural resource projects with limited multiplier effects on rural economy.
The incomplete structural transformation, a central vulnerability constraining decoupling consolidation, is evidenced by agricultural employment evolution. Despite relative decline (from 81% to 69% of total population), absolute rural population dependent on agriculture increased by approximately 9 million people (from 13.8 to 22.8 million) due to overall population growth. The absence of dynamic sectors capable of absorbing rural population in productive non-agricultural activities means demographic pressures will continue to be channeled towards extensive cultivated area expansion. In this context, restrictive environmental policies in isolation tend to generate distributive conflicts without resolving structural causes, while sustainable decoupling consolidation fundamentally depends on inclusive economic diversification reducing dependence on subsistence agriculture.
This trajectory diverges from Asian transformations based on labor-intensive manufacturing, where structural transformation effectively absorbed rural populations [
61]. Mozambique’s pattern resembles the “premature deindustrialization” documented by Rodrik [
66] in SSA: economies transition directly from agriculture to low-productivity services (informal commerce, artisanal transport), skipping the labor-intensive industrialization phase that historically absorbed rural populations in East Asia. This “transformation without manufacturing” trajectory limits capacity to generate the massive number of formal jobs necessary to absorb growing rural population, perpetuating pressures on forest resources even in contexts of robust aggregate economic growth.
4.4. Climate Variability and Vulnerability
Climate variability, although balanced in terms of average SPI (9 dry years versus 9 wet), presented extreme events that intensified forest conversion in specific years. The severe drought of 2015–2016 (strongly negative SPI in both years) temporally coincided with an historical deforestation peak in 2015 (292,844 ha), consistent with mechanism proposed by Lambin and Meyfroidt [
54] where short-term climate shocks induce compensatory conversion: farmers respond to productivity losses in cultivated areas by expanding to new areas to maintain total production and food security.
The abrupt temperature jump from 24.0 °C to 25.0 °C in 2023–2024 may reflect long-term climate change effects or short-term El Niño, creating additional uncertainty. The Intergovernmental Panel on Climate Change (IPCC) [
55] projects that Mozambique will experience a temperature increase of 1.5–2.5 °C by 2050 and precipitation reduction of 5–15% in southern and central regions, intensifying water stress in rainfed agricultural systems, representing 98% of national agriculture. This growing climate vulnerability may reverse observed decoupling if farmers respond by converting additional areas to compensate for climatically induced productivity losses.
4.5. Policy Implications
Evidence of relative decoupling creates political space for rigorous conservation without fear of compromising development. Demonstration that GDP grew 56% (2009–2024) while deforestation remained statistically stable (
p = 0.065) challenges the narrative of inevitable trade-off between conservation and development, creating an empirical basis to argue that forest protection does not compromise economic growth. This evidence can strengthen Mozambique’s position in REDD+ (Reducing Emissions from Deforestation and Forest Degradation) negotiations and access to international climate financing, demonstrating capacity for economic growth with forest stabilization [
67].
However, the agricultural expansion paradox with productivity dilution indicates the urgency of reorienting the agricultural strategy. Policies should prioritize sustainable intensification through (1) public investments in research and development of appropriate technologies (drought-tolerant varieties, integrated soil fertility management); (2) “smart” input subsidies targeted at farmers with adoption potential (instead of inefficient universal subsidies); (3) functional rural extension through farmer-to-farmer models that reduced dissemination costs in Malawi and Kenya [
68]. Evidence from Liverpool and Winter-Nelson [
69] indicates that intensification can increase production 25–30% without area expansion while simultaneously reducing forest pressure, creating a win–win between food security and conservation.
The dominance of subsistence agriculture requires differentiated policies. With 84.3% of deforestation attributable to permanent agriculture, effective policies must distinguish between commercial agriculture (subject to regulation through licensing) and family subsistence agriculture (requiring participatory approaches). For family farming, policies should (1) strengthen community land rights through customary land demarcation, reducing the insecurity perpetuating extensive expansion [
17]; (2) promote agroforestry systems integrating agricultural production and tree conservation [
70]; (3) facilitate market access through rural infrastructure, reducing transaction costs forcing low-value self-sufficiency.
Governance fragility requires profound institutional reforms: (1) land titling through national cadaster, creating legal security for long-term investments; (2) strengthening forest monitoring through real-time remote-sensing technologies (GFW), increasing the probability of detecting illegal deforestation; (3) effectively decentralizing forest management to local communities through community DUATs, creating local incentives for conservation [
27]. Persistent demographic pressure requires long-term integrated approach combining (1) forest conservation through effectively managed protected areas; (2) sustainable agricultural intensification releasing pressure on forests; (3) accelerated creation of non-agricultural urban jobs through industrialization and services; (4) investments in family planning and women’s education to accelerate demographic transition, reducing long-term population growth [
71].
4.6. Limitations and Future Research
This analysis has limitations, contextualizing its interpretations, and pointing paths for future investigation. First, this study faces several limitations. The national time series includes only 24 annual observations, limiting the feasibility of robust econometric estimation of non-linear relationships such as the EKC. Short time series reduce statistical power and heighten sensitivity to extreme values and structural shocks.
Second, national aggregation masks provincial heterogeneities: Zambézia lost 1.26 million ha (19% of initial cover) versus Maputo, which lost 329 thousand ha (9%). Future analyses should explore whether decoupling occurs uniformly or if some provinces maintain dependence on forest conversion while others have already transitioned. Provincial panel methodologies with fixed effects would allow isolating deforestation drivers to be controlled for unobserved regional heterogeneities.
Third, crop aggregation prevents identification of the sources of agricultural growth. Agricultural GDP data aggregate subsistence crops (cassava, maize) and commercial crops (tobacco, cotton), preventing identification of whether growth comes from high-value crop intensification or simply area expansion of traditional low-productivity crops. Future analyses with disaggregated crop-level data would allow for the testing of the hypothesis of subsistence-to-commercialization transition through comparison of production, area, and price growth rates by crop.
Fourth, the 24-year period may be insufficient for detecting complete structural transformations. Although long compared to existing Mozambican studies [
25,
27], complete structural transformations typically require 40–60 years [
61]. Incipient decoupling observed after 2010 represents only 14 years, a period potentially insufficient for confirming structural trend versus temporary phenomenon. Continuous monitoring over the next two decades will be critical to confirm whether decoupling persists and eventually results in complete forest transition with cover recovery.
Fifth, an absence of “teleconnections” analysis through trade is another limitation. The analysis did not incorporate agricultural trade data (exports/imports), preventing testing the “displacement effect” hypothesis documented by Meyfroidt et al. [
72], where domestic deforestation stabilization is accompanied by pressure transfer through agricultural commodity imports from regions with active deforestation. Future analyses integrating agricultural trade balances and “forest footprint” assessment of imports would provide a more complete perspective on the global sustainability of observed patterns.
5. Conclusions
This study investigated whether Mozambique exhibits decoupling between agricultural deforestation and economic growth during its development process from 2001 to 2024. The evidence suggests that such decoupling is emerging, but remains fundamentally fragile, occurring through a dual economic structure that generates statistical stabilization without resolving the underlying drivers of deforestation.
The analysis reveals three interrelated phenomena that challenge conventional theoretical expectations. First, forest stabilization appears to be occurring at income levels far below historical transition thresholds, driven not by broad-based structural transformation but by growth concentrated in capital-intensive extractive sectors disconnected from rural livelihoods. Second, agricultural expansion persists through extensive land incorporation rather than productivity intensification, contradicting predictions that demographic pressure induces technological change under land scarcity. Third, macroeconomic diversification coexists with absolute growth in the agricultural population, meaning that statistical decoupling at the national level masks intensifying microeconomic pressures at the household level.
These findings carry important theoretical implications. The EKC framework, while useful for identifying potential transition patterns, has limited explanatory power in contexts where economic growth bypasses rural transformation. Income thresholds derived from historical experiences in Europe and Asia do not fully capture contemporary African realities, where extractive enclaves generate GDP expansion without employment creation and institutional weaknesses prevent demographic pressure from triggering intensification. Mozambique’s trajectory suggests that forest transitions in low-income Africa may follow qualitatively distinct pathways that require analytical frameworks privileging institutional quality, growth composition, and distributional dynamics over aggregate income levels.
From a policy perspective, the critical insight is that observed stabilization represents an opportunity rather than an achievement. Current patterns could consolidate into a sustainable transition if complementary structural reforms address the institutional foundations for agricultural intensification, economic diversification absorbs rural population growth, land tenure security incentivizes long-term investment, and climate adaptation reduces vulnerability to shocks. Conversely, these patterns may collapse under demographic pressure, climatic stress, or commodity-driven expansion if underlying structural weaknesses persist. The window created by premature decoupling therefore demands urgent action on fundamentals—particularly land governance reform, agricultural research systems, rural infrastructure, and inclusive industrial policy—rather than isolated environmental restrictions that risk imposing conservation costs on populations lacking economic alternatives.
Three priorities emerge for future research. First, comparative analyses across Sub-Saharan African countries experiencing similar dual growth patterns could identify institutional configurations under which premature decoupling consolidates or collapses. Second, longitudinal household-level studies linking land-use decisions to economic opportunities, climate shocks, and tenure security would illuminate mechanisms operating beneath national aggregates. Third, policy experiments testing integrated interventions that combine agricultural intensification support with alternative livelihood creation could provide empirical guidance for navigating the tension between conservation imperatives and development needs.
Ultimately, Mozambique’s experience demonstrates that forest stabilization at low-income levels is possible but not inevitable—contingent rather than predetermined. Whether current patterns represent the beginning of a sustainable transition or a temporary pause before renewed expansion depends fundamentally on whether structural transformation can be redirected from its current exclusive trajectory toward inclusive pathways that reconcile economic growth, social equity, and environmental sustainability. The challenge is not choosing between forests and development, but, rather, building institutional and economic foundations in which both can advance together.




 ,
,