Abstract
Green coffee bean extracts (GCBEs) represent a promising alternative to improve ground beef’s microbial and oxidative stability. This study evaluated the content of bioactive metabolites, the antimicrobial and antioxidant activity of extracts obtained from GCBE with different solvents (W, water; E, ethanol; WE, water–ethanol), in comparison to textured soy protein extract (TSPE), and their effect on the microbial and antioxidant stability of meat homogenates. The results showed that the extraction solvent significantly affected the yield and metabolite content (p < 0.05), with GCBE-W and TSPE-WE as the highest performers (>20% by both). GCBE-E presented the highest (p < 0.05) tannin value (19.13 mg/100 g), while GCBE-W and GCBE-WE showed the highest (p < 0.05) flavonoids and chlorogenic acid content (1.19 and 11.20 mg/100 g, respectively). Regarding antimicrobial activity, GCBE-WE showed the highest (p < 0.05) inhibition against Staphylococcus aureus and Escherichia coli (31.11% and 41.94% of inhibition, respectively). In comparison, GCBE-E and GCBE-WE were significantly effective (p < 0.05) against Listeria monocytogenes and Salmonella typhimurium (44.79% and 31.25% of inhibition by both, respectively). Regarding antioxidant activity, GCBE-E and GCBE-WE presented the highest (p < 0.05) DPPH inhibition (92.79% by both), as well as the highest reducing power values (1.40 abs and 173.28 mg Fe2+/g by both). GCBE-WE significantly reduced (p < 0.05) the microbial load after heating in meat (1.21 log10 CFU/g), while GCBE-E and ASC showed the lowest (p < 0.05) pH values (5.74 by both). Furthermore, incorporating the extracts GCBE-E, GCBE-WE, and TSPE significantly reduced (p < 0.05) lipid oxidation (40, 45.71, and 48.57%), and affected (p < 0.05) color parameters. These findings suggest the potential of GCBEs as natural additives in the meat industry.
1. Introduction
The use of food additives is essential in the food industry to improve the quality and safety of products. For example, antimicrobial agents prevent or reduce the spoilage of foods by microorganisms (i.e., salt, vinegar, calcium propionate, sorbic acid, among others). Antioxidants prevent or mitigate the rancidity of foods (i.e., ascorbic acid, propyl gallate, butylhydroxytoluene, butyl hydroxyanisole, among others). However, the prolonged use of antimicrobials and synthetic antioxidants has raised concerns due to their possible negative impact on health, including developing resistance to microorganisms and being associated with diseases such as allergies and tumors [1]. Also, studies have shown that the excessive consumption of food additives is associated with cancer, skin conditions, alterations in gut microbiota, ulcerative colitis, and immune and mental dysfunction [2]. For this reason, there is a growing interest in the search for natural additives that can replace synthetic ones.
Green coffee beans are known for their high concentration of bioactive compounds, such as chlorogenic acid (family of esters of caffeic acid and quinic acid, including the isomers 3-CQA, 4-CQA, and 5-CQA; the latter being the most abundant in green coffee), which have antimicrobial and antioxidant properties. These properties are related to their ability to reduce microorganisms’ growth and neutralize reactive oxygen species [3,4,5]. Although coffee from Coffea arabica and Coffea canephora is the most consumed product worldwide, research on using green coffee bean extracts in food applications, particularly in meat products, is limited. In bakery products, the antimicrobial effect of bread enriched with ground green coffee beans has been reported [4]. A preliminary study reported that bread enriched with ground green coffee beans possessed the highest antioxidant activity [5]. Additionally, it has been reported that incorporating green coffee extracts into bread enhances the polyphenol content and antioxidant activity without adverse effects on sensory parameters [6]. For meat products, a previous investigation reported that incorporating green coffee extracts into restructured mutton blocks improves antimicrobial and oxidative stability during refrigerated storage [7]. Also, it has been demonstrated that green coffee bean extract can be used as a promising antioxidant to enhance the quality of raw and cooked pork patties during refrigerated storage [8].
However, most of these studies have focused on specific food matrices and have not explored the impact of using different solvents during the extraction process on the functional efficacy of the extracts from green coffee beans, simultaneously evaluating their antimicrobial and antioxidant properties and technological implications.
Ground meat is highly susceptible to microbial and oxidative deterioration due to its large surface area exposed during processing and its high proportion of nutrients, including fatty acids [9]. In this context, green coffee extracts represent a promising alternative to mitigate these problems by offering a natural solution with antimicrobial and antioxidant benefits. Therefore, this study aimed to analyze the metabolite composition of green coffee bean extracts, evaluate in vitro antimicrobial and antioxidant properties, and test effects on the microbial and oxidative stability of ground beef.
2. Materials and Methods
2.1. Extraction Yield
Green coffee beans from the species C. arabica were donated from a local commercial supplier (Café Combate®, Hermosillo, Mexico) and pulverized to obtain a particle size of 80 mesh (Bvmc-bmh26-rb, Mr. Coffee, Mexico City, Mexico). Textured soy protein was purchased (Soi-Yah!®, Montemorelos, Mexico) and used as a commercial standard, then subjected to the same procedures.
Metabolites from pulverized samples were obtained through ultrasound-assisted extraction at 42 kHz/25 °C/30 min (Branson 3800, Bransonic®, Danbury, CT, USA), using three solvents (water, ethanol, and water–ethanol mixture) as solvent extraction (1:10 solid–solvent ratio); these solvents were selected for their variable polarity, to maximize the recovery of bioactive metabolite. The resultant mixture was filtered (Whatman no. 1 filter paper), concentrated under reduced pressure at 150 rpm/60 °C (RE301BW, Yamato, Tokyo, Japan), and dried at 20 Pa/−80 °C/48 h (DC401, Yamato, Tokyo, Japan). The procedure was performed in triplicate, and the extraction yield was expressed as a percentage of dry extract relative to the initial weight of the solid [10].
The obtained extracts were tested at 5 mg/mL and subjected to metabolite, antimicrobial, and antioxidant assays.
2.2. Metabolite Assays
The vanillin–HCl method was used to determine the total condensed tannin content [11]. The reaction mixture was measured at 500 nm in a spectrophotometer (Multiskan, Thermo Scientific, Tokyo, Japan), and all measurements were corrected using a reagent blank (without sample). The assay was performed in triplicate, and the results were expressed as (+)-catechin equivalents, g CE/100 g extract (R2 = 0.9918; y = 0.0003x). The Folin–Ciocalteu method determined the total phenol content [11]. The reaction mixture was read at 750 nm, and all measurements were corrected using a reagent blank (without sample). The assay was performed in triplicate, and the results were expressed as gallic acid equivalents, g GAE/100 g extract (R2 = 0.9983; y = 0.002x). The aluminum chloride complex formation method was used to determine the total flavonoid content [11]. The reaction mixture was read at 415 nm, and all measurements were corrected using a reagent blank (without sample). The assay was performed in triplicate, and the results were expressed as quercetin equivalents, g QE/100 g extract (R2 = 0.9980; y = 0.0037x). The diazotization method determined the total chlorogenic acid content [12]. The reaction mixture was measured at 510 nm, and all measurements were corrected using a reagent blank (without sample). The assay was performed in triplicate, and the results were expressed as chlorogenic acid equivalents, g CAE/100 g extract (R2 = 0.9947; y = 0.0002x). In addition, the phenol–sulfuric acid method was performed to determine the total carbohydrate content [13]. The reaction mixture was read at 315 nm. All measurements were corrected using a reagent blank (without sample). The assay was performed in triplicate, and the results were expressed as glucose equivalents, g GE/100 g extract (R2 = 0.9918; y = 0.0003x).
2.3. Antimicrobial Assays
Food-borne pathogens, including Gram-positive (Staphylococcus aureus ATCC 29213B and Listeria monocytogenes ATCC 33090) and Gram-negative (Escherichia coli ATCC 25922 and Salmonella typhimurium ATCC 14028) bacteria strains, were initially reactivated in Brain Heart Infusion Agar and incubated at 37 °C for 24–48 h (IC403C, Yamato, Tokyo, Japan). Afterwards, the strain’s suspension was diluted with saline solution until it reached the turbidity of 0.5 McFarland standard, barium sulfate (ca. 1.5 × 10⁸ CFU/mL). The method’s accuracy was verified by using a spectrophotometer with a 1 cm light path; i.e., for the 0.5 McFarland standard, the absorbance at 620 nm should be 0.08 to 0.13 [14].
Subsequently, each extract (50 µL) was mixed with 50 µL of the cellular suspension (1.5 × 10⁸ CFU/mL) and incubated at 37 °C for 24 h. Chloramphenicol (100 µg/mL) was used as a positive control, and a broth solution was used as the negative control. After incubation, the absorbance was measured at 620 nm. All measurements were corrected using a reagent blank (i.e., without sample). The assay was performed in triplicate, and the results were expressed as a percentage of inhibition [14].
2.4. Antioxidant Assays
The antiradical DPPH (2,2-diphenyl-1-picrylhydrazyl) method was used to determine the free-radical scavenging activity [15]. Ascorbic acid (ASC) was used as a positive control; the reaction mixture was read at 517 nm, and all measurements were corrected using a reagent blank (without sample). The assay was performed in triplicate, and the results were expressed as a percentage of inhibition. Also, the antiradical ABTS (2,2′-azino-di(3-ethyl-benzathiazoline-sulphonic acid-(6)) method was used to determine the radical cation scavenging activity [15]. ASC was used as a positive control; the reaction mixture was read at 730 nm, and all measurements were corrected using a reagent blank (without sample). The assay was performed in triplicate, and the results were expressed as a percentage of inhibition.
The Prussian blue method determined the reducing power ability [16]. ASC was used as a positive control; the reaction mixture was read at 700 nm, and all measurements were corrected using a reagent blank (without sample). The assay was performed in triplicate, and the results were expressed as absorbance at the same wavelength. In addition, reducing power was also determined by the ferric-reducing antioxidant power [16]. ASC was used as a positive control; the reaction was read at 595 nm, and all measurements were corrected using a reagent blank (without sample). The assay was performed in triplicate, and the results were expressed as Fe2+ equivalents, mg Fe2+/g (R2 = 0.9992; y = 0.0022x).
2.5. Beef Meat Preparation
Fresh minced beef meat (pH >5.5; 73.5% of Semimembranosus muscle, adjusted to 20% of back fat, 1.5% of salt and 5% of added water) was purchased from a commercial supplier (JC®, Hermosillo, Mexico) and homogenized with d-water (1:10 ratio) at 6000 rpm (5 °C) for 1 min (Ultraturrax T25, IKA®, Staufen, Germany), and 1 mL of the respective antioxidants: control, without antioxidant; green coffee bean extract at 100 µg/g of meat, fresh weight (water, GCBE-W; ethanol, GCBE-E; water–ethanol, GCBE-WE); textured soy protein extract at 100 µg/g of meat, fresh weight (water, TSPE-W; ethanol, TSPE-E; and water–ethanol, TSPE-WE). The obtained meat homogenates were incubated at 52 °C for 120 min to accelerate lipid oxidation (pro-oxidant stability procedure). After that, meat homogenates were subjected to meat quality assays.
2.6. Meat Quality Assays
2.6.1. Pour Plate Method
This method determined the total aerobic mesophilic bacterial count [14]. Meat homogenates were aseptically homogenized with peptone water (0.1%, w/v) in a 1:10 ratio at 25 °C for 1 min using a stomacher (Seward Stomacher® 400, Norfolk, UK). After that, 1 mL of the appropriate dilutions was poured onto Petri dishes, using Plate Count Agar as the growth medium. The inoculated plates were incubated (EFR492, Frigidaire, Livingston, NJ, USA) at 37 °C for 48 h. The method’s detection limit was 1.0 log10 CFU/g, and selective media were not used, as specific pathogens were not evaluated. The assay was performed in triplicate, and the results were expressed as the log10 of colony-forming units/g of meat (log10 CFU/g).
2.6.2. pH Determination
Meat homogenates were subjected to pH evaluation using a potentiometer (pH211, Hanna, Woonsocket, RI, USA) and following the 981.12 method [17]. The equipment was calibrated using two buffer solutions (pH 4.01 and pH 7.00). The assay was performed in triplicate.
2.6.3. TBARS Method
The thiobarbituric acid reactive substance (TBARS) method determined the lipid oxidation status [18]. Meat homogenates were mixed with TCA (10%, w/v) in a ratio of 1:2 at 4500 rpm/5 °C for 1 min and centrifuged at 2500× g/5 °C for 20 min. After that, 2 mL of the filtered supernatant was mixed with 2 mL of 2-thiobarbituric acid (20 mM) and incubated in a water bath (RE301BW, Yamato, Tokyo, Japan) at 97 °C for 20 min. The absorbance was read at 531 nm. All measurements were corrected using a reagent blank (i.e., without sample). The assay was performed in triplicate, and the results were expressed as malondialdehyde equivalents, mg MDA/kg of meat (R2 = 0.9925; y = 96.554x + 0.0112).
2.6.4. CIELab Method
This method determined the color parameters [19]. The color was measured using a spectrophotometer (CM 508d, Konica Minolta Inc., Tokyo, Japan) with a D65 illuminant and a 10° observer calibrated with a white calibration cap (CM-A70). Lightness (L*), redness (a*), yellowness (b*), Chroma (C*), and hue (h*) were the recorded parameters. Meat homogenates were placed in a quartz cell, and ten measurements were made on the surface of each sample. The assay was performed in triplicate.
2.7. Statistical Analysis
Results were expressed as mean ± standard deviation (SD) from at least three independent experiments (n = 6). The data from metabolite, antioxidant, and antimicrobial assays were subjected to a one-way analysis of variance (ANOVA), including the treatments as the main effect. Also, data from meat quality assays were subjected to a 2-way ANOVA, using the treatments and the heating time as the fixed effects. Bartlett’s and Tukey–Kramer test was performed to determine variance homogeneity and differences at p < 0.05. All data were analyzed using the National Council of Social Studies (NCSS version -07) statistical software [20].
3. Results and Discussion
3.1. Extracts Metabolite Content
Table 1 presents the results of the metabolite content of the evaluated extracts. The results showed that these values were significantly affected by the solvent used during the extraction (p < 0.05). The results indicate that GCBE-W and TSPE-WE showed the highest extraction yield (p < 0.05). Regarding metabolite content, the results showed that GCBE-E and TSPE-E presented the highest tannin values (p < 0.05), while GCBE-E and GCBE-WE presented the highest phenol values (p < 0.05). Also, GCBE-W and GCBE-WE showed the highest flavonoid and chlorogenic acid values (p < 0.05), respectively. In addition, SPE-WE showed the highest carbohydrate values (p < 0.05).

Table 1.
Extraction yield and metabolite content of green coffee bean and soy protein extracts.
In agreement with this work, it has been reported that the GCBE from C. arabica obtained with a polar solvent (water > ethanol) showed the highest extraction yield [21]. In the same context, the highest extraction yield value reported for GCBE from C. arabica solvent polarity was increased [22]. Although research on the effect of the solvent on the tannin content in GCBE is limited, this group of compounds in GCBE-W from C. arabica has been reported [23]. In addition, it has been reported that the GCBE (an unreported coffee species) obtained with a polar reduced solvent (ethanol > water) showed the highest phenol content [24]. Also, it has been reported that the GCBE from C. canephora obtained with a polar solvent such as water presented the highest flavonoid content [25]. It is reported that the GCBE from C. arabica presented the highest total chlorogenic acid content when obtained as a mixture of a polar solvent with one of low polarity [22]. In contrast with this work, it has been reported that GCBE from C. arabica obtained with a reduced polar solvent (ethanol > water) showed the highest total carbohydrate content [21]. Concerning TSPE, total phenolic and flavonoid compounds in water–ethanol extracts have been reported [26,27].
In addition to caffeine and trigonelline, the most common alkaloids, chlorogenic acid is a family of phenolic compounds formed by the esterification of hydroxycinnamic acids, such as caffeic, ferulic, and p-coumaric acids, with quinic acid. In coffee, the major subclasses of chlorogenic acid include caffeoylquinic, dicaffeoylquinic, and feruloylquinic acids, each with multiple isomers. These compounds are characterized by exhibiting in vitro antimutagenic, anticarcinogenic, antiobesogenic, antimicrobial, and antioxidant activities, among others. For this reason, green coffee beans have been proposed as a functional ingredient for the pharmaceutical and food industries [3,5]. Concerning TSPE, the presence of phenolic acids (chlorogenic, caffeic, p-coumaric, and ferulic) and flavonoids (genistein, daidzein, and glycetein) has been reported [27].
3.2. Antimicrobial and Antioxidant Activity of Extracts
Figure 1 presents the results of the antimicrobial activity of the evaluated extracts. The results showed that these values were significantly affected by the solvent used during the extraction (p < 0.05). The antibiotic showed the highest (p < 0.05) S. aureus, L. monocytogenes, E. coli, and S. typhimurium growth inhibition (63.33, 65.63, 64.52, and 62.50% of inhibition, respectively). However, when comparing the treatments, GCBE-WE showed the highest (p < 0.05) growth inhibition against S. aureus and E. coli (31.11 and 41.94% of inhibition, respectively). At the same time, GCBE-E and GCBE-WE exerted the highest (p < 0.05) growth inhibition against L. monocytogenes and S. typhimurium (average values 44.79% and 31.25% of inhibition, respectively).
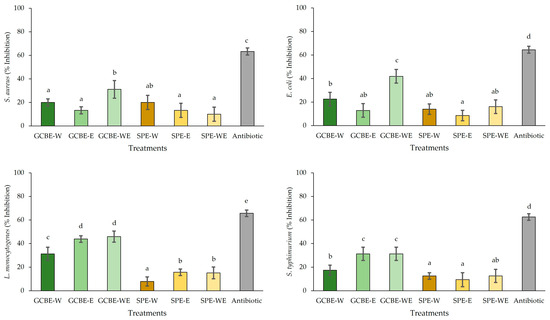
Figure 1.
Antimicrobial activity of green coffee bean and soy protein extracts. GCBE, green coffee bean extract; TSPE, textured soy protein extract; W, water; E, ethanol; and WE, water–ethanol. Different letters in each bar indicate significant differences between treatments at p < 0.05.
These results suggest that the choice of extraction solvent significantly influences the antimicrobial capacity of the extract, possibly due differences in solvent polarity, which affect the solubility and recovery of active phenolic compounds [28]. Specifically, the water–ethanol mixture (GCBE-WE) could have favored the extraction of a broader range of polyphenols with different polarities, resulting in greater antimicrobial efficacy against Gram-positive (S. aureus) and Gram-negative (E. coli) bacteria. Ethanol is known for its effectiveness in solubilizing moderately polar phenolic compounds, which could explain the greater inhibition observed with GCBE-E against L. monocytogenes and S. typhimurium.
Although research on the effect of the solvent on the antimicrobial effect of GCBE is limited, it has been demonstrated that the antimicrobial activity of GCBE from C. arabica against S. aureus, L. monocytogenes, E. coli, and S. typhimurium was associated with the polyphenol presence [29]. Additionally, it has been reported that GCBE from C. arabica exhibits an antimicrobial effect against E. coli, S. enteritidis, P. aeruginosa, S. aureus, L. monocytogenes, and E. faecalis [30]. Although studies on the antimicrobial activity of TSPE are limited, the antimicrobial effects of soy-derived products have been reported, mainly against Gram-positive rather than Gram-negative bacteria [31,32]. Several studies indicate that the antimicrobial effect of phenolic compounds is associated with the following mechanisms: the inhibition of membrane function due to changes in its permeability and inhibition of nucleic acids [33].
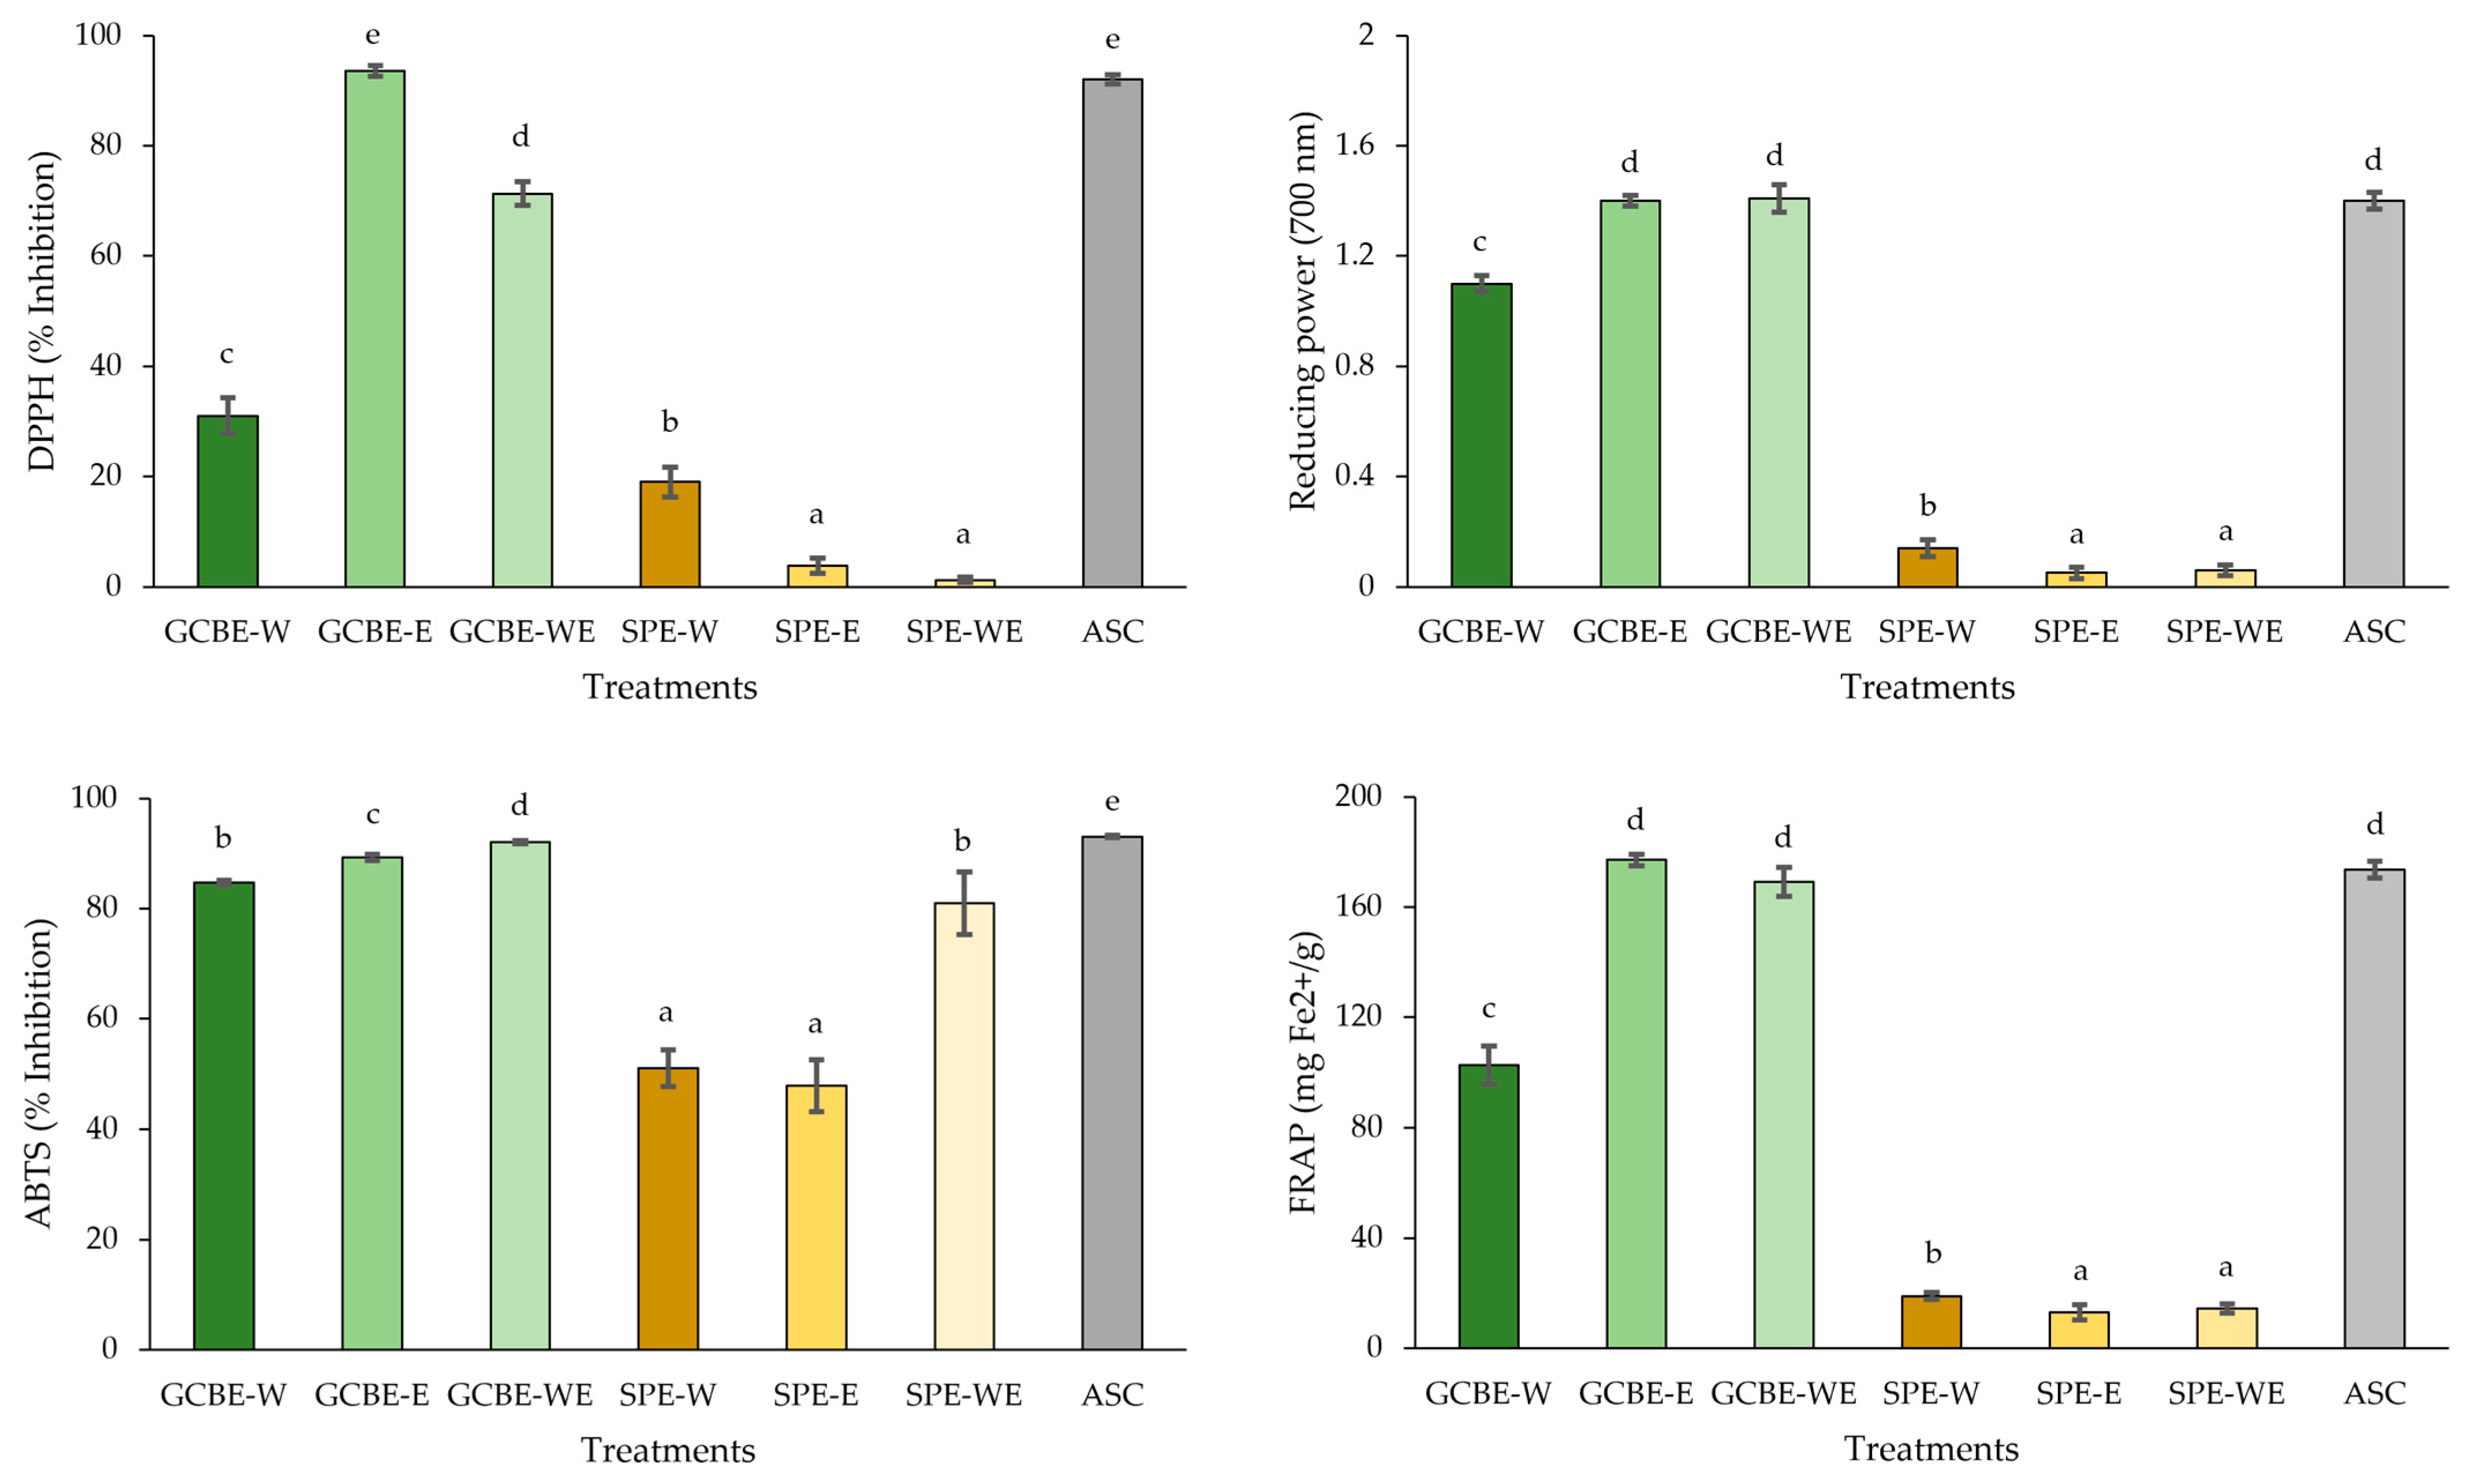
Figure 2 presents the results of the antioxidant activity of the evaluated extracts. The results showed that these values were significantly affected by the solvent used during the extraction (p < 0.05). Regarding antiradical properties, the synthetic antioxidant and GCBE-E showed the highest (p < 0.05) DPPH inhibition (average value 92.79% of inhibition, respectively) when compared with the control. In contrast, when comparing the treatments, the synthetic antioxidant and GCBE-WE showed higher DPPH inhibition (p < 0.05). In addition, ASC, GCBE-E, and GCBE-WE showed the highest (p < 0.05) reducing power and FRAP values (average value of 1.40 abs and 173.28 mg Fe2+/g, respectively).

Figure 2.
Antioxidant activity of green coffee bean and soy protein extracts. GCBE, green coffee bean extract; TSPE, textured soy protein extract; W, water; E, ethanol; WE, water–ethanol; and ASC, ascorbic acid. Different letters in each bar indicate significant differences between treatments at p < 0.05.
In agreement with this work, it has been reported that the GCBE from C. arabica obtained with a polar reduced solvent (ethanol > water) showed the highest DPPH% and ABTS% inhibition [21,24]. Another study showed that GCBE presented the highest activity against the DPPH radical from C. canephora obtained using low-polarity solvents [25]. Concerning reducing power, it has been reported that the GCBE from C. arabica exerts reducing power ability, which is associated with their primary phenolic acids [22]. Also, GCBE from C. arabica obtained with a reduced polar solvent (ethanol > water) exerted the highest FRAP values [34]. Concerning TSPE, antiradical (DPPH and ABTS) and reducing power activity (FRAP) in water–ethanol extracts have been reported [26].
3.3. Microbial and Oxidative Stability of Meat Homogenates
Table 2 presents the results of the microbial and oxidative stability of unheated and heated meat homogenates incorporated with GCBE and TSPE. The results showed that these values were significantly affected by the treatment × heating process (p < 0.001).
Table 2.
Effect of treatment × heating process on microbial and oxidative stability of meat homogenates.
Concerning unheated samples, no differences (p > 0.05) were found in TBC values. TBC values significantly decreased by the heating effect, and, when compared between heated samples, GCBE-WE showed the lowest (p < 0.05) TBC values when compared with the control; a reduction of 1.21 log10 CFU/g was observed.
For unheated samples, pH values significantly decreased by incorporating GCBE-WE and GCBE-E (p < 0.05). The heating effect significantly increased pH values (p < 0.05), and, when compared between heated samples, GCBE-E and ASC showed the lowest (p < 0.05) pH values; it was reduced by 2.21 and 2.55%, respectively.
TBARS’ value significantly decreased (p < 0.05) when GCBE and TSPE were incorporated into unheated samples. TBARS values significantly increased (p < 0.05) by the heating effect, and, when compared between heated samples, GCBE-E, GCBE-WE, and TSPE showed the lowest (p < 0.05) TBARS values (40%, 45.71%, and 48.57% of inhibition, respectively) when compared with the control.
L*, a*, and b* values significantly decreased when ASC, GCBE, and TSPE were incorporated into unheated samples (p < 0.05). These values were also significantly reduced due to the heating effect (p < 0.05). When compared between heated samples, no differences (p > 0.05) were found in L* and b* values. In contrast, TSPE and ASC showed the lowest a* values (p < 0.05).
Beef has been one of the most consumed foods, with a Mexican production of 2.2 million metric tons in 2023 and a domestic consumption of 2.1 million metric tons [35]. This food has excellent nutritional properties, such as high biological value proteins, vitamins, and minerals. However, its nutrient-rich composition and high-water activity make it an essential medium for microbial multiplication. In addition, meat is susceptible to the oxidation of its nutrients, especially lipids and proteins. However, both affect its nutritional value and generate compounds that alter its flavor, color, and aroma. A lack of control during slaughter, processing, distribution, and storage can lead to poor quality [36].
Although synthetic additives have been widely used in the meat industry to inhibit microbial growth and lipid oxidation, research focuses on reducing their use due to the possible adverse effects of their uncontrolled application. In this context, obtaining natural extracts and incorporating them as additives with antimicrobial and antioxidant properties in the formulation of meat products represents one of the main current challenges [37,38]. A promising alternative is using coffee powder and extracts from its components, such as beans (roast and green). Concerning the use of spent roast coffee beans, El-Chaghaby et al. [39] found that incorporating RCBE-E (an unreported coffee species) into chicken filets decreases TBC values associated with phenolic compounds in the used extract. At the same time, Murillo-Hernández et al. [40] reported that incorporating RCBE-W from C. arabica into raw pork patties formulation did not affect pH and color values. TBARS’ value decreased when this extract was incorporated.
Regarding the use of green coffee beans, Parvathy et al. [41] reported that, when incorporating GCBE (an unreported coffee species) into minced mackerel, the formulation did not affect pH and color values. In contrast, TBC and TBARS values decreased (in concentration dependence) when GCBE was incorporated into these samples, which was associated with chlorogenic acid content.
Mostafa and El Azab [42] found that incorporating GCBE-W (an unreported coffee species) in a raw beef meatball formulation did not affect pH and color values. In contrast, TBC and TBARS values decreased (in concentration dependence) when GCBE-W was incorporated into these samples.
In unheated and heated samples, Bergamaschi et al. [8] found that pH and color (L*, a*, and b*) values were not affected by incorporating GCBE-W from C. arabica in pork patties. In contrast, TBARS values decreased when GCBE was incorporated into pork patties. However, changes in these values were reported due to the samples’ heating effect. The antioxidant effectiveness of GCBE was associated with the presence of polyphenols like chlorogenic acid.
In another study, Fetsch et al. [43] found that TBARS values decreased when GCBE-WE from C. canephora was incorporated into fresh pork sausages without affecting the sensory properties. This was associated with chlorogenic acid and radical cation scavenging properties.
Regarding TSPE, Kumar et al. [44] found that adding TSP to cooked pork patties did not affect TBC and pH values. Also, TBARS values decreased in beef samosas and cooked pork patties incorporated with TSP during refrigerated storage, respectively [44,45].
A previous study has reported that incorporating extracts rich in phenolic compounds into pork patties can improve product quality; however, during cooking, the content of these compounds tends to decrease, which could limit these benefits [14]. In the same way, another study reported that incorporating a natural extract into pork sausages improved meat quality; however, during cooking, the content of bioactive compounds decreased [46]. Another work showed that incorporating a natural extract enhances the content of phenolic compounds of pork patties; in contrast, during cooking, the content of these compounds tends to increase [47].
3.4. Multivariate Analysis
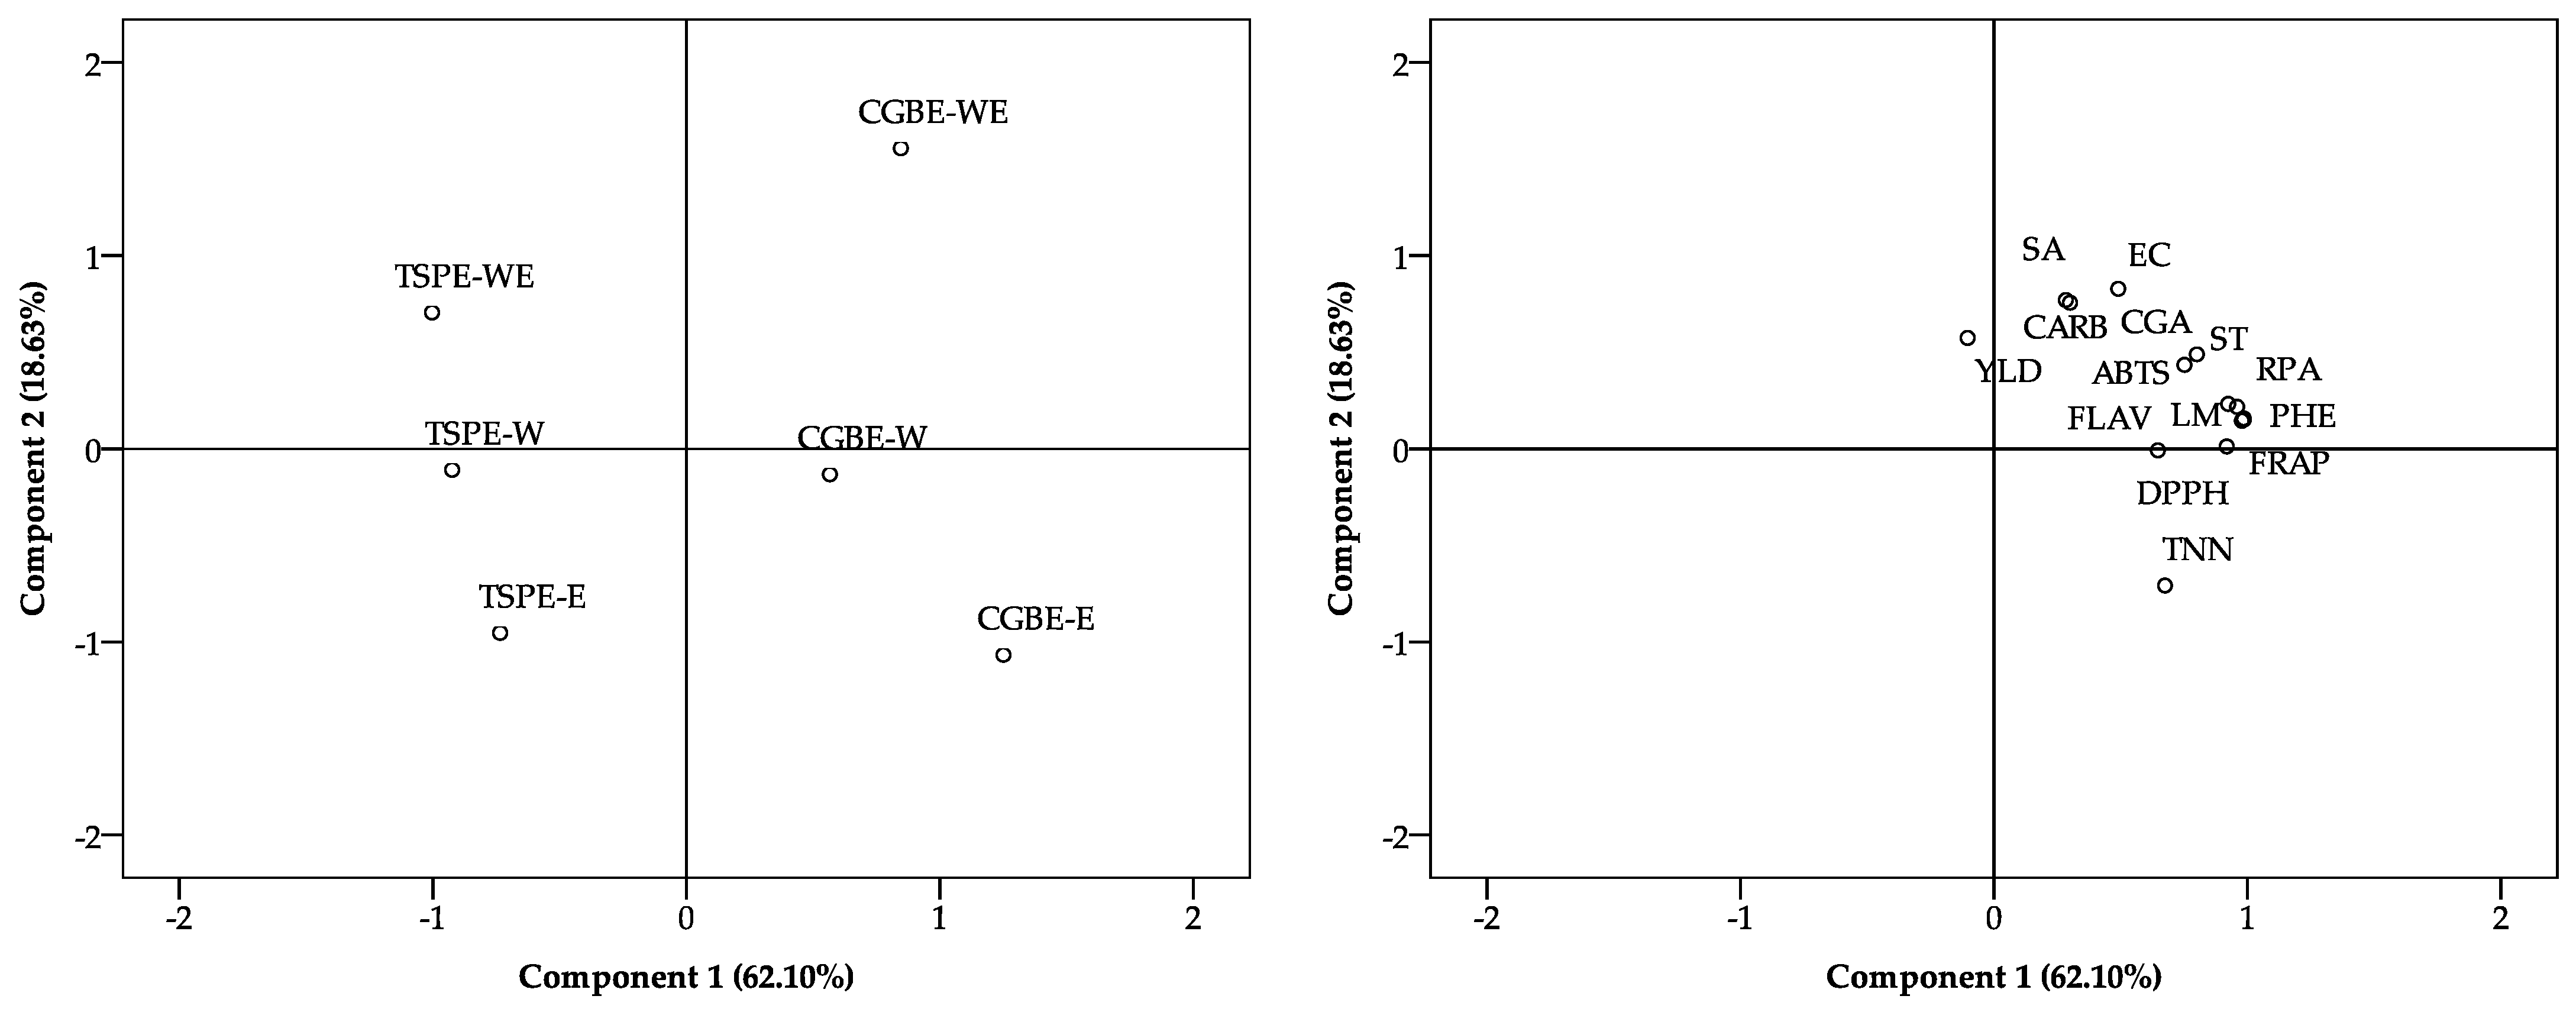
Figure 3 shows the biplots obtained from the principal component analysis (PCA), where the distribution of the treatments (left) and the variables evaluated (right) can be observed based on the first two principal components (PCA1 and PCA2), which together explain 80.73% of the total variability of the data (62.10% and 18.63%, respectively). The graph on the left shows that the treatments are grouped according to their origin and type of extraction. The extracts obtained from GCBE are in the right quadrant, while those from TSPE are in the left quadrant, indicating differences in their physicochemical and antioxidant profile.
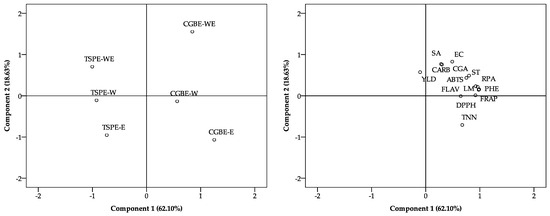
Figure 3.
Principal component analysis of treatments and evaluated metabolite, antioxidant and antimicrobial parameters.
In addition, within each group, the aqueous extracts (W and WE) are separated from the ethanolic ones (E), suggesting an influence of the extraction solvent on the chemical composition. On the other hand, the graph on the right shows the relationship between the measured variables. It is observed that the antioxidant capacity parameters (DPPH, ABTS, and RPA) are grouped with phenolic compounds (PHEs) and flavonoids (FLAVs), suggesting a strong association between them. Likewise, the extraction yield variable (YLD) is in a different position than the bioactive compounds, which could indicate that a higher yield does not necessarily imply a higher concentration of antioxidant metabolites. These results suggest that the source of raw material and the type of solvent used in the extraction significantly affect the composition and antioxidant activity of the extracts evaluated.
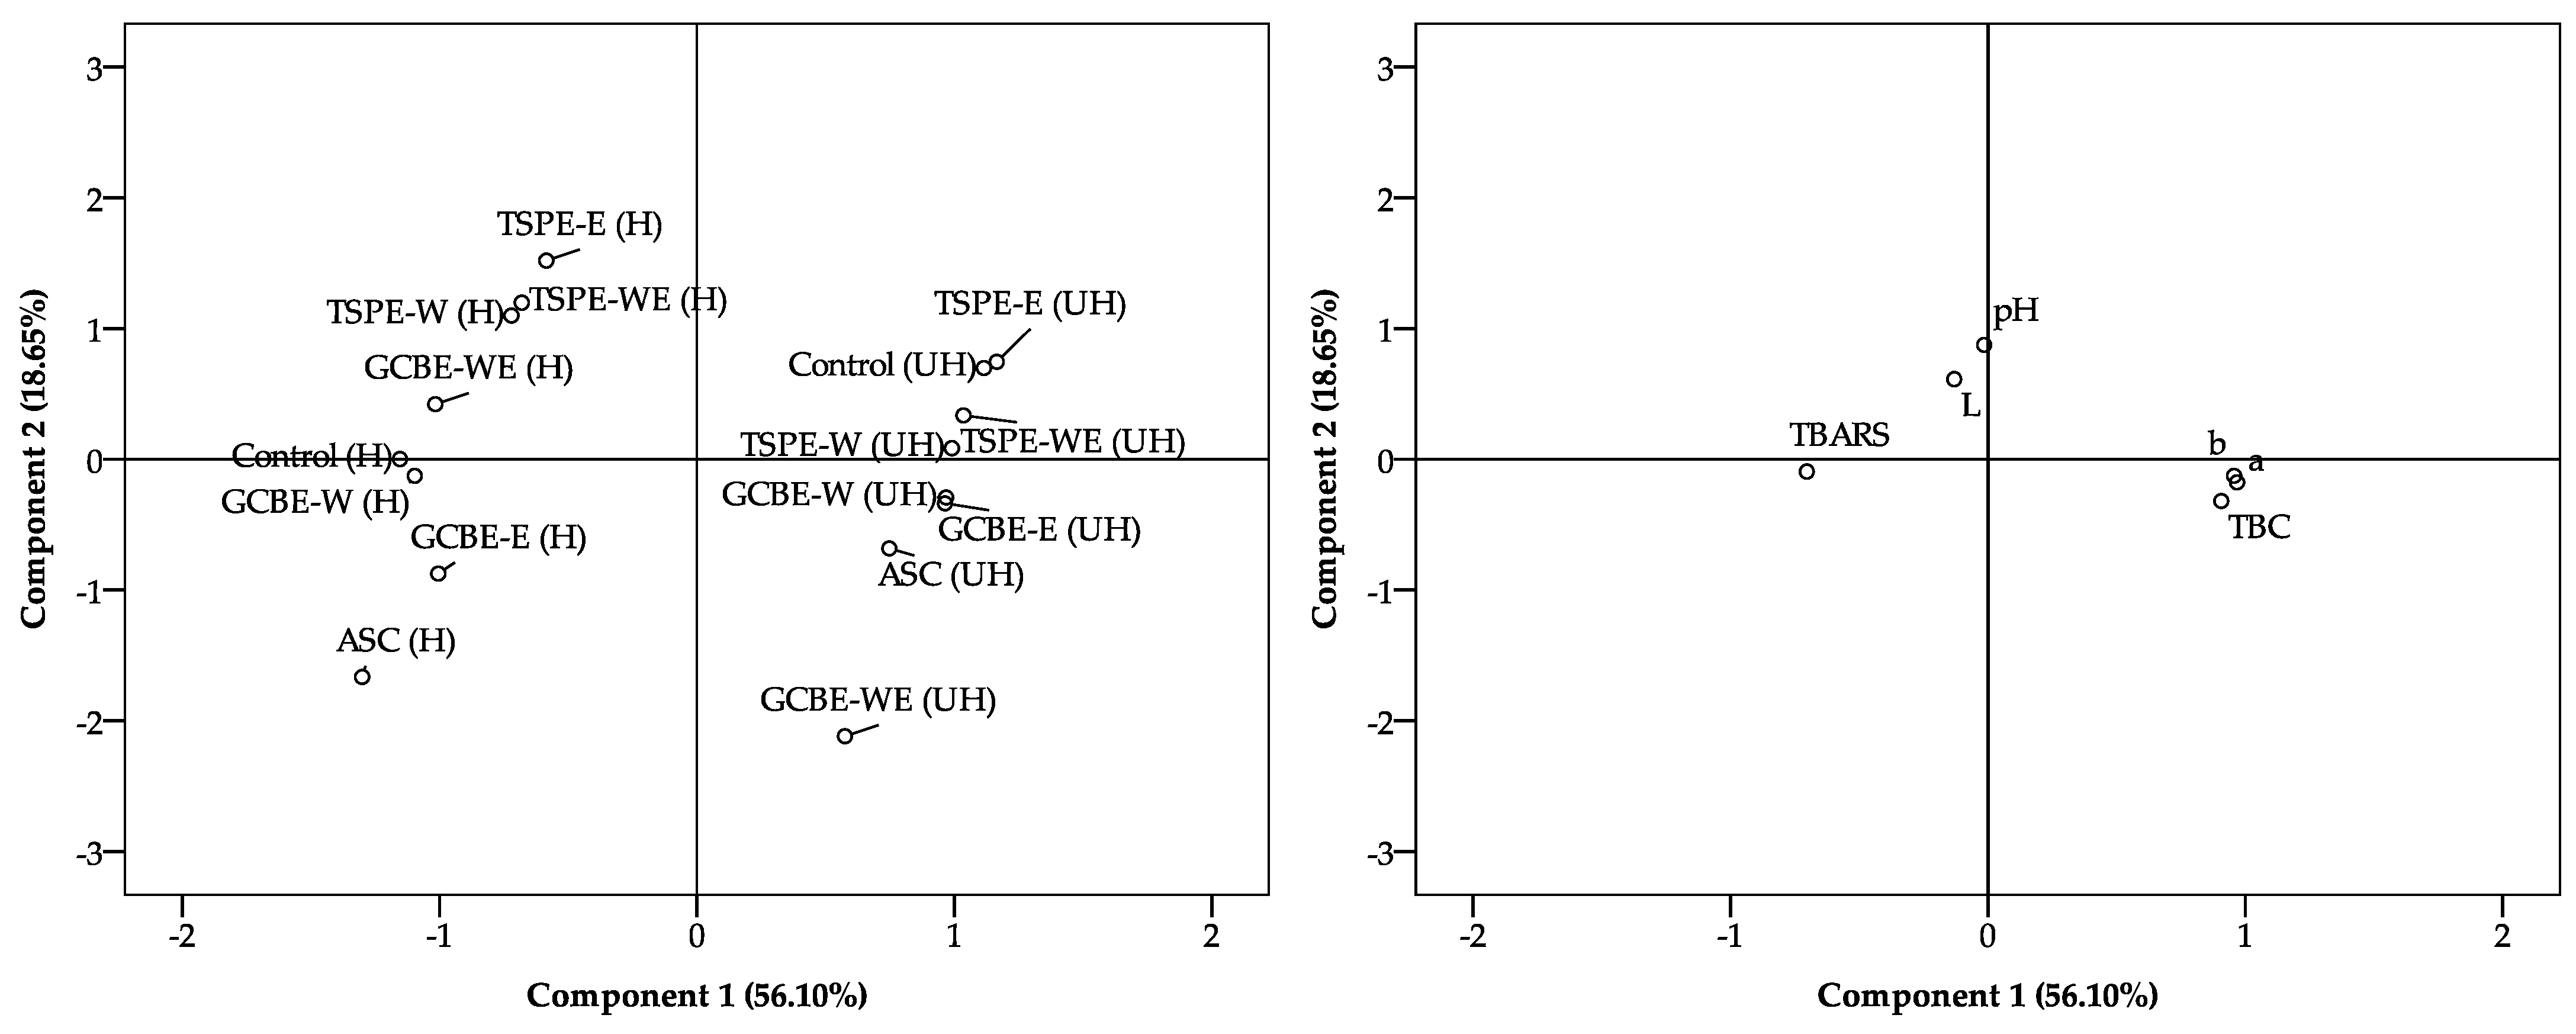
Figure 4 presents the PCA of the treated samples, showing the distribution of the treatments based on the first two principal components (PCA1 and PCA2), which explain 56.10% and 18.65% of the total variability, respectively (together explaining 74.75%).

Figure 4.
Principal component analysis of treatments and evaluated meat quality parameters.
The left graph separates the treatments according to the state of the samples (heated-H and unheated-UH). The treatments with TSPEs tend to cluster in the upper region of the graph, while the treatments with GCBE show a more dispersed distribution in the lower and intermediate parts. The control and the treatment with ASC are in the central and lower parts, differentiating from those with extracts.
The graph on the right shows the contribution of the physicochemical variables to the samples’ distribution in the space of the principal components. The parameter TBARS (lipid oxidation index) is associated with negative values in PCA1. In contrast, the parameters of color (a*, b*, and L*), pH, and total bacterial count (TBC) are associated with positive values in PCA1.
These results suggest that the incorporation of extracts influences the samples’ oxidative stability and physicochemical properties, significantly differentiating the treatments evaluated.
4. Conclusions
Green coffee bean extracts (GCBEs) represent a viable alternative as a natural additive to improve ground beef’s microbial and oxidative stability. The results suggest that the extraction solvent type significantly influences the bioactive metabolites’ content and, consequently, the antimicrobial and antioxidant activity. Furthermore, incorporating GCBE-WE and GCBE-E extracts into ground meat increased the capacity to inhibit microbial growth and reduce lipid oxidation; it also affected the pH and color parameters, suggesting potential applications in formulating more stable and less spoiled meat products. These findings indicate that GCBE could be used as a substitute for synthetic additives in meat products. However, additional studies are needed to evaluate these effects during refrigeration and freezing conditions. After subjecting it to a gastrointestinal digestion model, further studies should also assess its impact on sensory properties and the bioavailability of the bioactive compounds in this natural additive in meat products.
Author Contributions
Conceptualization, W.A.A.-E., R.D.V.-S. and A.S.-E.; methodology, W.A.A.-E., R.D.V.-S. and A.S.-E.; W.A.A.-E., R.D.V.-S. and A.S.-E.; software, W.A.A.-E., B.d.M.T.-M., R.D.V.-S. and A.S.-E.; formal analysis, W.A.A.-E., B.d.M.T.-M., R.D.V.-S. and A.S.-E.; investigation, W.A.A.-E., B.d.M.T.-M., R.D.V.-S., G.R.T.-U. and A.S.-E.; writing—original draft preparation, W.A.A.-E., R.D.V.-S. and A.S.-E.; writing—review and editing, W.A.A.-E., B.d.M.T.-M., R.D.V.-S., G.R.T.-U., N.H.-L. and A.S.-E. All authors have read and agreed to the published version of the manuscript.
Funding
This research received no external funding.
Data Availability Statement
The original contributions presented in this study are included in this article. Further inquiries can be directed to the corresponding author.
Acknowledgments
The authors thank SECIHTI for the fellowship from the “Investigadoras e Investigadores por México program”.
Conflicts of Interest
The authors declare no conflicts of interest.
Abbreviations
The following abbreviations are the main ones used in this manuscript:
| GCBE | Green coffee bean extract |
| TSPE | Textured soy protein extract |
| W | Water |
| E | Ethanol |
| WE | Water–ethanol |
| CE | (+)-catechin equivalent |
| GAE | Gallic acid equivalent |
| QE | Quercetin equivalent |
| CAE | Chlorogenic acid equivalent |
| GE | Glucose equivalent |
| DPPH | 2,2-diphenyl-1-picrylhydrazyl |
| ABTS | 2,2′-azino-di(3-ethyl-benzathiazoline-sulphonic acid-(6) |
| ASC | Ascorbic acid |
| FRAP | Ferric-reducing antioxidant power |
| TBC | Total bacterial count |
| TBARS | Thiobarbituric acid reactive substances |
| L* | Lightness |
| a* | Redness |
| b* | Yellowness |
| C* | Chroma |
| h* | hue |
| H | Heated |
| UH | Unheated |
| PCA | Principal component analysis |
References
- Abdulmumeen, H.A.; Risikat, A.N.; Sururah, A.R. Food: Its preservatives, additives and applications. Int. J. Chem. Biochem. Sci. 2012, 1, 36–47. [Google Scholar]
- Lalani, A.R.; Rastegar-Pouyani, N.; Askari, A.; Tavajohi, S.; Akbari, S.; Jafarzadeh, E. Food additives, benefits, and side effects: A review article. J. Chem. Health Risks 2024, 14, 1–10. [Google Scholar]
- Bosso, H.; Barbalho, S.M.; de Alvares Goulart, R.; Otoboni, A.M.M.B. Green coffee: Economic relevance and a systematic review of the effects on human health. Crit. Rev. Food Sci. Nutr. 2023, 63, 394–410. [Google Scholar] [CrossRef] [PubMed]
- Ibrahim, U.K.; Si-Hien, M.D.L.R.L.; Suzihaque, M.U.H.; Hashib, S.A.; Karim, S.F.A. Antimicrobial properties and sensory evaluation of bread enriched with green coffee beans (GCB). In IOP Conference Series: Materials Science and Engineering; IOP Publishing Ltd.: Bristol, UK, 2020; Volume 736, p. 6. [Google Scholar]
- Dziki, D.; Gawlik-Dziki, U.; Pecio, Ł.; Różyło, R.; Świeca, M.; Krzykowski, A.; Rudy, S. Ground green coffee beans as a functional food supplement–Preliminary study. LWT 2015, 63, 691–699. [Google Scholar] [CrossRef]
- Mukkundur Vasudevaiah, A.; Chaturvedi, A.; Kulathooran, R.; Dasappa, I. Effect of green coffee extract on rheological, physico-sensory and antioxidant properties of bread. J. Food Sci. Technol. 2017, 54, 1827–1836. [Google Scholar] [CrossRef]
- Dilnawaz, H.M.; Kumar, S.; Bhat, Z.F. Effect of green coffee bean extract on the lipid oxidative stability and storage quality of restructured mutton blocks containing Colocasia esculenta, a novel binding agent. Agric. Res. 2017, 6, 443–454. [Google Scholar] [CrossRef]
- Bergamaschi, M.; Simoncini, N.; Spezzano, V.M.; Ferri, M.; Tassoni, A. Antioxidant and sensory properties of raw and cooked pork meat burgers formulated with extract from non-compliant green coffee beans. Foods 2023, 12, 1264. [Google Scholar] [CrossRef]
- Taiar, F.; Gharekhani, A.; Tukmechi, A. Investigation of changes in the qualitative, oxidative and microbial indices of minced and non-minced beef during the freezing storage. Food Hyg. 2021, 11, 111–123. [Google Scholar]
- Ramírez-Rojo, M.I.; Vargas-Sánchez, R.D.; Hernández-Martínez, J.; Martínez-Benavidez, E.; Sánchez-Escalante, J.J.; Torrescano-Urrutia, G.R.; Sánchez-Escalante, A. Actividad antioxidante de extractos de hoja de mezquite (Prosopis velutina). Biotecnia 2019, 21, 113–119. [Google Scholar] [CrossRef]
- Herrera-Cazares, L.A.; Hernández-Navarro, F.; Ramírez-Jiménez, A.K.; Campos-Vega, R.; de la Luz Reyes-Vega, M.; Loarca-Piña, G.; Morales-Sánchez, E.; Wall-Medrano, A.; Gaytán-Martínez, M. Mango-bagasse functional-confectionery: Vehicle for enhancing bioaccessibility and permeability of phenolic compounds. Food Funct. 2017, 8, 3906–3916. [Google Scholar] [CrossRef]
- Nguyen, T.T.; Rosselló, C.; Ratti, C. Understanding air-drying behavior of potato peel waste. Dry. Technol. 2022, 40, 3520–3531. [Google Scholar] [CrossRef]
- Albalasmeh, A.A.; Berhe, A.A.; Ghezzehei, T.A. A new method for rapid determination of carbohydrate and total carbon concentrations using UV spectrophotometry. Carbohydr. Polym. 2013, 97, 253–261. [Google Scholar] [CrossRef] [PubMed]
- Vargas-Sánchez, R.D.; Torres-Martínez, B.D.M.; Huerta-Leidenz, N.; Ibarra-Arias, F.J.; Fernández-López, J.; Torrescano-Urrutia, G.R.; Perez-Alvarez, J.A.; Sánchez-Escalante, A. Antioxidant and antibacterial effect of Agaricus brasiliensis extract on raw and cooked pork patties during storage. Agriculture 2023, 13, 346. [Google Scholar] [CrossRef]
- Ozgen, M.; Reese, R.N.; Tulio, A.Z.; Scheerens, J.C.; Miller, A.R. Modified 2, 2-azino-bis-3-ethylbenzothiazoline-6-sulfonic acid (ABTS) method to measure antioxidant capacity of selected small fruits and comparison to ferric reducing antioxidant power (FRAP) and 2,2′ -diphenyl-1-picrylhydrazyl (DPPH) methods. J. Agric. Food Chem. 2006, 54, 1151–1157. [Google Scholar] [CrossRef]
- Berker, K.I.; Güçlü, K.; Demirata, B.; Apak, R. A novel antioxidant assay of ferric reducing capacity measurement using ferrozine as the colour forming complexation reagent. Anal. Methods 2010, 2, 1770–1778. [Google Scholar] [CrossRef]
- AOAC. AOAC 943.02, pH of Flour, Potentiometric Method. Association of Official Analytical Chemists. Available online: http://www.aoacofficialmethod.org/index.php?main_page=product_info&products_id=937 (accessed on 7 January 2025).
- Pfalzgraf, A.; Frigg, M.; Steinhart, H. Alpha-tocopherol contents and lipid oxidation in pork muscle and adipose tissue during storage. J. Agric. Food Chem. 1995, 43, 1339–1342. [Google Scholar] [CrossRef]
- Hernández, B.; Sáenz, C.; Alberdi, C.; Diñeiro, J.M. CIELAB Color Coordinates versus relative proportions of myoglobin redox forms in the description of fresh meat appearance. J. Food Sci. Technol. 2016, 53, 4159–4167. [Google Scholar] [CrossRef]
- NCSS, LLC. NCSS 2007 Statistical Software [Computer Software]. Version 07.1.21. Kaysville (UT). Available online: www.ncss.com (accessed on 1 May 2024).
- Kim, J.H.; Gu, Y.R.; Hong, J.H. Physicochemical characteristics and antioxidant activities of green coffee bean extracted with different solvents. Korean J. Food Preserv. 2018, 25, 786–796. [Google Scholar] [CrossRef]
- Naidu, M.M.; Sulochanamma, G.; Sampathu, S.R.; Srinivas, P. Studies on extraction and antioxidant potential of green coffee. Food Chem. 2008, 107, 377–384. [Google Scholar] [CrossRef]
- Haile, M.; Kang, W.H. Antioxidant activity, total polyphenol, flavonoid and tannin contents of fermented green coffee beans with selected yeasts. Fermentation 2019, 5, 29. [Google Scholar] [CrossRef]
- In-Chul, L.E.E.; Jae-Sook, L.E.E.; Jeong-Hyun, L.E.E.; Yeona, K.I.M.; Wi-Young, S.O. Anti-oxidative and anti-inflammatory activity of Kenya grade AA green coffee bean extracts. Iran. J. Public Health 2019, 48, 2025–2034. [Google Scholar]
- Winarsih, S.; Sukardi, S.; Wachid, M.; Ismayawati, A.D. Effect solvent and extraction method on the characteristics of green bean Robusta coffee. In BIO Web of Conferences: EDP Sciences; EDP Sciences: Paris, France, 2024; Volume 104, p. 43. [Google Scholar]
- Bolanho, B.C.; Beléia, A.D.P. Bioactive compounds and antioxidant potential of soy products. Braz. J. Food Res. Alim. Nutr. 2011, 22, 539–546. [Google Scholar]
- Pratt, D.E.; Birac, P.M. Source of antioxidant activity of soybeans and soy products. J. Food Sci. 1979, 44, 1720–1722. [Google Scholar] [CrossRef]
- García-Larez, F.L.; Murillo-Hernández, J.L.; Vargas-Sánchez, R.D.; Torrescano-Urrutia, G.R.; Torres-Martínez, B.D.M.; Sánchez-Escalante, A. Effect of extraction solvent on metabolites content, antioxidant, and antibacterial activity of coffee bagasse. Tip. Rev. Espec. Cienc. Quim-Biol. 2021, 24, 1–10. [Google Scholar]
- Tasew, T.; Mekonnen, Y.; Gelana, T.; Redi-Abshiro, M.; Chandravanshi, B.S.; Ele, E.; Mohammed, A.M.; Mamo, H. In vitro antibacterial and antioxidant activities of roasted and green coffee beans originating from different regions of Ethiopia. Int. J. Food Sci. 2020, 2020, 8490492. [Google Scholar] [CrossRef]
- Gligor, O.; Clichici, S.; Moldovan, R.; Muntean, D.; Vlase, A.M.; Nadăș, G.C.; Matei, I.A.; Filip, G.A.; Crișan, G. The effect of extraction methods on phytochemicals and biological activities of green coffee beans extracts. Plants 2023, 12, 712. [Google Scholar] [CrossRef]
- Laodheerasiri, S.; Horana Pathirage, N. Antimicrobial activity of raw soybean, soybean flour and roasted soybean extracted by ethanol-hexane method. Br. Food J. 2017, 119, 2277–2286. [Google Scholar] [CrossRef]
- Villalobos, M.D.C.; Serradilla, M.J.; Martín, A.; Ordiales, E.; Ruiz-Moyano, S.; Córdoba, M.D.G. Antioxidant and antimicrobial activity of natural phenolic extract from defatted soybean flour by-product for stone fruit postharvest application. J. Sci. Food Agric. 2016, 96, 2116–2124. [Google Scholar] [CrossRef]
- Adamczak, A.; Ożarowski, M.; Karpiński, T.M. Antibacterial activity of some flavonoids and organic acids widely distributed in plants. J. Clin. Med. 2019, 9, 109. [Google Scholar] [CrossRef]
- Masek, A.; Latos-Brozio, M.; Kałużna-Czaplińska, J.; Rosiak, A.; Chrzescijanska, E. Antioxidant properties of green coffee extract. Forests 2020, 11, 557. [Google Scholar] [CrossRef]
- USDA Livestock and Poultry: World Markets and Trade. Available online: https://apps.fas.usda.gov/psdonline/circulars/livestock_poultry.pdf (accessed on 15 January 2025).
- Permínio-Oliveira, V.J.; Ryzia de Cassia, V.C.; Itaciara-Larroza, N.; Wanessa-Karine, D.L. Quality and safety of fresh beef in retail: A review. J. Food Prot. 2022, 85, 435–447. [Google Scholar]
- Efenberger-Szmechtyk, M.; Nowak, A.; Czyzowska, A. Plant extracts rich in polyphenols: Antibacterial agents and natural preservatives for meat and meat products. Crit. Rev. Food Sci. Nutr. 2021, 61, 149–178. [Google Scholar] [CrossRef] [PubMed]
- Kumar, Y.; Yadav, D.N.; Ahmad, T.; Narsaiah, K. Recent trends in the use of natural antioxidants for meat and meat products. Compr. Rev. Food Sci. Food Saf. 2015, 14, 796–812. [Google Scholar] [CrossRef]
- El-Chaghaby, G.A.; Shehta, H.A.; Rashad, S.; Rawash, E.A.; Eid, H.R. Evaluation of the antioxidant and antimicrobial activities of the spent coffee extracts and their applications as natural food preservatives of chicken fillets. Nov. Res. Microbiol. J. 2024, 8, 2303–2319. [Google Scholar] [CrossRef]
- Murillo-Hernández, J.L.; Vargas-Sánchez, R.D.; Torres-Martínez, B.; Huerta-Leidenz, N.; Torrescano-Urrutia, G.R.; Sánchez-Escalante, A. Effect of spent coffee grounds aqueous extract as an antioxidant in raw pork patties during refrigerated storage. Rev. Mex. Cienc. Pecu. 2024, 15, 833–847. [Google Scholar]
- Parvathy, U.; Sivaraman, G.K.; Murthy, L.N.; Visnuvinayagam, S.; Jeyakumari, A.; Ravishankar, C.N. Green coffee extract as a natural antioxidant in chill stored Indian mackerel (Rastrelliger kanagurta) mince. Indian J. Fish 2018, 65, 86–95. [Google Scholar] [CrossRef]
- Mostafa, H.S.; El Azab, E.F. Efficacy of green coffee as an antioxidant in beef meatballs compared with ascorbic acid. Food Chem. X 2022, 14, 100336. [Google Scholar] [CrossRef]
- Fetsch, V.T.; Kalschne, D.L.; Canan, C.; Flores, É.L.D.M.; Viegas, M.C.; Peiter, G.C.; Zara, R.F.; Amaral, J.S.; Corso, M.P. Coffee extract as a natural antioxidant in fresh pork sausage—A model approach. Foods 2024, 13, 1409. [Google Scholar] [CrossRef]
- Kumar, M.; Sharma, B.D.; Kumar, S.; Sharma, R.B. Shelf life of low-fat ground pork patties formulated with texturized soy protein. Indian J. Anim. Res. 2005, 39, 14–19. [Google Scholar]
- Omwamba, M.; Mahungu, S.M.; Faraj, A.K. Effect of texturized soy protein on quality characteristics of beef samosas. Int. J. Food Stud. 2014, 3, 74–81. [Google Scholar] [CrossRef]
- Balzan, S.; Taticchi, A.; Cardazzo, B.; Urbani, S.; Servili, M.; Di Lecce, G.; Zabalza, I.B.; Rodriguez-Estrada, M.T.; Novelli, E.; Fasolato, L. Effect of phenols extracted from a by-product of the oil mill on the shelf-life of raw and cooked fresh pork sausages in the absence of chemical additives. LWT 2017, 85, 89–95. [Google Scholar] [CrossRef]
- Orădan, A.C.; Timar, A.V.; Memete, A.R.; Rosan, C.A.; Teusdea, A.C.; Vicaș, S.I. The effects of different concentrations of Prunus serotina extract on the quality characteristics of raw and cooked pork burger. Bull. UASVM-Food Sci. Technol. 2024, 81, 114–132. [Google Scholar] [CrossRef]
Disclaimer/Publisher’s Note: The statements, opinions and data contained in all publications are solely those of the individual author(s) and contributor(s) and not of MDPI and/or the editor(s). MDPI and/or the editor(s) disclaim responsibility for any injury to people or property resulting from any ideas, methods, instructions or products referred to in the content. |
© 2025 by the authors. Licensee MDPI, Basel, Switzerland. This article is an open access article distributed under the terms and conditions of the Creative Commons Attribution (CC BY) license (https://creativecommons.org/licenses/by/4.0/).