Article

By-Products from Five Grape Varieties Grown in Northwest Mexico Are Sources of Bioaccessible and Bioavailable Phenolic Compounds in a Simulated Digestion

by
Norma Julieta Salazar-López
1,*,
Rosario Maribel Robles-Sánchez
2,
Julio Cesar Armenta-Gorosave
1,
J. Abraham Domínguez-Avila
3,
Gustavo A. González-Aguilar
4 and
Elisa Magaña-Barajas
5
1
Facultad de Medicina de Mexicali, Universidad Autónoma de Baja California, Dr. Humberto Torres Sanginés, Centro Cívico, Mexicali 21000, BN, Mexico
2
Departamento de Investigación y Posgrado en Alimentos, Universidad de Sonora, Blvd. Luis Encinas y Rosales, Col. Centro, Hermosillo 83000, SO, Mexico
3
SECIHTI—Centro de Investigación en Alimentación y Desarrollo A. C., Carretera Gustavo Enrique Astiazarán Rosas No. 46, Col. La Victoria, Hermosillo 83304, SO, Mexico
4
Centro de Investigación en Alimentación y Desarrollo A. C., Carretera Gustavo Enrique Astiazarán Rosas No. 46, Col. La Victoria, Hermosillo 83304, SO, Mexico
5
Programa de Ingeniería en Tecnología de Alimentos, Universidad Estatal de Sonora, Av. Ley Federal del Trabajo, Hermosillo 83100, SO, Mexico
*
Author to whom correspondence should be addressed.
Resources 2025, 14(4), 65; https://doi.org/10.3390/resources14040065
Submission received: 3 March 2025 / Revised: 4 April 2025 / Accepted: 9 April 2025 / Published: 14 April 2025
(This article belongs to the Special Issue Resource Extraction from Agricultural Products/Waste: 2nd Edition)

Abstract

:
The inclusion of by-products or discarded fruit in a second value chain can be a strategy to contribute to sustainable food production and consumption, with a focus on following a circular economy model, since certain by-products may be a source of nutrients and compounds with biological potential. The objective of this research was to evaluate the content of phenolic compounds and antioxidant capacity of by-products from five non-marketable grape varieties, as well as the bioaccessibility and absorption of their phenolic compounds during a simulated digestion, in order to support their potential use as sources of health-promoting compounds of interest. By-products of five grape varieties grown in northwest Mexico were evaluated. They were manually divided into two fractions, skin and pulp + seed, and subjected to a simulated digestion. Grape skin had the highest concentration of phenolic compounds and antioxidant capacity. Catechin exhibited the highest bioaccessibility and absorption, although 40% of this compound was compromised during simulated digestion. Catechin, quercetin, and protocatechuic acid contained in grape by-products make them attractive for insertion into a second value chain with potential uses, such as applications in the food and pharmaceutical industries. Additional research is required to evaluate potential applications, ensuring that these alternative uses are profitable and sustainable.

1. Introduction

It is estimated that one-third of food production is wasted throughout the production and consumption chain [1]. Food waste is a problem that can lead to food security issues alongside environmental and economic impacts, since it accounts for 8–10% of global greenhouse gas emissions [2]. Such far-reaching problems create the need to generate strategies to reduce food waste; one such strategy is focused on avoiding as much as possible by inserting unused food into a second value chain, with a focus on a circular economy model.
During the 2023–2024 period, worldwide grape production was 28.39 million metric tons [3], of which Mexico contributed around 77 thousand metric tons (mostly table grapes) [4]. The Northwest of Mexico is particularly recognized for its grape production, since most (>80%) Mexican grapes are cultivated in this region [5], with the majority being exported. However, a proportion of the fruits fail to meet the strict quality standards required for these markets, which automatically makes them by-products or culled fruits, thereby becoming a source of environmental pollution if they are discarded as waste. Unused grapes may be used to produce raisins, wine, or other products, while another alternative may be extracting their bioactive compounds, potentially promoting their utilization and reducing the amount that ends up in landfill. It is important to mention that the use of edible remnants not suitable for export or commercialization can be a strategy that contributes to the sustainable development goals (SDGs) of the United Nations 2030 agenda, including responsible production and consumption, zero hunger, and health.
Culled grapes are a source of phytochemicals like resveratrol, catechin, epicatechin, epigallocatechin, quercetin, gallic acid, proanthocyanidins, anthocyanins, and oleanolic and aleanilic acids, which may have applications in the food and health industries [6,7,8,9]. Coelho et al. [8] reported the potential applications of bioactive compounds in the food industry, including the use of polyphenols and vitamin E in the fortification of meat and bakery products, as well as the protection of olive oil and stored meat from oxidative damage and their antimicrobial effect on bakery products. In terms of health, catechin, quercetin, gallic acid, epicatechin, and resveratrol present in grapes have shown beneficial effects in in vivo and in vitro models. For example, the cardioprotective and antioxidant effects of grape phenolics have been demonstrated by decreasing triglycerides, lipid accumulation, LDL cholesterol, and lactate dehydrogenase activity, while also neutralizing free radicals and modulating the endogenous antioxidant system [9,10,11]. Rodriguez et al. [11] recently reported a potential cardioprotective effect of a combination of various phenolic compounds (gallic acid, caffeic acid, quercetin, catechin, and epicatechin) that was exerted via reducing platelet aggregation, with quercetin showing the best effect among the compounds tested. Furthermore, grape-derived compounds have been recognized for their anti-inflammatory activity, according to their potential to modulate the nuclear factor kappa B (NF-κB) pathway and the activity of lipo-oxygenases (LOXs) and cyclooxygenases (COXs), thereby reducing the synthesis of pro-inflammatory compounds like prostaglandins, cytokines IL-1β, IL-6, and TNF-α [10,12].
In this study, the content of phenolic compounds and antioxidant capacity of five non-marketable grape varieties’ by-products cultivated in the northwest of Mexico were evaluated, as well as the bioaccessibility and absorption of their phenolic compounds during a simulated digestion, in order to determine their potential value and justify their insertion into a second value chain. The novelty of the present work lies in the fact that we identified the bioactive concentration for each tissue, while also providing a detailed phenolic profile, in order to determine the suitability of various tissues as sources of different compounds, while also confirming that these values are variety-specific, thereby making our analysis more precise.

2. Materials and Methods

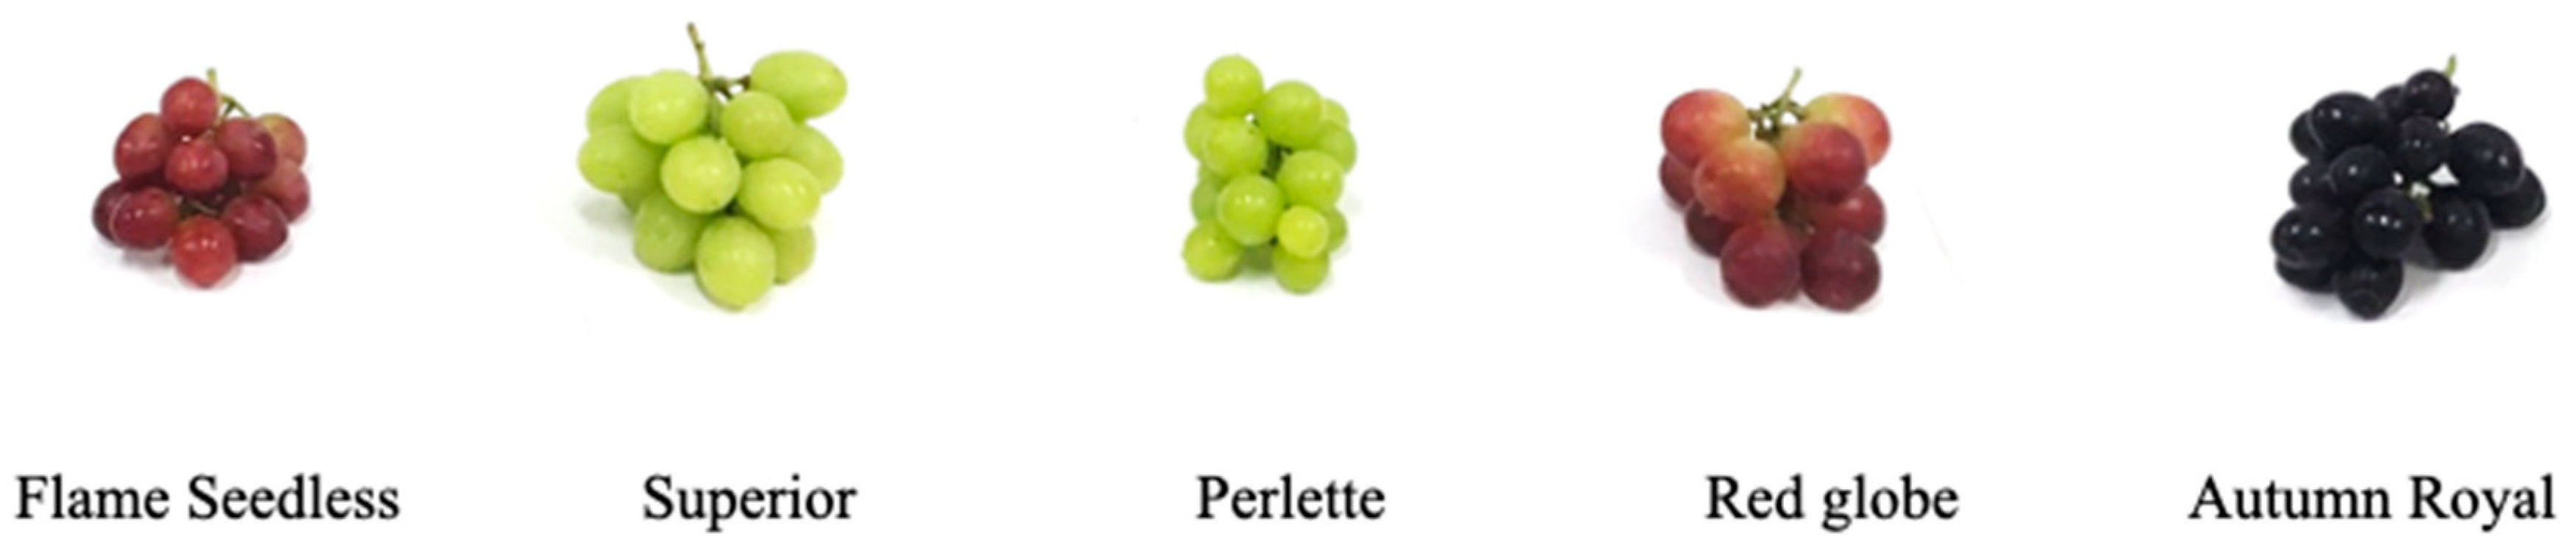
2.1. Samples and Reagents

As with other crops, the bioactive composition of grapes and their by-products will differ according to variety, geographical location, and multiple other variables. Thus, in order to propose subsequent uses for these tissues, they must first be thoroughly characterized; this information will be useful to support their incorporation into value-added products in subsequent works.
At the end of grape harvest, samples of grapes that were deemed not suitable for export were kindly donated by a commercial orchard. It should be noted that these fruits are not currently used for any other purpose and are entirely discarded, thus, providing evidence for their potential could contribute to minimizing the amount wasted. Five grape varieties were obtained, three of them seedless (‘Flame Seedless, ‘Superior’, and ‘Perlette’) and two of them with seeds (‘Red Globe’ and ‘Autumn Royal’) (Figure 1). All samples were harvested from “San Luis Vineyard” located 19.5 km from North 12th Street in Costa de Hermosillo, Sonora, Mexico, packed in polyethylene bags, and transported to the laboratory in the University of Sonora, where they were stored under refrigeration until analysis. The owner of the field is certified for export and has permits for the cultivation, distribution, and export of the five varieties, according to applicable national and international regulations.
Amylase, pancreatin, pepsin, bile salts, Folin–Ciocalteu reagent, 2,2′-azino-bis(3-ethylbenzothiazoline-6-sulfonic acid) diammonium salt (ABTS), 2,2-diphenyl-1-picrylhydrazyl (DPPH), (±)-6-hydroxy-2,5,7,8-tetramethylchromane-2-carboxylic acid (Trolox), KCl, sodium phosphate, and standards of phenolic compounds were acquired from Sigma-Aldrich. Methanol, ethanol, and NaOH were obtained from J.T. Baker.

2.2. Characterization of Grape By-Products

2.2.1. Free Phenolic Compound Extraction

The extraction of free phenolic compounds from grape by-products was performed following the method of Salazar-López et al. [13] with slight modifications. Samples (2 g of skin, or 2 g of pulp + seed, separated manually) of each variety were mixed with 15 mL of an 80% methanol solution, dispersed with a homogenizer, and sonicated for 30 min in the absence of oxygen and light (nitrogen-purged amber tubes). The solvent was separated by centrifugation and filtered (Whatman No. 1). The remaining residue was mixed with 15 mL of methanol solution and the extraction process was repeated. The collected supernatants were evaporated (rotavapor) and filtered through 0.22 µm filters.

2.2.2. Quantification of Total Phenolic Compounds (TPCs)

Total phenolic compounds (TPCs) of methanolic extracts were colorimetrically evaluated with the Folin–Ciocalteu reagent following the method of Salazar-López et al. [14]. The results are expressed in milligrams of gallic acid equivalents per gram of dry weight of the sample (mg GAE/g DW). Dry weight was determined based on moisture content, which was calculated using the AOAC (Association of Official Analytical Chemistry) method 925.09 in a Binder FD 23 oven, Germany (2 g of sample at 100 ± 2 °C for 5 h) [15].

2.2.3. Antioxidant Capacity (AOC)

The extracts’ antioxidant capacities were evaluated based on their ability to stabilize DPPH and ABTS radicals in the DPPH and TEAC (Trolox equivalent antioxidant capacity) assays, respectively, following the methods of Salazar-López et al. [14]. The results were compared with reference standard Trolox (an antioxidant and vitamin E analogue) and expressed as micromoles of Trolox equivalents per gram of dry weight of sample (µmol TE/g DW).

2.2.4. Quantification of Phenolic Compounds by UPLC-DAD

Analysis of phenolic compounds was carried out in a UPLC-DAD system (Agilent Technologies, Waldron, Germany) following the method of Valenzuela González et al. [16]. Separation of compounds was performed with a Zorbax Eclipse Plus C18 rapid-resolution column (50 mm × 2.1 mm i.d., 1.8 µm particle size). The identification of phenolic compounds was carried out by comparing their spectra and retention times with those of commercial standards at 280 nm (hydroxycinnamic acid, protocatechuic acid, and catechin), 320 nm (p-coumaric acid, ferulic acid, sinapic acid, and resveratrol), and 360 nm (quercetin and rutin). Quantification was performed with standard curves, and the results are expressed in micrograms per gram of dry weight of sample (µg/g DW).

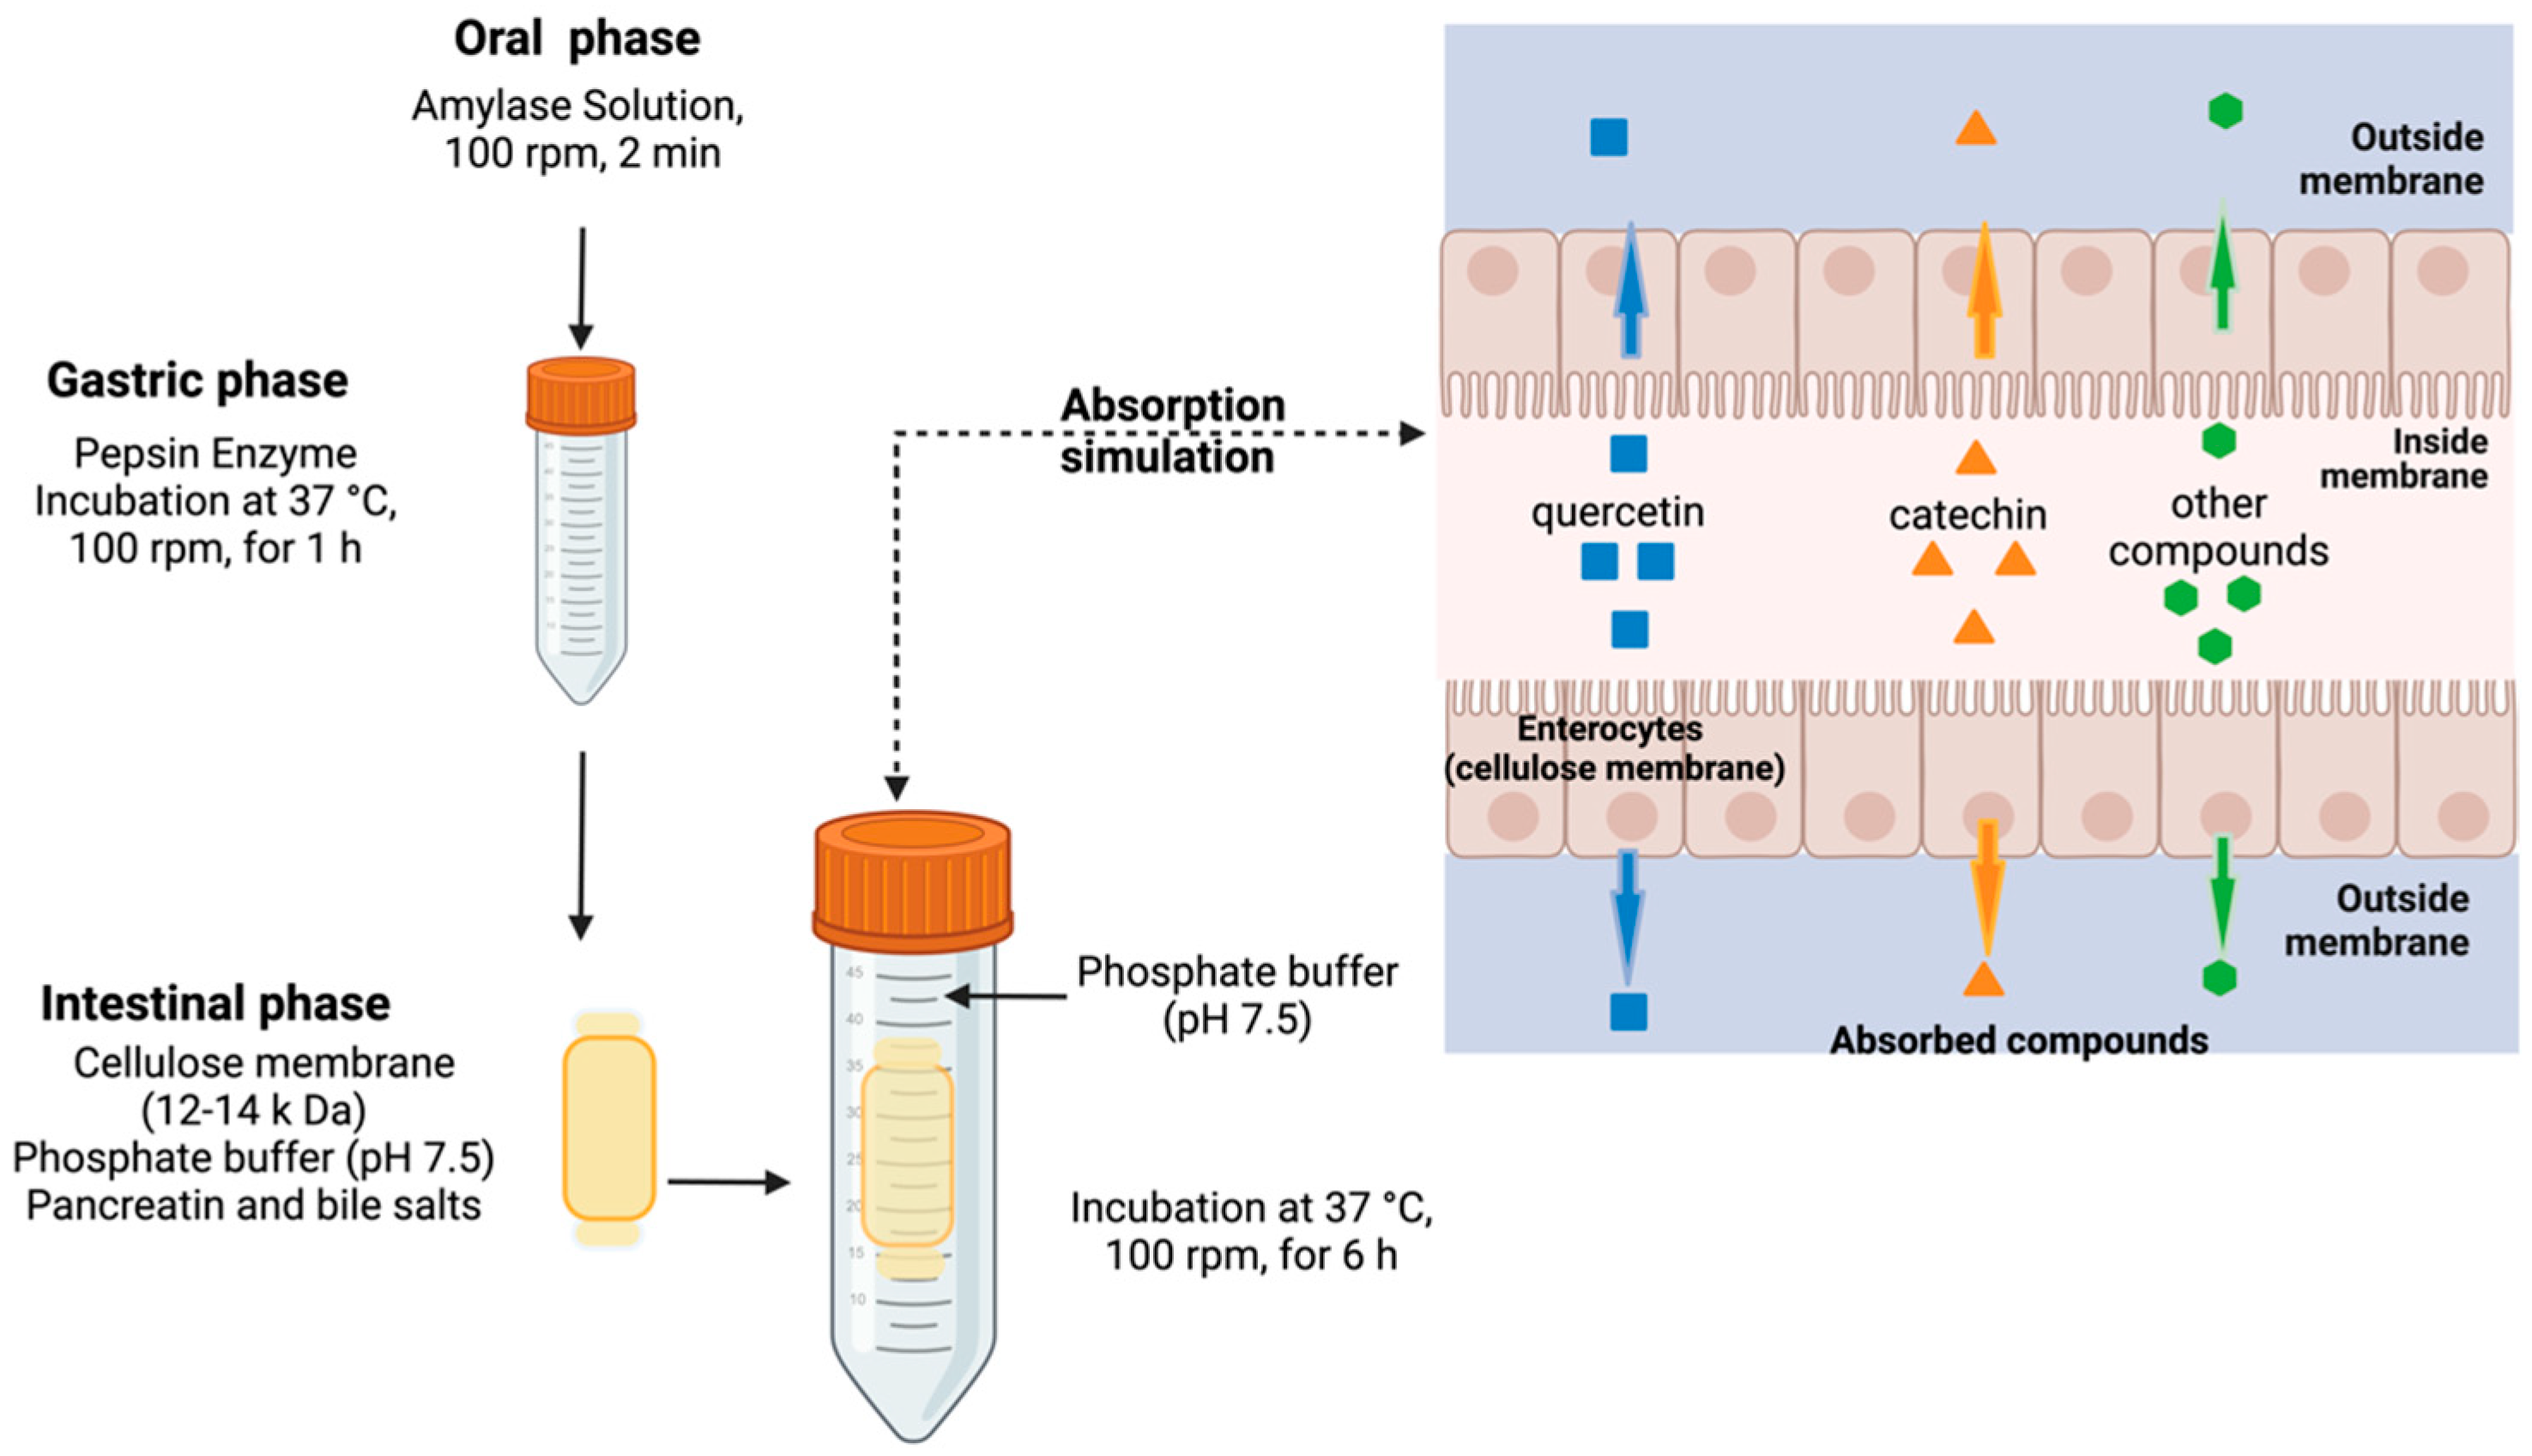
2.3. Simulated Digestion

Simulated digestion was carried out following the methods of Dordai et al. [17] and Salazar-López et al. [18]. First, 2 g of each grape by-product was exposed to 5 mL of amylase solution for 2 min at 75 U/mL in the final mixture (pH 7). The product of the oral phase was subjected to simulated gastric conditions; for this, 10 mL of HCl–KCl buffer (0.2 M, pH 1.5) was added, and the pH was adjusted to 1.5; then, 200 µL of porcine pepsin in a 2000 U/mL (Sigma P-7000) solution was added (300 mg/mL). The tubes were incubated at 37 °C and 100 rpm in a water bath for 1 h.
Gastric-phase products were subjected to intestinal phase simulation. For this, phosphate buffer (0.1 M, pH 7.5) was added to the tubes, and their pH was adjusted to 7.5. An amount of 2.5 mg/mL pancreatin equivalent to 100 U/mL of trypsin in the final mixture (Sigma P-1750) and bile salts (10 mM in the final mixture) were added, and the mix was placed inside a cellulose membrane (12–14 kDa) to simulate intestinal apparent absorption by passive diffusion, while avoiding the passage of larger structures (e.g., droplets, micelles, colloidal structures, and other large structures of indigestible fractions, like polysaccharides or undigested proteins, including phenolic compounds associated with fiber) [19,20]. The bag was closed and added to a 50 mL tube, and phosphate buffer was then added. The tubes were incubated at 37 °C and 100 rpm in a water bath for 6 h (Figure 2).
The simulated digestion and absorption products contained inside and outside the bag (cellulose membrane) were separately lyophilized. The lyophilized products were solubilized in a methanol solution, filtered (0.22 μm), and stored at −20 °C until their analysis. To evaluate the effect of simulated digestion conditions on isolated phenolic compounds, quercetin and catechin standard solutions (200 µg/mL) were subjected to simulated digestion conditions as previously described. The results are expressed in µg/g DW.

2.4. Statistical Analysis

The results were expressed as the mean ± SEM (n = 5). Data were analyzed by one-way analysis of variance (ANOVA) and Tukey’s Kramer using JMP 12.0 software. The level of significance was set at p < 0.05. Pearson’s correlation analyses were performed between TPC and AOC; correlations were also performed between individual phenolic compounds and AOC.

3. Results

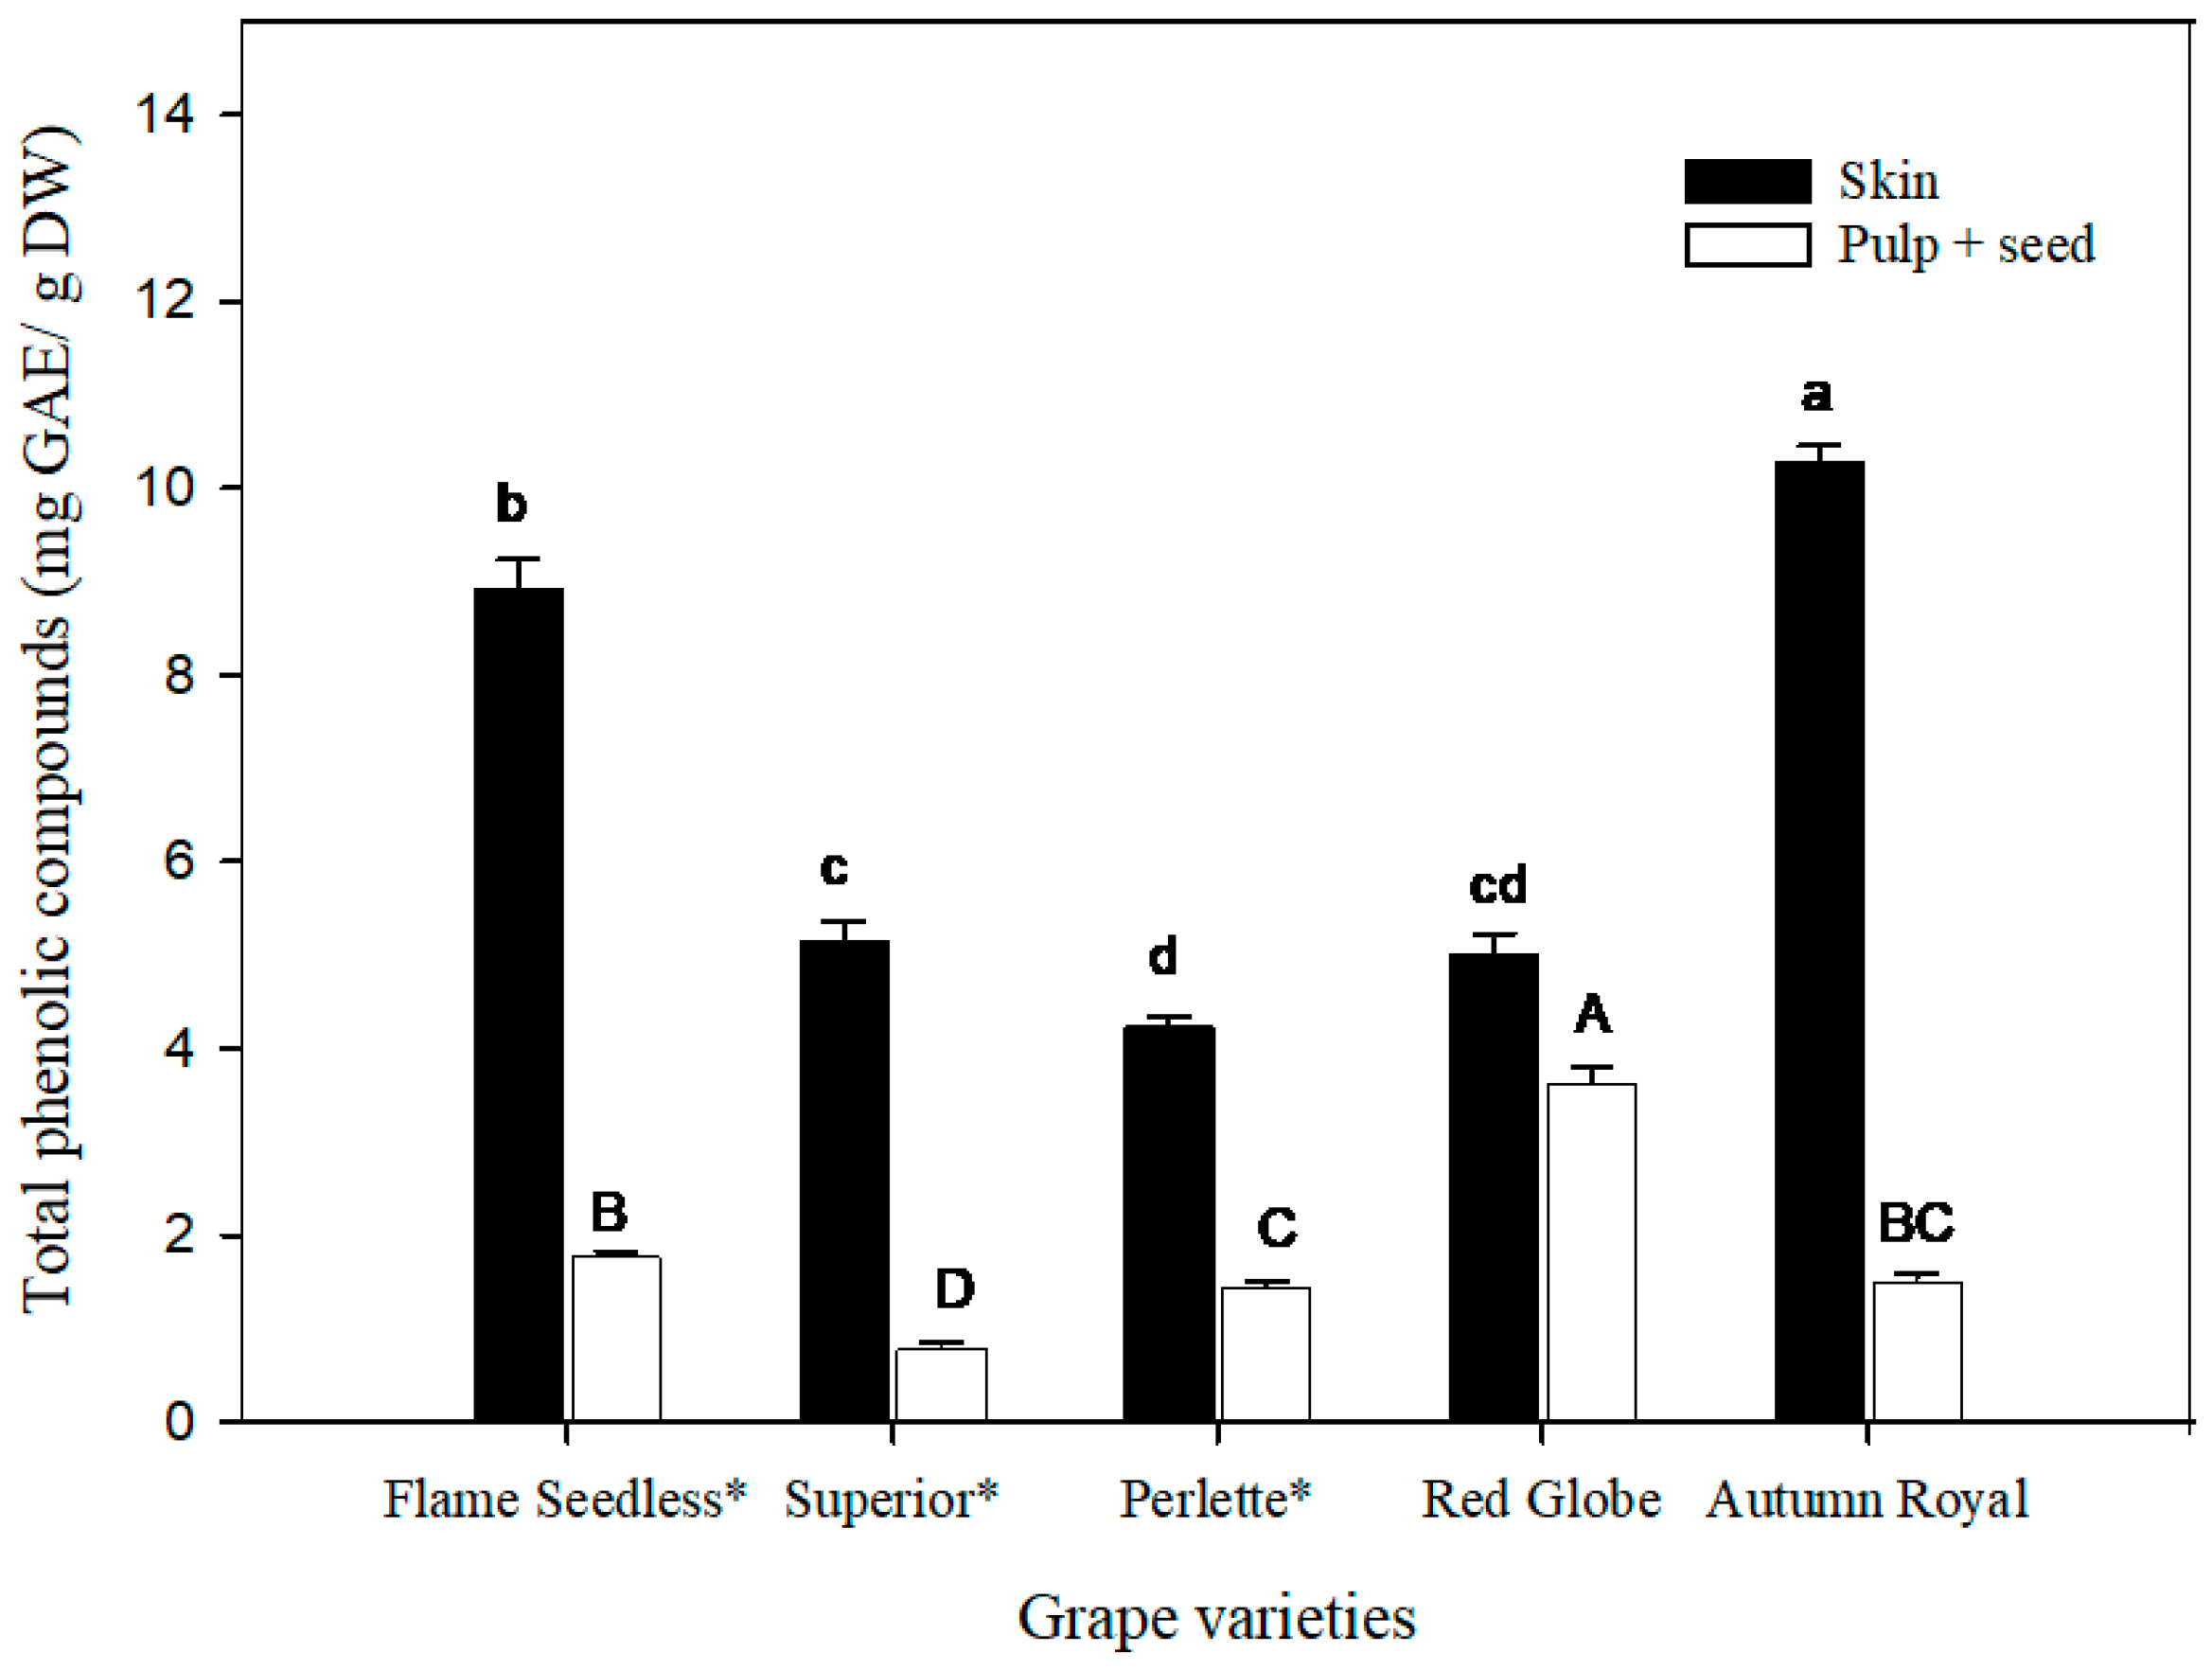
3.1. Quantification of Total Phenolic Compounds (TPCs)

TPCs in the skin and pulp + seed were separately quantified; Figure 3 shows the obtained results. Grape skin from all varieties contained more TPCs than the pulp + seed (p < 0.05). The skin of ‘Autumn Royal’ variety had the highest TPC content (10.31 ± 0.15 mg GAE/g DW), followed by ‘Flame Seedless’ (8.93 ± 0.30 mg GAE/g DW). Regarding the concentration in pulp + seed, ‘Red Globe’ had the highest TPC (3.65 ± 0.14 mg GAE/g DW), as compared with other varieties (p < 0.05).

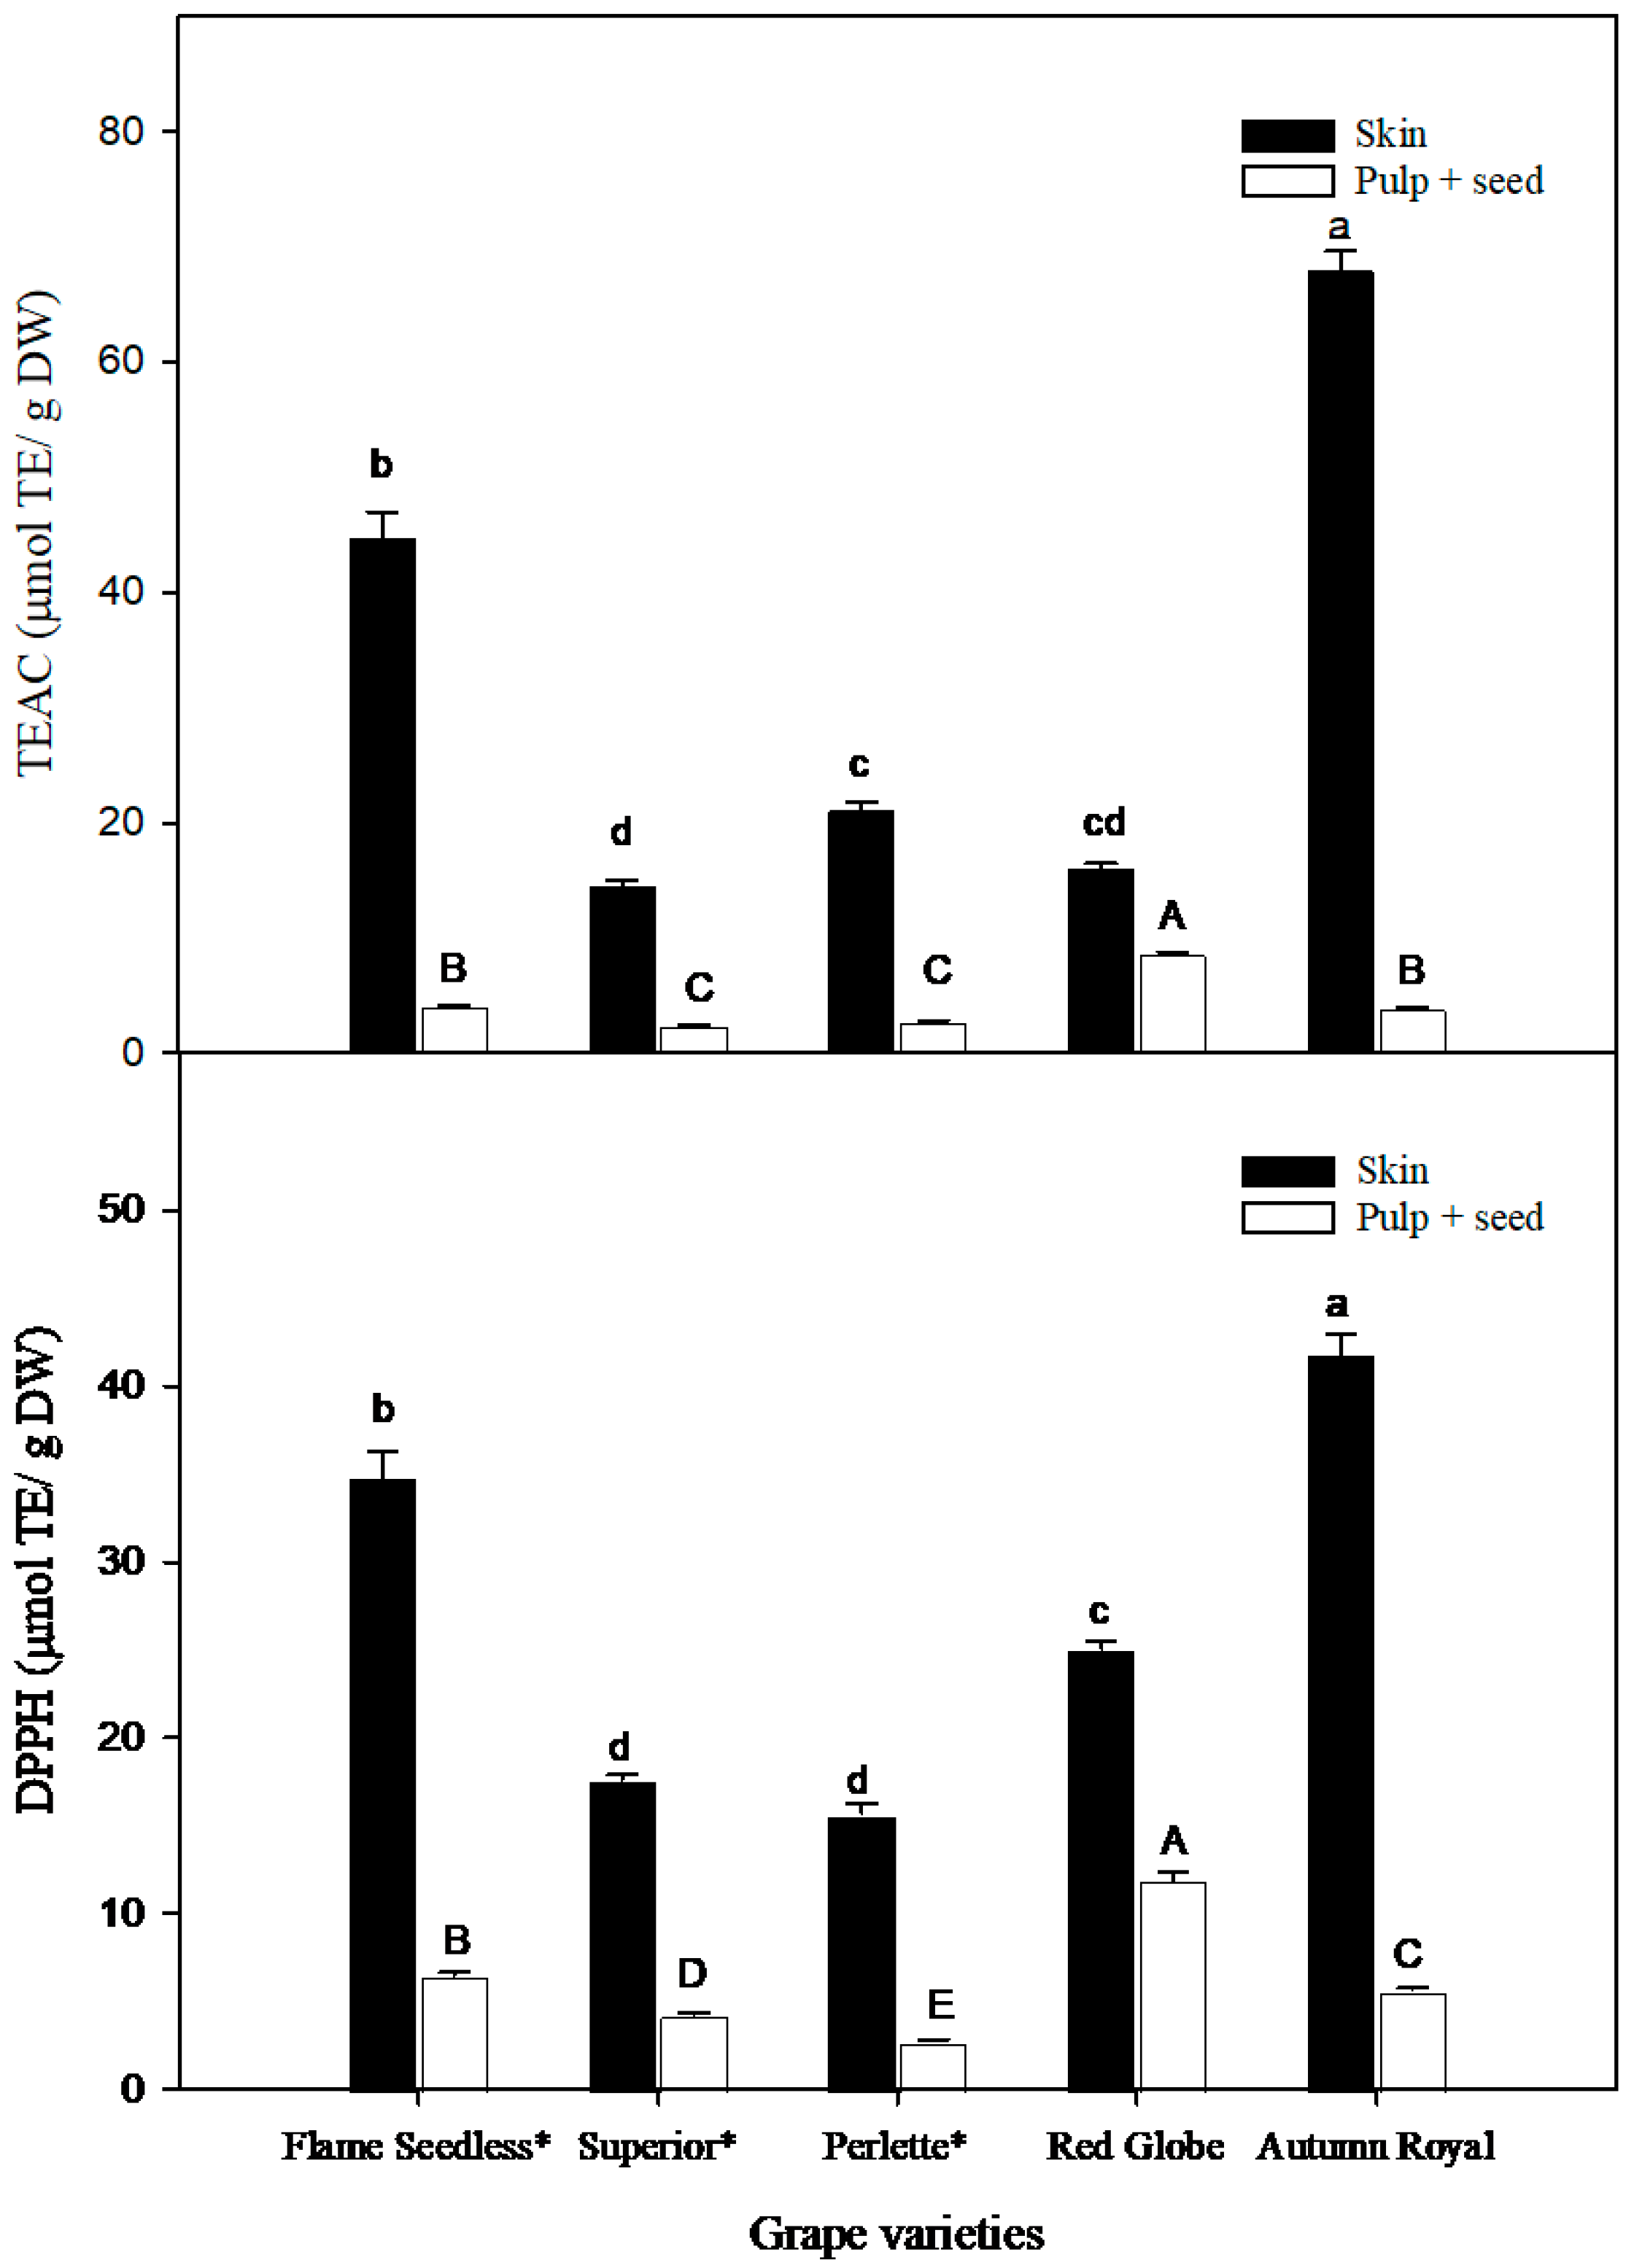
3.2. Antioxidant Capacity (AOC)

The AOC of the skin and pulp + seed of grapes was analyzed via the TEAC and DPPH assays; the results are shown in Figure 4. According to the TEAC assay, ‘Autumn Royal’ and ‘Flame Seedless’ skin had the highest AOC (67.9 ± 1.70 μmol TE/g DW and 44.75 ± 2.26 μmol TE/g DW, respectively, p < 0.05), as compared with ‘Perlette’, ‘Red Globe’, and ‘Superior’ varieties (p < 0.05), while ‘Red Globe’ had the highest AOC in pulp + seed (8.58 ± 0.18 μmol TE/g DW). Similar results were observed in the DPPH assay, in which ‘Autumn Royal’ and ‘Superior’ skin exhibited the highest value of AOC (41.82 ± 1.12 μmol TE/g DW and 34.83 ± 1.42 μmol TE/g DW, respectively, p < 0.05), as compared with other varieties, while pulp + seed from ‘Red Globe’ showed the highest AOC, as compared with the other varieties.
The AOC from grape by-products is related to their TPC content, since the TPC content was correlated positively with the AOC evaluated by TEAC (Pearson correlation r2 = 0.934) and DPPH (Pearson correlation r2 = 0.981) (p < 0.05), which suggests an association between TPC and the AOC of grape by-products.

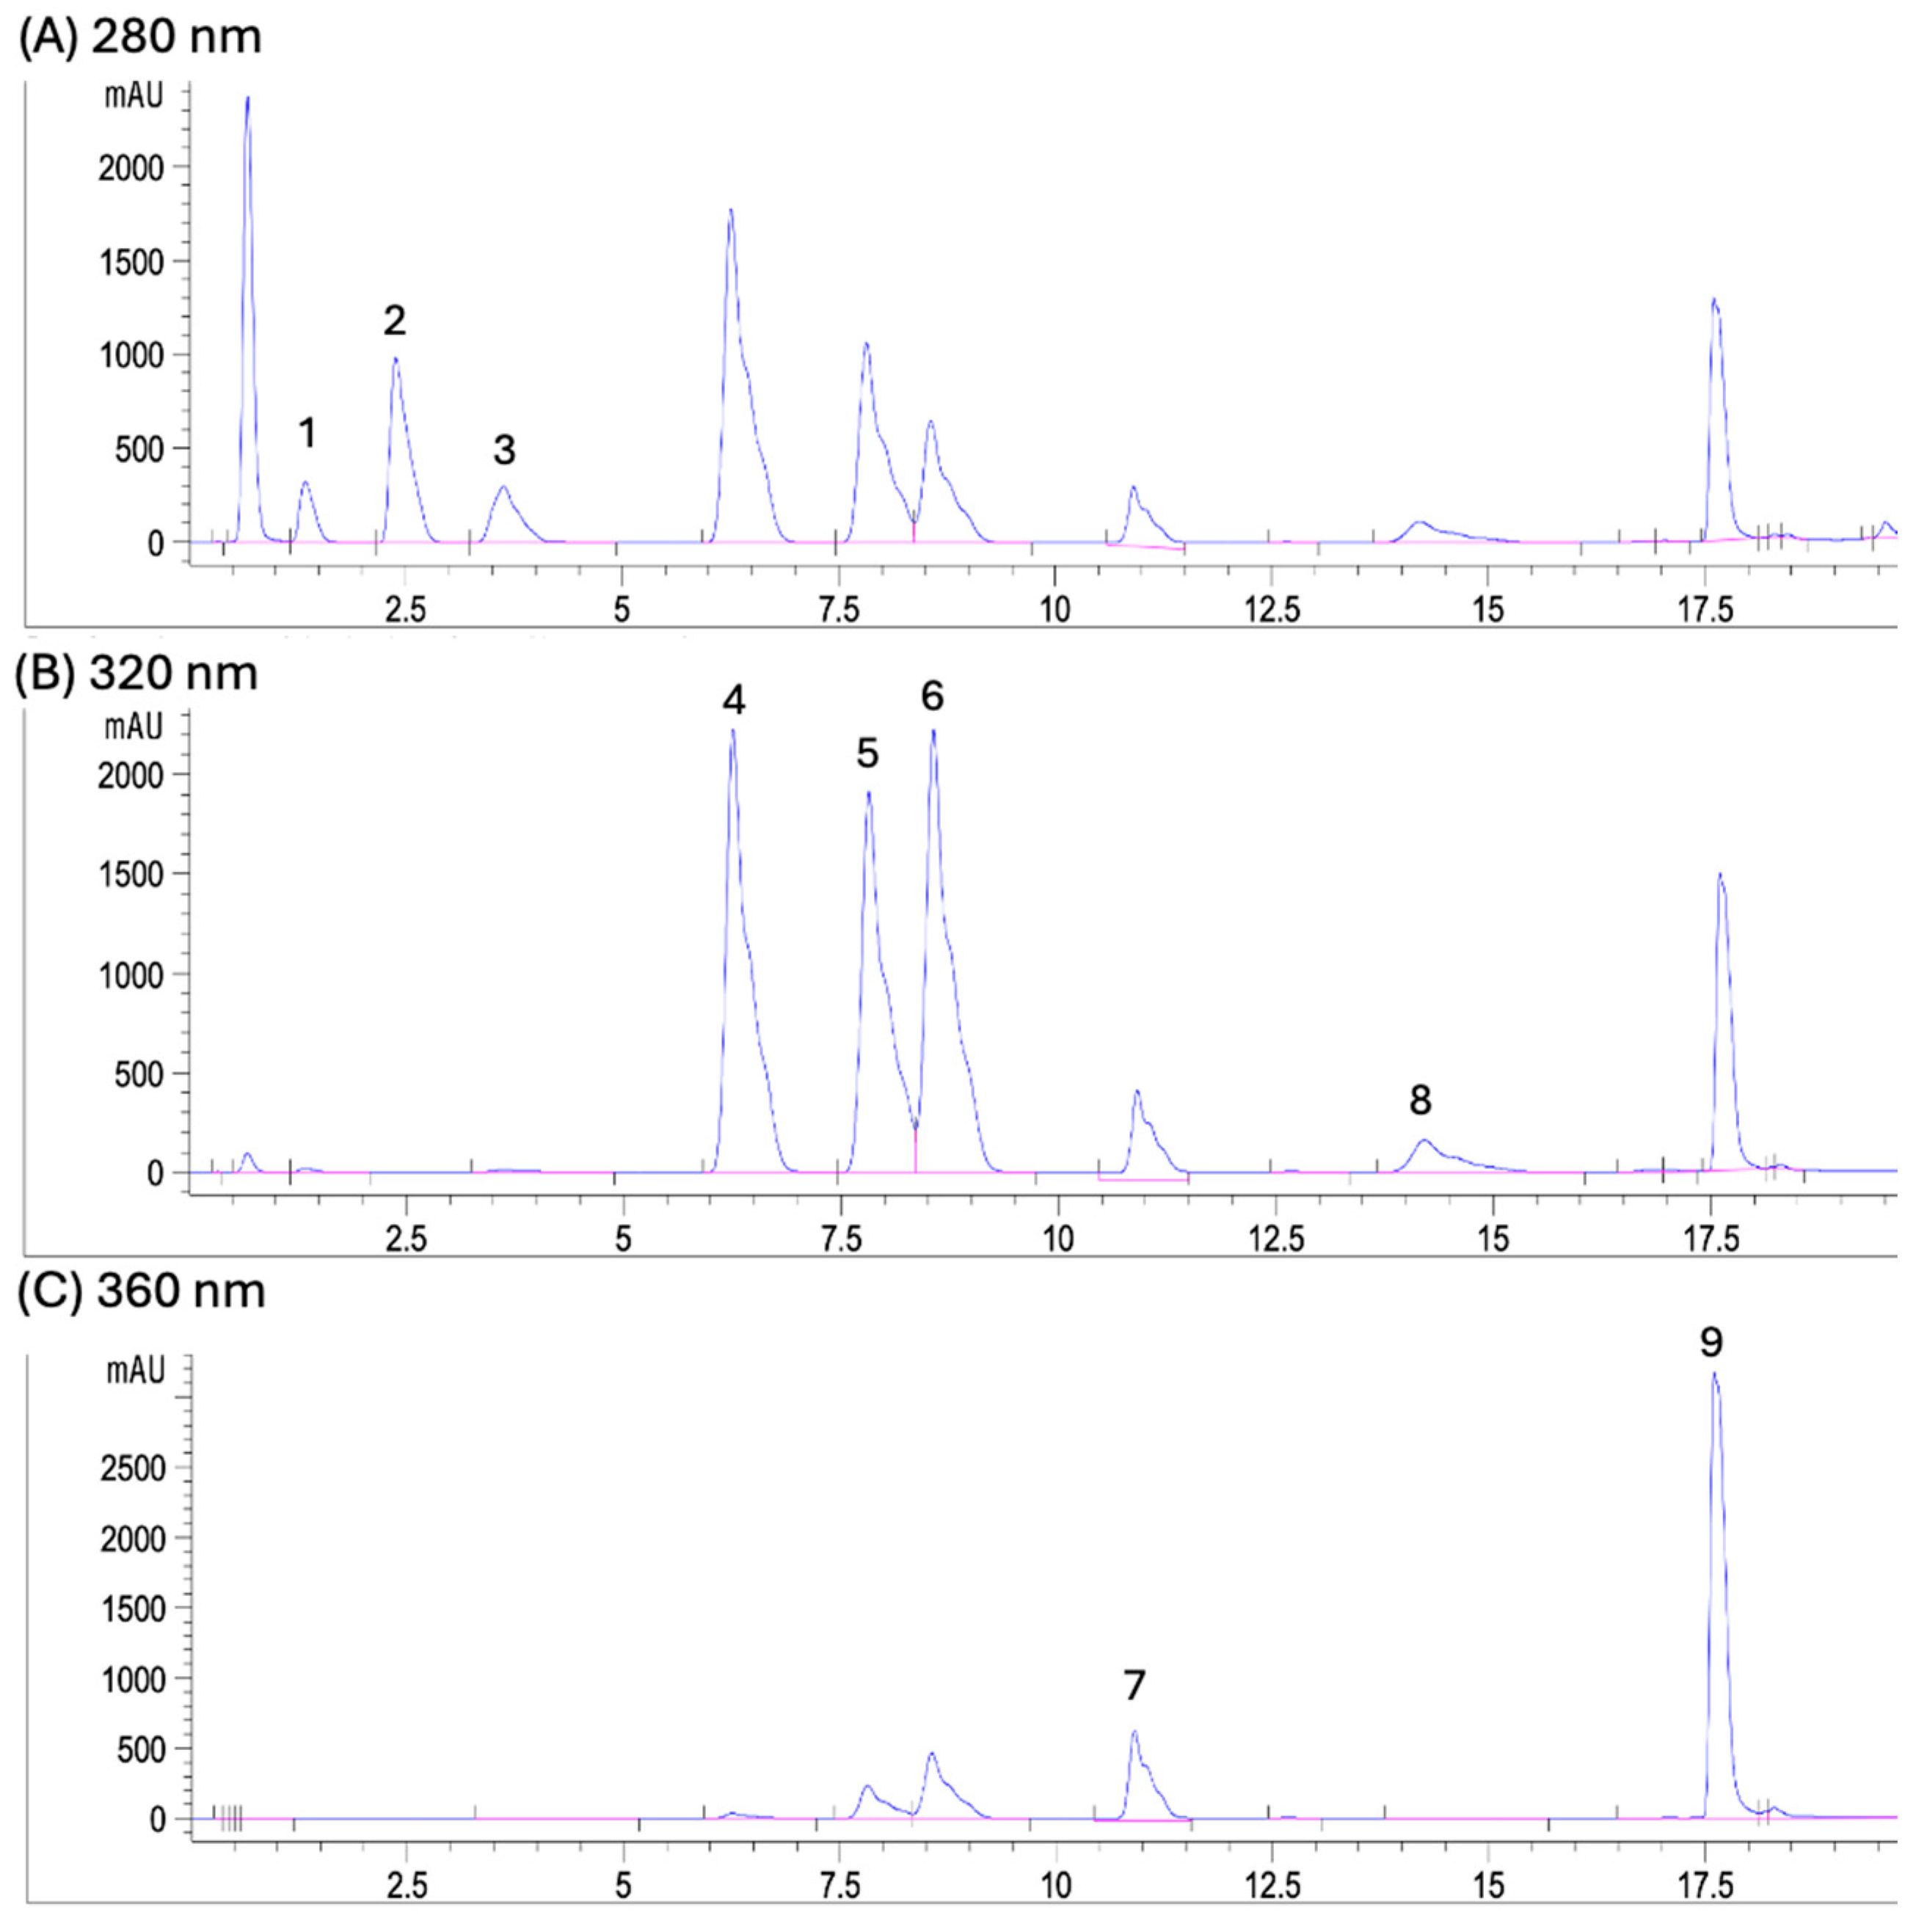
3.3. Quantification of Phenolic Compounds by UPLC-DAD

The results of phenolic content in by-products from five grape varieties are shown in Table 1 and representative chromatograms are shown in Figure 5. ‘Flame Seedless’ variety showed the highest content of phenolic compounds in skin (387.66 ± 7.94 μg/g DW), as compared with the other varieties (p < 0.05). The ‘Red Globe’ variety showed the highest content of phenolic compounds in pulp + seed, followed by the ‘Superior’ variety (p < 0.05). ‘Flame Seedless’, ‘Perlette’, ‘Autumn Royal’, and ‘Superior’ varieties contained the highest proportion of phenolic compounds in their skin, as compared with their pulp + seed (p < 0.05). This shows that the skin of these grape varieties is more attractive than their pulp + seed to obtain phenolic compounds and antioxidant benefits. Interestingly, the ‘Red Globe’ variety did not show significant differences in its total content of phenolic compounds between the skin (202.20 ± 6.70 μg/g DW) and pulp + seed (232.73 ± 3.45 μg/g DW) (p > 0.05).
The flavonoids catechin, quercetin, and rutin, as well as p-coumaric acid and ferulic acid, were found in all grape varieties, while protocatechuic acid was found only in the ‘Superior’ variety. Catechin and quercetin were the major compounds present in the skin of most varieties, with ‘Autumn Royal’ having a significantly higher concentration of these compounds (151.49 ± 2.39 and 118.90 ± 3.25 μg/g DW, respectively), as compared with all others (p < 0.05). Rutin was the major compound present in the skin of ‘Flame Seedless’ variety (174.74 ± 2.15 μg/g DW), followed by catechin (111.70 ± 2.45 μg/g DW) and quercetin (96.26 ± 1.87 μg/g DW).
Regarding Pearson correlations between variables, the contents of quercetin and catechin were significantly correlated (p < 0.05) with AOC obtained via the DPPH (r2 = 0.77 and r2 = 0.66) and TEAC (r2 = 0.61 and r2 = 0.55) methods. In contrast, the correlation between AOC with the rest of the quantified phenolic compounds (resveratrol, rutin, sinapic acid, ferulic acid, and p-coumaric acid) had correlations of r2 < 0.477. This suggests that quercetin and catechin have a greater influence on the antioxidant effect of grape by-products, as determined by two different methods.

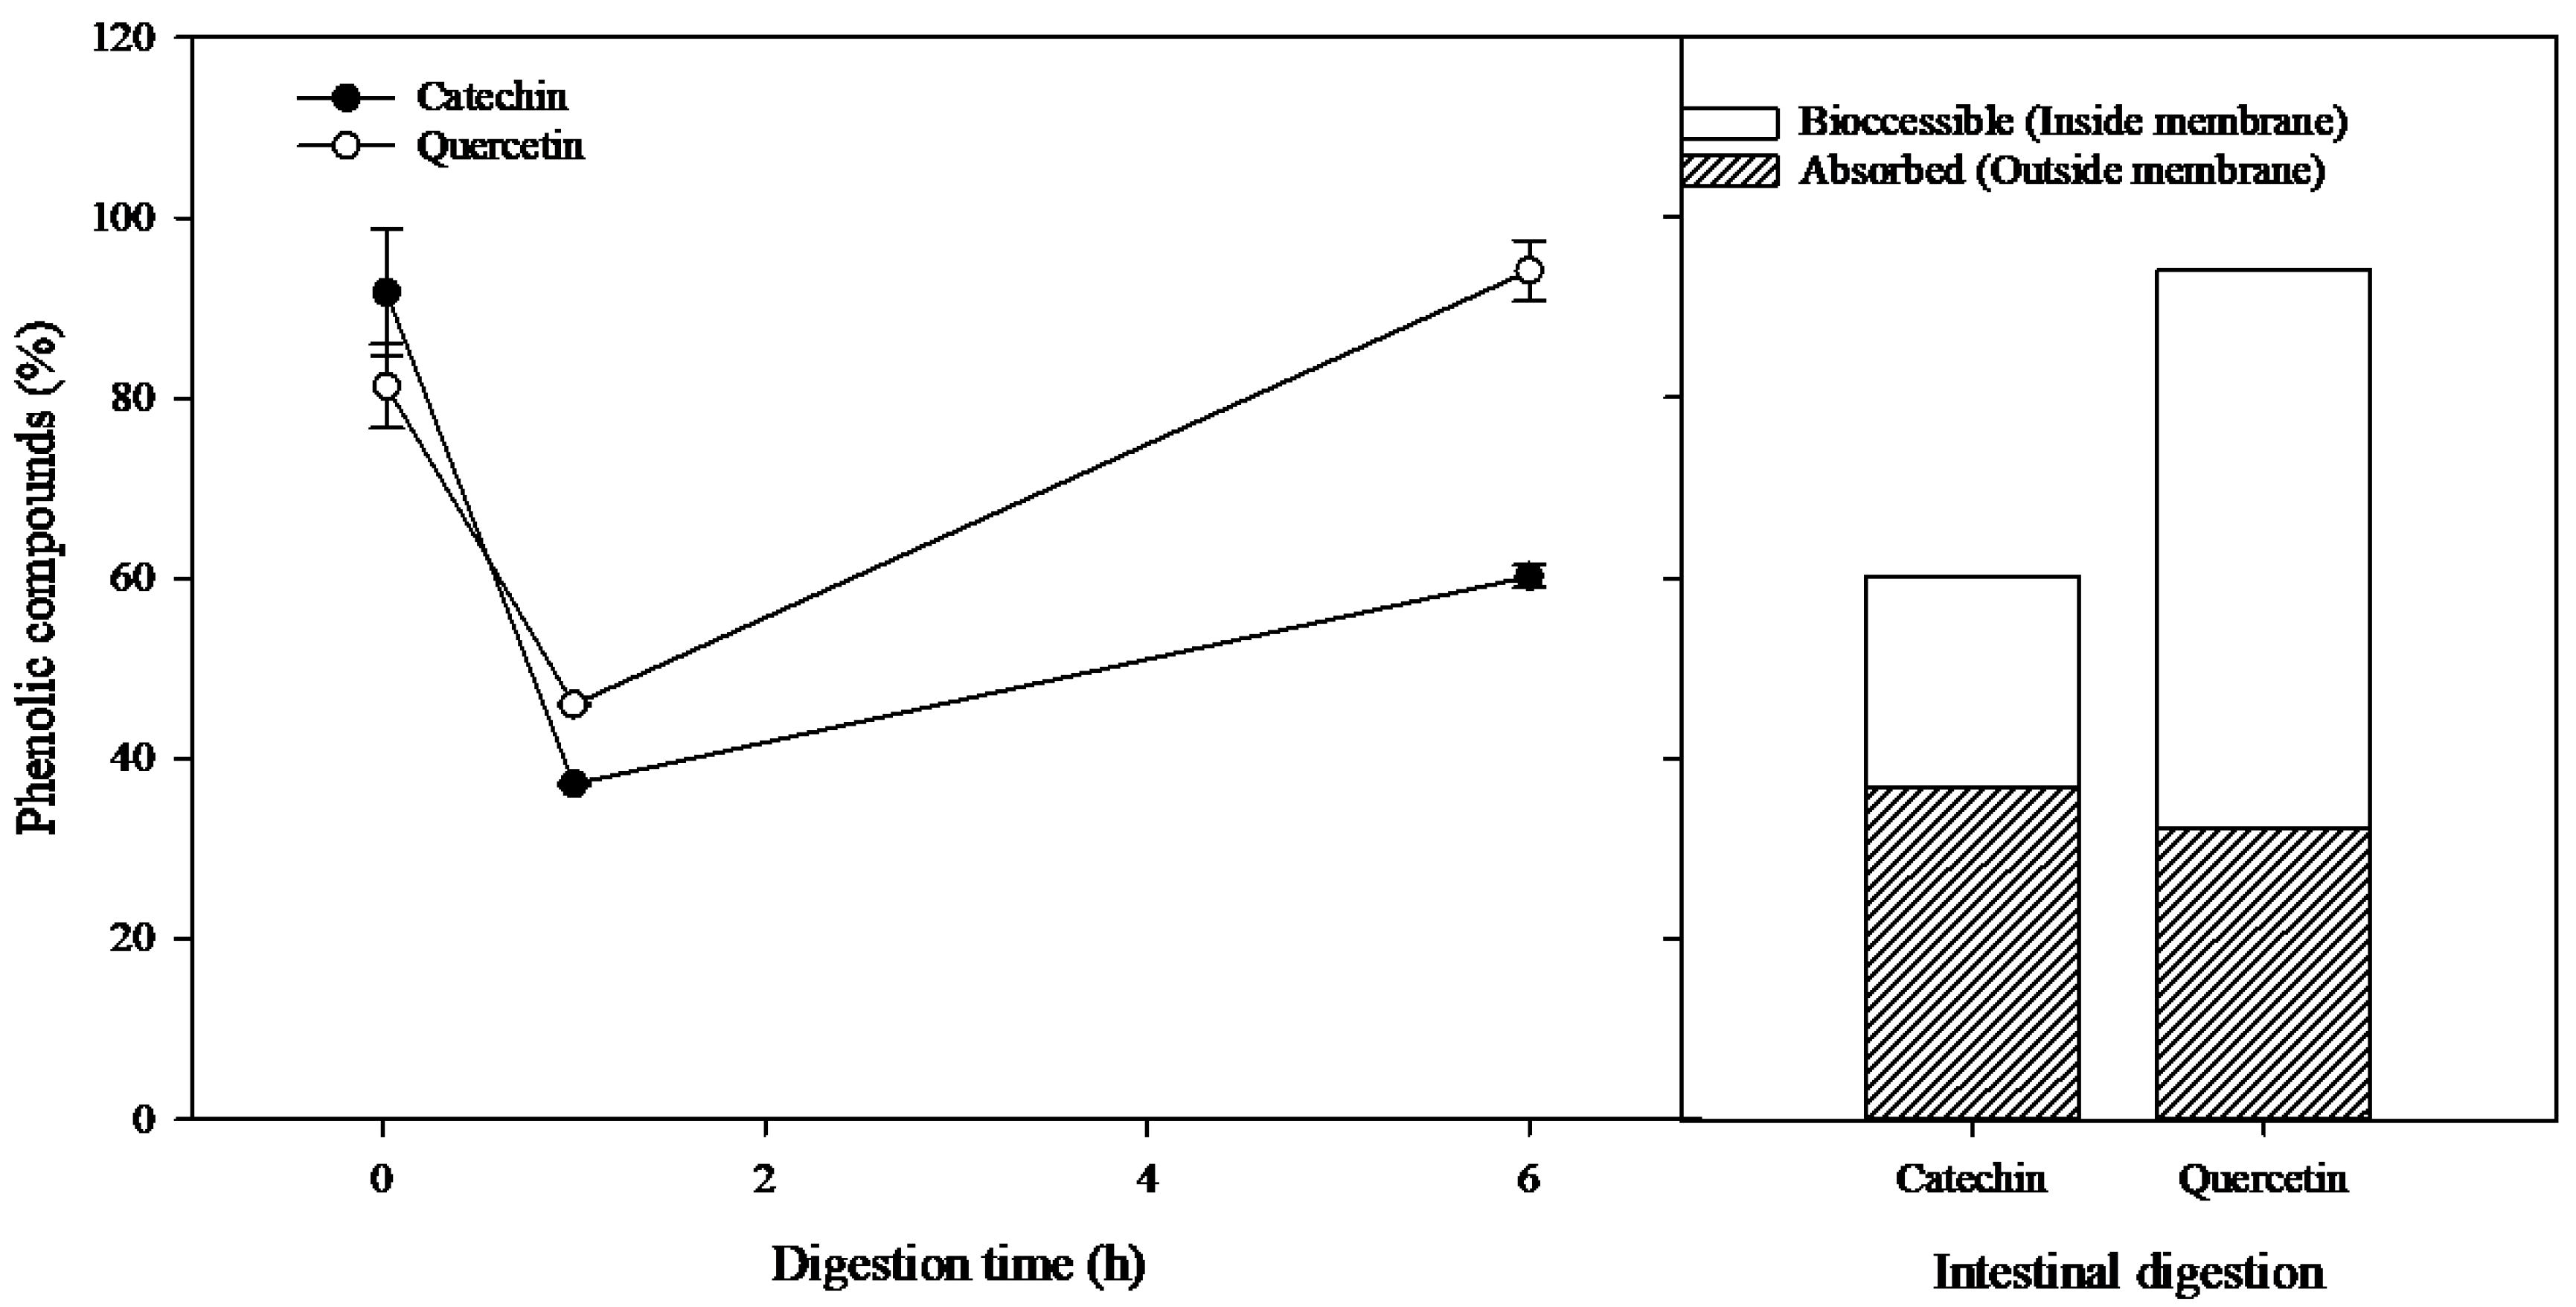
3.4. Bioaccessible and Absorbed Phenolic Compounds by Simulated Digestion

Simulated digestion was used to determine the amounts of bioaccessible and absorbed phenolic compounds in the intestines; the results are shown in Table 2. Protocatechuic acid, quercetin, and catechin were quantified in all grape varieties after intestinal digestion, while p-coumaric acid was quantified only in the ‘Autumn Royal’ variety. Protocatechuic acid was most bioaccessible in the ‘Superior’ (35.23 ± 0.13 µg/g DW) and ‘Flame Seedless’ (31.67 ± 0.46 µg/g DW) varieties; quercetin in ‘Flame Seedless’ (99.48 ± 0.76 µg/g DW) and ‘Red Globe’ (85.19 ± 1.90 µg/g DW); while the catechin content was significantly higher (p < 0.05) in the ‘Flame Seedless’ variety (1086.51 ± 1.83 µg/g DW).
Regarding phenolic compounds absorbed during simulated digestion, the ‘Flame Seedless’ variety showed the maximum contents of protocatechuic acid (18.58 ± 0.38 µg/g DW), quercetin (440.02 ± 4.09 µg/g DW), and catechin absorbed (1579.71 ± 0.67 µg/g DW) (p < 0.05), as compared with other varieties, while p-coumaric acid was only absorbed in the ‘Autumn Royal’ variety. Catechin was the most bioaccessible and readily absorbed compound across all evaluated varieties (p < 0.05), while the ‘Flame Seedless’ variety exhibited the highest content of this phenolic.
It was observed that the enzymatic treatment applied during the simulated digestion and absorption process significantly enhanced the bioavailability and content of protocatechuic acid, quercetin, and catechin, in contrast with the initially quantified compounds of grape methanolic extract (Table 1 and Table 2). These results indicate that phenolic compounds were released from the food matrix during the simulated digestion.
On the other hand, to understand the effect of conditions used during digestion and absorption simulation on phenolic compounds, catechin and quercetin in their pure forms were subjected to the same simulation used with grape byproducts; the results are shown in Figure 6.
It was observed that quercetin was stable under simulation conditions, and the end product of intestinal simulation was 94.15 ± 3.38% of the initial amount subjected to the simulation, which was distributed across bioaccessible (61.88 ± 3.38%) and absorbed quercetin (32.27 ± 0.02%). However, the simulation conditions did affect the bioaccessibility of catechin, resulting in 60.28 ± 1.26% at the end of the intestinal phase of the initial amount subjected to simulated digestion (23.57 ± 1.26% bioaccessible and 36.70 ± 0.10% absorbed). These data are relevant when considering the use of grape by-products as sources of bioactive compounds from which nutraceuticals and functional foods can be produced; however, additional research is required involving interactions with the food matrix, including interactions with proteins, carbohydrates, lipids, enzymes, and other compounds.

4. Discussion

Grapes are popular fruits, although those from Northwest Mexico have been minimally studied, and their by-products have received even less attention regarding their potential use. The present study therefore sought to determine the phenolic content, phenolic profile, and AOC of different grape varieties produced in the region that were non-marketable due to them not meeting export quality, in order to promote their use and avoid discarding them as by-products. This information is particularly relevant, since the analyzed variables are affected by conditions like climate, which is extreme in the region (45–47 °C), as compared with more temperate grape-producing areas. We were able to identify that the TPC content and antioxidant activity were higher in the darker varieties, as compared with the green varieties. This is consistent with the findings reported by Vo et al. [21], who analyzed the TPC content in five green grape varieties grown in Australia and reported similar TPC values between 1.73 and 4.31 mg GAE/g. Our results also showed that TPC and AOC were higher in all grape skins, as compared with pulp + seed, with higher values in the skin of ’Autumn Royal’, a dark variety. These results are consistent with those of Muzolf-Panek and Waśkiewic [22], who evaluated the TPC and AOC contents using the DPPH method in the skin of five table grape varieties, and identified that ‘Autumn Royal’ skin contains higher TPC and AOC contents (7.13 ± 0.36 mg GAE/g DW and 62.21 ± 8.06 µmol TE/g DW, respectively) than varieties like ‘Red Globe’ (2.58 ± 0.13 mg GAE/g DW and 32.03 ± 6.41 µmol TE/g DW, respectively). This can be explained by phenolic compounds being secondary metabolites concentrated in skin, since they provide necessary defense from abiotic stresses like UV rays, drought, and temperature, or biotic ones like pests [23]. Radulescu et al. [24] reported similar variations in TPC and AOC among Romanian grape pomace varieties, which consists of residues formed mainly by the residual grape skin from the fermentation process, in particular, identifying higher TPC in blue–black grapes (23.87–26.65 mg GAE/g DW), as compared with yellow–green ones (17.16–18.47 mg GAE/g DW). Likewise, said authors evaluated the AOC by DPPH and reported a similar behavior, where darker grapes presented a lower IC50 value (15.59–19.10 μg GAE/mL) to stabilize the DPPH radical, as compared with lighter grapes (24.16–26.35 μg GAE/mL). Although the TPC values obtained by the authors are higher than those obtained in our research, this could be explained by the fact that they come from residual grape skin from fermentation, which can positively influence the extraction process of phenolic compounds. Phenolic compounds in grape skin could be utilized by the juice and distillates industries (brandy, wine), since the skin remains as a by-product of pressing (pomace), which could be used as a source of these compounds, instead of discarding it [25].
Atiq et al. [26] reported that the administration of 1.37 mg of Trolox/d (50 mg Trolox/kg weight) to 25–30 g male mice was sufficient to reduce oxidative stress by increasing the expression of nuclear factor erythroid-2-related factor 2 (Nrf2) and heme oxygenase-1 (HO-1). Therefore, considering the AOC in Trolox equivalents obtained for ’Autumn Royal’ and ’Flame Seedless’ skin (67.9 ± 1.70 μmol TE/g DW and 44.75 ± 2.26 μmol TE/g DW, respectively), which is equivalent to 16.9 and 11.20 mg of Trolox/g DW, respectively, 80 and 122 mg of ‘Autumn Royal’ and ’Flame Seedless’ skin would be theoretically required to induce the beneficial antioxidant effect in mice reported by the authors. Although the dose can be easily obtained from the analyzed grape by-products, in vivo experiments are required to confirm such effects.
The phenolic compounds contained in grape by-products are associated in part with their AOC, as determined by different methods. This correlation and significant contribution of phenolic compounds to AOC has been previously reported [24]. The AOC of phenolic compounds is due to their potential to transfer a single electron or an H+ to unstable molecules or free radicals. However, each phenolic compound has a different AOC that depends on its chemical structure, but also on the assay used for its evaluation. Additionally, in mixtures of phenolic compounds like extracts, synergistic, antagonistic, or additive effects may also alter their AOC due to the interactions that can occur between the various compounds contained in the mixture [27].
Data on individual phenolic compounds (Table 1) are particularly useful for identifying viable sources from which these compounds can be extracted for industrial applications. Regarding individual phenolic compounds contained in grape by-products, ‘Flame Seedless’ > ‘Autumn’—‘Perlette’—‘Superior’ varieties had higher contents in the skin. Catechin, quercetin, and rutin were identified as major compounds in all of the evaluated grape skin varieties. García-Martínez et al. [28] found similar results to the ones reported herein, according to higher values of catechin and quercetin, as compared with other compounds in the majority of grape juices evaluated. It is important to mention that the extraction of phenolic compounds influences their identification and subsequent quantification; this is because each phenolic compound requires optimized conditions for its best individual extraction [25]. Averilla et al. [29] reported that preheating grape skins above 75 °C significantly improved resveratrol extraction, which positively influenced the antioxidant capacity of the extract. The use of high temperatures during extraction can improve the extraction of some phenolic compounds, although it can affect the recovery of thermosensitive ones [10].
Other non-conventional extraction methods like supercritical fluid extraction, pulsed-field extraction, and mechanical extraction are promising for optimized phenolic extraction [10,25]. Therefore, one of the limitations of this research was that the same extraction method (solid–liquid) was used to extract all the phenolic compounds, although individualized extraction or the use of unconventional methods may increase economic cost, time, and waste generated by the extraction process, which reduces sustainability, viability, and profitability. This is counterproductive when the end goal of research is to introduce byproducts into a second value chain with a focus on circular economy.
Regarding health benefits, Shahid et al. [30] reported that administering catechin hydrate to mice (20 and 40 mg/kg of body weight via gavage for 7 days) increases AOC and regulates benzo(a)pyrene-induced inflammation and apoptosis. The administered dose was equivalent to 550 μg of catechin per 25–30 g of mouse. According to these results and the ones reported herein, 1 g of grape skin by-product of the ‘Autumn Royal’ variety contains 151.49 µg of catechin (Table 1), so it would be necessary to administer 3.63 g of the by-product to induce the mentioned effects. This shows the potential of grape by-products for their application in obtaining nutraceuticals, functional foods, and other applications in the food and pharmaceutical industries.
The chemical–enzymatic conditions used in the simulated digestion induced the release of protocatechuic acid, catechin, and quercetin from the food matrix of all the grape varieties evaluated, thereby increasing their bioaccessibility. Catechin in particular was found to be highly bioaccessible. The simulated digestion also showed that these compounds were available to be absorbed during the intestinal stage. This is a significant finding, since phenolic compounds are mainly absorbed in the small intestine by enterocytes, and the remnants are used in the colon by the microbiota, where they can also induce benefits [31]. In this regard, it was recently reported that the greater abundance of two catechin-metabolizing bacteria, Eggerthella and Flavonifractor, in the distal colon induced the production of phenylvaleric acid and valerolactone analogues that can subsequently form metabolites with potential health benefits, including smaller phenolic acids and short-chain fatty acids [32].
It is known that phenolic compounds can be negatively affected by the chemical–enzymatic conditions used during simulated digestion; our results indicate that catechin is particularly affected (Figure 6). In this regard, Alburquerque et al. [33] reported that the stability of catechin solutions is affected by pH. Additionally, the bioaccessibility and absorption of phenolic compounds can be altered by their interaction with enzymes used during digestion simulation. It has been reported that different phenolics can interact with amylases and pepsins, even forming complexes or new compounds [18,34]. However, the obtained results from simulated digestion indicate that quercetin is not affected by these factors, while catechin is.
In the case of compounds not quantified in the intestinal simulation stage, including ferulic acid, sinapic acid, rutin, and resveratrol, it was not possible to establish whether their absence was due to the simulated conditions, or to interactions between the compounds themselves or others present in the food matrix. It was previously reported that the bioaccessibility of hydroxycinnamic acids (sinapic acid and caffeic acid) can be affected by interactions with the food matrix, particularly with complex polysaccharides [18,34]; however, additional studies are required for each compound in order to understand their possible interactions and modifications during simulated digestion and how these events affect their bioaccessibility and absorption.
The contents of quercetin, catechin, and protocatechuic acid observed in grape by-products, as well as their bioaccessibility and potential absorption, creates the opportunity to use these by-products to obtain nutraceuticals and bioactive compounds, or incorporate them into functional food formulations and other possible applications in the food and pharmaceutical industries.
The authors recognize that other simulated digestion methods may provide more accurate information regarding human intestinal permeability, including a Caco-2 cell line model and passive permeability methods [19,20]; thus, this could be considered a limitation that can be improved in future analyses.

5. Conclusions

The present study provides evidence regarding the content of phenolic compounds in grape by-products and their antioxidant capacity. It shows that quercetin, catechin, and protocatechuic acid are released from the food matrix during digestion and are available for absorption, although catechin and quercetin are present in higher proportions. Likewise, quercetin and a higher proportion of catechin resist the chemical–enzymatic conditions of in vitro digestion, thereby increasing their biological potential. This makes grape by-products attractive for obtaining nutraceuticals, formulating functional foods, or including them in other applications in the food and pharmaceutical industries. Additional research is required to evaluate the aforementioned potential applications, ensuring that these alternative uses are profitable and sustainable.

Author Contributions

Conceptualization, N.J.S.-L.; Formal analysis, N.J.S.-L., R.M.R.-S. and J.C.A.-G.; Funding acquisition, N.J.S.-L.; Investigation, N.J.S.-L. and J.A.D.-A.; Methodology, N.J.S.-L. and R.M.R.-S.; Project administration, N.J.S.-L.; Resources, N.J.S.-L., R.M.R.-S. and G.A.G.-A.; Supervision, N.J.S.-L.; Validation, J.A.D.-A.; Visualization, N.J.S.-L. and J.A.D.-A.; Writing—original draft, N.J.S.-L. and J.C.A.-G.; Writing—review & editing, N.J.S.-L., R.M.R.-S., J.A.D.-A., G.A.G.-A. and E.M.-B. All authors have read and agreed to the published version of the manuscript.

Funding

This research was funded by project number 106/2/C/84/24: “Revalorization de subproductos de dátil como sustrato para el cultivo de Lactobacillus rhamnosus y Saccharomyces boulardii con potencial aplicación como probiótico, posbiótico y fuente de proteína bioaccesible” from Universidad Autónoma de Baja California.

Data Availability Statement

The original contributions presented in the study are included in the article, further inquiries can be directed to the corresponding author/s.

Acknowledgments

The authors thank San Luis field for the support and the donated grapes. J.C. Armenta-Gorosave thanks SECIHTI for the scholarship to obtain his Doctoral Degree.

Conflicts of Interest

The authors declare no conflicts of interest. The funders had no role in the design of the study; in the collection, analyses, or interpretation of data; in the writing of the manuscript; or in the decision to publish the results.

References

  1. Eves, A.; Kim, B.; Hodgkins, C.; Raats, M.; Timotijevik, L. Is it food or is it waste? determinants of decisions to throw food away. Sustain. Prod. Consum. 2025, 54, 43–51. [Google Scholar] [CrossRef]
  2. Programa de las Naciones Unidas Para el Medio Ambiente. Informe Sobre el Índice de Desperdicio de Alimentos. Available online: https://www.unep.org/resources/publication/food-waste-index-report-2024 (accessed on 29 March 2025).
  3. Statista, M.; Shahbandeh. Global Grape Production 2012/13–2023/2024. Available online: https://www.statista.com/statistics/237600/world-grape-production-in-2007-by-region/ (accessed on 29 March 2025).
  4. Statista Research Department Mexico: Industrial Grape Production Volume 2014–2023. Available online: https://www.statista.com/statistics/1029649/grape-production-mexico/ (accessed on 29 March 2025).
  5. SIAP Producción de uva en México 2022. Available online: https://www.gob.mx/cms/uploads/attachment/file/771603/Producci_n_Uva_en_M_xico.pdf (accessed on 29 March 2025).
  6. Machado, A.R.; Voss, G.B.; Machado, M.; Paiva, J.A.P.; Nunes, J.; Pintado, M. Chemical characterization of the cultivar ‘vinhão’ (Vitis vinifera L.) grape pomace towards its circular valorisation and its health benefits. Meas. Food 2024, 15, 100175. [Google Scholar] [CrossRef]
  7. Sabra, A.; Netticadan, T.; Wijekoon, C. Grape bioactive molecules, and the potential health benefits in reducing the risk of heart diseases. Food Chem. X 2021, 12, 100149. [Google Scholar] [CrossRef] [PubMed]
  8. Coelho, M.C.; Pereira, R.N.; Rodrigues, A.S.; Teixeira, J.A.; Pintado, M.E. The use of emergent technologies to extract added value compounds from grape by-products. Trends Food Sci. Technol. 2020, 106, 182–197. [Google Scholar] [CrossRef]
  9. Cui, W.; Xu, B.; Chen, F.; Shen, W.; Wan, F.; Cheng, A. Effects of grape peel phenolics on lipid accumulation in sodium palmitate-treated HepG2 cells. J. Funct. Foods 2024, 112, 105923. [Google Scholar] [CrossRef]
  10. Karastergiou, A.; Gancel, A.L.; Jourdes, M.; Teissedre, P.L. Valorization of grape pomace: A review of phenolic composition, bioactivity, and therapeutic potential. Antioxidants 2024, 13, 1131. [Google Scholar] [CrossRef]
  11. Rodriguez, L.; Muñoz-Bernal, Ó.A.; Fuentes, E.; Alvarez-Parrilla, E.; Palomo, I. Antiplatelet activity of phenolic compounds-fortified merlot wine and pure phenolic compounds. Appl. Sci. 2024, 14, 5707. [Google Scholar] [CrossRef]
  12. Magrone, T.; Magrone, M.; Russo, M.A.; Jirillo, E. Recent advances on the anti-inflammatory and antioxidant properties of red grape polyphenols: In vitro and in vivo studies. Antioxidants 2020, 9, 35. [Google Scholar] [CrossRef]
  13. Salazar-López, N.J.; Loarca-Piña, G.; Campos-Vega, R.; Gaytán Martínez, M.; Morales Sánchez, E.; Esquerra-Brauer, J.M.; Gonzalez-Aguilar, G.A.; Robles Sánchez, M. The extrusion process as an alternative for improving the biological potential of sorghum bran: Phenolic compounds and antiradical and anti-inflammatory capacity. Evid. Based Complement. Alternat Med. 2016, 2016, 8387975. [Google Scholar] [CrossRef]
  14. Salazar-López, N.J.; González-Aguilar, G.A.; Loarca-Piña, G.; Cinco-Moroyoqui, F.J.; Rouzaud-Sández, O.; Domínguez-Avila, J.A.; Robles-sánchez, M. Contribution and interactions of hydroxycinnamic acids found in bran and wholegrain sorghum (Sorghum bicolor L. Moench): Effects on the antioxidant capacity and inhibition of human erythrocyte hemolysis. Oxidative Med. Cell. Longev. 2017, 2017, 8219023. [Google Scholar] [CrossRef]
  15. Association of Official Analytical Chemistry (Ed.) AOAC Official Methods of Analysis, 16th ed.; Association of Official Analytical Chemistry: Washington, DC, USA, 1995.
  16. Valenzuela González, M.; Cárdenas López, J.L.; Burgos Hernández, A.; Salazar López, N.J.; Viuda Martos, M.; Ruiz Hernández, A.A.; Robles Sánchez, R.M. Quinoa treated by an optimized method of microwave heating and their effect on antioxidant activity and phenolic compounds after in vitro gastrointestinal digestion. CYTA-J. Food 2023, 21, 751–759. [Google Scholar] [CrossRef]
  17. Dordai, L.; Simedru, D.; Cadar, O.; Becze, A. Simulated gastrointestinal digestion of nutritive raw bars: Assessment of nutrient bioavailability. Foods 2023, 12, 2300. [Google Scholar] [CrossRef] [PubMed]
  18. Salazar-López, N.J.; González-Aguilar, G.A.; Rouzaud-Sández, O.; Robles-Sánchez, M. Bioaccessibility of hydroxycinnamic acids and antioxidant capacity from sorghum bran thermally processed during simulated in vitro gastrointestinal digestion. J. Food Sci. Technol. 2018, 55, 2021–2030. [Google Scholar] [CrossRef]
  19. Berben, P.; Brouwers, J.; Augustijns, P. Assessment of passive intestinal permeability using an artificial membrane insert system. J. Pharm. Sci. 2018, 107, 250–256. [Google Scholar] [CrossRef] [PubMed]
  20. Perales-Vázquez, G.D.C.; Mercado-Mercado, G.; De la Rosa, L.A.; Sáyago-Ayerdi, S.G. Bioaccesibilidad y cinética de liberación in vitro de compuestos fenólicos en algunas salsas de la cocina mexicana. TIP Rev. Esp. C Quím-Biol. 2020, 23, 1–9. [Google Scholar] [CrossRef]
  21. Vo, G.T.; Liu, Z.; Chou, O.; Zhong, B.; Barrow, C.J.; Dunshea, F.R.; Suleria, H.A.R. Screening of phenolic compounds in australian grown grapes and their potential antioxidant activities. Food Biosci. 2022, 47, 101644. [Google Scholar] [CrossRef]
  22. Muzolf-Panek, M.; Waśkiewicz, A. Relationship between phenolic compounds, antioxidant activity and color parameters of red table grape skins using linear ordering analysis. Appl. Sci. 2022, 12, 6146. [Google Scholar] [CrossRef]
  23. Qaderi, M.M.; Martel, A.B.; Strugnell, C.A. Environmental factors regulate plant secondary metabolites. Plants 2023, 12, 447. [Google Scholar] [CrossRef]
  24. Radulescu, C.; Olteanu, R.L.; Buruleanu, C.L.; Nechifor, M.; Dulama, I.D.; Stirbescu, R.M.; Bucurica, I.A.; Stanescu, S.G.; Banica, A.L. Polyphenolic screening and the antioxidant activity of grape pomace extracts of romanian white and red grape varieties. Antioxidants 2024, 13, 1133. [Google Scholar] [CrossRef]
  25. Perra, M.; Leyva-Jiménez, F.J.; Manca, M.L.; Manconi, M.; Rajha, H.N.; Borrás-Linares, I.; Segura-Carretero, A.; Lozano-Sánchez, J. Application of pressurized liquid extraction to grape by-products as a circular economy model to provide phenolic compounds enriched ingredient. J. Clean. Prod. 2023, 402, 136712. [Google Scholar] [CrossRef]
  26. Atiq, A.; Lee, H.J.; Khan, A.; Kang, M.H.; Rehman, I.U.; Ahmad, R.; Tahir, M.; Ali, J.; Choe, K.; Park, J.S.; et al. Vitamin E analog trolox attenuates MPTP-induced Parkinson’s disease in mice, mitigating oxidative stress, neuroinflammation, and motor impairment. Int. J. Mol. Sci. 2023, 24, 9942. [Google Scholar] [CrossRef] [PubMed]
  27. Skroza, D.; Šimat, V.; Vrdoljak, L.; Jolić, N.; Skelin, A.; Čagalj, M.; Frleta, R.; Generalić Mekinić, I. Investigation of antioxidant synergisms and antagonisms among phenolic acids in the model matrices using FRAP and ORAC methods. Antioxidants 2022, 11, 1784. [Google Scholar] [CrossRef] [PubMed]
  28. García-Martínez, D.J.; Arroyo-Hernández, M.; Posada-Ayala, M.; Santos, C. The high content of quercetin and catechin in airen grape juice supports its application in functional food production. Foods 2021, 10, 1532. [Google Scholar] [CrossRef]
  29. Averilla, J.N.; Oh, J.; Wu, Z.; Liu, K.H.; Jang, C.H.; Kim, H.J.; Kim, J.S.; Kim, J.S. Improved extraction of resveratrol and antioxidants from grape peel using heat and enzymatic treatments. J. Sci. Food Agric. 2019, 99, 4043–4053. [Google Scholar] [CrossRef]
  30. Shahid, A.; Ali, R.; Ali, N.; Hasan, S.K.; Bernwal, P.; Afzal, S.M.; Vafa, A.; Sultana, S. Modulatory effects of catechin hydrate against genotoxicity, oxidative stress, inflammation and apoptosis induced by benzo(a)pyrene in mice. Food Chem. Toxicol. 2016, 92, 64–74. [Google Scholar] [CrossRef]
  31. Zhang, Q.; Xu, Y.; Bukvicki, D.; Peng, Y.; Li, F.; Zhang, Q.; Yan, J.; Lin, S.; Liu, S.; Qin, W. Phenolic compounds in dietary target the regulation of gut microbiota: Role in health and disease. Food Biosci. 2024, 62, 105107. [Google Scholar] [CrossRef]
  32. Li, Q.; Stautemas, J.; Omondi Onyango, S.; De Mey, M.; Duchi, D.; Tuenter, E.; Hermans, N.; Calders, P.; Van de Wiele, T. Human gut microbiota stratified by (+)-catechin metabolism dynamics reveals colon region-dependent metabolic profile. Food Chem. 2023, 408, 135203. [Google Scholar] [CrossRef]
  33. Albuquerque, B.R.; Prieto, M.A.; Barros, L.; Ferreira, I.C.F.R. Assessment of the stability of catechin-enriched extracts obtained from arbutus unedo l. fruits: Kinetic mathematical modeling of pH and temperature properties on powder and solution systems. Ind. Crops Prod. 2017, 99, 150–162. [Google Scholar] [CrossRef]
  34. Domínguez-Avila, J.A.; Wall-Medrano, A.; Velderrain-Rodríguez, G.R.; Chen, C.Y.O.; Salazar-López, N.J.; Robles-Sánchez, M.; González-Aguilar, G.A. Gastrointestinal interactions, absorption, splanchnic metabolism and pharmacokinetics of orally ingested phenolic compounds. Food Funct. 2017, 8, 15–38. [Google Scholar] [CrossRef]
Figure 1. Representative images of fresh grape varieties: ‘Flame Seedless’, ‘Superior’, ‘Perlette’, ‘Red Globe’, and ‘Autumn Royal’.
Resources 14 00065 g001
Figure 2. General diagram of simulated digestion and apparent absorption assay.
Resources 14 00065 g002
Figure 3. Total phenolic compounds (TPCs) of grape skin and pulp + seeds of five grape varieties. The statistical analysis was carried out separately for the skin and pulp + seed of five grape varieties. Each bar represents the mean of TPC ± SEM (n = 5). Skin: Different lowercase letters on the bars indicate significant differences between TPCs contained in the skin of the five grape varieties (p < 0.05). Pulp + seed: Different uppercase letters on the bars indicate significant differences between TPCs contained in the pulp + seed of the five grape varieties (p < 0.05). (GAEs) Gallic acid equivalents. (DW) dry weight. An asterisk (*) denotes seedless varieties.
Resources 14 00065 g003
Figure 4. Antioxidant capacity TEAC (Trolox-equivalent antioxidant capacity) and DPPH assays of grape skin and pulp + seeds in five grape varieties. Each bar in both graphs represents the mean ± SEM of values obtained (n = 5). Statistical analyses were carried out separately for TEAC and DPPH for skin and pulp + seed of five grape varieties. TEAC: Different lowercase letters on the bars indicate significant differences between the skins of the five grape varieties (p < 0.05), while different uppercase letters on the bars indicate significant differences between the pulp + seeds of five grape varieties (p < 0.05). DPPH: Different lowercase letters on the bars indicate significant differences between the skins of the five grape varieties (p < 0.05), while different uppercase letters on the bars indicate significant differences between the pulp + seeds of five grape varieties (p < 0.05). (DW) dry weight. (TEs) Trolox equivalents. An asterisk (*) denotes seedless varieties.
Resources 14 00065 g004
Figure 5. Representative UPLC-DAD chromatograms for the following wavelengths: (A) 280 nm: (1) protocatechuic acid, (2) hydroxycinnamic acid, and (3) catechin; (B) 320 nm: (4) p-coumaric acid, (5) ferulic acid, (6) sinapic acid, and (8) resveratrol; (C) 360 nm: (7) rutin and (9) quercetin.
Resources 14 00065 g005
Figure 6. Bioaccessibility and absorption of catechin and quercetin during a simulated digestion. Results expressed as % mean ± SEM (n = 5).
Resources 14 00065 g006
Table 1. Phenolic compounds of skin and pulp + seed from five grape varieties quantified by UPLC-DAD.
VarietiesProtocatechuic AcidQuercetinp-Coumaric AcidFerulic AcidSinapic AcidRutinResveratrolCatechinTotal Phenolic Compounds
Skin
‘Flame Seedless’ *ND96.26 ± 1.87 B3.32 ± 0.08 B0.91 ± 0.03 BND174.74 ± 2.15 A5.25 ± 0.13 A111.70 ± 2.45 B387.66 ± 7.94 A
‘Superior’ *0.83 ± 0.02107.03 ± 3.92 B2.89 ± 0.09 B1.19 ± 0.04 A1.69 ± 0.09 A20.18 ± 0.24 C4.88 ± 0.18 A114.55 ± 0.72 B251.57 ± 5.64 B
‘Perlette’ *ND97.83 ± 1.45 B3.48 ± 0.05 B1.16 ± 0.04 A1.78 ± 0.02 A116.59 ± 2.86 BND110.27 ± 1.27 B291.84 ± 20.09 B
‘Red Globe’ND68.37 ± 2.51 C4.15 ± 0.10 A1.15 ± 0.04 A1.86 ± 0.05 A22.87 ± 0.48 C4.31 ± 0.12 B107.50 ± 3.12 B202.20 ± 6.70 C
‘Autumn Royal’ND118.90 ± 3.25 ANDNDND18.12 ± 0.35 C4.67 ± 0.18 AB151.49 ± 2.39 A290.85 ± 4.19 B
Pulp + seed
‘Flame Seedless’ *ND39.62 ± 1.39 c2.61 ± 0.01 b0.91 ± 0.03 b1.49 ± 0.05 bNDND99.26 ± 2.59 b142.53 ± 4.30 d
‘Superior’ *0.95 ± 0.0358.41 ± 0.88 b2.67 ± 0.05 b0.99 ± 0.02 b1.71 ± 0.03 a3.32 ± 0.064.70 ± 0.05 a107.57 ± 1.46 a180.32 ± 2.57 b
‘Perlette’ *ND58.48 ± 0.71 b2.78 ± 0.02 bND1.65 ± 0.01 aNDND110.48 ± 0.54 a173.39 ± 1.26 bc
‘Red Globe’ND113.55 ± 0.55 a3.22 ± 0.10 a1.14 ± 0.05 a1.68 ± 0.05 aND3.82 ± 0.12 b110.59 ± 3.27 a232.73 ± 3.45 a
‘Autumn Royal’ND58.92 ± 0.72 b2.62 ± 0.02 b1.00 ± 0.01 bNDNDND102.46 ± 1.00 ab164.66 ± 0.75 c
Sum: skin + (pulp + seed)
‘Flame Seedless’ *ND135.88 ± 3.74 B5.93 ± 0.16 BC1.82 ± 0.06 B1.49 ± 0.05 B174.74 ± 2.15 A5.25 ± 0.13 C210.97 ± 4.91 B530.19 ± 17.75 A
‘Superior’ *1.78 ± 0.04165.45 ± 7.85 A5.56 ± 0.18 C2.18 ± 0.08 A3.40 ± 0.18 A23.50 ± 0.55 C9.58 ± 0.35 A222.12±1.60 B431.89±12.61 C
‘Perlette’ *ND156.31 ± 2.89 AB6.26 ± 0.11 B1.16 ± 0.04 C3.42 ± 0.04 A116.59 ± 2.86 BND220.74 ± 2.54 B505.35 ± 5.33 AB
‘Red Globe’ND181.93 ± 5.03 A7.37 ± 0.20 A2.29 ± 0.09 A3.54 ± 0.10 A22.87 ± 0.48 C8.13 ± 0.24 B218.08 ± 6.25 B434.93 ± 13.40 C
‘Autumn Royal’ND180.82 ± 3.25 A2.62 ± 0.02 D1.00 ± 0.01 CND18.12 ± 0.35 C4.67 ± 0.18 C252.36 ± 6.02 A457.33 ± 10.98 BC
Units are µg/g DW, and are expressed as the mean ± SEM (n = 5). Statistical analyses were individually performed for each of the three fractions (skin, pulp + seed, or sum of skin + (pulp + seed)) of five grape varieties. Skin: Different uppercase letters in each column indicate significant differences in the content of each compound in the skins of five grape varieties (p < 0.05). Pulp + seed: Different lowercase letters in each column indicate significant differences in the content of each compound in pulp + seeds of five grape varieties (p < 0.05). Sum of skin + (pulp + seed): Different uppercase letters in each column represent significant differences in the content of each compound in the sum of skin + (pulp + seed) of five grape varieties (p < 0.05). An asterisk denotes (*) seedless varieties. ND, not detected.
Table 2. Bioaccessible and absorbed phenolic compounds in a simulated digestion of five grape varieties.
VarietiesProtocatechuic AcidQuercetinp-Coumaric AcidFerulic AcidSinapic AcidRutinResveratrolCatechin
Bioaccessible Compounds (Inside the Membrane)
‘Flame Seedless’ *31.67 ± 0.46 ab99.48 ± 0.76 aNDNDNDNDND1086.51 ± 1.83 a
‘Superior’ *35.23 ± 0.13 a66.87 ± 3.78 cNDNDNDNDND847.67 ± 8.82 b
‘Perlette’ *25.94 ± 2.17 bc73.69 ± 2.71 bcNDNDNDNDND787.52 ± 35.55 b
‘Red Globe’27.67 ± 0.85 b85.19 ± 1.90 abNDNDNDNDND833.45 ± 33.33 b
‘Autumn Royal’20.47 ± 0.26 c53.53 ± 2.77 d31.54 ± 4.12NDNDNDND769.07 ± 11.97 b
Absorbed Compounds (Outside the Membrane)
‘Flame Seedless’ *18.58 ± 0.38 A440.02 ± 4.09 ANDNDNDNDND1579.71 ± 0.67 A
‘Superior’ *12.44 ± 0.36 B317.78 ± 2.98 BNDNDNDNDND1247.14 ± 14.08 B
‘Perlette’ *6.55 ± 0.72 D204.07 ± 4.12 DNDNDNDNDND1155.28 ± 53.10 B
‘Red Globe’8.54 ± 0.24 C244.20 ± 6.86 CNDNDNDNDND1223.59 ± 49.23 B
‘Autumn Royal’7.08 ± 0.27 CD205.95 ± 5.05 D42.83 ± 1.51NDNDNDND1093.38 ± 18.53 B
Sum of Bioaccessible + Absorbed Compounds
Total ‘Flame Seedless’ *50.26 ± 0.38 a539.50 ± 4.09 aNDNDNDNDND2666.22 ± 0.67 a
Total ‘Superior’ *47.67 ± 0.36 b384.66 ± 2.98 bNDNDNDNDND2094.81 ± 14.08 b
Total ‘Perlette’ *32.49 ± 0.72 d277.76 ± 4.12 dNDNDNDNDND1942.80 ± 53.10 bc
Total ‘Red Globe’36.21 ± 0.24 c329.39 ± 6.86 cNDNDNDNDND2057.04 ± 49.23 b
Total ‘Autumn Royal’27.56 ± 0.27 e259.48 ± 5.05 d74.37 ± 1.51NDNDNDND1862.46 ± 18.53 c
Units are µg/g DW, and are expressed as mean ± SEM (n = 5). Statistical analyses were carried out separately for each bioaccessible compound (inside the dialysis bag), for each absorbed compound (outside the dialysis bag), and for the total quantified compounds. Bioaccessible compounds (inside the membrane): Different lowercase letters in each column indicate significant differences between bioaccessible compounds between five grape varieties (p < 0.05). Absorbed compounds (outside the membrane): Different letters in each column indicate significant differences between absorbed compounds between five grape varieties (p < 0.05). Bioaccessible + absorbed compounds: Different lowercase letters in each column indicate significant differences between bioaccessible + absorbed compounds between five grape varieties (p < 0.05). An asterisk (*) denotes seedless varieties. ND, not detected.
Disclaimer/Publisher’s Note: The statements, opinions and data contained in all publications are solely those of the individual author(s) and contributor(s) and not of MDPI and/or the editor(s). MDPI and/or the editor(s) disclaim responsibility for any injury to people or property resulting from any ideas, methods, instructions or products referred to in the content.

