1. Introduction
People widely recognize waste generation as a result of population growth, consumerism, and a linear approach to industrialization [
1]. The World Bank highlights a global increase in waste production, with a solid waste generation that in 2020 raised up to 2.24 billion tonnes, equating to roughly 0.79 kg per person per day. Driven by rapid urbanization and population growth, this annual figure is projected to rise by 73% by 2050, reaching 3.88 billion tonnes. Developing countries experience the most severe effects of inadequate waste management. In low-income nations, over 90% of waste is disposed of in unregulated dumps or burned in open areas, resulting in significant health and environmental risks. It has become a global concern as the volumes of waste generated tend to increase in every part of the world, causing environmental, financial, and health problems [
2,
3].
The importance of waste extends to specific sectors where it can be valorized as a zero-burden resource and recycled into a secondary raw material that, then, can be processed into value-added commodities. Glass production is one of those sectors where that can be performed and generate remarkable environmental benefits: cullet has potential to be reprocessed into new glass, leading to environmental gains from avoided virgin glass making. As noted by Xuehong Yuan et al. [
4], glass is widely used in industries such as construction, automotive, everyday packaging, and other sectors [
5] with global production reaching around 300 million tons annually [
6]. This leads to significant waste generation worldwide [
6]. China, the world’s largest glass producer, generates over 20 Mtonne glass waste each year [
7]. This makes it urgently needed to accelerate the transition towards more sustainable circular economic systems that are centered upon waste prevention, as well as the sustainable management of those wastes whose generation cannot be prevented [
8,
9,
10]. The implementation of circular economy paradigms in all societal levels can, in fact, stimulate national economic growth, as it enables saving material costs, dampening price volatility, and improving the security of supply chains [
11,
12].
The European Union (EU) has developed a sustainability approach through a set of directives and programs, such as the legislative package, namely the Directive (EU) 2018/851, establishing waste management principles and targets for recycling for a wide range of materials [
13]. Glass is one of those for which the recycling target was set at 70% in 2025 and 75% in 2030 [
13]. The directive plays a significant role in the European waste management system, as it promotes the recirculation and recycling of packaging waste into value-added commodities. It should be emphasized, however, that the EU’s waste policy primarily defines waste reduction targets, particularly by promoting recycling [
14]. In the context of still relatively high landfill rates, the recycling targets established by the aforementioned EU directive are particularly significant, as they can stimulate diverting recyclable waste from landfills, making it possible to reduce environmental degradation and greenhouse gas emissions. It comes to an important policy act that can favor landfill dependency and promoting more sustainable waste management practices [
15]. In 2018, the EU-27 recovered only 54.2% of the total treated waste through recycling (38.1%), pit filling (10.1%), or energy recovery (6.0%). Landfilling (38.7%), incineration without energy recovery (0.7%), and other means (6.3%) managed the remaining 45.8% [
15]. Meeting those 70–75% recycling rates is now crucial for many industries to enhance their competitiveness by producing and marketing value-added commodities that comply with increasingly stringent standards of quality and economic–environmental sustainability in an integrated, holistic approach.
Until 2023, the glass sector experienced a systematic and uninterrupted increase in production. In contrast, 2023 saw the first decline in production of 8% compared to 2022 due to the conflict in Ukraine or tightening the EU regulations [
16,
17]. Nevertheless, the glass industry is one of the dominant sectors in Europe; the glass container sector, in particular, is the largest in the EU glass factory, as it represents around 50% of the global glass production of 130 million metric tons per year [
18,
19]. This increase in production leads to the generation of large quantities of post-use glass packaging, which must be managed as waste [
20]. The challenge lies in the fact that higher production volumes result in an increased volume of waste, presenting significant difficulties for waste management systems in terms of collection, sorting, and processing, thus posing a considerable threat to sustainable waste management [
19,
21]. In the context of sustainable development, this necessitates the adoption of effective recycling and resource recovery solutions to minimize the environmental impact associated with the growing production. Therefore, managers, producers, and researchers are increasingly focusing their efforts on optimizing and promoting reuse and recycling systems [
22,
23]. This should be attributed to the simple fact that food-packaging glass waste is 100% recyclable and, under optimal conditions, can be indefinitely recycled into added-value products under closed- and open-loop conditions without significant quality losses [
18,
24,
25]. In 2018, the global consumption of recycled glass for new package production stood at approximately 24 million metric tons, with projections indicating a 3.5% annual growth to nearly 29 million metric tons by 2023 [
26]. One of the main reasons for such an upward trend is, of course, the growing sales of glass-bottled craft beers, which is leading to a dynamic increase in the number of breweries, mainly in Italy, Great Britain, Canada, Japan, Australia, and Brazil [
27,
28]. Countries with deep-rooted markets and traditional breweries, like the Czech Republic, Germany, and Belgium, also exhibit this trend [
29].
The craft-beer market is characterized by the use of non-returnable bottles that are suitable only for recycling, not for refilling. This is primarily due to the desire of each brand to stand out and create a unique product. Such bottles will not be included in the deposit system because their unique shape and often their size do not fit the standardized bottle collection system. However, due to the Packaging and Packaging Waste Regulation (PPWR), which was expected to enter into force in the last quarter of 2024, all produced packaging must meet recycling requirements, including, among other things, enabling effective and efficient selective collection and allowing for large-scale recycling. This shift highlights the importance of ecodesign, which emphasizes the creation of products with minimal environmental impact. Ecodesign principles encourage manufacturers to consider the entire life cycle of packaging, ensuring that it is both easy to recycle and produced with materials that can be reused or repurposed. In the case of the craft-beer sector, while the use of non-returnable bottles serves branding goals, it also underscores the need for design innovations that align with sustainability objectives. This underscores the significance of incorporating ecodesign principles into the production and consumption of packed beers, as well as the disposal of glass bottles post-consumption [
30]. During this process, it is crucial to focus on transportation, as it can directly contradict several core environmental considerations of ecodesign, such as the use of materials with minimal environmental impact, the reduction in product distribution’s environmental impact, and the mitigation of the disposal phase’s environmental impact [
31].
Non-refillable means that in the case of end-of-life processes, they are not returned to manufacturers for refilling, but are selectively collected from municipal containers with glass cullet, then transported to packaging waste collection facilities, and after the final separation of the cullet, transported to glassworks for remelting into new glass products in open- or closed-loop systems.
The problem of the necessity to transport municipal waste (including sorted waste) over long distances primarily concerns Eastern European countries and is considered a weak point in the waste management system. The systems for collecting sorted waste are organized in a centralized manner, which leads to increased economic and environmental costs [
32]. The increasing centralization of waste processing facilities requires the organization of long-distance waste transport. Centralization involves the need to build trans-shipment stations and increases the distances that vehicles must cover, which leads to higher operational costs and emissions of harmful substances [
33]. Waste transport can account for as much as 60–80% of the costs associated with waste management [
34], which means that it is an important element of waste management in both economic and environmental aspects.
Transports are important to be taken into account, as they are involved in almost all phases of the supply chain and life cycle, namely
Obtaining the raw materials to make the product;
Getting the product and any by-products to end users and consumers;
Collecting process wastes and transporting them to the right end-treatments;
Getting rid of the product when it is no longer useful [
35].
Depending upon the amount of the transported load and the traveled distance, the environmental impacts of transports can be such that they negatively influence the environmental profile of the output product [
36].
Given this context, it is understood that disregarding transport issues entails ignoring environmental impacts, which, given their magnitude, can lead to significant uncertainties in the results. This clearly affects, in turn, the quality, reliability, and reproducibility of the assessment conducted. In addition to this, authors such as Ingrao et al. [
35] highlighted how transport can have a significant impact on the sustainability of a product’s life cycle.
Based on this, the first research problem was defined regarding the impact of glass cullet content at different delivery distance thresholds on the environmental profile of recycled glass bottles for packaging craft beer.
A review of the literature on LCA for transportation systems revealed that the focus has been on the environmental efficiency of various types of transport and the role of vehicle emissions throughout the system [
19,
37,
38]. For example, a German study on beer packaging [
39] showed that a good environmental profile of refillable glass bottles in local markets (within a 100 km radius) can be achieved only with at least 25 cycles of recirculation. In another study, Vivé [
40] documented that the environmental impact of 20 cycles of bottle recirculation over distances up to 250 km is lower than that of an equivalent system based on non-refillable glass bottles. Moreover, returnable goods generally have a smaller environmental impact than primary packaging when the delivery radius is around 100–150 km [
41,
42,
43,
44]. In the models analyzed in the literature, reusable packaging is typically returned to the original supplier or combined with other goods and sent to various customers for further use [
45,
46]. Based on this, a second research problem was defined, concerning the assessment of which categories of environmental impact evaluation are most sensitive to changes arising from different proportions of glass cullet and different distances for delivering the raw material to the processing plant, and to what extent the cumulative energy demand for glass bottle production depends on the ecological efficiency of glass cullet transport.
A review of the literature on life cycle assessments (LCAs) for transport systems indicates a concentration on the environmental performance of different transport modes, particularly focusing on vehicle emissions and their impact on the overall system. Notably, the review by Chang et al. [
37] discusses the comparative performance of various modes, while Saxe and Kasraian [
38] explore the role of emissions in transport systems, and Ingrao et al. [
35] focus on life cycle impacts, particularly in the context of emissions reductions.
Finally, analyzing what Saxe and Kasraian [
38] stated, namely that “LCA of transport infrastructure requires urgent reformulation because the transport sector has a dominant impact on many environmental challenges (e.g., air quality, greenhouse gas emissions) and due to the increasing use of LCA to support decision-making in planning, delivery, and construction of infrastructure”, and the above considerations, the last research problem was defined, concerning the determination of a critical point beyond which further transport becomes environmentally inefficient.
The study aims to provide the necessary information to develop a model for collecting glass cullet that includes the optimization of transporting this cullet from the collection point to the final processing location. Therefore, the current study boils down to four research questions:
RQ1: How does the variation in glass cullet content and transport distance affect the environmental footprint of non-refillable glass bottle production for craft-beer packaging?
RQ2: Which environmental impact categories are most sensitive to changes resulting from different proportions of recycled glass in bottle production and varying distances for supplying the raw material to the processing facility?
RQ3: To what extent does the cumulative energy demand for glass bottle production depend on the energy efficiency of transporting glass cullet?
RQ4: Where are the critical transport distance points beyond which further transport becomes environmentally inefficient?
The purpose of this study was to identify the sustainability implications of different cullet contents (0%, 57%, and 90%) under varied transportation distances, from 25 to 250 km. By exploring these variables, the authors intended to determine the optimal combination that minimizes environmental impact while maximizing the sustainability benefits of glass recycling in beer bottle manufacturing. By simulating these scenarios, the study aimed to provide insights into how stakeholders in the end-of-life stage of non-refillable bottles could adjust their supply chain strategies, such as optimizing transport logistics and maximizing cullet use, to enhance the sustainability of glass bottle production.
2. Materials and Methods
To answer the research questions posed, the study focused on conducting a ‘cradle-to-gate’ environmental assessment of non-refillable bottles made from glass scrap for craft-beer packaging using an environmental impact assessment tool in accordance with the ISO 14040-44 standard [
47] that guided the development of the study, applying attributional LCA in the following phases: goal and scope definition, life cycle inventory (LCI), life cycle impact assessment (LCIA), and life cycle interpretation. Each of those LCA elaboration steps was applied to the investigated system case (as shown in the following sections), demonstrating their essential role in aligning the study with its aim and function, and ensuring reliable and reproducible results [
19]. LCA methodology was applied to account for the environmental burdens associated with the use of virgin raw materials, energy consumption, process waste, and emissions in the production of non-refillable glass bottles with different cullet contents. Considering its potential influence in the system investigated, according to what was stated above in the introductory piece of this article, special attention was paid to the transports involved in the glass cullet acquisition and the related environmental impact.
Furthermore, a streamlined approach was applied, as it aligns with the aim and scope of the study. The first streamlined LCA was described in 1994 by the Society for Environmental Toxicology and Chemistry (SETAC) to enable a simplified or streamlined LCA to be carried out as a response to the cost and complexity issues presented earlier for full LCAs [
48]. A streamlined LCA, or sometimes referred to as a simplified LCA, can be castigated more from the point of view of value in organizational management processes. In some cases, in order to reduce the time, cost, and resources needed to perform a full LCA but maintain the same veracity of the full LCA results, a methodology based on a streamlined LCA is introduced [
49]. Streamlined LCA enables focusing on the main product- or process-related inventories and impacts, using qualitative and quantitative approaches for their assessment. For instance, streamlined LCAs can focus on specific phases of the product life cycle, such as the recycling phase, to identify opportunities for reducing carbon footprints and improving resource efficiency. Studies have shown that streamlined LCA approaches can effectively highlight the benefits of using recycled materials [
50]. In line with Niemistö et al. [
50], the streamlined LCA allowed for the cradle-to-gate assessment of cullet-derived non-refillable glass bottles for craft-beer packaging. To that end, some up- and down-stream parts of the bottles’ life cycle from the assessment were excluded. Streamlined LCAs heavily rely on secondary data and professional life cycle assessment tools to produce rapid but reliable results that are useful for drawing initial hotspots and testing different considerations. That can effectively support producers and other stakeholders in the process of identifying the most system-representative environmental impacts [
51].
To obtain answers to the research questions regarding the impact of transportation on the environmental effects of using secondary materials in the production of glass bottles, a theoretical model was developed that takes into account two variables: the amount of glass cullet and the different transportation distances of segregated cullet from the selective collection and separation point to the processing point—the glassworks. Following the above, we created a model using only secondary data for the assessment, extrapolating them from Ecoinvent’s ultimate version (v. 3.7) and processing them into environmental burdens in SimaPro v. 9.4. For varying levels of cullet content and travel distance and answering the research questions, three different scenarios were considered:
S01 (pessimistic scenario)—no cullet is utilized as 100% of the glass used for bottle manufacturing is virgin. This scenario enables a full assessment of the environmental and energy burdens associated with traditional glass manufacturing without any recycled content. The choice of this scenario is essential as it represents the worst-case scenario from a circular economy perspective, and it is even contrary to the principles of a circular economy and the European Union’s recycling regulations, highlighting the complete consumption of natural resources and the potential emissions associated with raw material extraction.
S02 (BAU, ‘business-as-usual’)—a baseline scenario approach where the share of secondary material (cullet) in bottle production was 57%, according to Ecoinvent v. 3.7 (based on the process: packaging glass production, white RER). This is an average value for current glass production practices within a European context. This scenario enables an analysis of the environmental impact of the “status quo” in bottle production. Thus, it highlights the differences in environmental impact between the current standard and other potential approaches, such as full reliance on virgin glass (S01) or a significantly higher recycling rate (S03).
S03 (optimal scenario)—in this scenario, bottles were assumed to be made out of recycled cullet for 90%, which is feasible according to the Polish National Chamber of Commerce (2020) and Best Available Techniques for glass production [
52]. Based on these literature data, 100% recycling is impossible due to technological limitations. This scenario serves as an example of how maximizing recycling could reduce environmental impact by lowering energy consumption and emissions of harmful compounds (e.g., CO
2) due to the lower melting temperature of recycled glass. Each scenario represents a distinct strategy for material management, allowing for an assessment of the potential environmental benefits of an increased recycling ratio. Stakeholders in the logistic glass chain most often cooperate within the framework of an industrial symbiosis (IS). As is known, the latter enables us to connect those who generate by-products and wastes to those who can actually use and transform them into value-added material and energy commodities [
53]. Thus, the assessment of scenarios S02 and S03 was expanded by considering a range of increasing transport distances for the utilized cullet, both within and beyond the boundaries of an IS-based system (
Table 1). For simplicity of calculations, in line with the streamlined LCA approach, it was assumed that those distances are the same to be traveled by a truck under no-load conditions, which means that the roundtrip equals the double of those distances.
To calculate the total roundtrip distance to be covered by a truck in order to deliver a given quantity of glass material to the glass factory, the PEFCR Guidance was used, which contains instructions on how to develop a PEFCR [
55]. They focused on the technical specifications contained and, in particular, the assumptions that can be made when having to model transport flows. The PEFCR Guidance provides instructions on how to develop Product Environmental Footprint Category Rules (PEFCRs). The PEFCRs were developed during the pilot phase of the environmental footprint for selected products. The PEFCR Guidance also provides indications on the default transport scenario to be used in cases where the data are not listed as mandatory company-specific information and supply chain-specific information is not available. Where PEFCR-specific data are not available, default scenarios and values should be used. Therefore, for this study, the approach described in the PEFCR Guidance for trucking was used. The transport payload is represented parametrically via the utilization ratio. The utilization ratio is determined by dividing the actual load in kilograms by the payload in kilograms and must be adjusted based on the dataset employed. It indicates that if the load in one way is 0 kg, an equivalent load of 1 kg shall be considered, thereby making calculations the closest possible to reality. The correction factor F as the utilization ratio was provided based on Formula (1).
In the case of the S02 and S03 variant, the 1.5% share of glass scrap generated in the bottle-making process was clearly neglected in the overall transport-flow accounting, according to Tua et al. [
56].
2.1. Goal and Scope Definition
This research was designed for the critical assessment of the environmental impact of craft-beer glass bottle production, considering three different scenarios of glass cullet content in combination with others, providing different distances for supply of the glass cullet to the processing plant (i.e., 25 to 250 km). Doing so made it possible to determine the extent to which the aforementioned distances can be increased without compromising the environmental soundness of circularity model applications in glass bottle manufacturing systems.
The functional unit (FU) of this study was set as 1 kg glass in bottle form as based on the system’s function of manufacturing non-refillable glass bottles for the packaging of craft beers.
Along with the FU, the system boundaries were defined, according to ISO [
47], in a way to include all the most relevant phases, consistent with the aim of this streamlined LCA.
When creating the system model for the study, it was considered that post-beer consumption bottles are separately disposed of as a cullet, and then transported to municipal collection centers. Following the sorting process to eliminate any potential extraneous material (e.g., metal caps and lids, plastic or rubber caps and corks), the glass factory receives the cullet and recycles it into value-added, ready-to-use glass powder. A closed loop-based production system then treats the latter as an intermediate product for the production of new glass bottles.
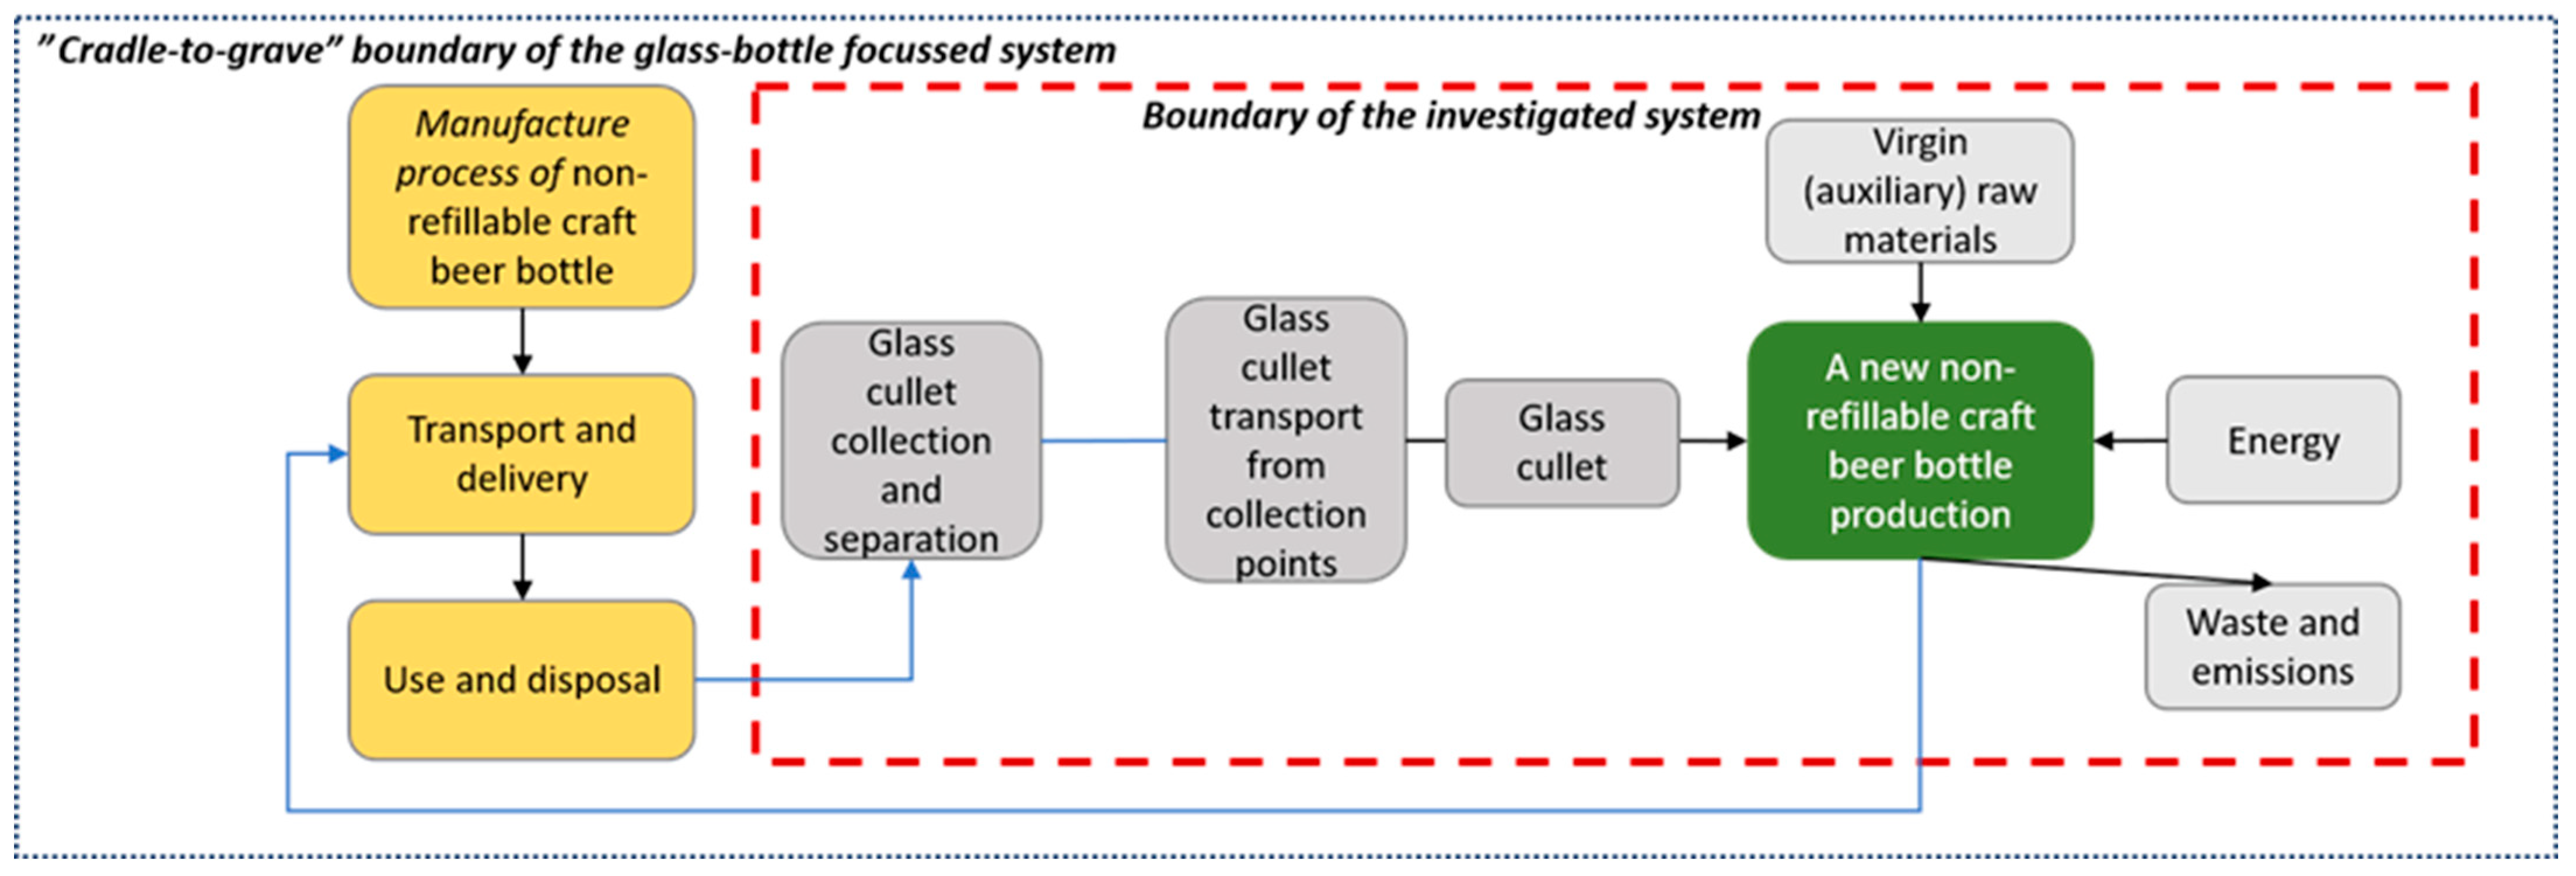
Figure 1 illustrates the system boundaries of two scenarios, S02 and S3, modeling glass cullet as a resource free from environmental burdens at the collection point, ready to be delivered to glass bottle manufacturing plants. Therefore, the primary glass production leading to the creation of glass cullet was excluded from the system boundaries. In light of this, in accordance with the goal and scope of this LCA and the characteristics of the applied simplified approach, the study focused on the transportation of separated glass cullet and the use of this material for the re-manufacturing of bottles. Within the system boundaries, the process of transporting cullet from central selective collection points, the input of primary raw materials (if necessary for production), and energy, as well as the output in the form of emissions to the environment and waste, were included. The stages of distributing produced bottles from recycling, filling them with beer (bottling stage), and the selective collection of non-refillable beer bottles in the form of glass cullet by citizens in communal containers, their transport to selective waste collection centers where they are sorted, and then being transferred to closed-loop recycling systems were excluded from the system’s boundaries.
The study was concerned with the environmental impact assessment of the transport stage of cullet from the collection and separation site to the glass factory. As follows, the collection and separation processes at selective waste collection centers were incorporated within the boundaries of the investigated system due to the environmental burdens attributed to the glass cullet input itself. This is consistent with what is included in the inventory data (
Table 2) because the process Glass bottle cullet, sorted {RER} features the environmental burdens associated with the collection and sorting of this material. Scenario S01 was only used as a comparison, where only virgin raw materials are used; therefore, in this case, cullet transport was not considered. Doing so allows for the avoidance of the overestimation of the environmental benefits associated with the use of a secondary raw material (i.e., glass cullet-derived powder) for the production of a new commodity (i.e., glass bottles). So, considering its comparative nature, the assessment conducted and presented in this article will reveal the most sustainable glass bottle option(s) in terms of the combination of glass cullet content and travel distance.
The system under investigation adhered to the ‘cut-off’ model, which assigns the primary user of the material the responsibility for primary material production. If the material undergoes recycling, the primary producer does not receive any credit for providing recyclable materials. As a result, the glass cullet only bears the impacts of recycling processes.
2.2. Life Cycle Inventory
According to Ingrao et al. [
35], the life cycle inventory (LCI), which compiles, qualifies, and quantifies both input and output data, is the primary phase in LCA applications.
This study conducted an inventory analysis that aligned with its primary focus, the manufacturing of glass cullet-derived bottles for craft-beer packaging, using secondary data, as presented in
Table 2. They regarded the amounts of material and energy flows throughout the system, as shown in
Figure 1, while the secondary ones were extrapolated from Ecoinvent v. 3.7 for European conditions and regarded the production models of those flows. Ecoinvent v. 3.7 is the database contained within SimaPro Analyst (version 9.4), namely the software that was used for the operational development of this case, LCA.
Table 2 presents inventory data for 3 variable scenarios depending on the amount of glass cullet used in bottle production. In the
Supplementary Materials,
Table S1 was included, containing the remaining inventory data independent of the amount of glass cullet used.
The BAU approach (corresponding to S02) classified 57% of the materials used for bottle production as secondary and another 43% as primary, such as sand, soda, limestone, feldspar, and other chemical compounds. This study looked at three different scenarios and used different amounts of input materials, as shown in
Table 2. Characterized unit data were used from the European context ({RER}) and datasets from the global scale ({GLO}) were used when that was not possible. Additionally, it took into account market-based modules, incorporating the acquisition’s transport into the dataset. For this streamlined LCA development, according to its goal and scope and the boundaries of the system investigated, background data were used for its modeling and assessment. For the S02 baseline scenario, the background data inventory presented in
Table 2 was directly based on Ecoinvent 3.7 data for non-refillable glass bottle production, where the level of recycled cullet was considered to be equal to 57%. In line with background inventory data for S02, adjustments were made for scenarios S01 and S03, considering different percentages of raw materials. Data estimation for scenarios S01 and S03 in terms of material and energy flows and emissions was made according to inventory data for S02 and the Best Available Techniques (BATs) for the manufacture of glass published by the Joint Research Centre [
52]. Considering the percentage of cullet content, the data were adjusted proportionally with respect to the remaining cullet quantity and the total volume of primary materials used for each scenario.
For the inventory data on the transport of cullet requirements, it was assumed that the vehicle travels fully loaded with glass waste from the sorting location to the processing location, which is the glass factory. According to the ACEA [
57], trucks are on average 13 years old in the European Union and are therefore of the EURO-5 type in terms of greenhouse gas (GHG) emissions. In light of this, for representativeness reasons, the Ecoinvent transport module “Transport, freight, lorry 16–32 metric ton, Euro5 {RER}| market for transport, freight, lorry 16-32 metric ton, EURO5 | APOS” was used for this LCA development. Therefore, the inventory input for Glass bottle cullet {RER} did not include transport and was not modeled as “market for” (
Table 2).
Equation (1) used the full-load tonne values from the aforementioned module to compute F, yielding two results, 1.063 and 1.031, for the 16 t and 32 t full-load hypotheses, respectively. All the distances examined in this study clearly shared the same factors, which were then averaged to derive a unique factor (1.047) for adjusting the flow for the one-way transportation of glass cullet requirements to the non-refillable glass bottle manufacturing plant. It was performed to take into account the key environmental impacts associated with the entire roundtrip involved in the glass cullet acquisition by the non-refillable glass bottle factory. So, the roundtrip transport flow, expressed as kg·km/FU, was calculated from the one-way transport of the glass cullet under full-load conditions through the application of the F-factor, according to Equation (2).
In the formula, TRT is the roundtrip transport flow [kg·km/FU]; F is the pre-calculated correction factor, and equal to 1.047; and r is the cullet content, and d is the distance to be traveled.
The obtained results of this are shown in
Table 3.
2.3. The Life Cycle Impact Assessment Methodology
The LCIA phase consists of four consecutive steps: classification, characterization, normalization, and weighing [
47]. However, this study only focused on the steps related to the midpoint approach, specifically characterization and normalization. In the characterization step, Huijbregts et al. [
58] use factors to reflect the relative contribution of substances to the environmental impact, quantifying the magnitude of inputs and outputs in each impact category. Normalization facilitates a comparative analysis and environmental decision making [
59]. In this phase, the environmental impact is expressed as a dimensionless value that is obtained by comparing the related characterization value with a certain reference. Normalization serves as a tool to calculate the magnitude of the category indicator results in relation to specific reference information [
47,
51]. The Product Environmental Footprint (PEF) now incorporates this integral part of LCA communication practices [
60,
61]. Particular results in impact categories can be compared to find specific hotspots in the system boundary. Furthermore, the normalization step enables the identification of impact categories that should be excluded from the assessment due to their minimal contribution to the overall environmental impact of the system under investigation. Furthermore, it enhances the ability to exclude specific impact categories from the study with the lowest burdens, thereby making the results more transparent.
CED is a methodology that quantifies both indirect and direct energy use in megajoules across the life cycle of a process or product, encompassing energy consumption during the disposal, production, and extraction of materials. To assess the life cycle energy of a product, three energy components are analyzed: embodied energy (which includes energy utilized during production and energy expended for maintenance and repair during operation), operational energy, and end-of-life energy [
62].
According to what Wiesen and Wirges [
63] proposed, the study combined the assessment of cumulative energy demand (CED) with a set of environmental impact indicators, using the EF 3.0 method, in accordance with the objective and scope of this study and the type of system being investigated. The European Commission adopted EF 3.0 as the impact assessment method during the environmental footprint transition phase [
64]. The method is promoted by the European Commission as a standard approach to assessing the environmental impact of products and organizations. This method aims to standardize environmental assessment in Europe by creating consistent frameworks for environmental reporting. Thanks to the application of EF 3.0, researchers can adjust their assessments to approaches preferred by EU policy, which increases their significance for stakeholders, decision makers, and compliance with EU regulations. In turn, the cumulative energy demand is a recognized indicator for assessing the total energy consumption over the life cycle of a product or service. Moreover, E.F 3.0 supports the proper use of characteristic factors for impact assessment [
65]. CED plays a key role in monitoring energy efficiency, which is significant in the context of EU policies aimed at reducing energy consumption and promoting energy efficiency. The CED method allows for drawing conclusions regarding the possibilities of improving efficiency, which is directly related to EU strategies on energy management. Moreover, CED is suitable for a life cycle energy analysis including the end-of-life (EoL) phase, especially recycling processes [
66]. Therefore, to promote the level of the harmonization of the conducted LCA with those available in the specialized literature and in the guidelines of the European Commission, as well as the comparability of the results obtained in the study, the above methods were used. Due to the research profile and research assumptions, the results were presented for selected categories of environmental impact. The indicators were selected based on a review of previously published studies on the impact of transportation and production [
64].
3. Results and Discussion
As a first step, in response to the first two research questions, the following were conducted:
An analysis of the environmental impact for the chosen impact categories was carried out based on the results at the characterization level for each scenario with a different amount of glass cullet used with respect to a baseline transport distance of 25 km;
A comparative analysis of two of the three considered scenarios (i.e., S02 and S03) as a function of the variable n = 25, 50, 100, 150, 200, and 250 km of glass cullet transport from the selective collection site to the recycling site.
It is extensively documented in the specialized literature that it is difficult to compare results in midpoint categories where every category has a different unit of measure equivalent [
51,
67]. This is why, to highlight the differences between all scenarios, a percentage contribution analysis according to Makara et al. [
68] was performed, assigning 100% to the highest value of the category indicator, and the assessment was complemented with the normalization step, following the globally regulated LCIA framework, to rank both the three investigated scenarios and the twelve midpoint categories considered using a dimensionless scale. The article only presents the environmental impact results for the impact categories that exhibited significant environmental burdens: climate change (CC), photochemical ozone formation (POCP), particulate matter (PM), human toxicity non-cancer (HT NC), acidification (AC), freshwater eutrophication (FE), marine eutrophication (FEM), terrestrial eutrophication (FET), freshwater ecotoxicity (EC), land use (LU), resource use fossils (RU Fs), and resource use minerals and metals (RU Ms). This article excluded results that collectively contributed less than 1.5% to the overall cumulative environmental impact for each scenario.
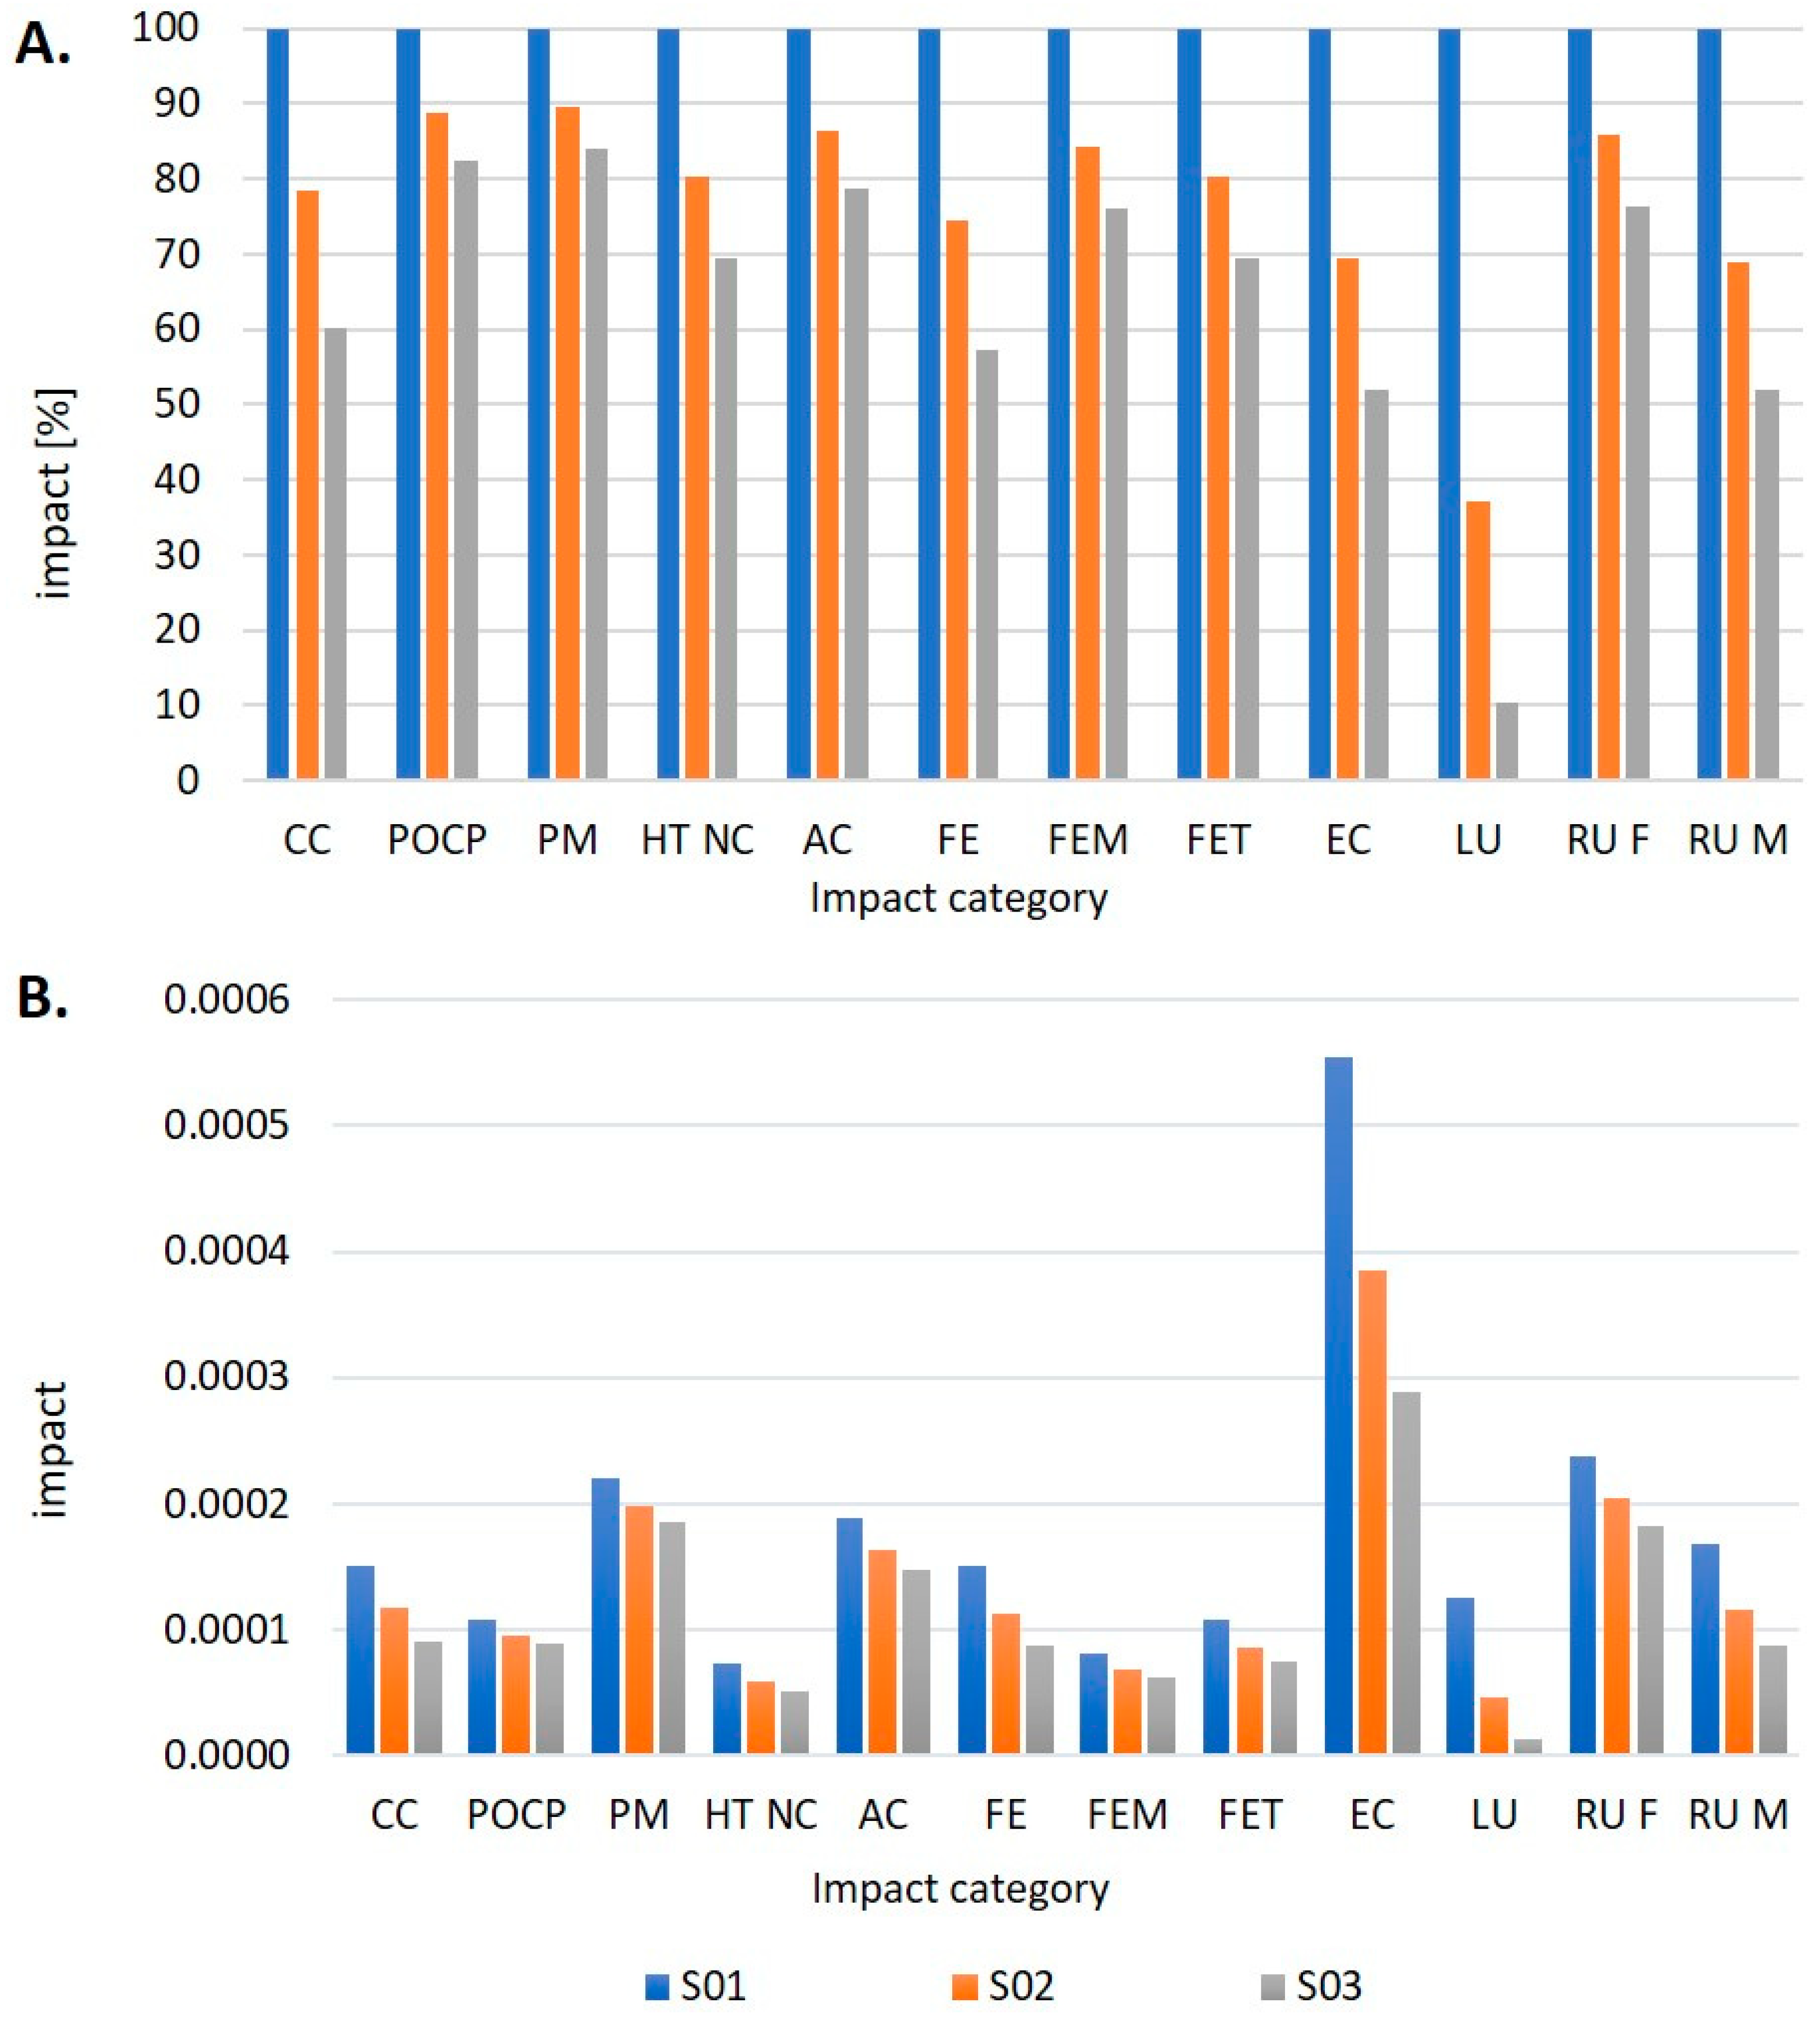
The environmental impact analysis concerning cullet content demonstrated that increasing the proportion of secondary material (cullet) in bottle production significantly reduces negative environmental impacts across all studied categories. For instance, in scenario S03, where bottles consist of 90% cullet, there are substantial reductions in greenhouse gas emissions (climate change impact category) and a lower consumption of fossil and mineral resources (resource use category). Results presented in
Figure 2 show, in fact, the differences (in %) in each impact category between the scenarios. Scenario S01 resulted in the greatest impacts in all categories, whereas scenario S03 revealed the lowest impacts, especially in the LU impact category (
Figure 2A).
The LU impact category showed the greatest difference between S01 and the other two scenarios: S02 was 37%, and S03 was only 10%. Thus, the use of secondary materials in glass bottle production significantly reduced the environmental impacts of occupying, reshaping, and managing land for human purposes.
Moreover, the following three categories, EC, RU F, and PM, had the greatest impact when comparing values at the normalization stage according to the analyzed scenarios (
Figure 2B). Those three categories play a crucial role in defining the environmental impact of glass production. Using a glass cullet improves the results, but it does so at the expected level. The normalized values of the environmental impact of S03, S02, and S01 in the EC category were 2.88 × 10
−3, 3.85 × 10
−3, and 5.55 × 10
−3 (
Figure 2B). The lowest normalized values were noticed for the HT NC category and were as follows: 5.05 × 10
−5, 5.83 × 10
−5, and 7.26 × 10
−5 for S03, S02, and S01. For this HT NC impact category, little change in results was observed between scenarios. On the other hand, the S03 scenario yielded the lowest results in the LU category. For this impact category, the results vary significantly depending on the scenario studied. The difference in impact values between S03 and S01 is 1.1 × 10
−4 (
Figure 2B). The lowest effect of the cullet usage rate on the results was noted for the PM and FET category.
Glass cullet, or recycled glass, is an essential feedstock in glass manufacturing, facilitating less energy usage and diminished greenhouse gas emissions during the melting phase. The utilization of cullet can reduce the overall carbon footprint linked to glass bottle production, as it necessitates less energy for melting than raw materials. The glass packaging sector within the European Union has documented significant CO2 emissions and energy usage, which might be alleviated by enhancing cullet utilization [
69,
70]. The results of the study are mostly in line with the findings of the literature in this area and indicate that augmenting the percentage of recycled glass in the manufacturing process can result in substantial decreases in energy usage, greenhouse gas emissions, and the resource depletion category [
71,
72]. Nonetheless, the advantages of utilizing glass cullet are accompanied by certain problems. The quality of cullet can fluctuate considerably, as post-consumer glass sometimes has a blend of colors and impurities, complicating its application in fresh bottle manufacturing [
73], which can be significant especially from the perspective of the production of bottles with a high content of cullet like in scenario S03.
However, in the case of the LU category, the results of the study show such large differences due to the manufacture of glass from raw materials, including silica sand, soda ash, and limestone, requiring extensive land utilization for mining activities, potentially resulting in habitat degradation and a decline in biodiversity [
74]. Conversely, employing recycled glass cullet diminishes the necessity for fresh raw material extraction, therefore preserving land and mitigating related environmental effects.
The next step of the study presents results on the impact of varying transport distances on the environmental footprint of non-refillable bottle production.
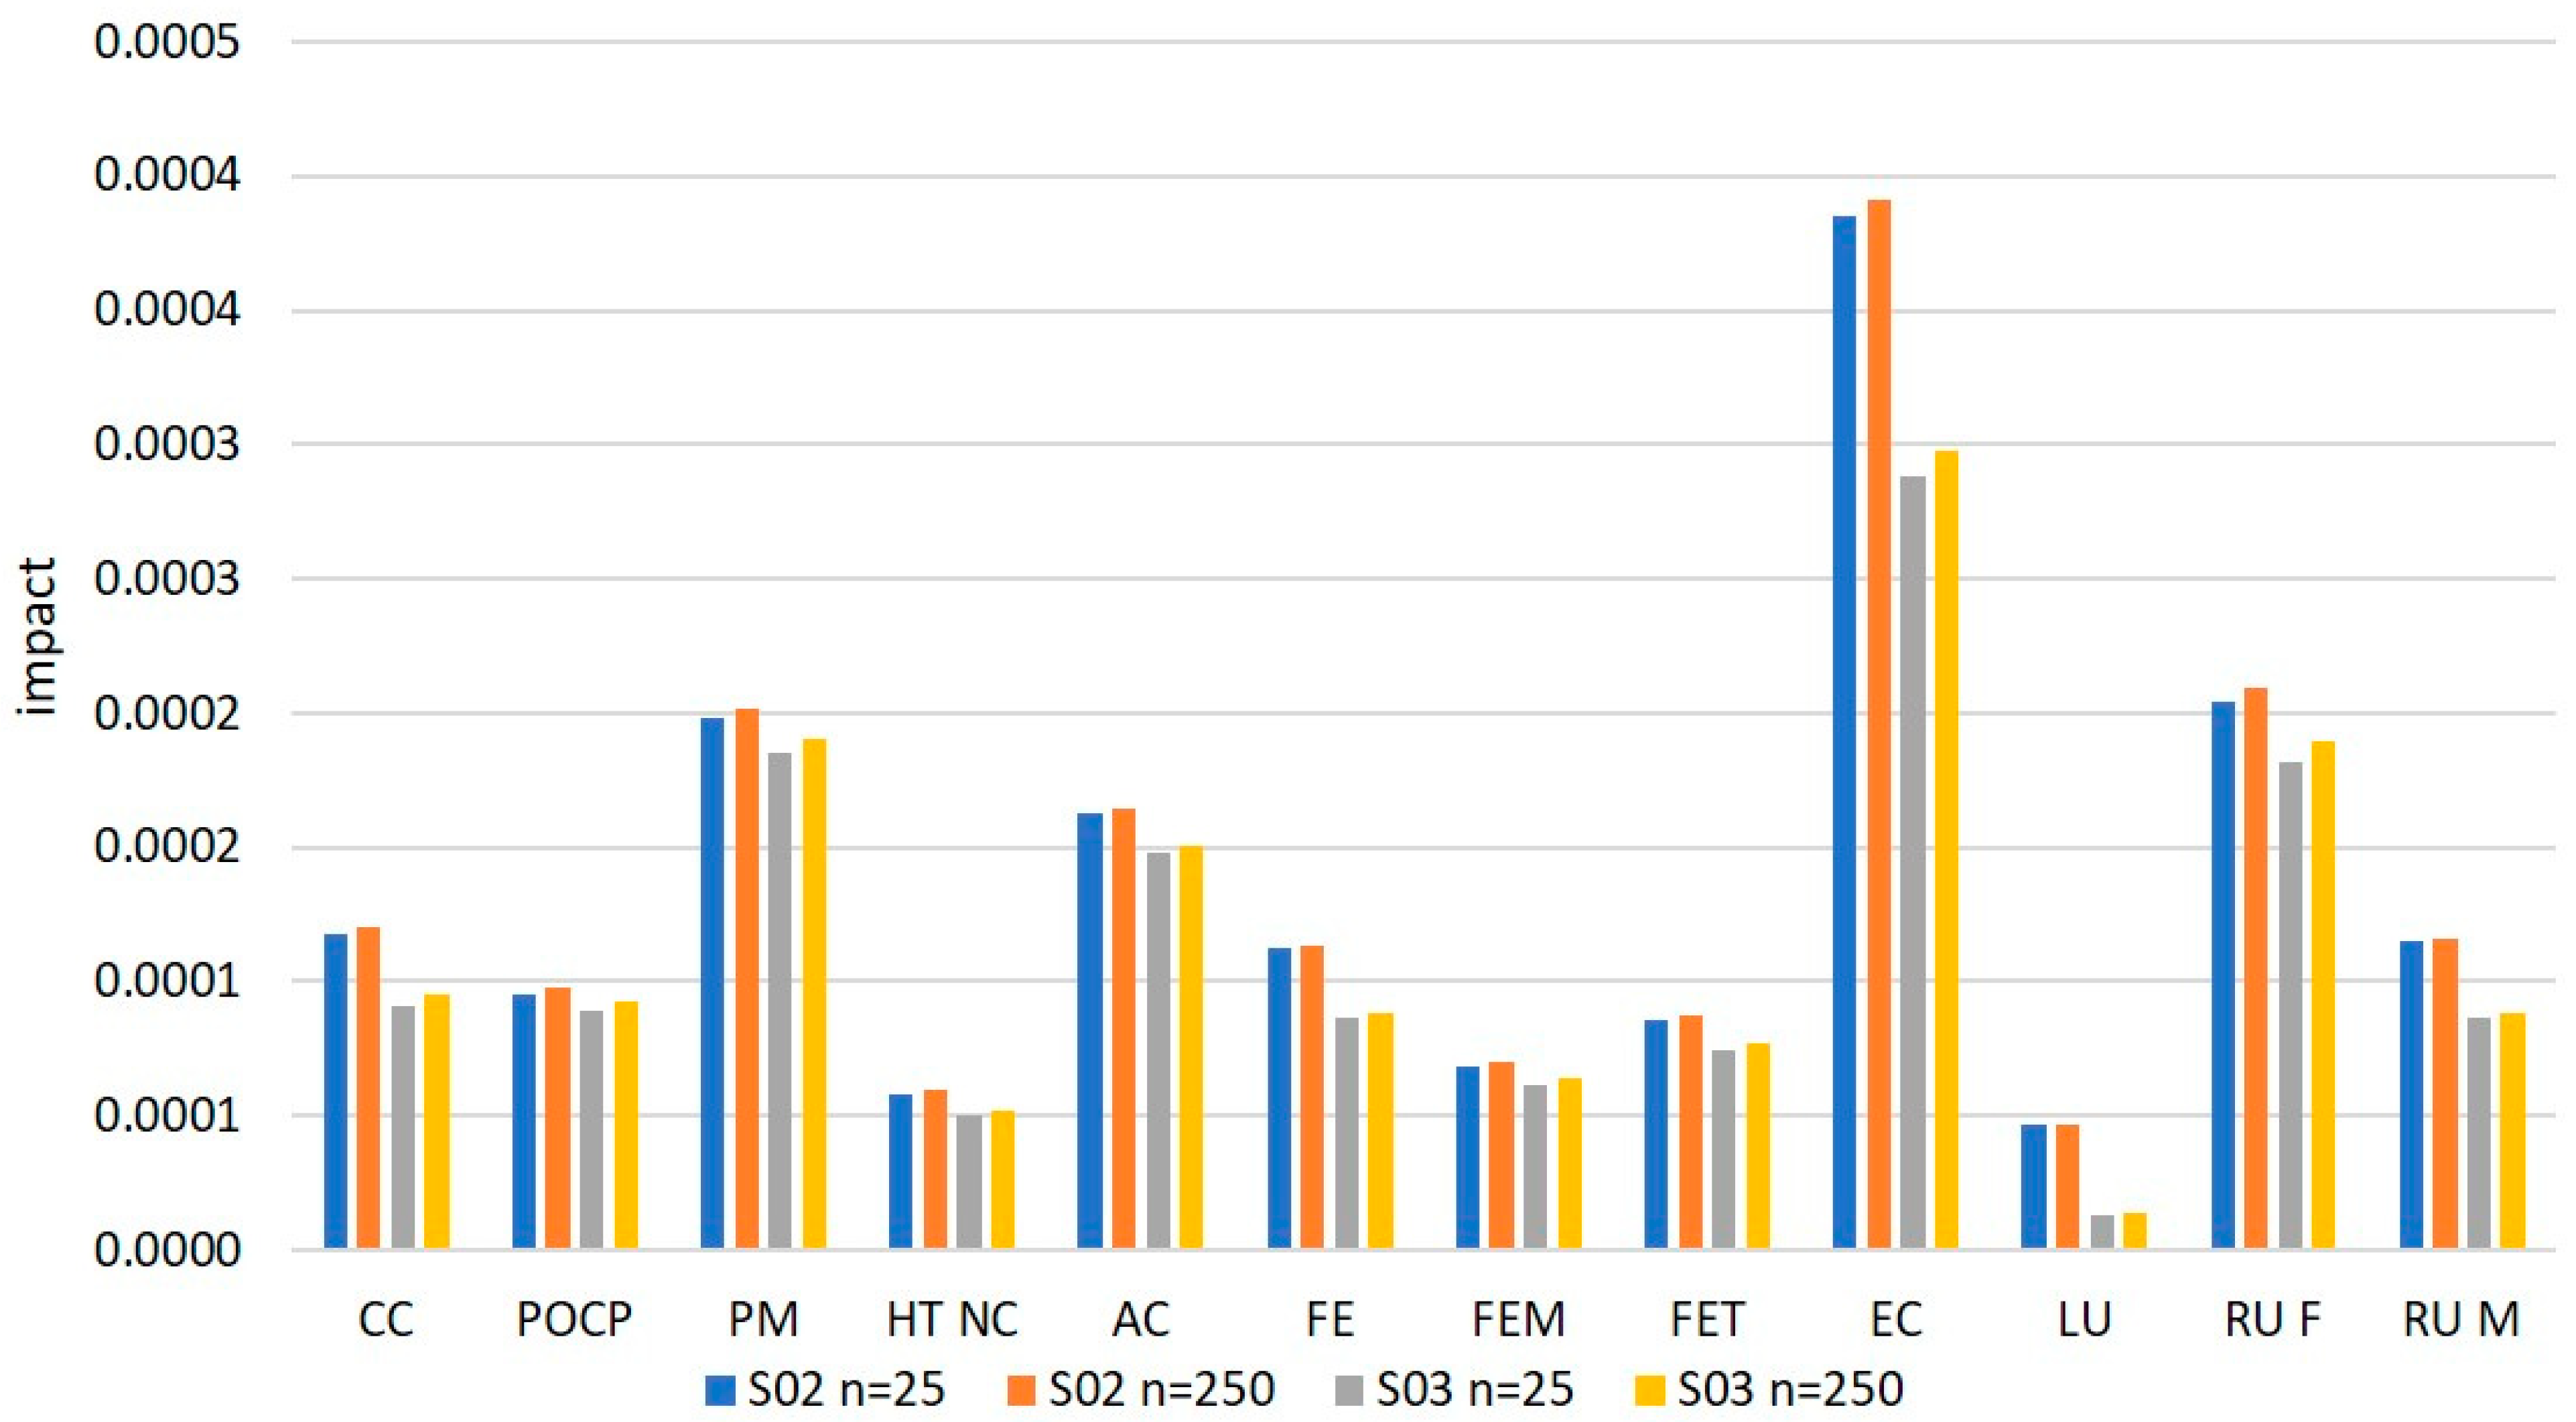
In the context of assessing the impact of transport on environmental sustainability, a comparative analysis of two of the three scenarios considered (i.e., S02 and S03) was carried out as a function of the variable
n = 25, 50, 100, 150, 200, and 250 km of cullet transport from the place of selective collection to the place of its reprocessing. The limit value of environmental loads, below which the transport of cullet would be environmentally inefficient, was determined for variant S01 at
n = 0.
Table 4 presents the normalization results for scenarios S02 and S03, considering transport distances of 25, 150, and 250 km.
For all transport distances considered (25–250 km), scenario S03 achieved the lowest impact values in key categories, particularly in areas such as freshwater eutrophication and land use. In comparison to scenario S01 (0% cullet), the differences ranged from 30% to 55%, depending on the impact category. In the case of scenario S02 (57% cullet), environmental impact was positioned between S01 and S03, indicating that a higher level of cullet content significantly improves environmental efficiency, though the benefits diminish as the cullet proportion approaches 100%.
Even with
n = 250, the remaining scenarios failed to reach this value for each of the impact categories tested at the normalization stage (
Table 4). For example, the value of CC for S03 and S02 for 250 km was lower than for S01 and was as follows: 1.204 × 10
−4, 2.482 × 10
−6, and 1.500 × 10
−4. The same relationship was observed in other impact categories. It means that the local transport of glass cullet within the scope of industrial symbiosis has a very low environmental impact. There is also a minor variation in performance scores in a given impact category for a particular scenario with the variable
n = 25, 50, 100, 150, 200, and 250 km. Scenario S03, using 90% recycling content, results in lower values in each impact category at every transport distance compared to scenario S02 (57% glass cullet content).
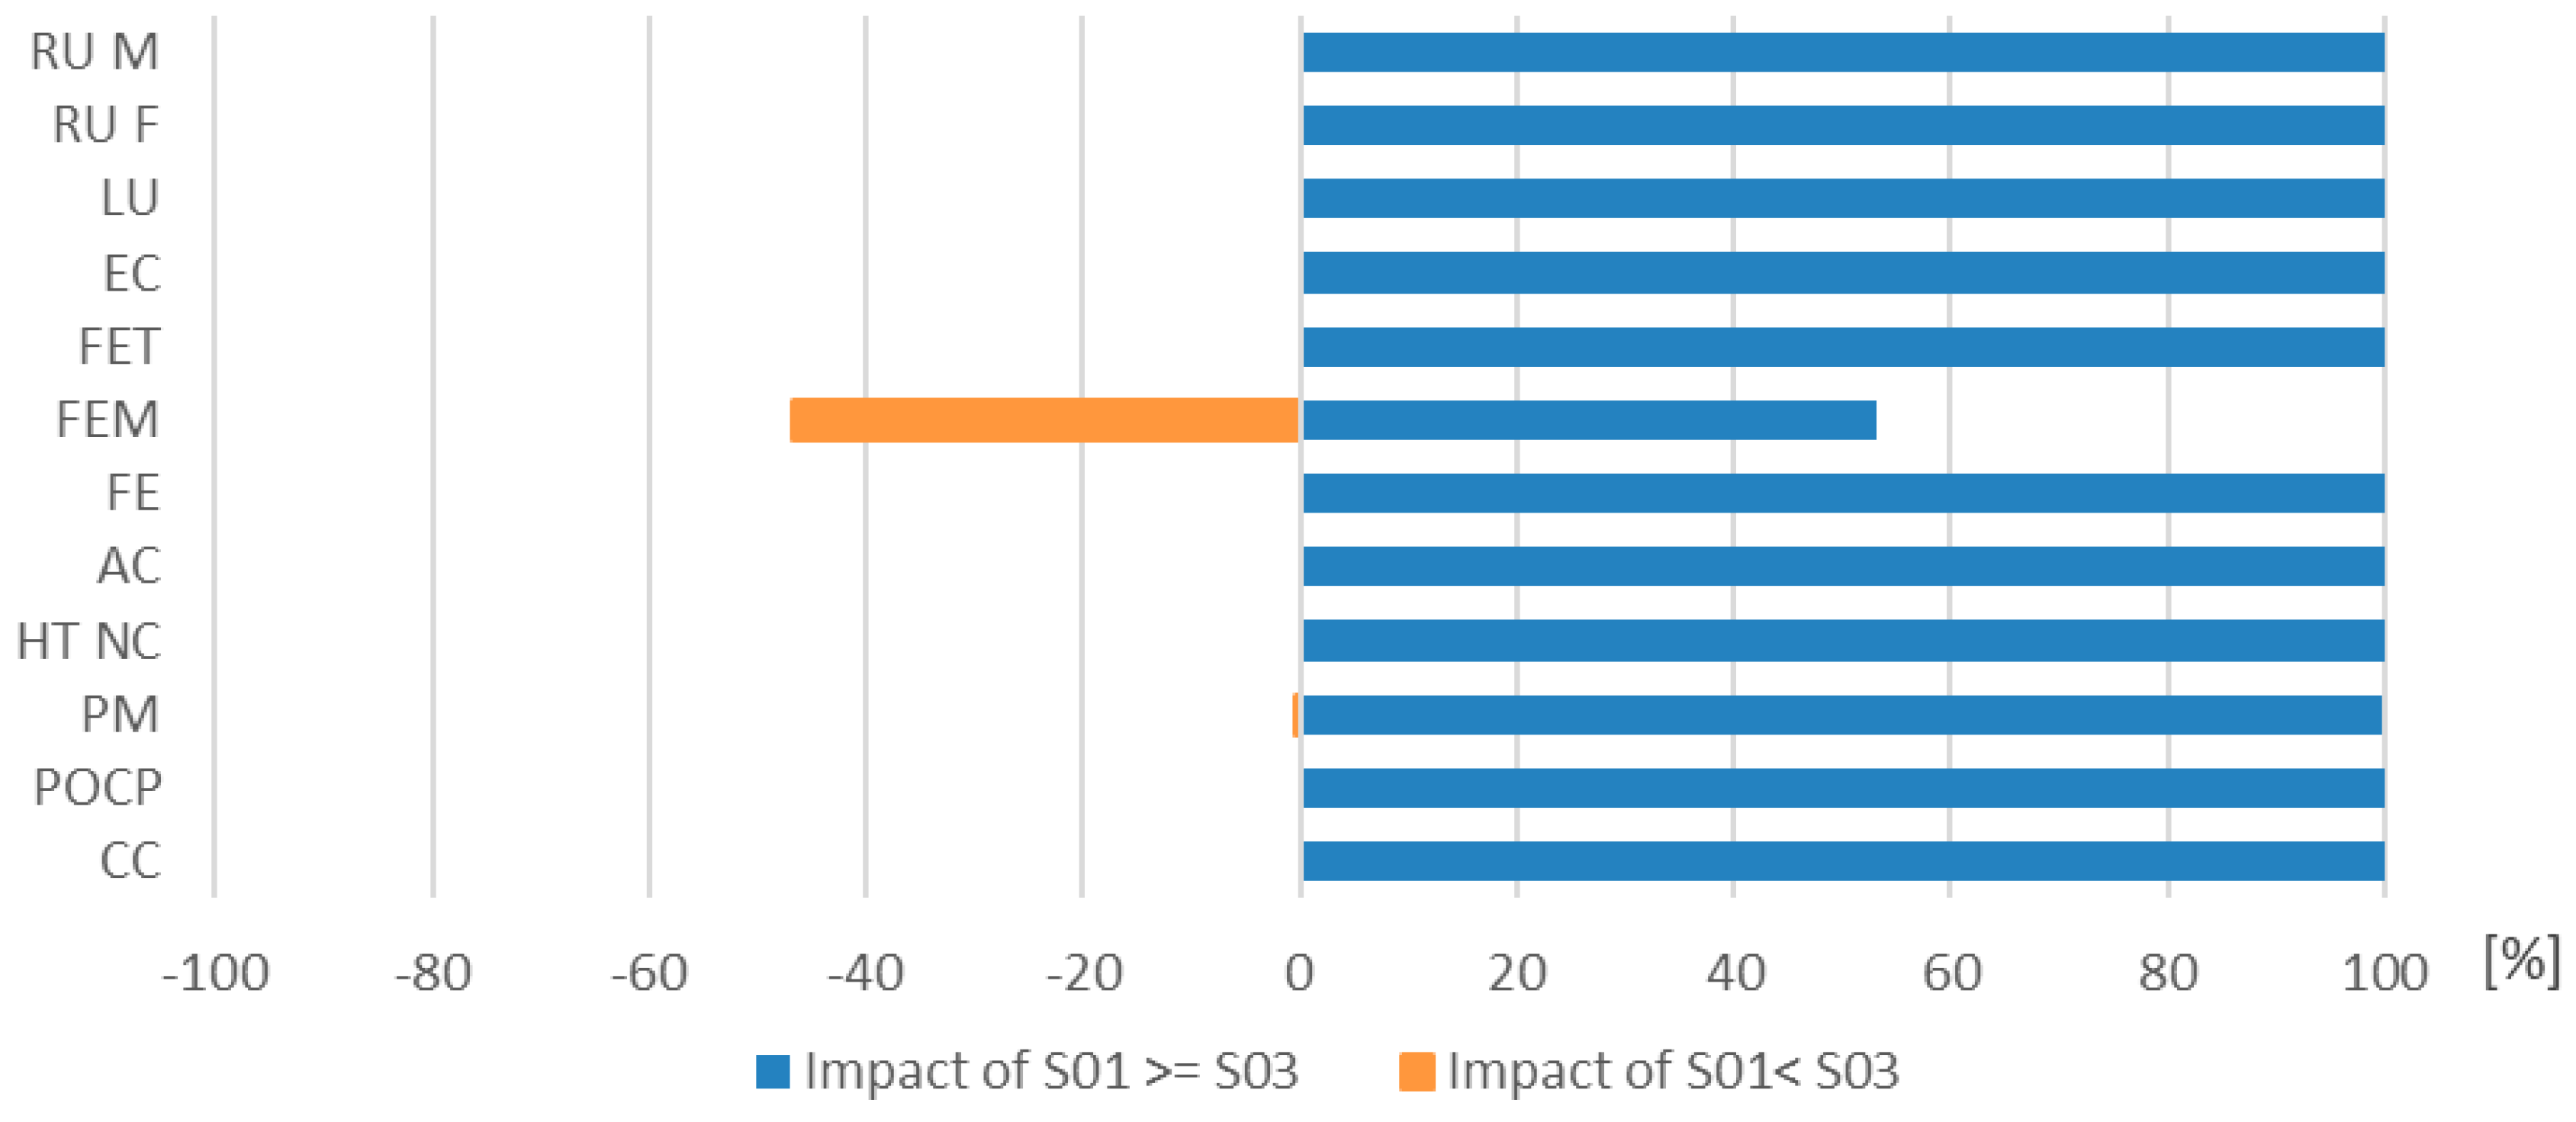
The normalization step was then limited just to the minimum and maximum distance values, namely 0 and 250, which the three scenarios were complemented with. The results are shown in
Figure 3. They revealed that, in terms of quality, the structures of the impacts upon the environment were still dominated by the EC impact category, regardless of the scenario and transport distance. The next contributors to environmental impact were the RU F and PM categories. Despite the increase in environmental burden with greater distances, scenario S03 remains the most environmentally advantageous, even at the maximum transport distance (250 km).
In the case of two variables, namely the glass cullet content level in the input material and the distance over which the cullet is transported from the collection and sorting site, the determining factor is the first variable; however, increased transport distances led to a gradual rise in total environmental burden for each scenario. For example, in scenario S02, with a transport distance of 250 km, greenhouse gas emissions increased by approximately 5% compared to a 25 km distance, mainly due to the additional emissions from road transportation. The difference between the impacts of S03 and S02 for the same transport distance n = 250 km (2.8 × 10⁻⁴) is greater than between two transport distances for the same scenario as it is as follows: 2.8 × 10⁻⁵ for S02 and 4.4 × 10⁻⁵ for S03.
The results of the research carried out within the framework of this article show that, as the percentage of bulk secondary material in the production of disposable glass bottles decreases, the importance of the transport distance from the collection point to the glassworks rises. Thus, on the one hand, an increase in the percentage of cullet use in glass production contributes to a reduction in negative environmental impacts and an increase in sustainability. Cullet transport, on the other hand, contributes to an increase in environmental burdens, primarily climate change and natural resource depletion.
The study’s findings reveal that, compared to the benefits of using cullet, transport has lower impact on maintaining environmental sustainability. It is still more environmentally beneficial to increase, as much as possible, the glass cullet percentage in the material mix for glass production, even at the cost of increasing transport.
In the next stage, studies were conducted on the energy efficiency of transporting glass cullet as part of the system related to the production of glass bottles using recycled glass. In this case, the cumulative energy demand (CED) analysis was applied, which is also relevant in glass production, which is a highly energy-intensive process. This study assesses whether the use of secondary materials reduces energy consumption. Despite different absolute values at the characterization stage for the results of environmental burdens of glass bottle production obtained in the CED category, the percentage differences resulting from the change in the amount of secondary material used were comparable. A 57% substitution of primary materials with cullet reduced environmental impacts in this category by 15.4%, while a complete substitution of primary materials by the secondary material led to a reduction in impacts only by a further 11.8%. Hence, replacing virgin materials in the production process with glass cullet at a ratio of 90% reduces the energy demand by 27.2%. Results from the CED assessment revealed that non-renewable fossil fuels are still the prevailing energy source for glass bottle production: they accounted, in fact, for 78%, 80%, and 81% of the total energy demand for the S01, S02, and S03 scenarios, respectively. Recycling glass conserves energy and substantially mitigates the environmental impacts linked to the manufacturing of new glass. Studies show that recycling glass consumes around 40% less energy than manufacturing new glass from raw materials [
75]. The energy savings linked to glass recycling are underscored by the conservation of 1.2 kg of raw materials for every 1 kg of recycled glass [
76]. The results of the study correspond to the findings of Zegardło and Drużba, who claim that the logistics of collecting, sorting, and transporting glass waste contributes significantly to the cumulative energy demand [
77].
The final step of the analysis as a response for the fourth research question was to consider the critical point at which the transport distance of glass cullet in scenarios S03 and S02 would be no longer eco-efficient when compared with the environmental impact of the S0 scenario. Recycling of glass cullet reduced the environmental impact of raw material extraction and road transport but simultaneously caused environmental burdens related to cullet glass delivery to the glassworks.
The results extrapolated for the studied scenarios considered two variables: the distance from the cullet collection point to the glass factory and the percentage of cullet in the product. The extrapolation of values based on normalization results for impact categories in the function of transport distance was considered to assess how the expansion of the transport distance from the separate collection site to the glassworks affects the environmental impact using only the road truck Euro5 transport. In the S01 scenario with no cullet utilized in glass production, the impact is constant and does not change with transport distance; environmental impact (transport distance) = constant. In the S02 and S03 scenarios, a linearly increasing trend was observed as a function of distance. In contrast, the angle of the linear function varies in both scenarios and depends on the level of cullet utilization in the production process. On this basis, three different critical points (CPs) were defined, located at the intersection of the linear functions of the scenarios under study:
CP S03/S02 with n = 5100 km, where the environmental impact of scenario S03 was greater than the impact of S02, i.e., where it was no longer eco-efficient to use 90% of recycled material and transport generated the greatest burdens;
CP S03/S01 with n = 4200 km, where the environmental impact of scenario S03 was greater than the impact of S01, and it was no longer eco-efficient;
CP S02/S01 with n = 4500 km, where the environmental impact of scenario S02 was greater than the impact of S01, and it was no longer eco-efficient.
The distance where the transport cullet is environmentally more beneficial than the use of raw materials reduces twofold when the CED is considered. According to energy demand presented in the CED category [MJ], critical points for energy demand (CPe), where it was no longer eco-efficient to use 90% of recycled material and transport generated the greatest burdens, occurred at lower values of n; for CPe S03/S02, it was n = 2250 km; for CPe S03/S01, n = 2100 km; and for CP S02/S01, n = 1975 km. It also meant that the value of CED was more dependent on transport distance than the results of the environmental impact at the normalization stage, using the EF 3.0 method. Based on cumulative energy demand, it was estimated that a cullet-supply distance of more than 2000 km renders the use of cullet in glass production environmentally unviable.
According to those results, there is a possibility of improving environmental sustainability through economic symbiosis between the various players in the supply chain. Such measures could include optimizing transport routes, improving cullet sorting and purification techniques, and increasing energy efficiency in the production process. Collaboration among supply chain actors can achieve environmental sustainability through this approach, paving the way for a sustainable future for the glass bottle industry.
5. Conclusions
To comprehensively address the research questions, this study analyzed the interplay between cullet content and transport distances, focusing on their combined impact on the environmental sustainability of non-refillable glass bottle production for craft-beer packaging. The findings provide actionable insights and critical thresholds that guide both theoretical understanding and practical applications.
RQ1: How does the variation in glass cullet content and transport distance affect the environmental footprint of non-refillable glass bottle production for craft-beer packaging?
The study demonstrates that increasing the proportion of cullet in glass production significantly reduces environmental impacts across multiple categories, including climate change, resource use, and land use. Scenario S03 (90% cullet) consistently had the lowest environmental footprint, even for transport distances up to 250 km. However, as transport distance increases, the environmental burden rises for all scenarios, particularly due to emissions from road transportation. The use of cullet remains more beneficial environmentally than raw materials, provided transport distances are kept within certain thresholds.
RQ2: Which environmental impact categories are most sensitive to changes resulting from different proportions of recycled glass in bottle production and varying distances for supplying the raw material to the processing facility?
The analysis identifies climate change (CC), resource use fossils (RU Fs), and particulate matter (PM) as the most sensitive categories to changes in cullet content and transport distance. In particular, the CC category shows significant reductions in greenhouse gas emissions with higher cullet proportions, while RU F and PM reflect decreased fossil fuel consumption and pollution. Categories such as land use (LU) and freshwater eutrophication (FE) also show substantial sensitivity, as higher cullet content mitigates raw material extraction impacts.
RQ3: To what extent does the cumulative energy demand for glass bottle production depend on the energy efficiency of transporting glass cullet?
The cumulative energy demand (CED) for glass bottle production is directly influenced by both the amount of cullet used and the transport distance. Replacing virgin materials with cullet reduces energy demand by up to 27.2% at 90% cullet utilization. However, transport-related energy consumption becomes significant for distances exceeding 2000 km, making cullet usage environmentally unviable beyond this point. This highlights the critical role of transport energy efficiency in achieving sustainable glass production.
RQ4: Where are the critical transport distance points beyond which further transport becomes environmentally inefficient?
The study defines critical points for transport distances where using cullet becomes environmentally inefficient. For environmental impacts, the thresholds are 4200 km for scenario S03 (90% cullet) and 4500 km for scenario S02 (57% cullet). When considering cumulative energy demand, these distances drop significantly to approximately 2100 km for S03 and 1975 km for S02. Beyond these distances, the environmental and energy costs of transport outweigh the benefits of cullet utilization.
The research focused on assessing the environmental sustainability of non-refillable glass bottle production, considering varying levels of cullet utilization in closed-loop recycling and different transportation distances for cullet collection. Critical environmental impact points were identified, suggesting the inefficiency of longer transport distances and advocating for short supply chains and IS-based systems, in line with the previously published literature. From this point of view, transitioning to IS-based models offers numerous environmental benefits, including GHG emission reductions, waste diversion from landfills, increased resource productivity, pollution reduction, and lower industrial water consumption. Despite energy-intensive processes, industries like container glass production can achieve significant environmental improvements when appropriately designed.
While the study is limited to the Polish context, it can be adapted for other regions by adjusting the variables considered. Future research should explore alternative energy sources for processing electricity to assess their impact on results. This study contributes to the transition to a circular economy by assisting in the optimal selection of glass waste management solutions, which is critical for achieving recycling targets. This study informs the design of municipal waste collection systems and supports the development of recycling strategies that align with sustainable development goals.
The findings of this study hold important implications for researchers, decision makers, and practitioners in the glass packaging and recycling sectors.
From a theoretical perspective, this research advances the understanding of the interplay between cullet content and transport distances in sustainable glass production. It highlights the critical thresholds at which transport distances negate environmental benefits, emphasizing the importance of localized recycling systems. This study offers a novel integration of transport logistics and material composition into life cycle assessment (LCA) frameworks, providing a deeper insight into the environmental trade-offs of glass recycling systems. These contributions lay the groundwork for further studies exploring similar dynamics in other industries.
For policymakers, the study underscores the need to promote regulations and incentives that encourage higher cullet utilization in glass production. Policies could focus on subsidizing local collection and processing facilities to reduce transport distances, thereby minimizing environmental impacts. Mandatory guidelines for optimizing logistics and increasing secondary material usage in glass manufacturing could be introduced to ensure sustainable practices across the industry.
Practitioners, including manufacturers and craft-beer producers, can apply these findings by re-evaluating their supply chain strategies. They should prioritize sourcing recycled glass from local suppliers and consider investments in optimizing transport logistics, such as improved route planning and load management. Practitioners can adopt the study’s modeling approach to assess and refine their own environmental impacts, paving the way for more sustainable production systems. Integrating cullet sourcing within a 150 km radius could drastically reduce greenhouse gas emissions and other environmental impacts. Engineers, designers, and policymakers can utilize this study to grasp CE concepts and drive necessary social changes for achieving recycling targets. LCA offers opportunities for environmental impact improvement, particularly in optimizing waste management. Embracing the CE direction requires incorporating society’s expectations into production processes.
Finally, this study proved once again that LCA is a valid tool for supporting the design of circular-based products and the transition to sustainable circular economic models. However, we should not enforce circularity when it contradicts the results of LCA.


