Article

Gravity and Magnetic Separation for Concentrating Critical Raw Materials from Granite Quarry Waste: A Case Study from Buddusò (Sardinia, Italy)

by
Antonello Aquilano
1,*,
Elena Marrocchino
2,* and
Carmela Vaccaro
2
1
Department of Architecture, University of Ferrara, 44121 Ferrara, Italy
2
Department of Environmental and Prevention Sciences, University of Ferrara, 44121 Ferrara, Italy
*
Authors to whom correspondence should be addressed.
Resources 2025, 14(2), 24; https://doi.org/10.3390/resources14020024
Submission received: 19 December 2024 / Revised: 21 January 2025 / Accepted: 22 January 2025 / Published: 29 January 2025

Abstract

:
The Critical Raw Materials Act (CRMA), enacted by the European Union (EU) in May 2024, represents a strategic framework that aims to address the growing demand for critical raw materials (CRMs) and reduce dependency on non-EU sources. The present study explores the potential of CRMs recovery from granite extractive waste (EW) at a granite quarry in Buddusò (Sardinia, Italy). A significant quantity of granite EW, stored in piles within designated disposal areas at the quarry under study, is estimated in terms of mass and volume using GISs and digital elevation models (DEMs). Analysis performed using a scanning electron microscope attached to an energy-dispersive spectrometer (SEM-EDS) reveals the presence of allanite, a rare-earth-bearing mineral with substantial light rare-earth elements (LREEs), which can potentially be exploited for LREEs recovery. A combined working process including gravity and magnetic separations yields CRMs-enriched fractions with concentrations of REEs, Sc, and Ga, reaching levels of potential economic interest for different industrial applications. Despite promising concentrations, limited knowledge of allanite processing represents significant challenges for CRMs recovery from this waste. Therefore, the present study was conducted to assess the efficiency of these gravity and magnetic separation methods in order to concentrate CRMs from granite EW. Economic evaluations, including potential market value estimates, suggest that CRMs recovery from granite EW can be very profitable under optimized processing conditions. Expanding studies to other quarries in the region can provide valuable insights into the feasibility of establishing a recycling hub, offering a sustainable supply chain solution for CRMs within the EU’s strategic framework.

1. Introduction

In 2008, with the “Raw Materials Initiative”, the European Union (EU) began addressing the future challenges of sustainable raw materials (RMs) supply [1]. Through this initiative, the EU aims to implement a strategy to ensure access to RMs from international markets under the same conditions as other industrial competitors, set the right framework conditions within the EU to foster a sustainable supply of RMs from EU sources, boost overall resource efficiency, and promote recycling to reduce the EU’s consumption of primary RMs and decrease the relative dependence on imports. Following this initiative, the EU introduced the concept of Critical Raw Materials (CRMs), a list of RMs at high risk of supply shortages with significant economic impact compared with most other RMs [1]. Since 2011, the EU has published the CRMs list every three years, updated based on changes in supply risks and the economic importance of candidate RMs [2,3,4,5,6]. Starting from May 2024, the Critical Raw Materials Act (CRMA) came into force within the European Union, with specific objectives and strategies aimed at reducing the EU’s dependency on CRMs and promoting sustainable and uniform competitive conditions for CRMs value chains within the EU [7]. The CRMA has also established benchmarks for the CRMs supply chain and for diversifying the EU’s supplies, with at least 10% of the EU’s annual consumption for extraction, at least 40% of the EU’s annual consumption for processing, at least 25% of the EU’s annual consumption for recycling, and no more than 65% of the EU’s annual consumption from a single third country [7]. In terms of recycling, Article 27 of the CRMA is dedicated to the recovery of CRMs from EW, requiring member states to adopt measures by November 2027 to promote CRMs recovery from EW [7]. In this context, various authors worldwide are investigating, for example, the potential of using mining tailings as an alternative source for CRMs supply (e.g., [8,9,10,11,12,13]). In Italy, due to its long history of mining, mining tailing storage sites are widespread [14], and some authors have begun investigating the extraction potential of this waste [15,16,17,18,19].
In recent years, in addition to mining tailings, some researchers in Italy have also begun to focus on EW derived from the extraction of silicate-rich rocks for ornamental purposes to investigate their extraction potential in terms of CRMs [20,21,22]. Ornamental rocks such as gneiss and granite can host significant amounts of rare-earth element (REE)-bearing minerals (e.g., monazite and allanite), making them potential resources for the recovery and extraction of REEs. [20,21]. In this context, the region of Sardinia (Italy) has large quantities of ornamental granite extractive waste (EW), having formerly been one of the world leaders in granite extraction [23]. Therefore, investigating the extraction potential of these materials could make an important contribution to the objectives set by the CRMA regarding CRMs recovery from EW.
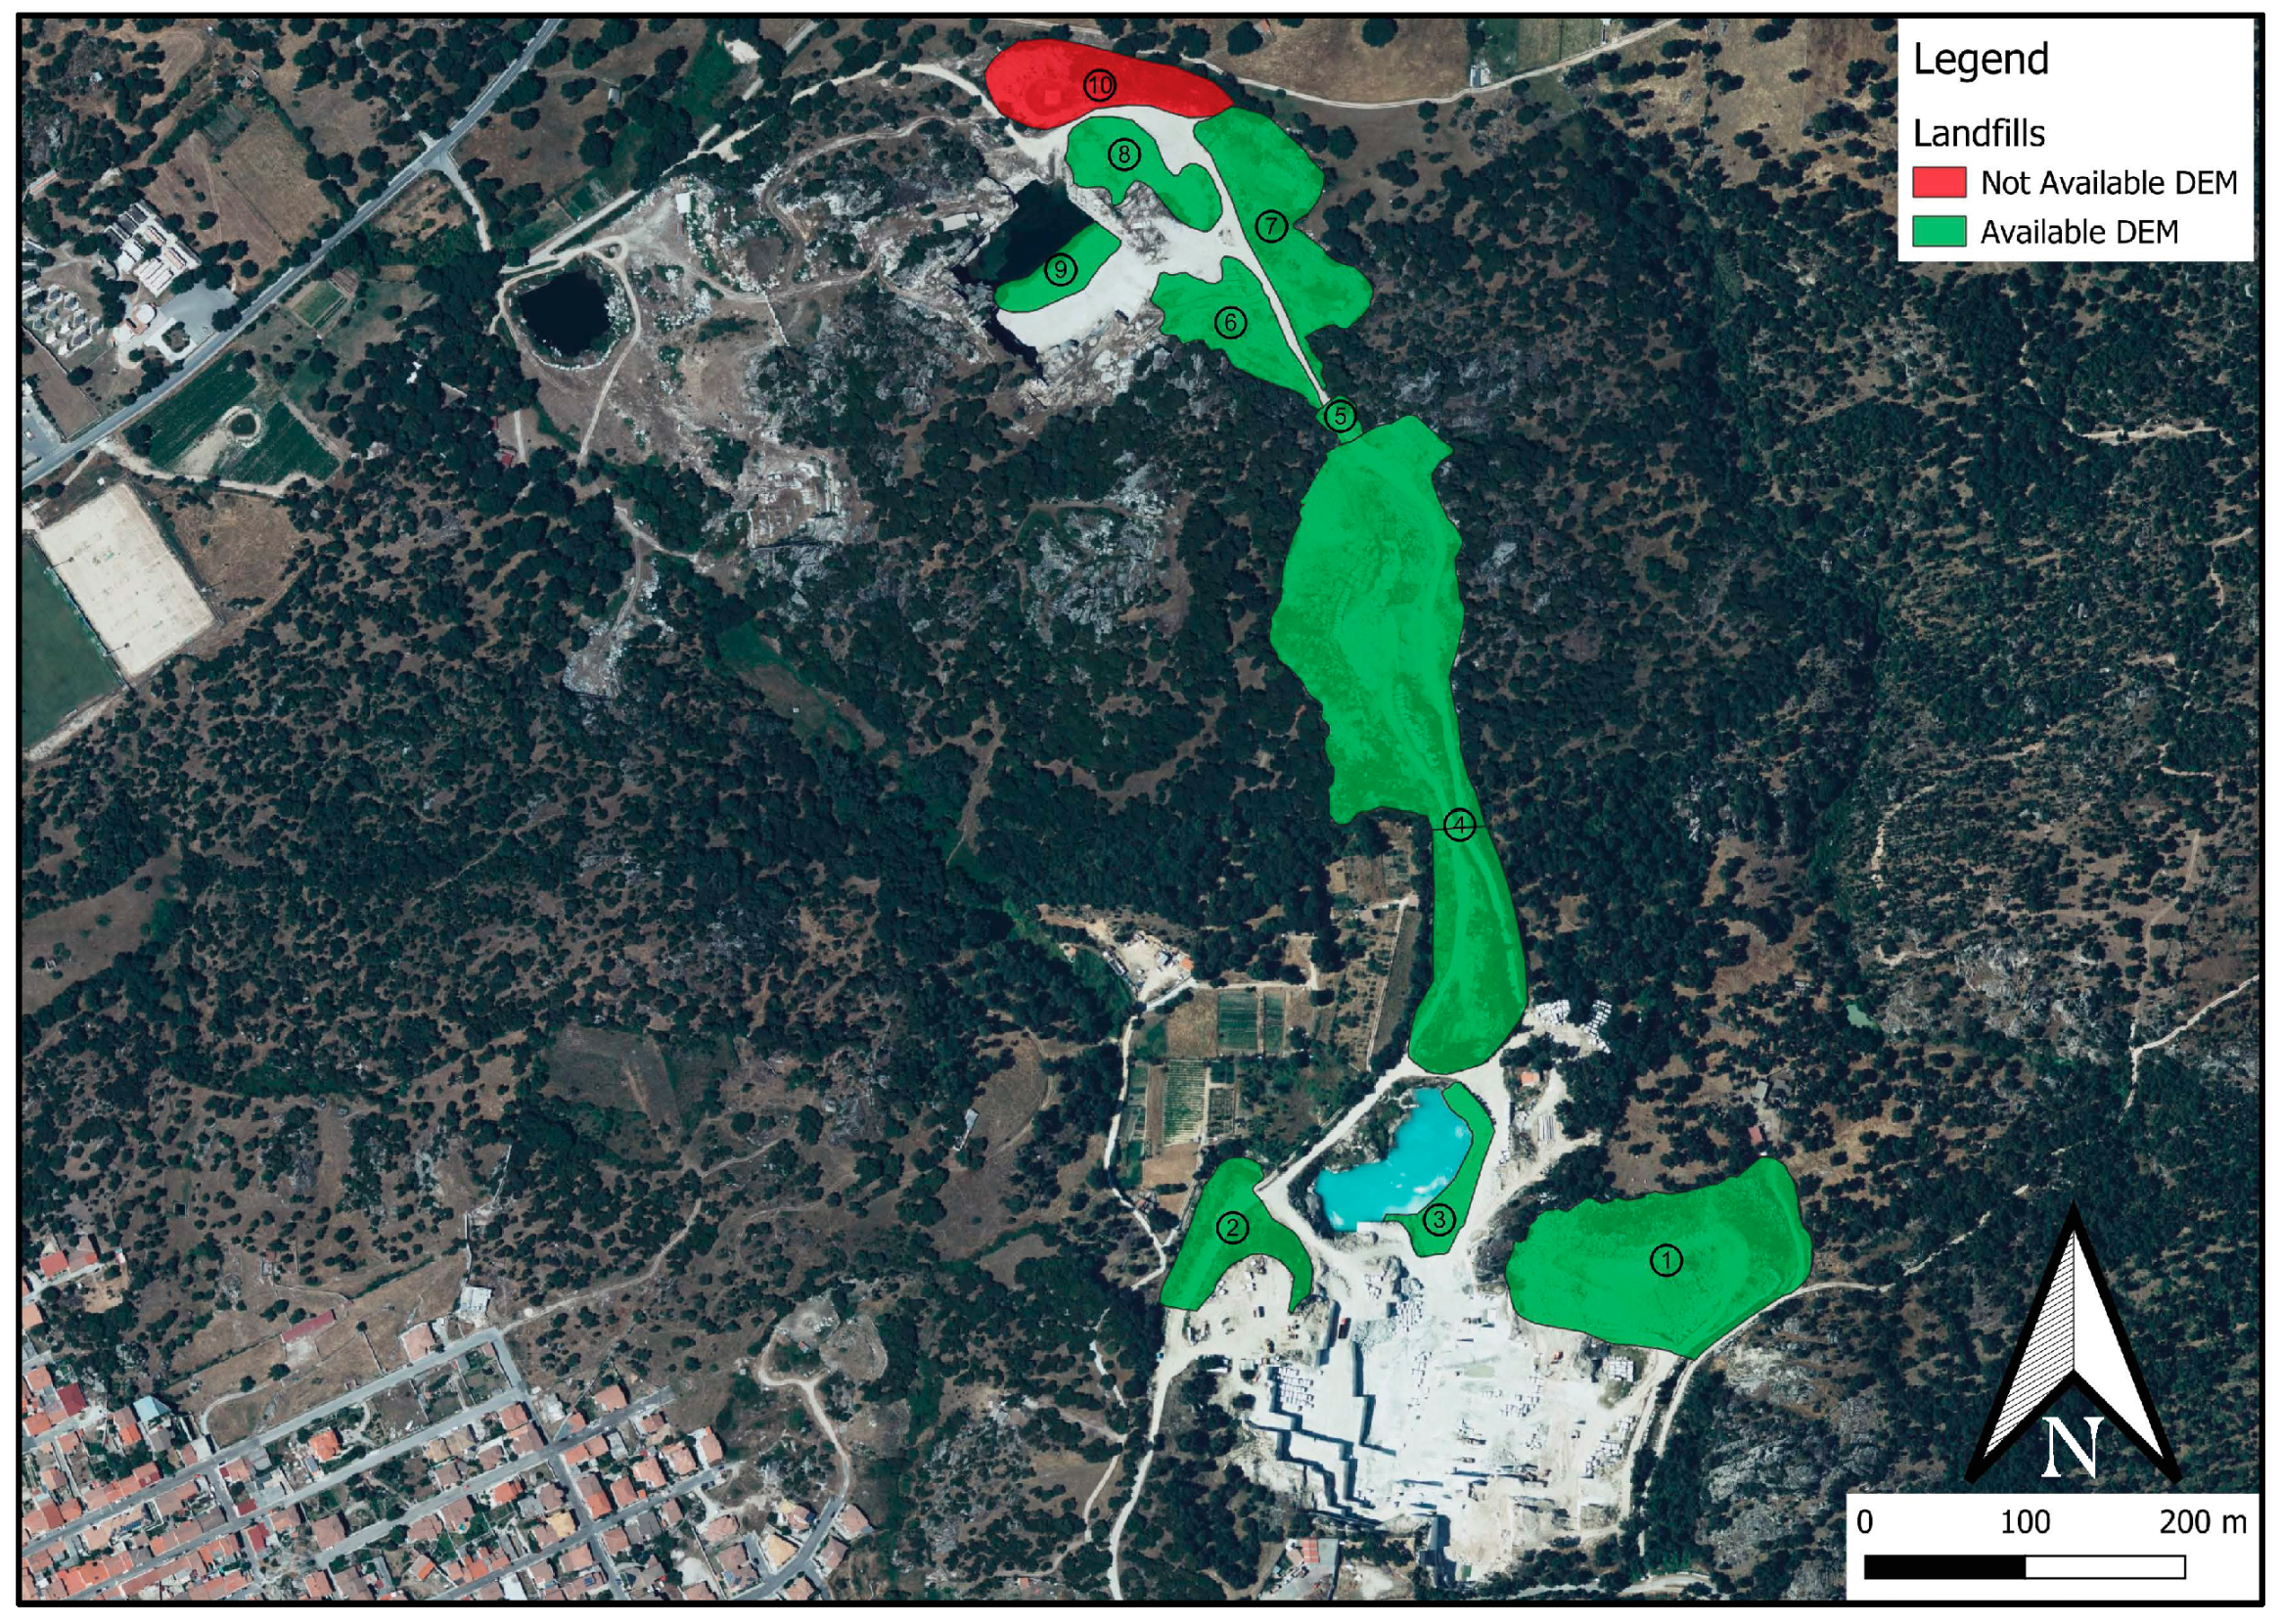
The present research represents a case study of a granite quarry within the municipality of Buddusò, located in one of the most productive areas of the region for granite extraction—the Buddusò-Alà dei Sardi extractive district (northern Sardinia). The rocks of this area belong to the high-K calc-alkaline plutonic association, related to the Corsica–Sardinian Batholith, which formed during the post-collisional phase of the Variscan orogeny [24,25,26]. More specifically, they belong to the so-called Buddusò Pluton, which comprises tonalites, granodiorites, and monzogranites with widespread microgranular mafic enclaves [25,27,28]. These rocks primarily consist of quartz, K feldspar, and plagioclase, with smaller amounts of biotite and hornblende. They are further characterized by accessory minerals including zircon, magnetite, ilmenite, titanite, apatite, rutile, and allanite [29]. Rocks that constitute the EW from the investigated quarry are classified as monzogranites belonging to the calc-alkaline series, and they are generally slightly metaluminous [22].
Previous studies on this quarry have already highlighted the potential of granite EW as a source of RMs for the ceramics and glass industries [22]. The current study was conducted to assess the efficiency of the application of gravity and magnetic separation methods on granite EW in order to concentrate CRMs. The work first involves estimating the quantity of granite EW stored within the site and conducting SEM-EDS measurements and microanalysis on the granite EW to identify any CRMs-bearing minerals. Finally, laboratory tests using gravity and magnetic separation processes are performed on the granite EW to evaluate the possibility of obtaining different CRM-rich fractions.

2. Materials and Methods

2.1. Estimation of Volume and Mass of Granite EW Piles

The volume calculation process was performed using QGIS (version 3.36.2-URL: https://download.qgis.org/downloads/ (accessed on 3 May 2024)). The project was set up with the EPSG:25832 coordinate reference system. A digital elevation model (DEM) provided by the Autonomous Region of Sardinia was then imported and downloaded from the appropriate portal [30]; specifically, a digital surface model (DSM) with a 1-metre resolution was used, derived from aerial LiDAR surveys conducted in 2013, with a vertical accuracy of ±15 cm and horizontal accuracy of ±30 cm. Using an orthophoto obtained from [30] as a background, polygons were digitized to delineate each waste dump identified during the field survey (Figure 1). For each polygon representing the individual waste dumps, the corresponding portion of the DSM was then extracted using the “Clip raster by mask layer” tool (Figure 2).
The volumes of each pile were then calculated using the “Raster surface volume” tool, with the base height set as the “approximate base level via average of polygon vertices”. The calculation was carried out considering only the volume above this base level. An exception to this procedure was made for Waste Dump 10 (see the red polygon in Figure 1), as the extent fell outside the coverage of the available DSM. In this case, the volume was estimated by multiplying the surface area of the dump by the average height of the pile, calculated as the difference between the base elevation and the peak elevation of the pile.
Subsequently, an estimation of the mass for each granite EW pile was carried out. The calculated volumes were multiplied by the specific density of the granite extracted from the quarry, using a value of 2.59 tons/m3 provided by the quarry owner company, SGA Graniti, based on previous material analyses. Due to the heterogeneity of the waste material—ranging from large metric blocks to fine sands—and the considerable size and irregular organization of some of the waste piles, it was not possible to estimate the porosity of each heap. Additionally, the occasional presence of vegetation further complicated this assessment. To address this uncertainty, the calculated mass values were adjusted by applying two assumptions relating to the boundary porosity; in the first scenario, a porosity of 5% was assumed, reducing the initial mass value to 95%; in the second scenario, a higher porosity of 30% was assumed, reducing the initial value to 70%. This approach provided a range of variability for the estimated mass of the granite EW present at the quarry.

2.2. SEM-EDS Analyses

A total of 10 thin sections of granite EW from the quarry, measuring 24 mm × 47 mm, were prepared by the Petrolab laboratory (Sant’Antioco, Sardinia, Italy). These thin sections were subjected to SEM-EDS microanalyses to identify the presence of REE-bearing minerals and determine their semi-quantitative elemental composition. The measurements were performed using a Zeiss EVO MA 15 scanning electron microscope (SEM) (Carl Zeiss, Oberkochen, Germany) equipped with a Lanthanum Hexaboride (LaB6) source. The instrument was coupled with an X-Max 50N energy-dispersive X-ray spectroscopy (EDS) detector (Oxford Instruments, Abingdon, U.K.). Thin sections were analyzed without any coating under variable pressure (VP) conditions of approximately 50–60 Pa. The other operating conditions were as follows: working distance (WD) of approximately 8.5 mm, accelerating voltage of 20 kV, probe current of 200 pA, and cobalt as the calibration standard. Data acquisition was performed using Aztec 3.1 software (Oxford Instruments, Abingdon, U.K.). The semi-quantitative elemental compositions (wt.%) obtained from 148 analysis points on a total of 25 REE-bearing minerals were then converted to oxide compositions using appropriate conversion factors for each element. Finally, the compositions were normalized to 100%.

2.3. Processing and Analyses of Granite EW

The sampling of granite EW was conducted within the quarry area to collect material from various landfill sites. Initially, the material from each sampling point was reduced in size using a pneumatic percussion hammer. By the end of the sampling campaign, 18 samples weighing between 3 and 7 kg each had been obtained. Each sample was then crushed using a jaw crusher. A portion of the crushed material was taken by quartering for whole-rock (WR) compositional analysis. The remaining material was sieved to isolate particles in a size range of 850 μm to 125 μm. Particles smaller than 125 μm, classified as crushing powder (CP), were not subjected to separation processes. Instead, this fraction was sampled by quartering for compositional analysis. Subsequently, the samples underwent gravity and magnetic separation processes, as previously performed in the study by Vaccaro et al. [22] (Figure 3). These processes yielded various fractions, including diamagnetic, highly paramagnetic, weakly paramagnetic, and ferromagnetic materials. The present study focuses on the ferromagnetic and paramagnetic fractions obtained through these methods, aiming to evaluate the levels of CRMs enrichment achieved. Specifically, the fractions under investigation were as follows:
-
A total of 8 heavy ferromagnetic sub-samples (HF), 8 intermediate ferromagnetic sub-samples (IF), and 8 light ferromagnetic sub-samples (LF).
-
A total of 8 heavy highly paramagnetic sub-samples (HHP), 8 intermediate highly paramagnetic sub-samples (IHP), and 8 light highly paramagnetic sub-samples (LHP).
-
A total of 8 heavy weakly paramagnetic sub-samples (HWP), 8 intermediate weakly paramagnetic sub-samples (IWP), and 8 light weakly paramagnetic sub-samples (LWP).
In the present study, due to the quantities of obtained material, all sub-samples were mixed, except for those in the HHP category. This resulted in a single sub-sample for each of the remaining categories.
The characterization of these materials in terms of their major oxides (SiO2, TiO2, Al2O3, Fe2O3, MnO, MgO, CaO, Na2O, K2O, and P2O5) followed the same preparation and analysis procedures described in [22], including grinding, drying, determination of loss on ignition (LOI), and WD-XRF analysis, using the same instrumentation. For the HHP category, one analysis was conducted per sub-sample. For all other categories, three replicate analyses were performed for each mixed sub-sample.
Subsequently, the above-described materials were analyzed to determine concentrations of trace elements. Specifically, two sets of elements were determined; the first set included Sc, Rb, Cs, Sr, Ba, Zr, Hf, V, Nb, Ta, Cr, Ga, Sn, Th, and U, while the second set included REEs. A total of 8 sub-samples were analyzed for the HHP category, along with two replicates for each mixed sub-sample from the other categories. Additionally, it was considered necessary to extend the characterization of Sc, Rb, Cs, Sr, Ba, Zr, Hf, V, Nb, Ta, Cr, Ga, Sn, and Y to both the WR samples and the CP samples, for which REEs determination had previously been conducted in the study by Vaccaro et al. [22]. This allowed for a comparison between the processed material and the original EW. These analyses were carried out by OMAC Laboratories Ltd. (IDA Business Park, Dublin Road, Loughrea, Ireland), accredited by the Irish National Accreditation Board under ISO/IEC 17025:2017 standards [31]. The procedure used was the ME-MS81™ method, in which samples were subjected to lithium metaborate fusion, followed by ICP-MS analysis.

3. Results and Discussions

3.1. Volume and Mass of Granite EW

The results of the volume and mass calculations for the granite EW from the quarry under study are presented in Table 1. Regarding volume estimation, it is observed that within the quarry area, different piles of granite EW vary considerably from one another. The volumes range from a minimum of 1.0 × 10³ m3 to a maximum of 566 × 103 m3. Overall, the volume calculation provides a total estimate of about 962 × 103 m3. In terms of mass, the total granite EW amounts to approximately 2691 × 10⁶ tons, assuming no porosity within the piles. Accounting for a minimum porosity of 5% within the piles, this value would be around 2556 × 103 tons, while with a porosity of 30%, the quantity would be about 1884 × 103 tons. Unfortunately, the gap between the minimum and maximum quantities (approximately 672 × 103 tons) is substantial. As outlined in the Materials and Methods Section, the heterogeneity in shape and size of the EW material, along with the presence of vegetation, did not allow for an accurate estimation of porosity within the piles. Consequently, it was decided to use the two proposed porosity limit values to estimate the quantity of granite EW within the quarry.
It should be noted that the estimates of volume and mass are based on LiDAR surveys conducted in 2013; therefore, the values obtained in this study do not account for all waste accumulated over the subsequent eleven years and a new survey to estimate volumes would be necessary to obtain an updated estimate.

3.2. SEM-EDS Analyses

The SEM-EDS investigations conducted to identify REE-bearing minerals in the granite EW reveal the almost exclusive presence of a single REEs mineral type. This mineral typically exhibits a euhedral to subhedral habit and is often characterized by compositional zoning, with the core showing higher REEs concentrations decreasing toward the edges of the crystal (Figure 4).
From a compositional perspective, these minerals exhibit significant variability within individual grains depending on the analyzed spot. Median values (Table 2) based on 148 analysis points across 24 minerals indicate that these minerals are silicates, characterized by an Fe2O3 content of approximately 15.38 wt.% with a range of 8 to 21 wt.%.
CaO is present in median values of 9.60 wt.%, varying between 6 and 14 wt.%. In terms of REEs oxide (REE2O3) content, these minerals are primarily composed of light rare-earth oxides (LREOs). Ce2O3 is the most abundant, with a median value of 8.49 wt.%, followed by La2O3 (4.03 wt.%), Nd2O3 (2.95 wt.%), Pr2O3 (0.81 wt.%), and Sm2O3 (0.33 wt.%). Occasionally, heavy rare-earth oxides (HREOs) such as Gd2O3 (up to 2.08 wt.%) and Y2O3 (up to 3.09 wt.%) are also detected. The analyzed minerals consistently include the presence of ThO2, with a median value of 1.68 wt.% and maximum values reaching 6.51 wt.%.
Comparing the obtained data with the literature data [32,33,34,35] reveals that the minerals identified within the granite EW are allanites and REEs silicate minerals within the epidote mineral group, with REEs content ranging from 14 wt.% to 33 wt.% and in which LREEs constitute more than 90% of the total [8]. These minerals are typically characterized by an REEs composition trend distributed as follows: Ce > La > Nd >> Pr > Sm > Gd [8]. The higher Ce content confirms that these minerals belong to the Ce–allanite variety [36,37,38]. Furthermore, the presence of allanite as an accessory phase within the granites comprising the Buddusò pluton [25,28,39], among which the granites extracted from the quarry under study are included, has also been highlighted in previous studies [29].
An interesting observation arises when calculating the average Fe2O3 content in each analyzed allanite grain, whereby two distinct groups could be identified. One group displays an Fe2O3 content below 15%, while the other group exhibits a higher Fe2O3 content (Figure 5). This observation may have implications for magnetic separation processes. Iron-rich end members of certain mineral series or families, such as olivines, pyroxenes, amphiboles, tourmalines, garnets, and epidotes, exhibit stronger magnetic properties compared with their counterparts with lower iron content [40,41]. Based on this, it can be hypothesized that variations in iron content within allanite may influence its magnetic properties and, consequently, its behavior during magnetic separation. Allanites with higher iron content may exhibit strongly paramagnetic behaviour, while those with lower iron content may display weakly paramagnetic behaviour.
Although allanite is an REE-bearing mineral, research on its beneficiation remains limited as historically, efforts have focused on REEs minerals such as bastnaesite, xenotime, and monazite [42]. For example, few studies have addressed the density and magnetic separation of these minerals [43,44,45,46,47], while research on flotation techniques [47,48,49] and more environmentally sustainable direct leaching processes [50,51,52] has also been limited.
In a context where the identification of non-conventional sources of CRMs is increasingly essential, although allanite is not currently used for REEs extraction, this mineral may be utilized for such purposes in the future. In this regard, even the identification of deposits or recycling processes that can generate allanite-enriched fractions could contribute to the future use of this mineral for CRMs supply. The strategic importance of REEs for advanced technologies and green energy applications further underscores the need to explore accessory minerals like allanite. By characterizing the occurrence, distribution, and processing potential of allanite in various geological settings or waste streams, future studies could enhance resource efficiency and provide alternative pathways for REEs supply.

3.3. Composition of Obtained Materials

The analytical results for trace element abundances in WR and CP are presented in the Supplementary Materials (Table S1). These data are also used in the following sections for the discussion of results.

3.3.1. Ferromagnetic Fractions

The average composition of the ferromagnetic fractions, in terms of major oxides, is presented in Table 3. The effects of gravity separation are clearly visible, particularly regarding Fe2O3 and SiO2 content. As expected, Fe2O3 contents are highest in the HF fraction (61.32 ± 0.07 wt.%), decreasing in the IF (58.21 ± 0.37 wt.%), and reaching the lowest value in the LF (23.84 ± 0.07 wt.%). Conversely, the silica content is lowest in the HF (18.98 ± 0.08 wt.%), increases in the IF (21.31 ± 0.11 wt.%), and peaks in the LF (44.45 ± 0.24 wt.%). The LF fraction also exhibits a notably higher Al2O3 content (14.74 ± 0.13 wt.%) compared with the HF and IF fractions (8.43 ± 0.03 wt.% and 8.10 ± 0.14 wt.%, respectively). Significant differences are also observed in terms of K2O content, which is higher in the LF fraction (4.92 ± 0.05 wt.%) compared with the HF and the IF (2.57 ± 0.01 wt.% and 2.84 ± 0.02 wt.%).
Considering the nature of the source material, the ferromagnetic mineral constituting these fractions is expected to be magnetite [53], which is responsible for the bulk magnetic susceptibility of granites [54], for instance. Based on this, it would be reasonable to expect Fe2O3 and SiO2 concentrations much closer to those typical of magnetite, with Fe2O3 exceeding 90 wt.% and SiO2 being lower than 0.1 wt.% [55]. The analytical results, however, reveal compositions that significantly diverge from those of pure magnetite, particularly in the HF fraction, where a higher if not exclusive accumulation is expected given the high density of this mineral (5.18 g/cm3) [56]. The explanation for this deviation from the expected results is confirmed by microscopic observations of the material. As shown in Figure 6, heterogeneity in color among the granules within the LF fraction is clearly visible. Many of the granules appear polymineralic, consisting of aggregates of magnetite and quartz or feldspars and, possibly, magnetite and biotite aggregates, which are more difficult to identify. From these observations, it appears that even the minimal presence of magnetite within the polymineralic grains imparts ferromagnetic properties to the grain. In light of this, it can be inferred that the combination of gravity separation and magnetic separation produces fractions in which the HF is relatively the purest, containing a higher abundance of magnetite within the polymineralic granules, with this abundance decreasing toward the IF and the LF fractions. These findings indicates that the crushing process and the particle size range extending up to 850 µm are not effective in fully liberating the magnetite minerals. To improve this aspect, it would be necessary to reduce the maximum particle size below 850 µm.
Regarding the abundance of trace elements, the analytical results are presented in the Supplementary Materials (Table S2). Among the analyzed elements, the HF fraction contains the highest concentrations of Zr (1383 ± 67 ppm), V (1098 ± 17 ppm), and Cr (897 ± 47 ppm). Other CRMs in this fraction include the following concentrations: Sc—11.5 ± 0.5 ppm, Sr—21.0 ± 0.0 ppm, Hf—43.3 ± 1.6 ppm, Nb—20.1 ± 0.4 ppm, Ta—1.3 ± 0.1 ppm, and Ga—30.9 ± 0.5 ppm. Regarding radiogenic elements, Th content is 114 ± 1 ppm, while U is 16.8 ± 0.4 ppm. In the IF fraction, V (856 ± 4 ppm) and Cr (474 ± 1 ppm) concentrations are lower than those in the HF fraction, whereas Zr concentrations are slightly higher (1436 ± 49 ppm). The concentrations of other CRMs elements in the IF are higher than in the HF sub-sample as follows: Sc—19.7 ± 0.5 ppm, Sr—27.2 ± 0.6 ppm, Hf—48.9 ± 0.6 ppm, Nb—31.9 ± 0.4 ppm, Ta—2.0 ± 0.1 ppm, and Ga—38.1 ± 0.8 ppm. Radiogenic elements are also more concentrated in the IF, with Th at 155 ± 2 ppm and U at 19.1 ± 0.3 ppm. The LF sub-sample contains even higher concentrations of certain elements, particularly Sc (36 ± 0.9 ppm), Sr (78.7 ± 5.5 ppm), Nb (55.4 ± 0.8 ppm), Ta (2.3 ± 0.2 ppm), and Ga (38.6 ± 0.2 ppm) compared with the HF and the IF sub-samples.
Relative to the WR, the ferromagnetic samples are enriched in most of the CRMs elements analyzed, except for Sr, which is depleted across all three fractions. Cr is the most enriched element in HF (71 times WR) and IF (38 times WR), while the LF shows lower enrichment (six times WR). V is enriched by a factor of 44 in the HF and 34 in the IF, whereas the LF has a lower enrichment factor of 12. Zr and Hf are moderately enriched in the HF and the IF (11–13 times WR) but only around six times WR in the LF. Elements such as Sc, Nb, Ta, and Ga show smaller enrichment factors (<6 times WR), with considerable enrichments found in the LF (see Figure 7).
Comparing the ferromagnetic fractions (Figure 7) with the composition of the Upper Continental Crust (UCC) [57], the most evident anomaly is a depletion in Sr, which falls to below 0.1 times the UCC in both the HF and the IF. Additionally, the HF and the IF are slightly depleted in Ta, whereas the LF has concentrations comparable to the UCC. A minor depletion in Nb is observed in the HF, while both the IF and the LF show slight enrichment. The HF exhibits the highest enrichments in Cr (26 times UCC) and V (18 times UCC), followed by the IF, where V and Cr are enriched by a factor of approximately 15, while the LF shows lower levels of enrichment. Zr and Hf are moderately enriched in all samples (four to eight times UCC levels).
Regarding the REEs composition of the ferromagnetic fractions, the analytical results, together with the REEs composition of WR derived from Vaccaro et al. [22], are presented in the Supplementary Materials (Table S3). In terms of concentration, LREEs are significantly more abundant than HREEs in all the ferromagnetic sub-samples. The IF fraction exhibits the highest concentration, with ΣREE = 1341 ± 3 ppm, consisting of ~1097 ppm LREEs and ~244 ppm HREEs. For HF, ΣREE is slightly lower than IF (1125 ± 14 ppm), with ~942 ppm LREEs and ~288 ppm HREEs. The LF fraction has ΣREE = 864 ± 5 ppm, with ~715 ppm LREEs and ~149 ppm HREEs. Compared with the WR, the REEs content is moderately enriched in all fractions (Figure 8), with the only exception being Eu, which displays a noticeable negative anomaly, making it nearly equivalent to the WR. No differential enrichment between LREEs and HREEs is observed, as evidenced by the flat distribution pattern. The enrichment range for REEs (Table 4) is 11 × WR > IF > HF > LF > 5 × WR. Relative to the composition of the Upper Continental Crust (UCC) [57], the UCC-normalized REEs distribution patterns closely mirror those seen relative to the WR (Figure 8), with the only difference being slightly lower enrichment levels compared with the WR-normalized patterns, with 9 × UCC > IF > HF > LF > 4 × UCC. In this case, the relatively high abundance of REEs in all three fractions could be attributed to the predominant presence of polymineralic grains. In this scenario, the co-occurrence of allanite and magnetite would lead to increased concentrations of REEs in these fractions, effectively drawing allanite away from the other fractions. Consequently, as previously suggested, reducing the maximum particle size limit below 850 µm may yield improved results during the separation phases.

3.3.2. Highly Paramagnetic Fractions

The mean composition of major oxides in the highly paramagnetic fractions is presented in Table 5. The effects of combining gravity separation and magnetic separation are not evident in terms of the major oxides. All three fractions are characterized by a silica content ranging from 31 to 33 wt.% and a relatively high Fe2O3 content (27–29 wt.%). No significant differences attributable to the combined effects of the two separation steps are observed for other oxides, except for CaO, which is present in lower values in the LHP fraction (2.01 ± 0.00 wt.%) compared with the IHP (3.14 ± 0.03 wt.%) and the HHP (3.66 ± 0.74 wt.%).
Regarding trace element abundance in the highly paramagnetic fractions, the analytical results are presented in the Supplementary Materials (Table S4). Again, in this case, the combined effects of gravity separation and magnetic separation are not particularly evident for most of the analyzed elements. An exception to this is represented by Sr, which has its minimum concentration in the LHP (32.6 ± 0.8 ppm) and maximum concentration in the HHP (78.4 ± 31.6 ppm). More pronounced differences is observed for Th concentration across the three fractions. Specifically, the lowest concentrations are found in the LF (50.4 ± 0.9 ppm), while the highest concentrations are observed in the HHP (429 ± 120 ppm). Given the presence of allanite in the granite waste, this may indicate the effectiveness of the two separation steps in concentrating this mineral in the IHP and especially the HHP fractions.
The trace element distribution patterns relative to the WR are largely similar among the three fractions (Figure 9). The enrichment of all elements is observed, except for Sr and Cr, which are depleted relative to the WR. All other elements are enriched compared with the WR, with Ta being the most enriched (approximately 26 times WR). As previously noted, the most significant differences are for Th and U, which are highly enriched in the IHP and HHP (24–30 times WR; U = 6–9 times WR) and much less pronounced in the LHP (Th ~3 times WR; U = 2 times WR).
Compared with the UCC composition [57], the trace element distribution patterns are quite similar across the three fractions (Figure 9), with Sr and Cr depleted in all three fractions, while U is also slightly depleted in the LHP. Generally, other trace elements are moderately enriched, though to a lesser extent than in the WR-normalized patterns. By contrast, Th exhibits higher enrichment levels than in the WR-normalized patterns, ranging from 32 to 40 times UCC in the IHP and the HHP; U also exhibits substantial variations, with the HHP showing the highest concentrations (15.6 ± 9.3 ppm) and the LHP the lowest (4.1 ± 0.2 ppm).
Regarding the REEs composition of the highly paramagnetic fractions, the analytical results together with the REEs composition of WR derived from Vaccaro et al. [22] are presented in the Supplementary Materials (Table S5). The combined effects of gravity separation and magnetic separation on the REEs composition are notably evident. In terms of ΣREE, the HHP fraction shows the highest concentration (5430 ± 1736 ppm), followed by the IHP (3879 ± 133 ppm), with the LHP presenting the lowest concentration (662 ± 19 ppm). Furthermore, a significant predominance of LREEs is observed, with LREEs/HREEs ratios of ~14.7 in the HHP, ~14.6 in the IHP, and ~5.1 in the LHP. These results are consistent with previous observations for Th and CaO based on the SEM-EDS semi-quantitative analysis of allanite in granite EW samples (characterized by elevated LREEs content), indicating the effectiveness of these separation techniques in concentrating allanite in the HHP and IHP fractions.
The WR-normalized REEs distribution patterns (Table 6) reveal a substantial enrichment of LREEs relative to HREEs in the HHP and the IHP fractions (Figure 10) as follows:
  • In the HHP fraction, LREEs enrichment ranges from a minimum of 27 times WR for Sm to a maximum of 41 times WR for La. In the HREEs range, a marked negative Eu anomaly is observed (five times WR), with enrichment values for other HREEs varying from a minimum of eight times WR for Yb to a maximum of 20 times WR for Gd;
  • In the IHP fraction, the REEs distribution pattern mirrors that of the HHP, albeit with lower enrichment levels. LREEs enrichment spans from 21 times WR for Sm to 29 times WR for La. In the HREEs range, the Eu anomaly is observed at four times WR, with enrichment levels for other HREEs ranging from seven times WR for Yb to 16 times WR for Gd;
  • In the LHP fraction, enrichment levels are significantly lower than those observed in the HHP and the IHP, as anticipated. No differential enrichment between LREEs and HREEs is evident, as reflected by a flat distribution pattern, with enrichment factors of 3–4 times WR across REEs. A negative Eu anomaly is also present, with Eu showing no enrichment relative to the original material.
The UCC-normalized REEs distribution patterns (Table 6) display shapes broadly comparable to the WR-normalized patterns but with slightly different enrichment factors (Figure 10), including the following:
  • For the HHP fraction, LREEs enrichment ranges from a minimum of 29 times UCC for Sm to a maximum of 43 times UCC for La. Among the HREEs, the Eu anomaly is observed at four times UCC, with other HREEs enrichment values ranging from a minimum of six times UCC for Yb to a maximum of 19 times UCC for Gd;
  • In the IHP fraction, LREEs enrichment ranges from 23 times UCC for Sm to 30 times UCC for La. Within the HREEs range, the Eu anomaly is observed at three times UCC, while other HREEs enrichment levels vary from five times UCC for Yb to a maximum of 15 times UCC for Gd;
  • In the LHP fraction, enrichment patterns are generally flat, with enrichment factors between two and four times UCC across all REEs, except for the notable exception of Eu, which in this case is depleted (0.9 times UCC).
The results reported thus far, namely the higher CaO content in the HHP and the IHP fractions along with elevated levels of Th and LREEs, suggest that the combination of gravity separation and magnetic separation effectively concentrated the allanite present in the initial waste material into these two fractions. On the other hand, another aspect emerging from the analytical results is that the LHP fraction shows a relatively high REEs content, although this is clearly much lower than that of the other two fractions. In this case as well, the presence of polymineralic grains made of allanite and biotite or other minerals (Figure 11) is considered likely to be a contributing factor to the observed effects. Therefore, it is necessary to reduce the maximum particle size limit of 850 µm to achieve better results during the separation steps.

3.3.3. Weakly Paramagnetic Fractions

The mean composition of major oxides in the weakly paramagnetic fractions is presented in Table 7. For these sub-samples, the effects of the gravity and magnetic separations are evident in their major oxide composition. The LWP sub-samples differs from all the others in the following ways: higher SiO2 content (61.29 ± 0.15 wt.%) compared with the HWP and the IWP (57.08 ± 0.01 wt.% and 57.3 ± 0.19 wt.%, respectively); lower Fe2O3 content (4.31 ± 0.02 wt.%) compared with the HWP (5.63 ± 0.00 wt.%) and the IWP (5.86 ± 0.01 wt.%); lower CaO content (3.01 ± 0.02 wt.%) relative to the HWP (6.28 ± 0.01 wt.%) and the IWP (5.57 ± 0.03 wt.%); and higher K2O content (4.03 ± 0.00 wt.%) compared with the HWP and the IWP (3.15 ± 0.00 wt.% and 3.45 ± 0.01 wt.%, respectively).
Regarding the abundance of trace elements in the weakly paramagnetic fractions, the analytical results are presented in the Supplementary Materials (Table S6). The weakly paramagnetic fractions also clearly reflect the combined effects of gravity separation and magnetic separation in terms of trace element concentrations. Specifically, the HWP fraction is characterized by higher concentrations of trace elements compared with the IWP and particularly, the LWP. The most notable differences are as follows: Sc, with maximum concentrations in the HWP (48.5 ± 0.9 ppm) and minimum in the LWP (16.1 ± 0.9 ppm); Sr, with maximum values in the HWP (264 ± 2 p pm) and minimum in the LWP (153 ± 2 ppm); V, ranging from 121 ± 1 ppm in the HWP to 49.5 ± 1.5 ppm in the LWP; and Nb, with maximum concentrations in the HWP (41.6 ± 0.3 ppm) and minimum in the LWP (22.9 ± 0.1 ppm). The most pronounced differences, however, are observed for Th, which has concentrations of 82.8 ± 1.5 ppm in the LWP and is approximately eight times higher in the IWP (810 ± 8 ppm), peaking in the HWP (1000 ± 0 ppm). As previously noted, the high Th concentrations in the IWP and the HWP, along with the CaO data, indicate the efficiency of concentrating allanite within these two fractions. Substantial differences in U content are also observed, at 4.4 ± 0.5 ppm in the LWP and rising to concentrations approximately 22 times higher in the HWP (98.4 ± 11.1 ppm).
Compared with the WR, trace element enrichment levels are generally moderate (Figure 12). The WR-normalized patterns display a clear negative Cr anomaly, with Cr depleted relative to the WR across all three fractions. The patterns of the HWP and the IWP are nearly identical, with the highest enrichment observed for Sc (approximately 5–6 times WR) and Ta (approximately 10–11 times WR), while the LWP exhibits significantly lower enrichment levels than the other two fractions. As expected, Th and U stood out from other elements due to pronounced positive anomalies in the IWP and, especially, in the HWP. In the latter, Th content is approximately 70 times WR and U is around 57 times WR; in the IWP, Th is enriched by 57 times WR, while levels of U reach approximately 19 times WR. The LWP fraction shows considerably lower enrichment levels.
On the other hand, the UCC-normalized trace element distribution patterns show that enrichment levels are quite limited for nearly all the elements studied, with Sc being the only CRM element slightly more enriched than the others (approximately four times UCC in the HWP and the IWP). Other elements display even lower enrichment levels. The negative Cr anomaly is more pronounced compared with previous observations, and Sr depletion is observed across all fractions. The LWP fraction is depleted in elements such as V, Nb, and Ta relative to the UCC. Once again, Th and U exhibit strong positive anomalies: in the HWP, Th enrichment reaches 93 times UCC, while U is 35 times UCC; in the IWP, Th reaches 75 times its concentration in the UCC, with U at 12 times UCC. Significantly lower enrichment levels are observed in the LWP, with Th at eight times UCC and U at twice the UCC levels.
Regarding the REEs composition of the weakly paramagnetic fractions, the analytical results together with the REEs composition of WR derived from Vaccaro et al. [22] are presented in the Supplementary Materials (Table S7). In this case, the effects of gravity separation and magnetic separation in the weakly paramagnetic fractions are very evident. In terms of ΣREE, the HWP fraction is the most concentrated, showing notably high concentrations (12,695 ± 61 ppm), followed by the IWP with lower concentrations (9224 ± 196 ppm). The LWP fraction, on the other hand, shows a significantly lower ΣREE content compared with the other two sub-samples (872 ± 7 ppm). Similarly to the highly paramagnetic fraction, a distinctly higher LREEs content is observed compared with HREEs, with LREE–HREE ratios as follows: ~21.7 in HWP, ~19.7 in IWP, and ~9.3 in the LWP.
Relative to the WR, it is observed that the HWP and the IWP fractions are highly enriched in REEs (Table 8), with LREEs being much more enriched than HREEs (Figure 13), as expected.
  • In the HWP fraction, LREEs enrichment ranges from a minimum of 65 times WR for Sm to a maximum of 93 times WR for La. HREEs vary from a minimum of 13 times WR for Eu to a maximum of 43 times WR for Gd;
  • The WR-normalized REEs distribution pattern of the IWP mirrors that of the HWP, although with lower enrichment levels. LREEs enrichment spans from 48 times WR for Sm to 67 times WR for La. Enrichment levels for HREEs range from 10 times WR for Yb and Eu to 32 times WR for Gd;
  • In the LWP fraction, enrichment levels are significantly lower. No significant differential enrichment between LREEs and HREEs is evident, as reflected by a quite flat distribution pattern. Enrichment factors of five to six times WR are observed for LREEs and three to four times WR for HREEs. Eu shows the lowest enrichment factor (two times WR).
The distribution patterns of the UCC-normalized REEs (Table 8) display shapes broadly comparable to the WR-normalized patterns but with slightly different enrichment factors (Figure 13).
  • For the HWP fraction, LREEs enrichment ranges from a minimum of 70 times UCC for Sm to a maximum of 98 times UCC for La. Among HREEs, enrichment values range from a minimum of nine times UCC for Yb to a maximum of 41 times UCC for Gd;
  • In the IWP fraction, LREEs enrichment ranges from 52 times UCC for Sm to 70 times UCC for La. HREEs enrichment levels vary from seven times UCC for Yb to a maximum of 30 times UCC for Gd;
In the LWP fraction, LREEs (five to six times UCC) are slightly more enriched compared with HREEs (two to four times UCC).
The data obtained indicate that the HWP and the IWP fractions are strongly enriched in CaO, Th, and REEs compared with the LWP fraction, with higher LREE–HREE ratios. This suggests that the separation techniques are effective in concentrating allanite within these fractions.
Furthermore, the findings of the present study confirm that variations in Fe content influence the magnetic susceptibility of allanite, with grains with higher Fe content exhibiting highly paramagnetic behaviour, while grains with lower Fe content display weakly paramagnetic behaviour. Supporting this interpretation, SEM-EDS observations (examples in Figure 14) corroborate these conclusions, although they were performed on a limited number of allanite grains in the HHP, the IHP, the HWP, and the IWP fractions. In the HHP and IHP fractions, the average Fe2O3 content in the allanite exceeds 15 wt.%, whereas in the HWP and the IWP fractions, the Fe2O3 content is below 15 wt.%. These values closely approach the 15 wt.% threshold identified through SEM-EDS thin-section measurements, which allowed for the distinction between two different clusters.
As previously observed in the highly paramagnetic fractions, the weakly paramagnetic sub-samples also exhibit relatively high REEs content in the light fraction. Considering that allanite grains in the HWP and IWP fractions generally appear to be relatively free of other minerals (examples shown in Figure 14) and based on observations made in previous sections, this could once again be attributed to the presence of polymineralic grains of allanite combined with other minerals. These grains may have been collected within the light fractions during gravity separation rather than the intermediate or heavy fractions. Therefore, and as previously suggested, reducing the maximum grain size threshold to under 850 µm could improve mineral liberation, enabling a more effective separation of allanite.

4. Potential CRMs Recovery from the Granite EW

To perform a preliminary evaluation of the materials studied, the outlook coefficient (Koutl) proposed by Seredin (2010) [58] is calculated. This coefficient is based on the concept that a deposit is more attractive if it has a higher content of critical REEs (Nd, Tb, Dy, Y, Eu, Er) relative to non-critical and excess REEs (La, Pr, Sm, Gd, Ce, Ho, Tm, Yb, Lu). The formula for calculating Koutl is as follows:
K outl = Nd + Eu + Tb + Dy + Er + Y / REE Ce + Ho + Tm + Yb + Lu / REE
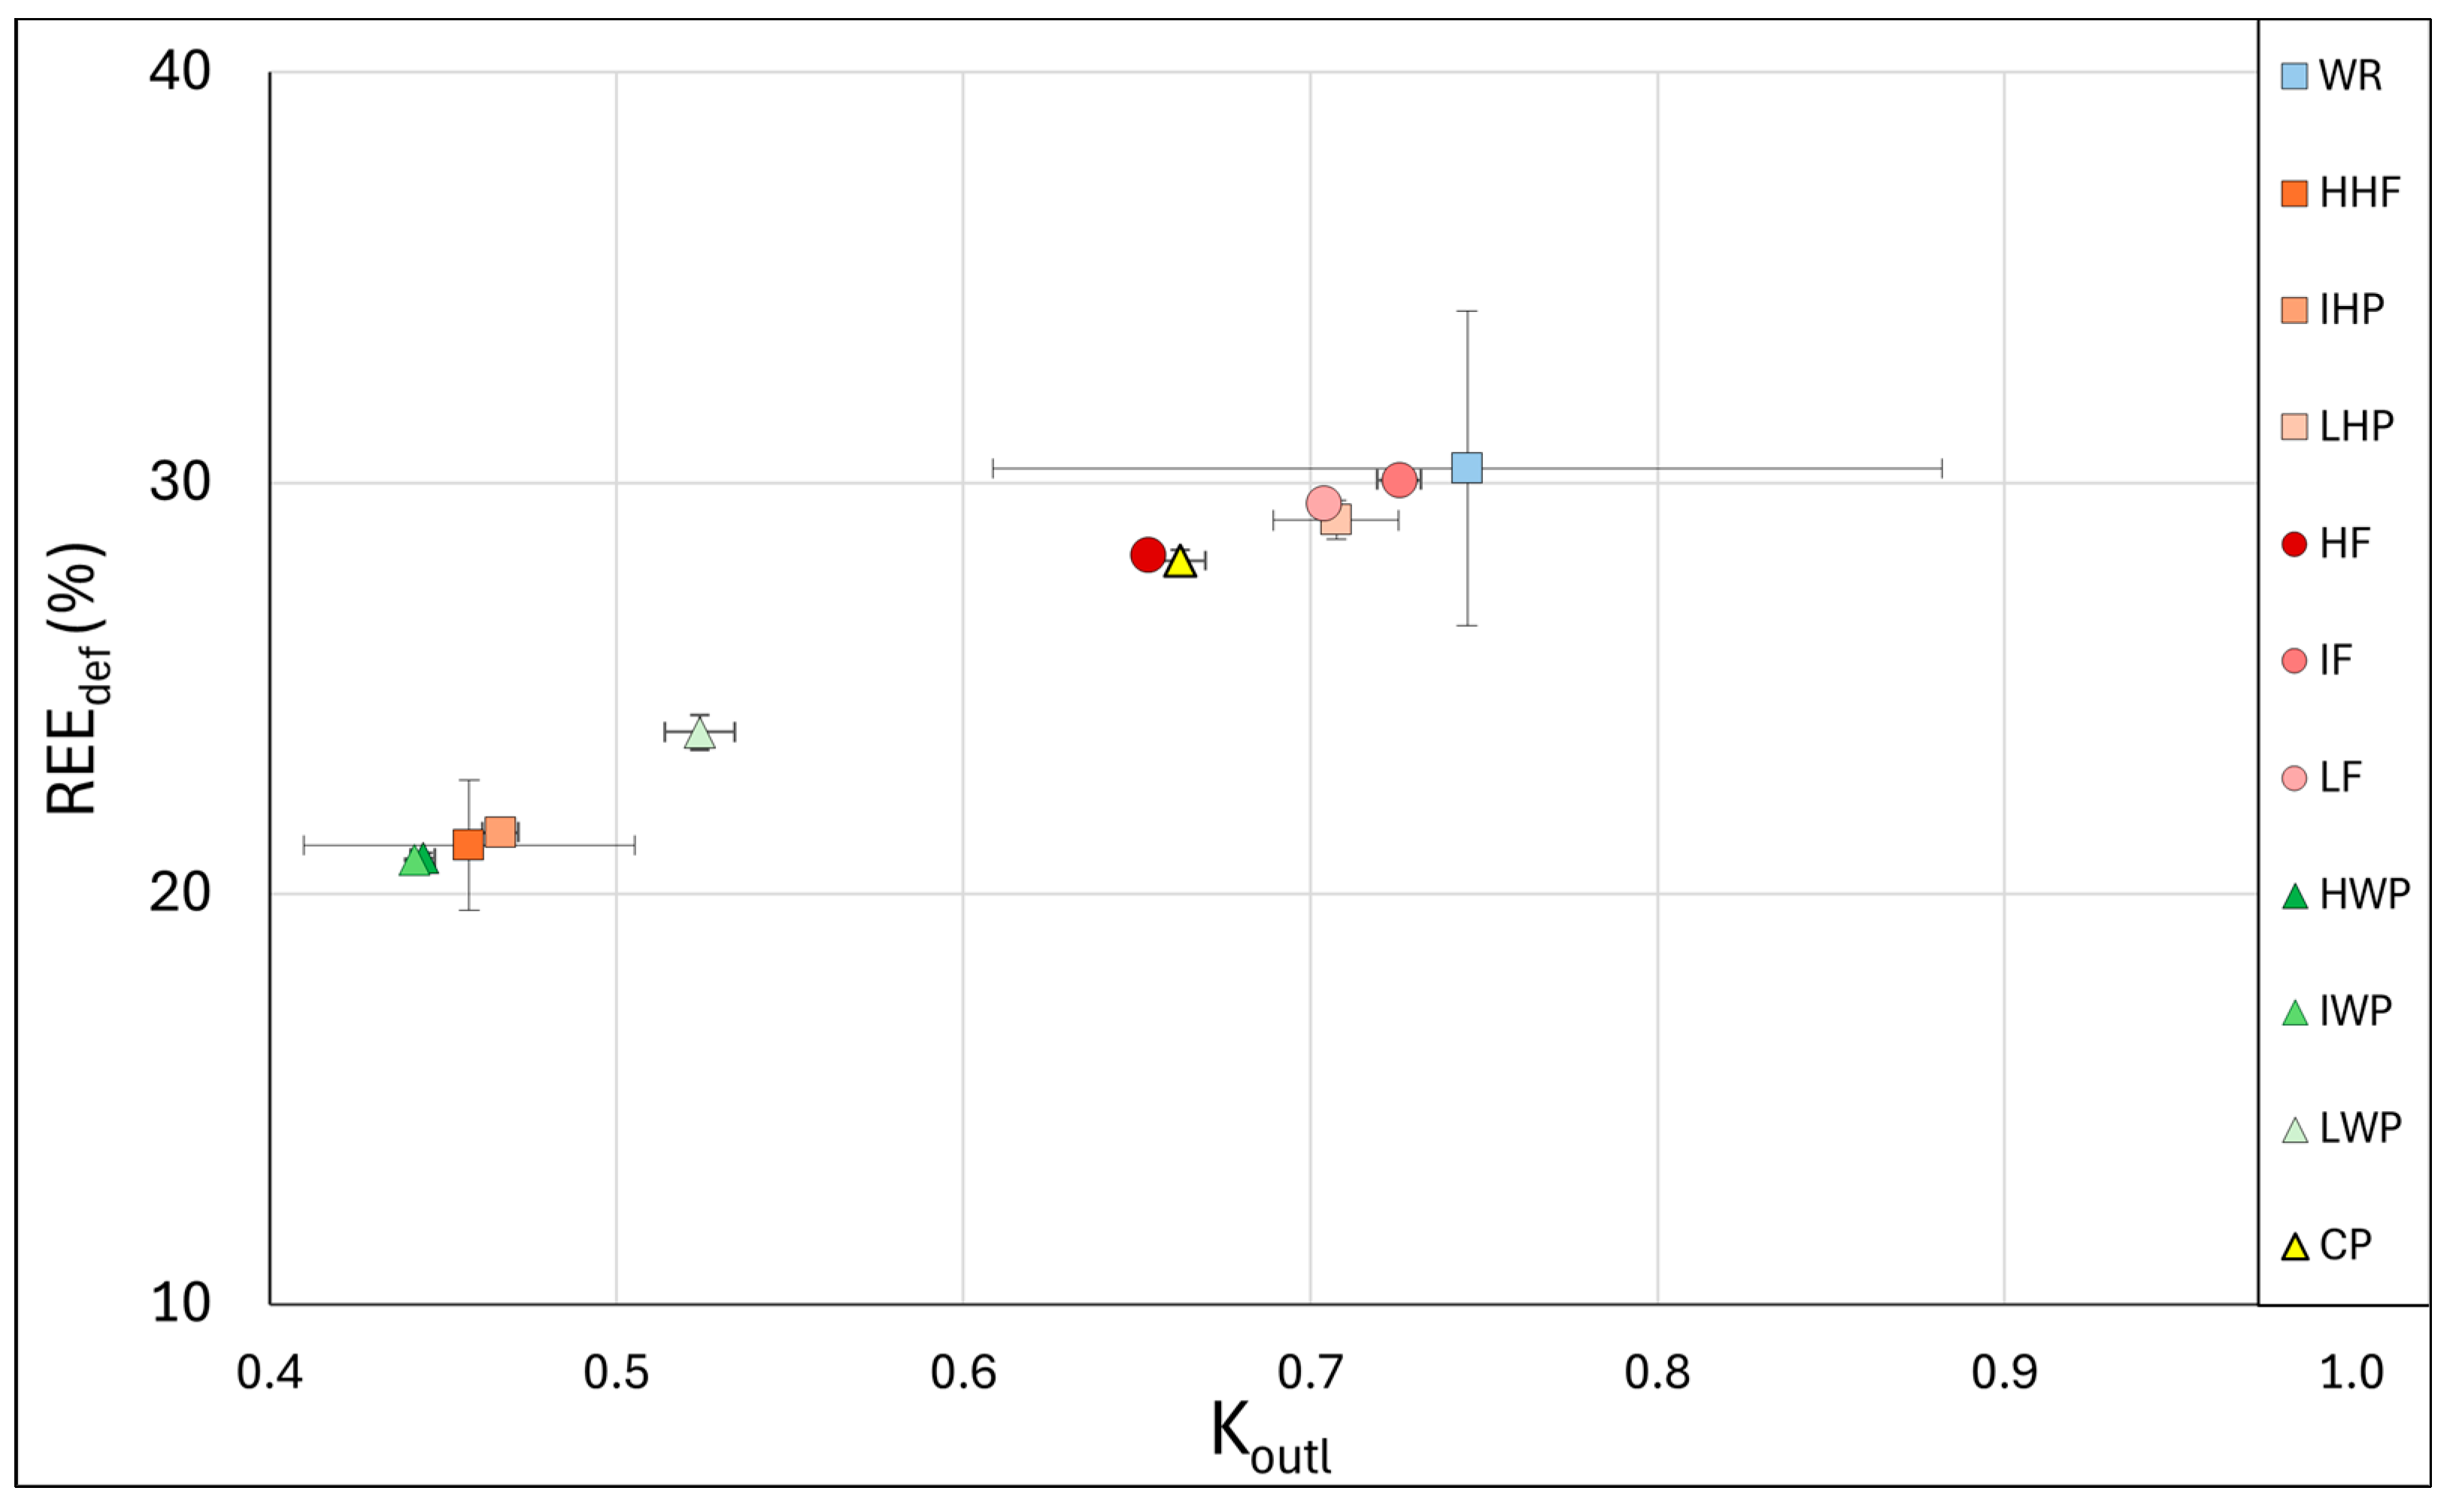
Generally, EW materials with a Koutl above 0.7 and a critical REEs content (REEdef) exceeding 30% of the total can be considered to have high industrial recovery potential [58,59]. In this study (
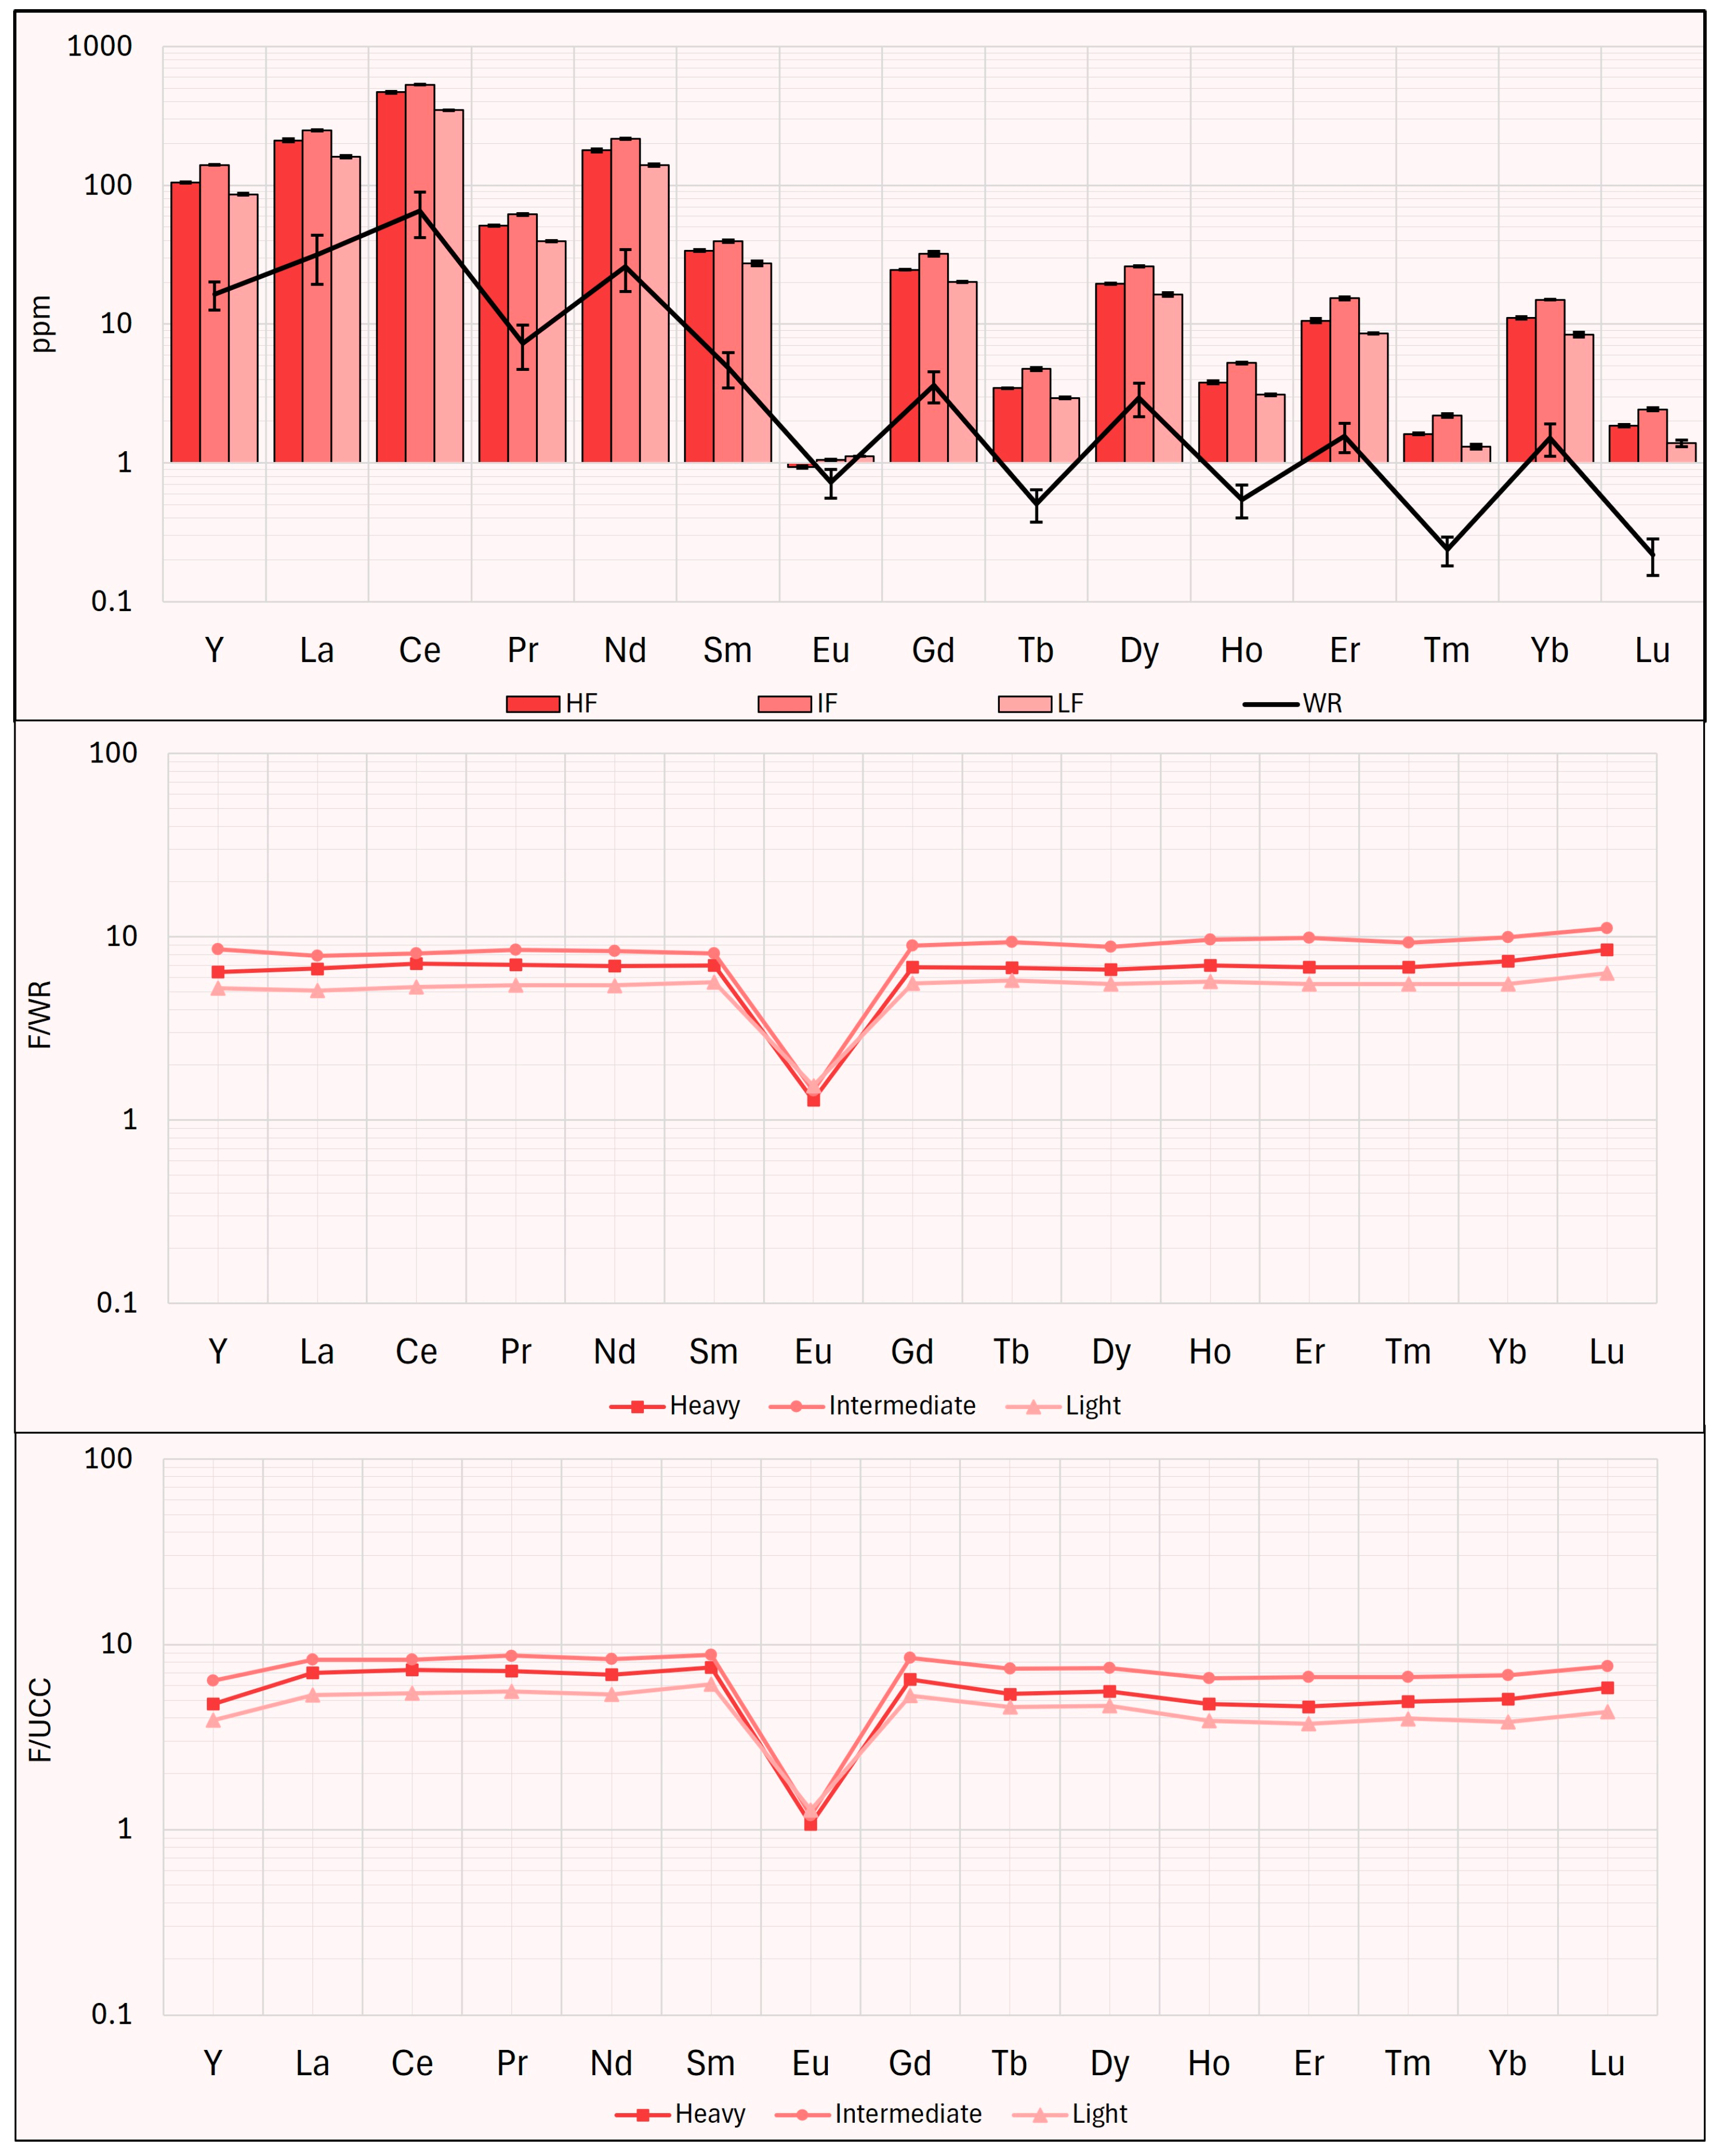
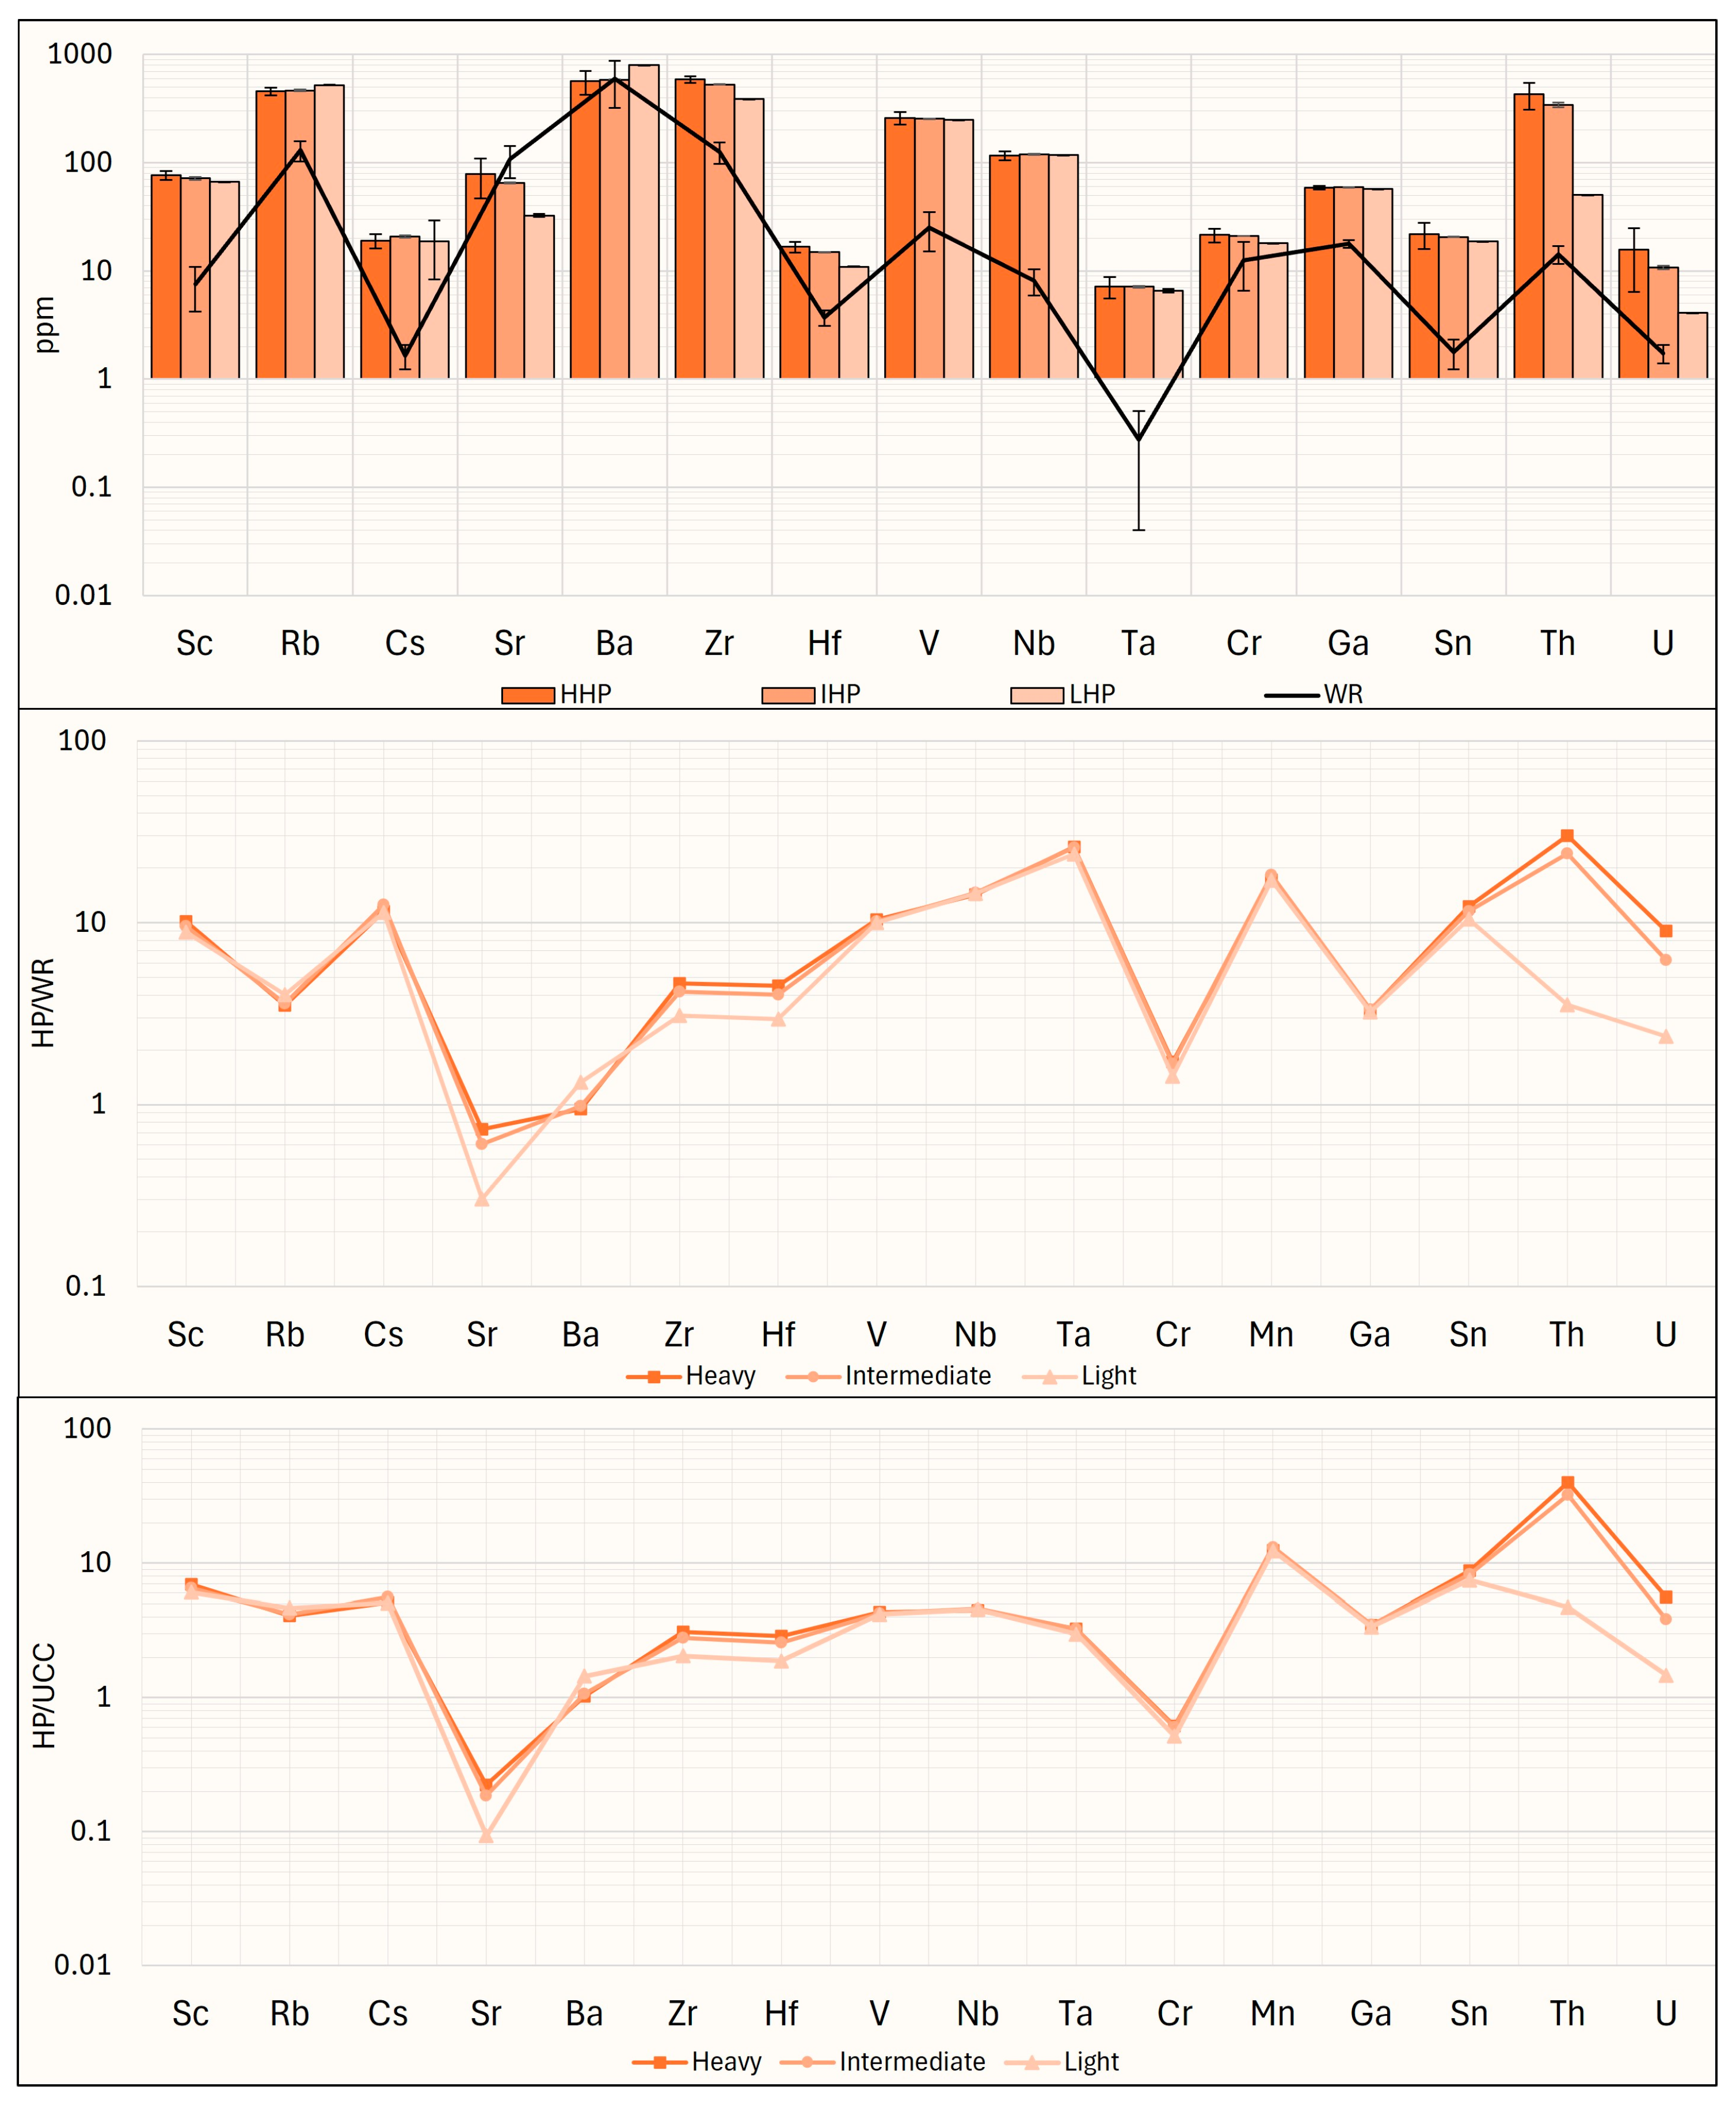
Figure 15), the only material with both Koutl and REEdef values above these thresholds is WR. Meanwhile, the LHP, the IF, and the LF have Koutl values above 0.7 but REEdef below 30%. All other fractions have values below these thresholds. Although the outlook coefficients of the investigated fractions are relatively low, it is important to note that all fractions have a fairly high content of REEs. Given that the generally accepted minimum industrial grade for the recovery of REEs is 300 ppm [
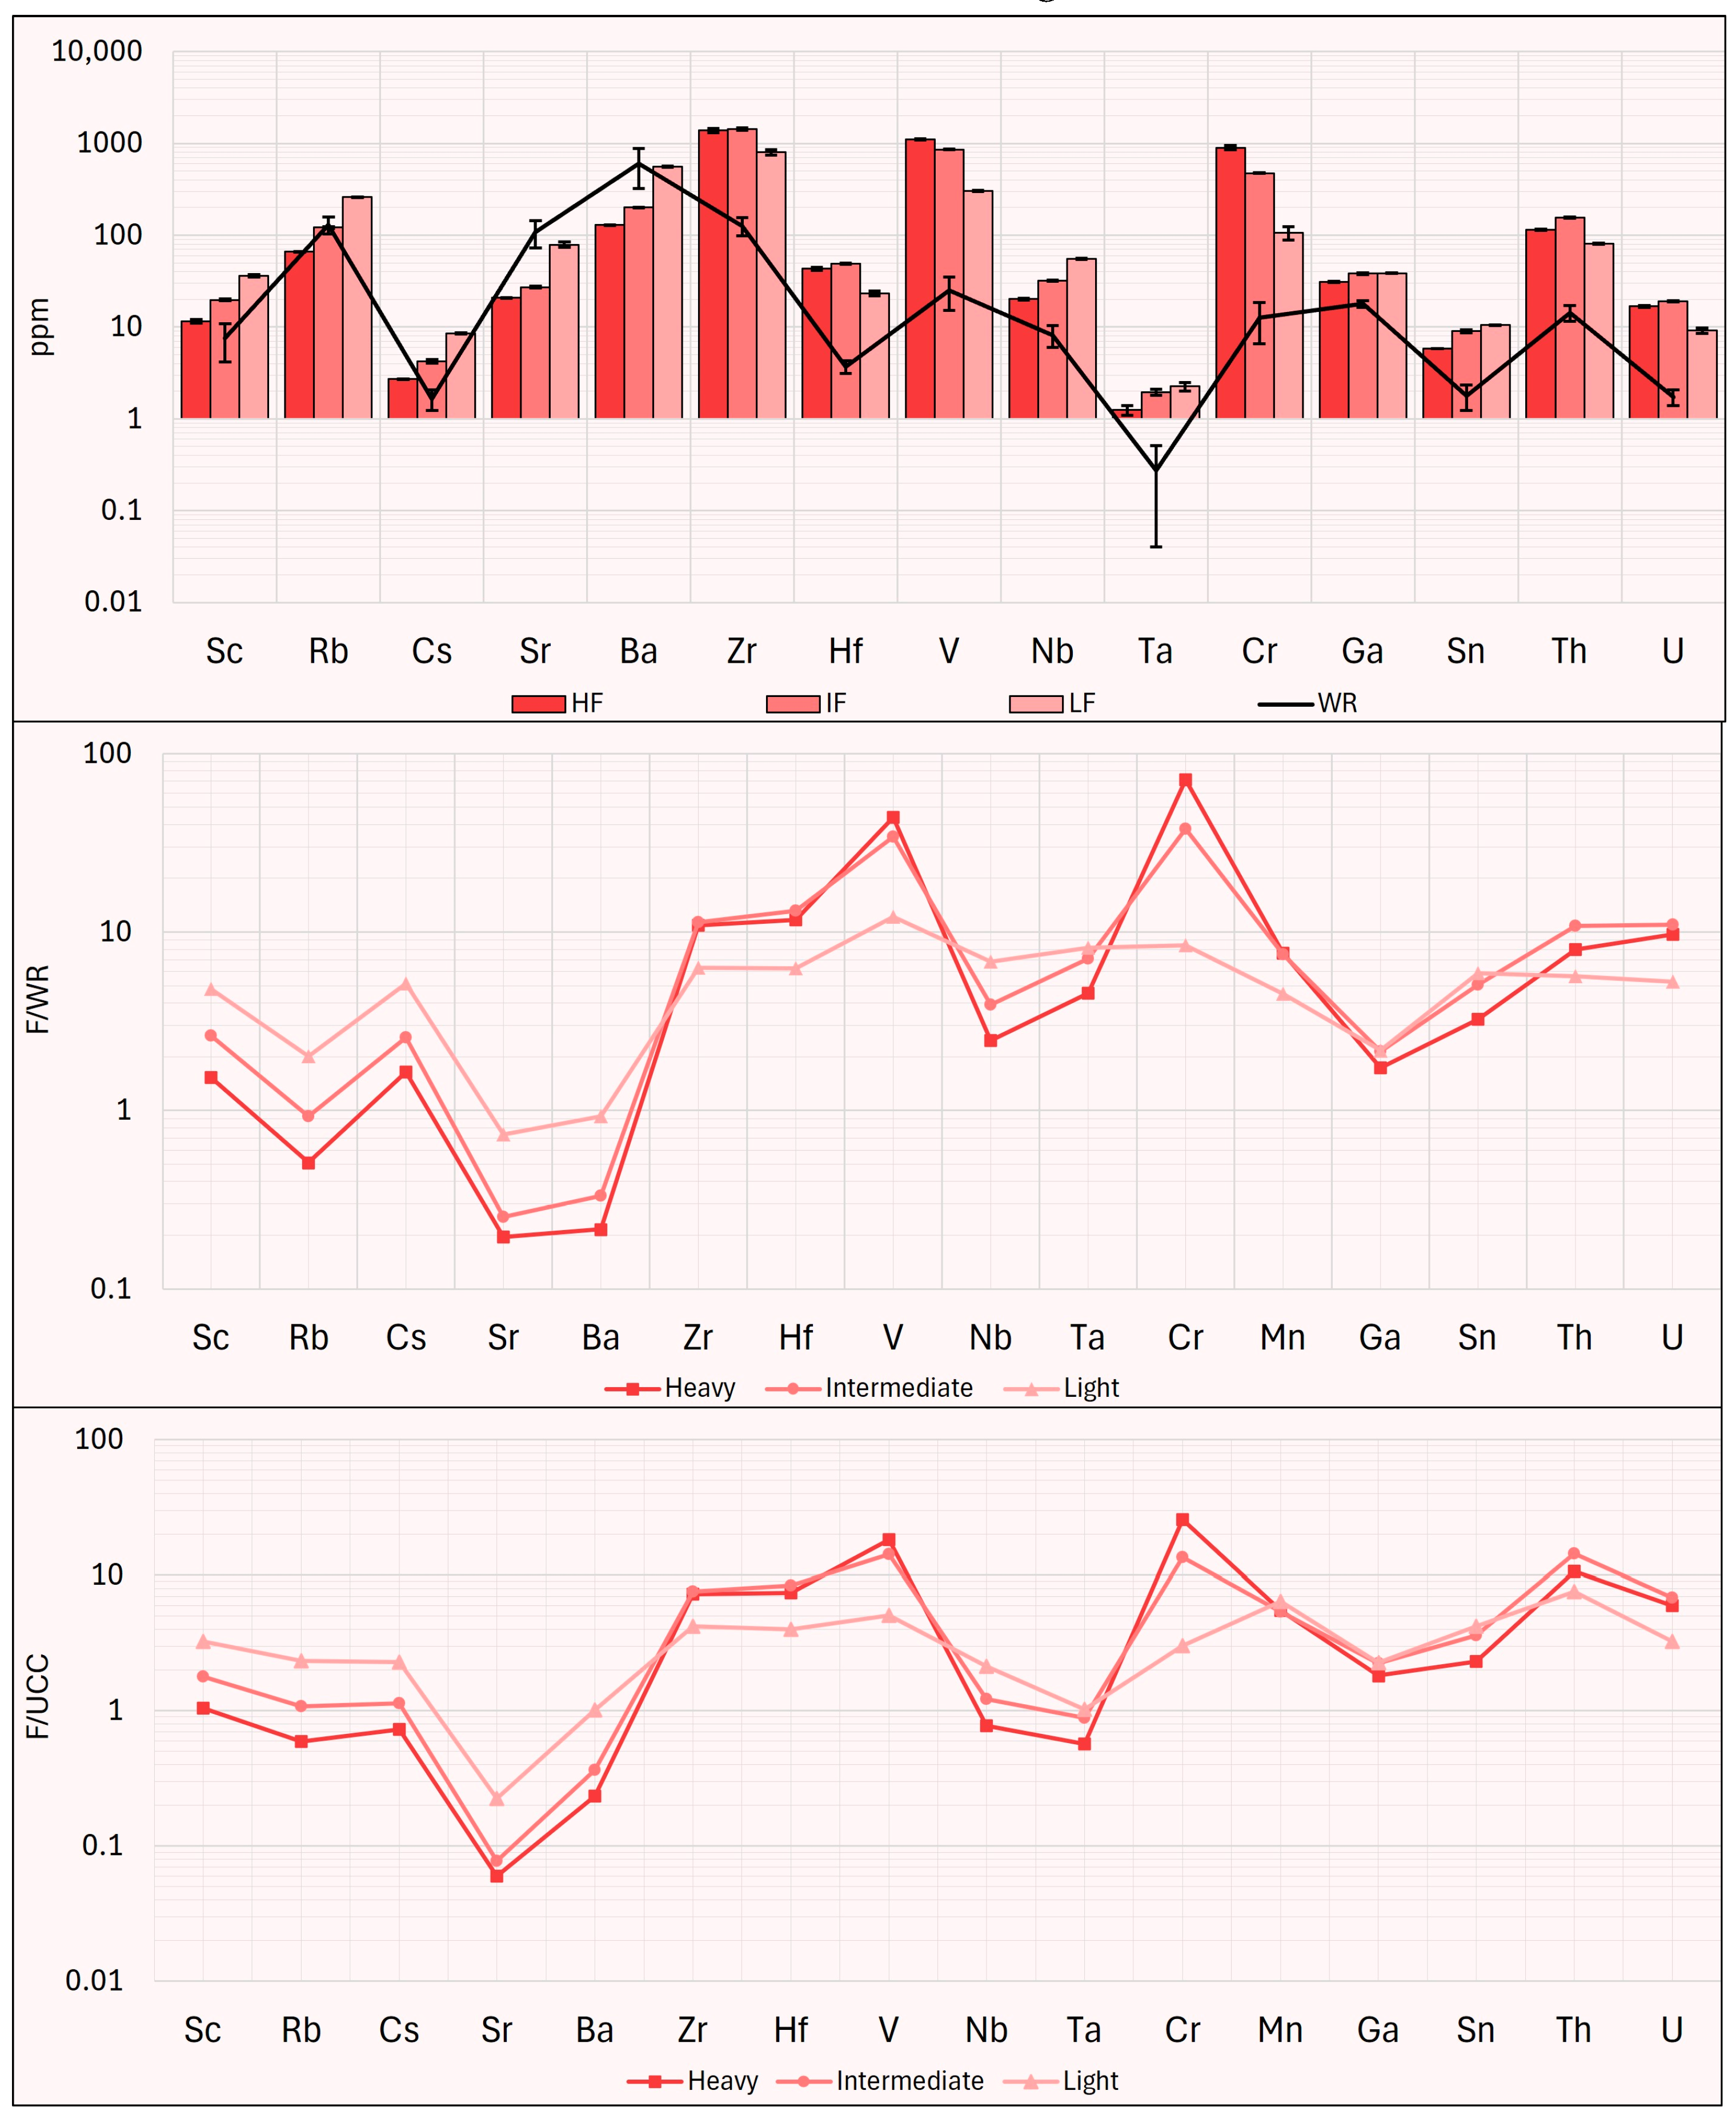
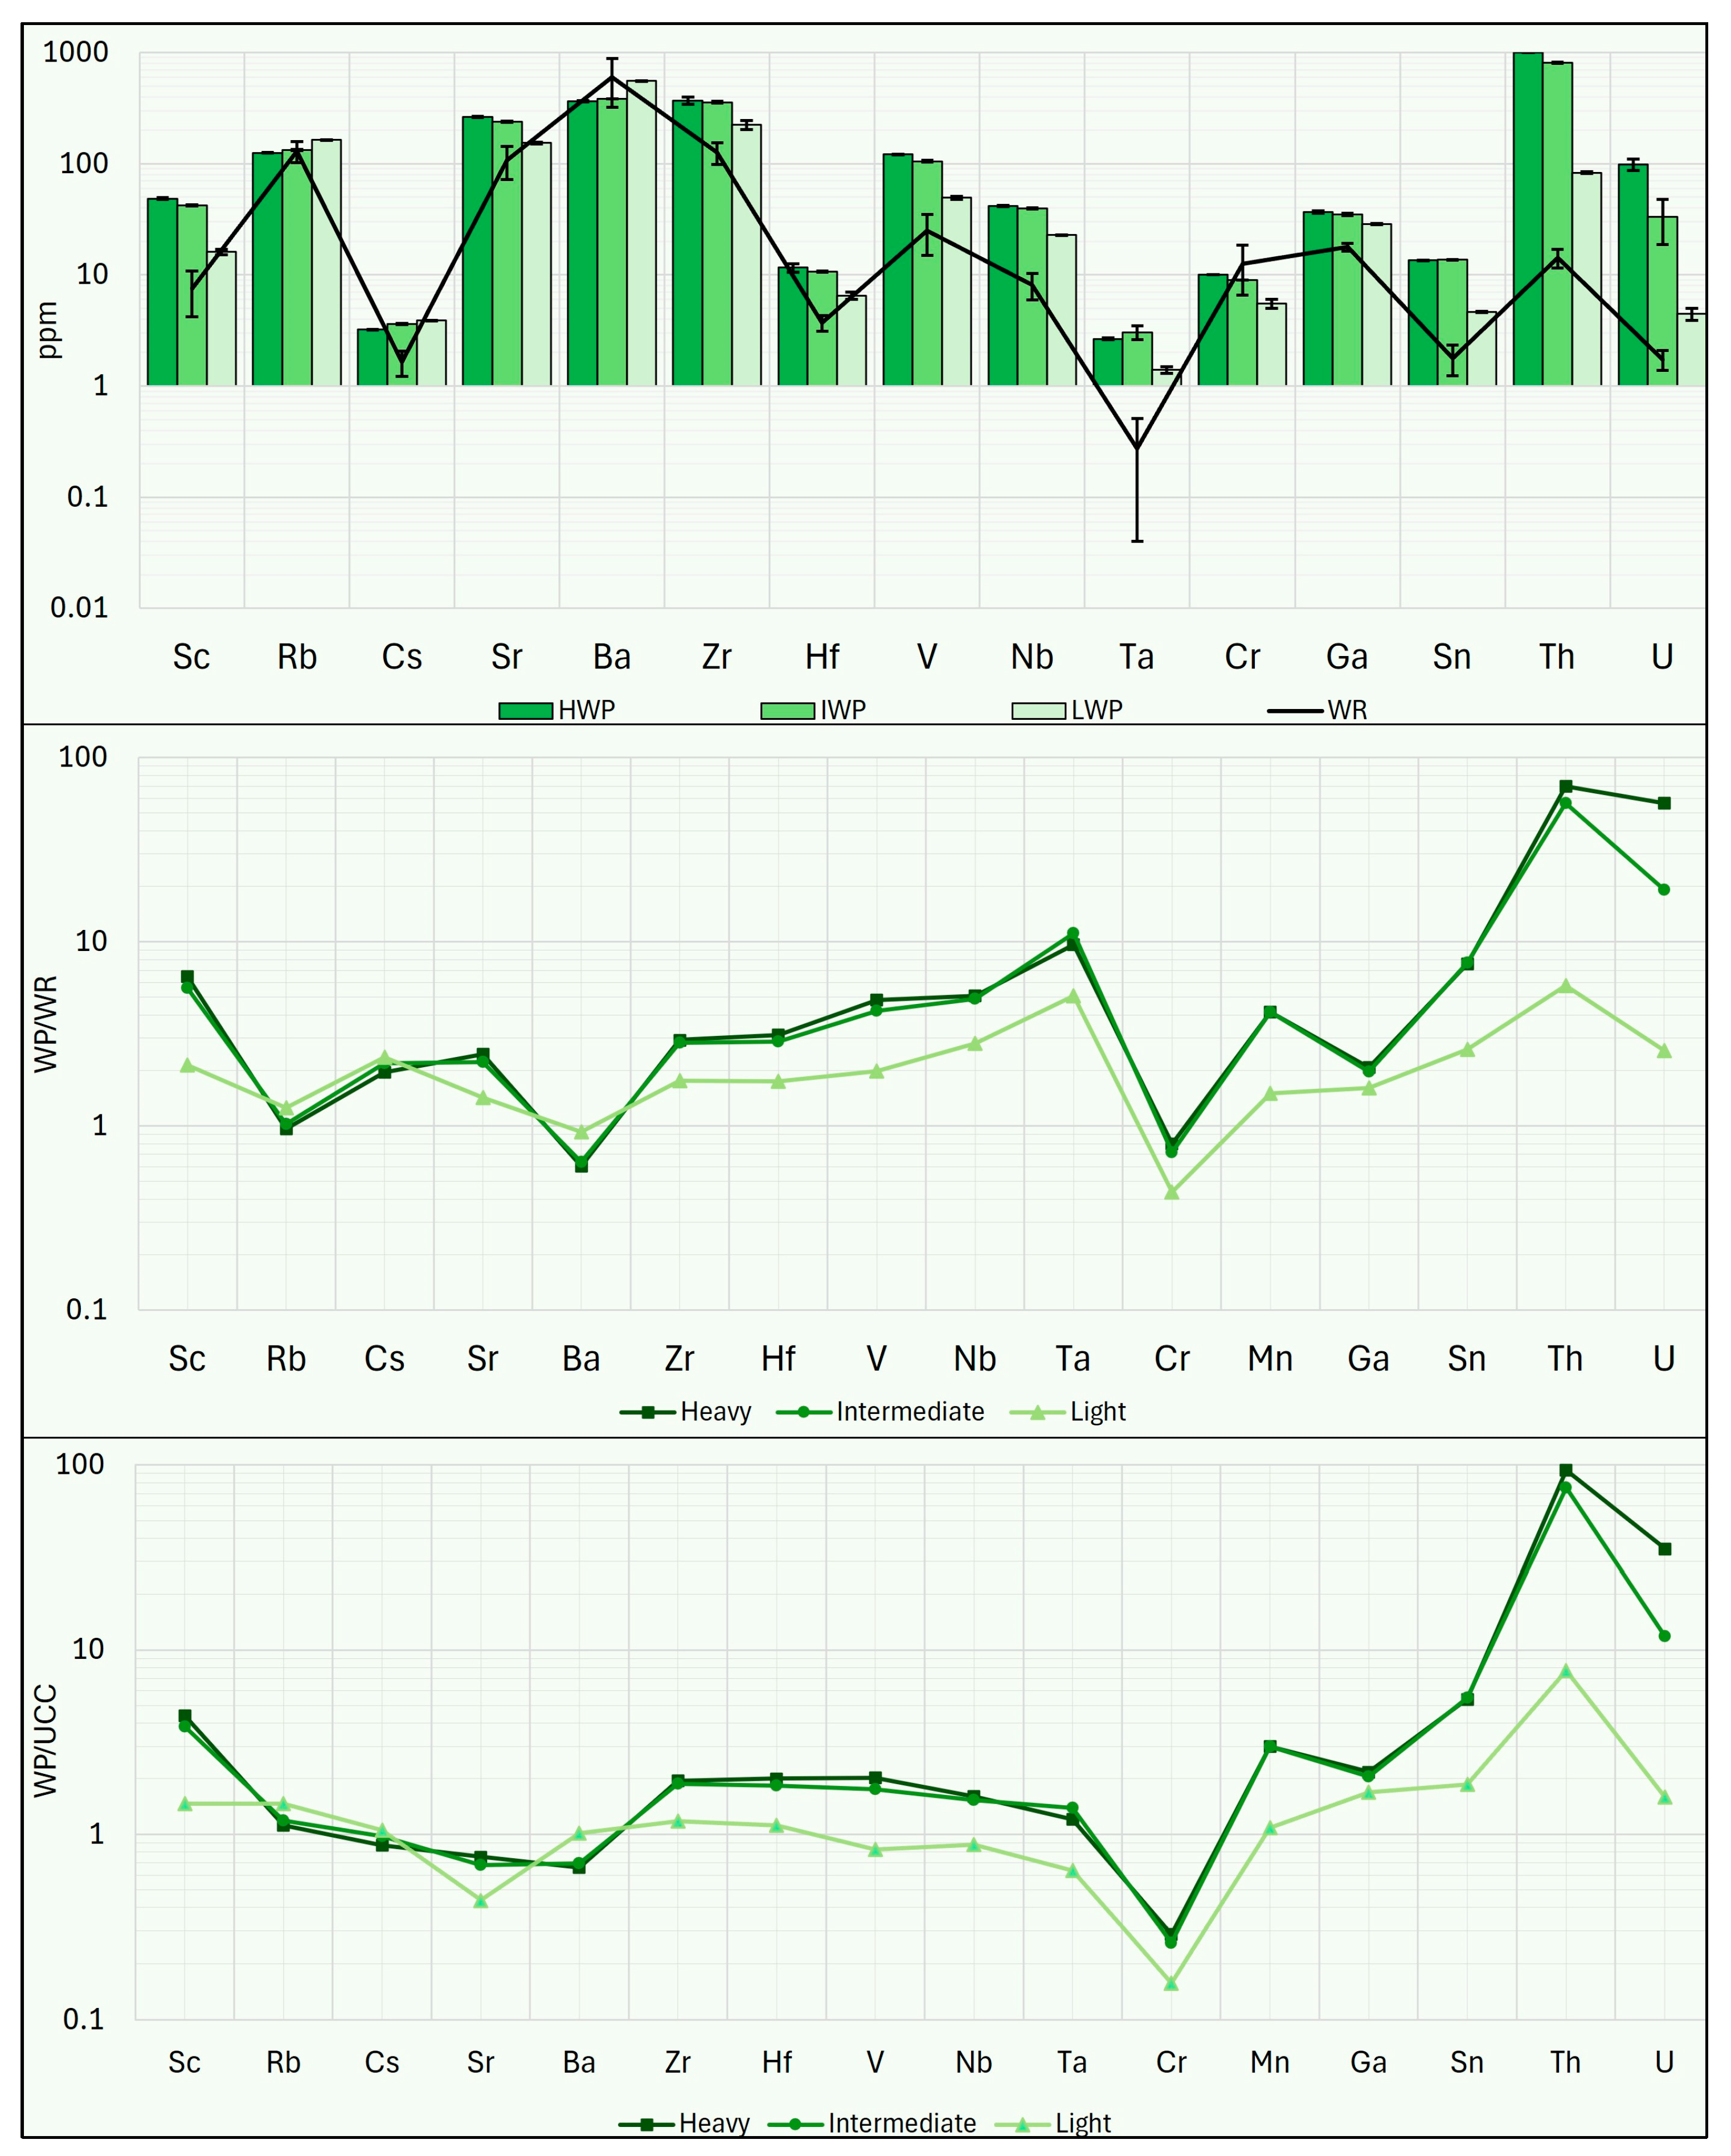
21], the fractions obtained through this process could still be promising for potential REEs recovery. It should also be noted that some of the obtained fractions, such as the highly and weakly paramagnetic ones, are characterized by Sc concentrations exceeding 60 ppm, the minimum threshold at which magmatic rocks can be considered as Sc deposits [60]. Additionally, some fractions, such as the HF, the IF, the LF, the HWP, and the IWP, include Ga concentrations exceeding 30 ppm, representing the minimum industrial requirement [61], while the highly paramagnetic fractions contain Ga concentrations above 50 ppm, which is the average Ga content in bauxites and zinc deposits from which this metal is extracted in different international localities [62].
Taking into consideration the method proposed by Zhao et al. [21], the potential market value of the CRMs content in the products obtained from this study is calculated. In the work of Zhao et al., this calculation is applied solely to REEs [21], while in this study, it is extended to include other CRMs for which concentration data were available. This calculation assumes that the potential market value of each sample is the total market price (Ptotal) of the selected CRMs recovered from the disposal of 1000 tons of EW. The calculation equation is as follows:
P t o t a l = K C R M   c w × 10 6 × P C R M
where KCRM is the recovery rate of each REEs in the waste; following [21], for the convenience of calculation, the recovery rate was assumed to be 100%. Cw is the concentration of single CRM in the examined samples (ppm), ∑Kcrm cw is the recoverable amount of CRMs per kg of EW; PCRM is the average market price (EUR/kg) in the form of metal (except Gd, Ho, Er, V, Nb in oxide form) during the six months before 20 October 2024. CRMs prices are reported in Table A1Appendix A.
As reported in Figure 16, the results of this calculation show that the HWP, the IWP, the HHP, and the IHP fractions have high market value (EUR >30 × 104); lower values are found in the LHP fraction (approximately EUR 23 × 104), while the IF and the LF fractions have market values exceeding EUR 10 × 104. All other fractions have market values below EUR 10 × 104, with the CP displaying the lowest market value (approximately EUR 4 × 10⁴).
Indeed, all these values refer to fractions that were processed in order to concentrate allanite from the granite EW. Referring to the work by Vaccaro et al. [22], it is found that the entire diamagnetic fraction obtained through this process holds significant potential for use in the ceramics and glass industries. Thus, if the granite EW is processed exclusively to obtain the quartz and feldspar fractions (excluding gravity separation and various magnetic separation steps), it could be reasonable to forego these concentration processes and instead perform single separation. In this scenario, reversing the purpose of this study, the magnetic material would become the byproduct of this process. Assuming this, the theoretical concentration of CRMs contained in the magnetic material—obtained without the various separation steps—is calculated using the following formula:
C R M V = C R M i × X i X i
where [CRM]V is the virtual concentration of the element considered (ppm), [CRM]i is the concentration of the element in fraction i, and Xi is the percentage abundance of fraction i. The percentage yields of the fractions obtained through the processing of granite waste are presented in Table A2 in Appendix A; the theoretical composition is reported in Table A3 in Appendix A.
Based on this theoretical composition, the market value of the magnetic fraction was then calculated using Equation (2). The results of this calculation indicate that this process could produce a magnetic fraction with a CRMs content of 2155 kg per 1000 tons, with a relatively high market value amounting to EUR 21 × 104.
Based on the estimated quantities of granite waste and the percentage yields obtained through the processing, the total stock quantity of each fraction is estimated. This calculation is performed using two scenarios: the most favourable scenario is calculated using the maximum yield values obtained for each fraction and a pile porosity of 5%; the least favourable scenario is calculated using the minimum yield values for each fraction and a pile porosity of 30%. Based on this, the total market value (MVtotal) for each fraction is then calculated using the following formula [21]:
MV t o t a l = W t o t a l i   ×   P C R M i
where W t o t a l i is the total stock quantity of material with fraction I, and P C R M i is the market value of CRMs within fraction i.
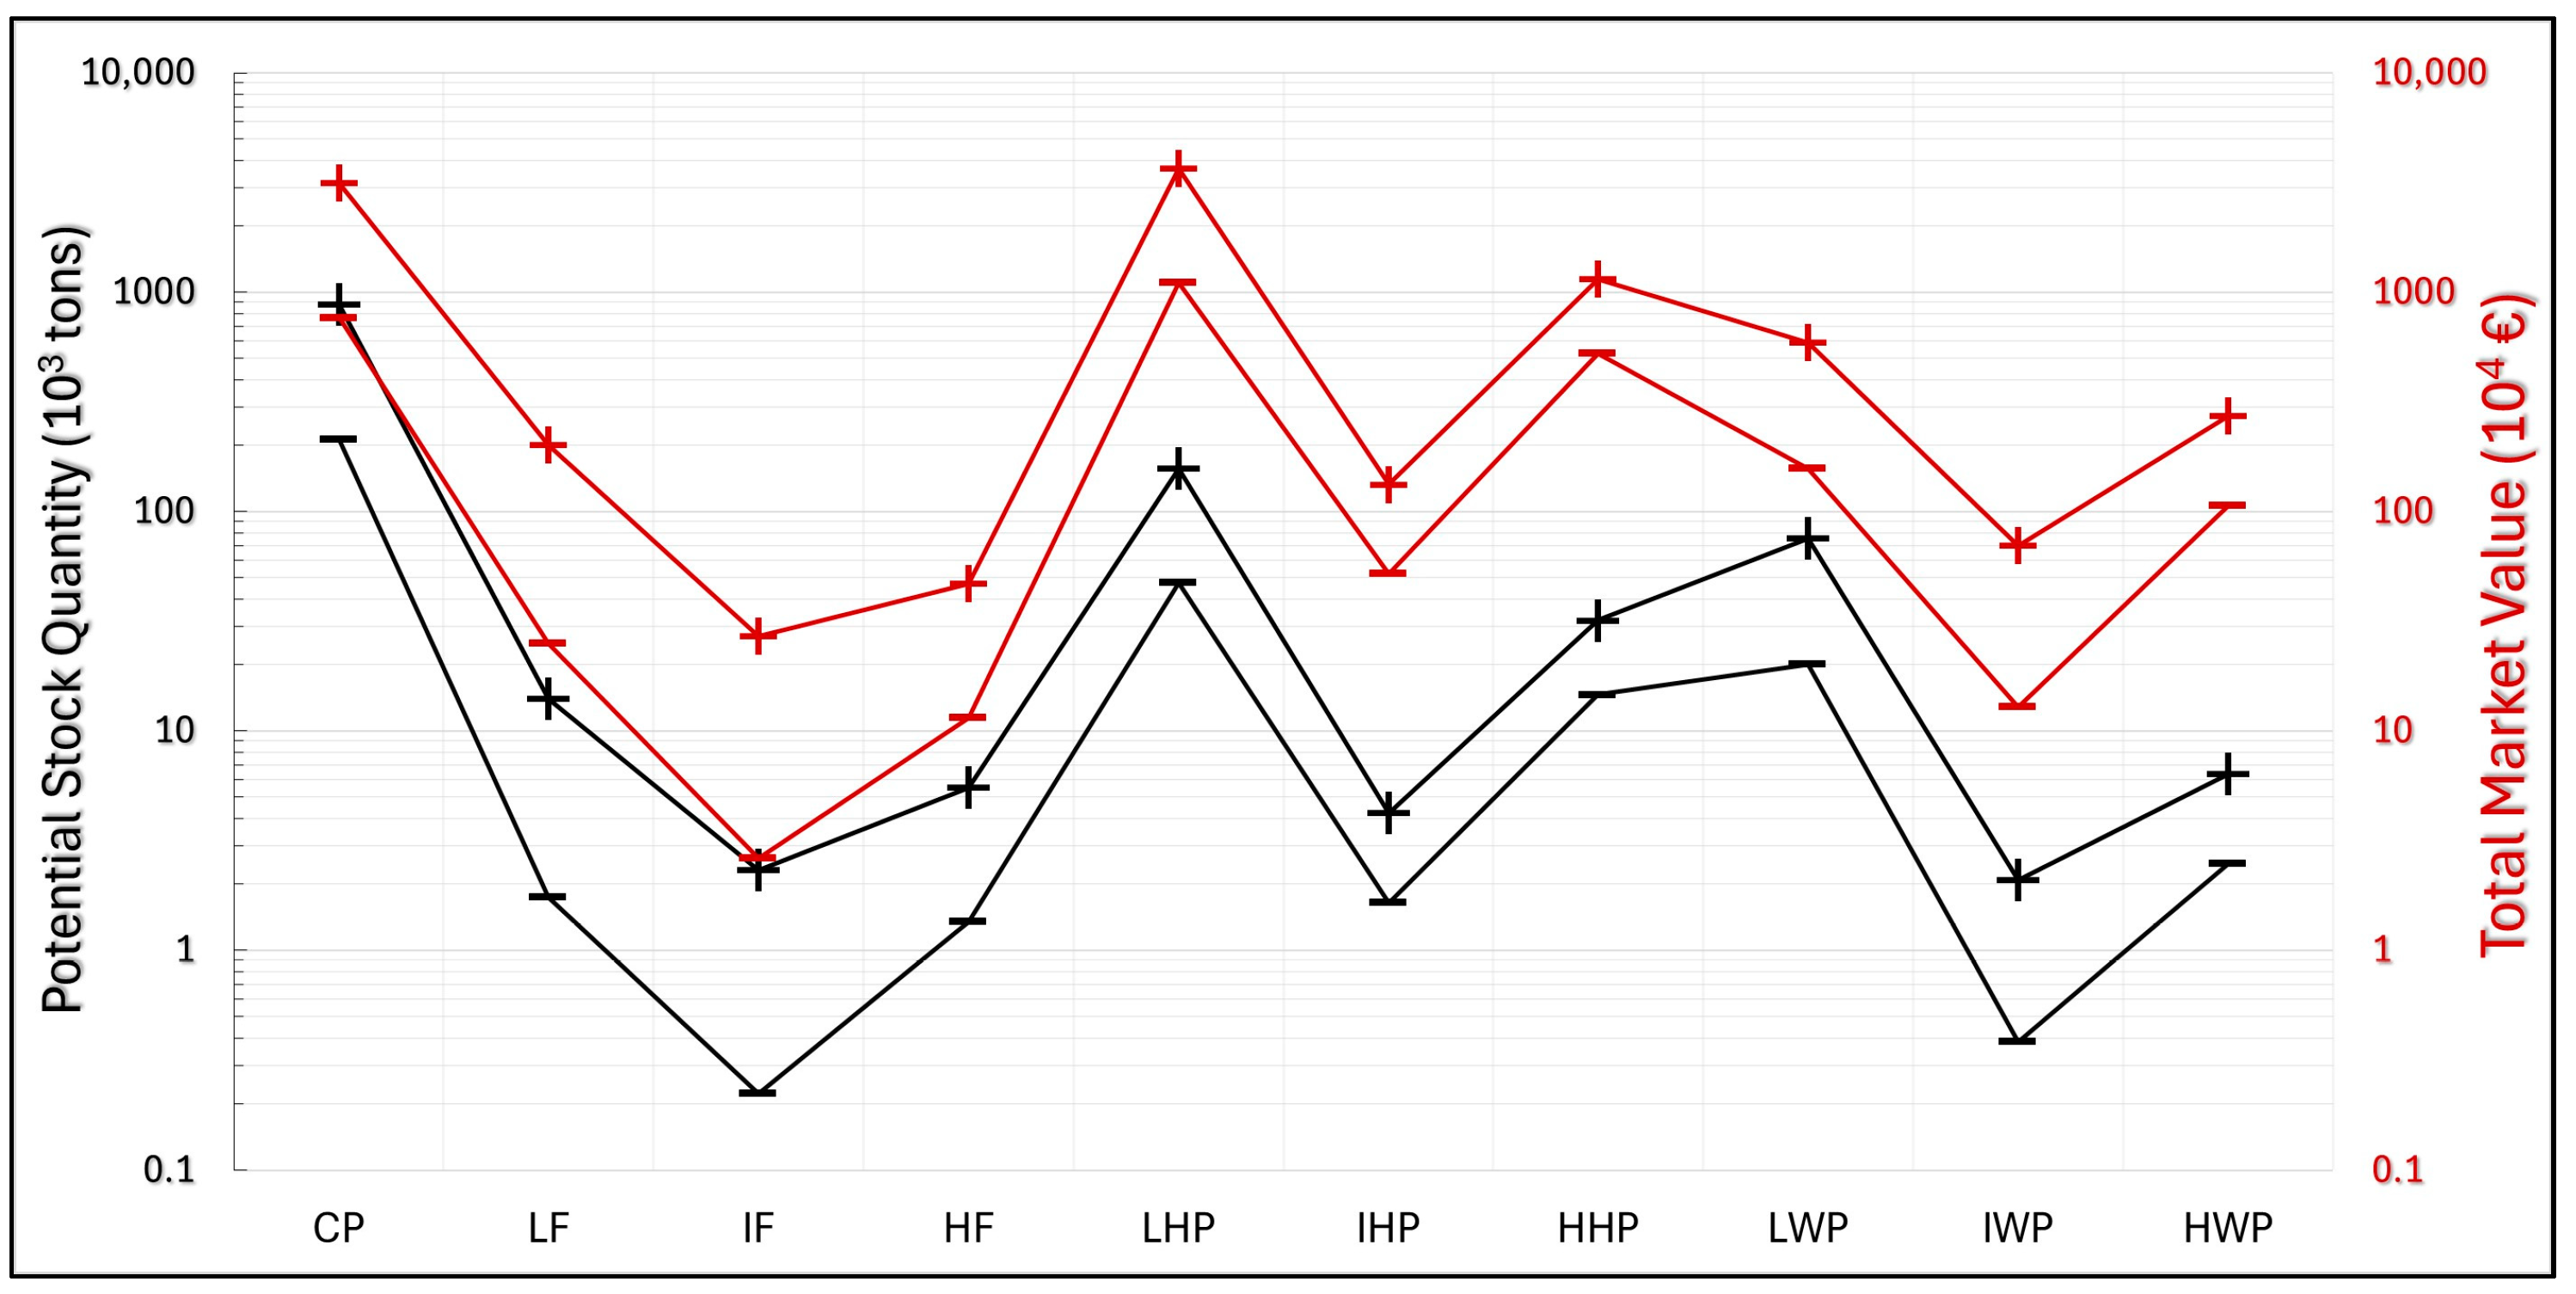
The results of these calculations (Figure 17) reveal that the CP, representing the most abundant fraction (213–877 × 103 tons), holds a very high total market value (EUR 766–3157 × 104). Overall, the fraction with the highest MVtotal is the LHP, in the range of EUR 1104–3668 × 104, and this is also the second most abundant fraction (47–157 × 103 tons). The HHP fraction, despite having a lower potential stock quantity (15–32 × 103 tons) than the LHP, presents a high MVtotal (EUR 527–1148 × 104).
Among the weakly paramagnetic fractions, IWP and HWP emerge as those with the highest absolute REEs content, but they are also characterized by lower stock quantities (IWP between 0.4 and 2.1 × 10³ tons and HWP between 2 and 6 × 10³ tons). Despite these low material quantities, the MVtotal values are relatively high, especially in HWP (EUR 106–272 × 104).
The ferromagnetic fractions all have stock quantities below 20 × 103 tons. The LF fraction, being the most abundant (2–14 × 103 tons), also has the highest MVtotal among them (EUR 25–202 × 104).
In this scenario, under the assumption that the processing of granite waste is limited to a single high-intensity magnetic separation step, bypassing gravity separation and focusing solely on isolating quartz and feldspar from the other fractions, the MVtotal of the resulting hypothetical magnetic fraction is calculated. For this calculation, an average yield value is used for the fraction obtained in the separation tests; thus, the best and worst scenarios refer only to the porosity of the EW piles. The results of the calculations suggest that this virtual fraction could range from 158 to 215 × 103 tons, with an MVtotal varying in the range of EUR 3367–4569 × 104.
Assuming that all the CRMs investigated in this study are recovered from EW granite, the market value could range from a minimum of EUR 2763 × 104 to a maximum of EUR 9312 × 104.
This work does not explore potential steps beyond those previously shown. The recovery of CRMs from granite EW represents a significant challenge. As previously noted, current knowledge on REEs’ beneficiation from allanite is quite limited. It will therefore be essential to conduct focused studies to identify possible pathways for the beneficiation of REEs and CRM recovery, in general, from the obtained materials. Furthermore, the results presented in this study refer to laboratory-scale investigations, whereas data from experiments conducted at a semi-industrial scale will be necessary. In addition to other challenges, the high quantities of U and especially Th in the obtained materials could pose significant obstacles in subsequent beneficiation steps for the recovery of CRMs. Future research will need to address this factor carefully to optimize processing methods and mitigate potential complications associated with elevated Th and U concentrations. On the other hand, in recent years, there has been growing interest in developing thorium-based nuclear energy. Although there are currently no commercial-scale plants, there is potential for this to change in the future [63,64].
Despite all these limitations, the obtained results are promising, especially at a time when knowledge of potential alternative sources of CRMs is crucial. Furthermore, with the enforcement of the CRMA, it is likely that EU investments in research in this field will increase, encouraging companies and research institutions to expand their understanding across all aspects investigated in this work.
The present case study focuses on a single quarry, while in the Buddusò area alone, there are numerous granite quarries in similar conditions, containing large quantities of EW. In this context, the creation of a granite waste processing hub in the Buddusò area could hold significant economic potential. Therefore, it would be advisable to extend studies to other quarries in the area, both in terms of volume estimation and material characterization, to gather information that could support the assessment of this opportunity.

5. Conclusions

This study highlights the significant quantities of granite waste in a quarry, with a notable difference between the best-case (2.56 × 10⁶ tons) and worst-case (1.88 × 10⁶ tons) scenarios. However, the results are limited by the heterogeneity of the granite waste and the presence of vegetation, as well as the use of outdated surveys from 2013. Updated studies are needed for more accurate volume estimates.
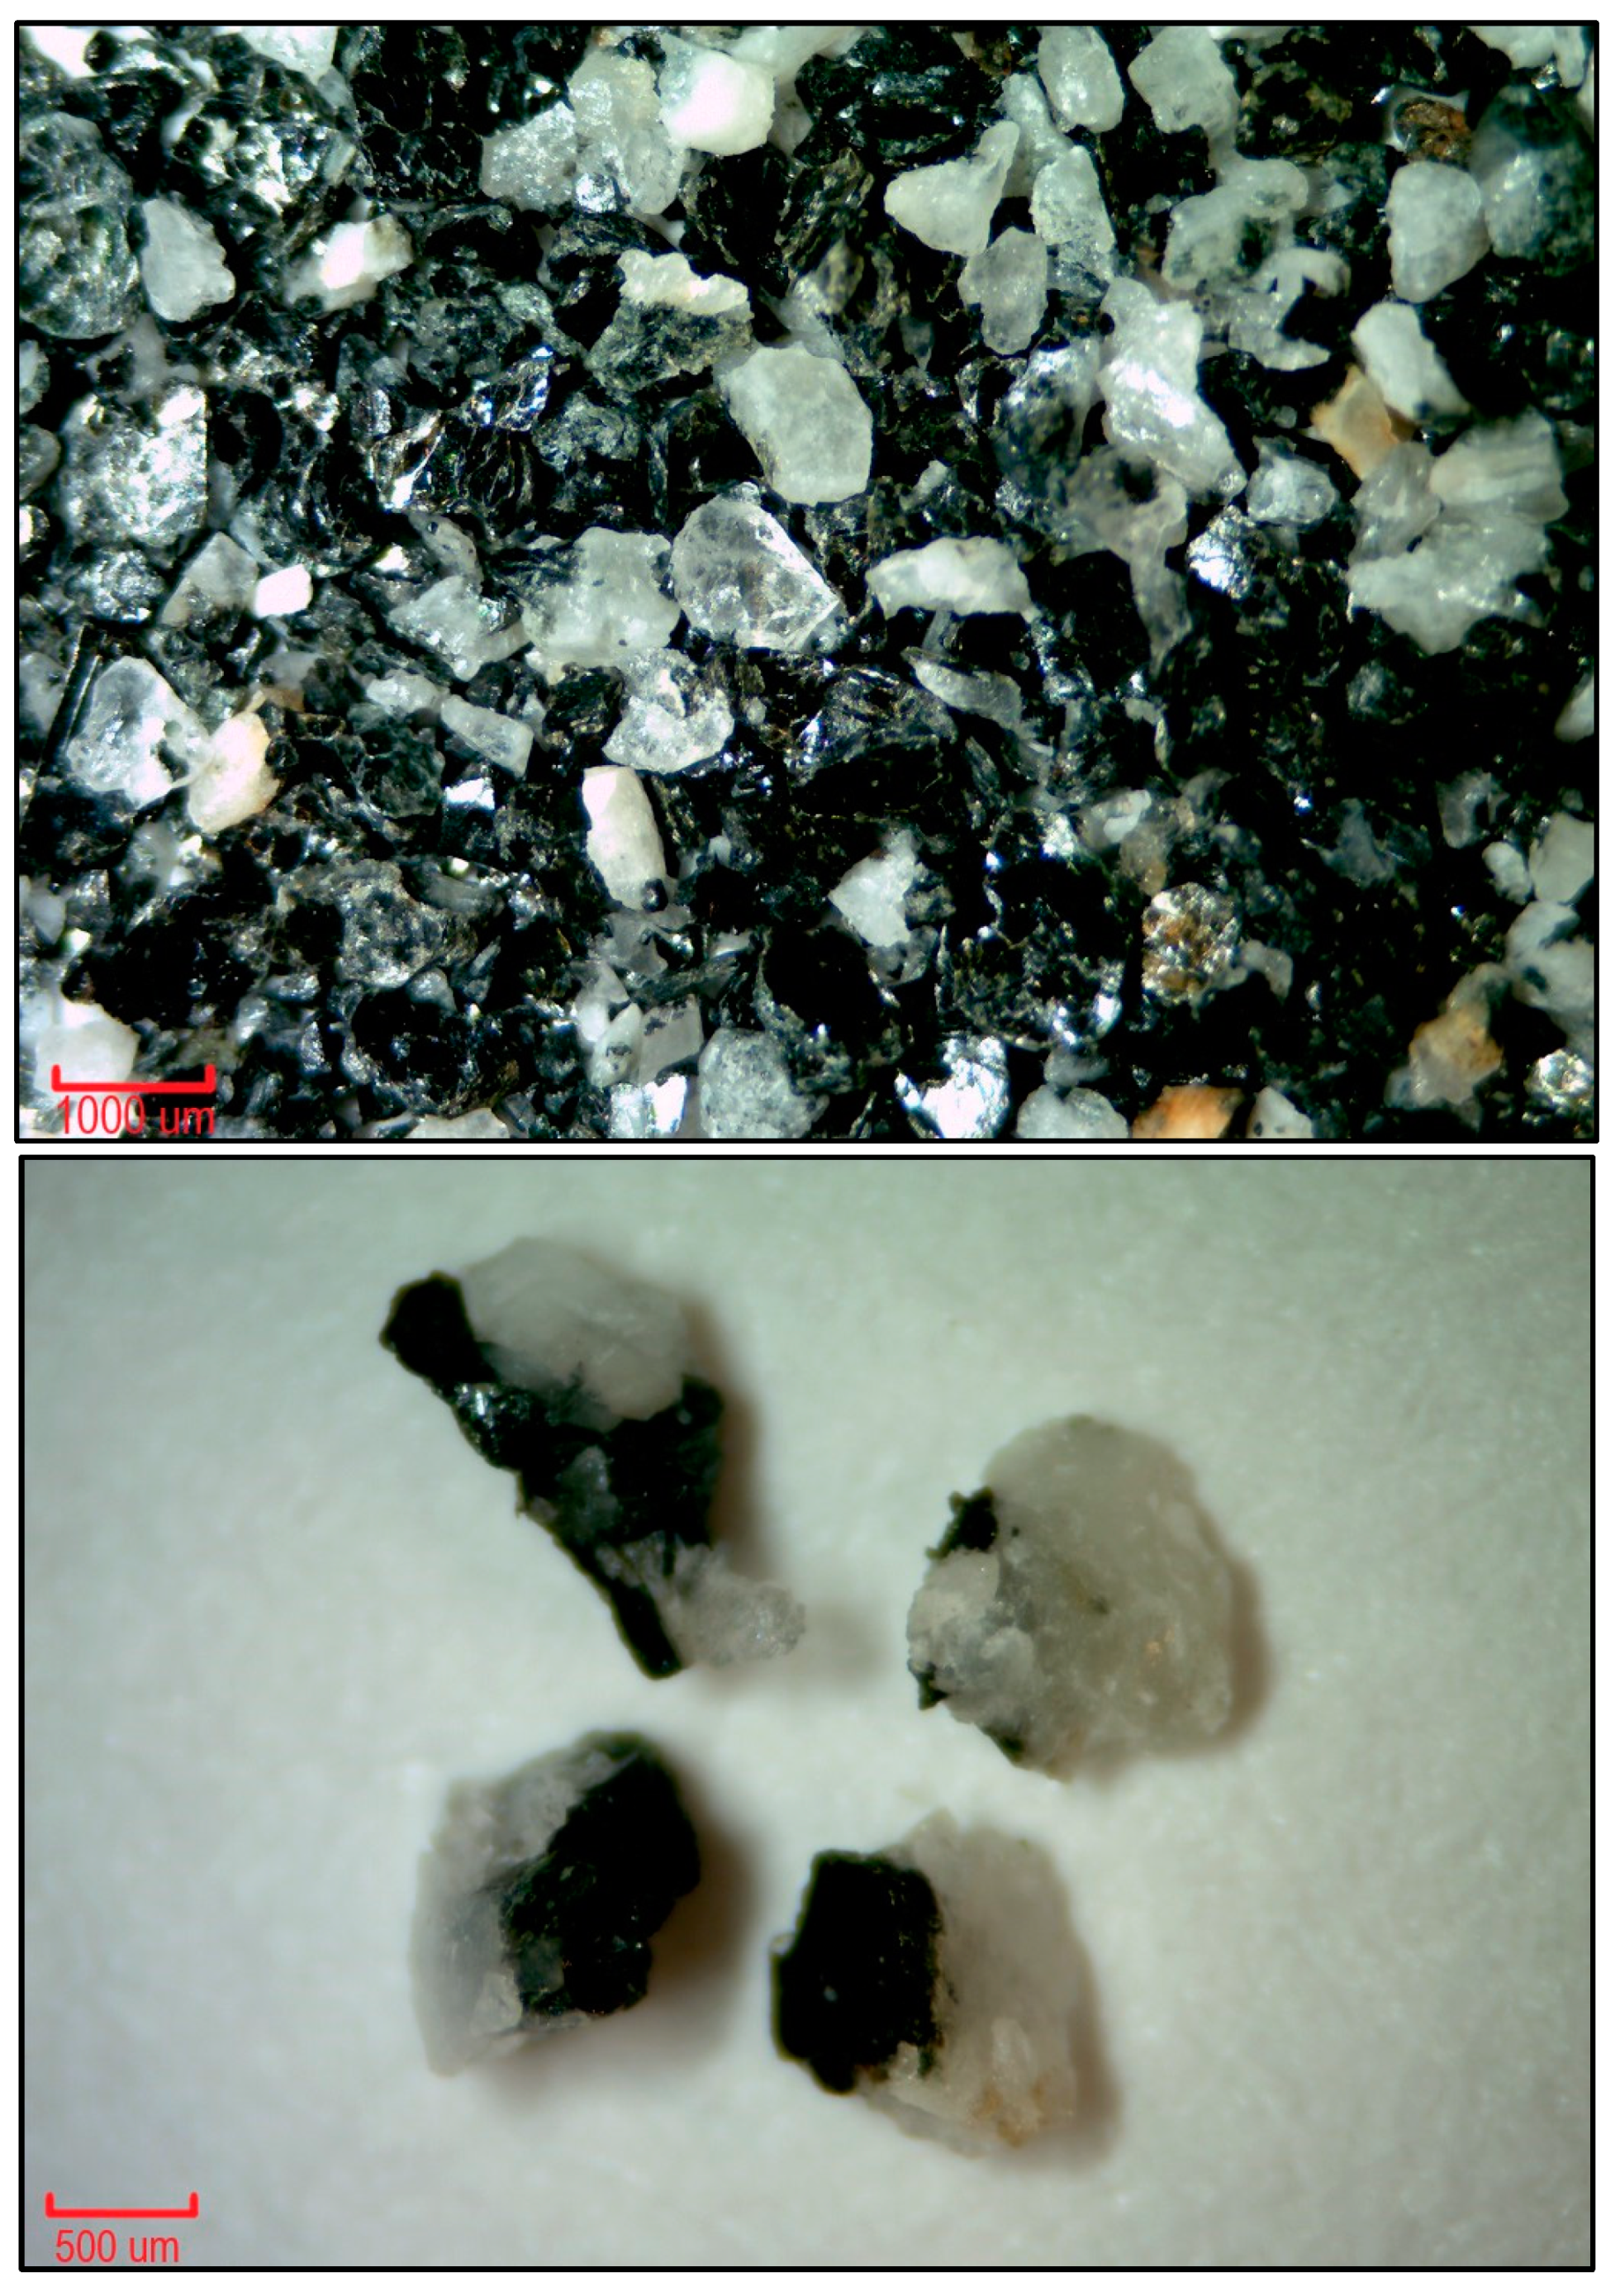
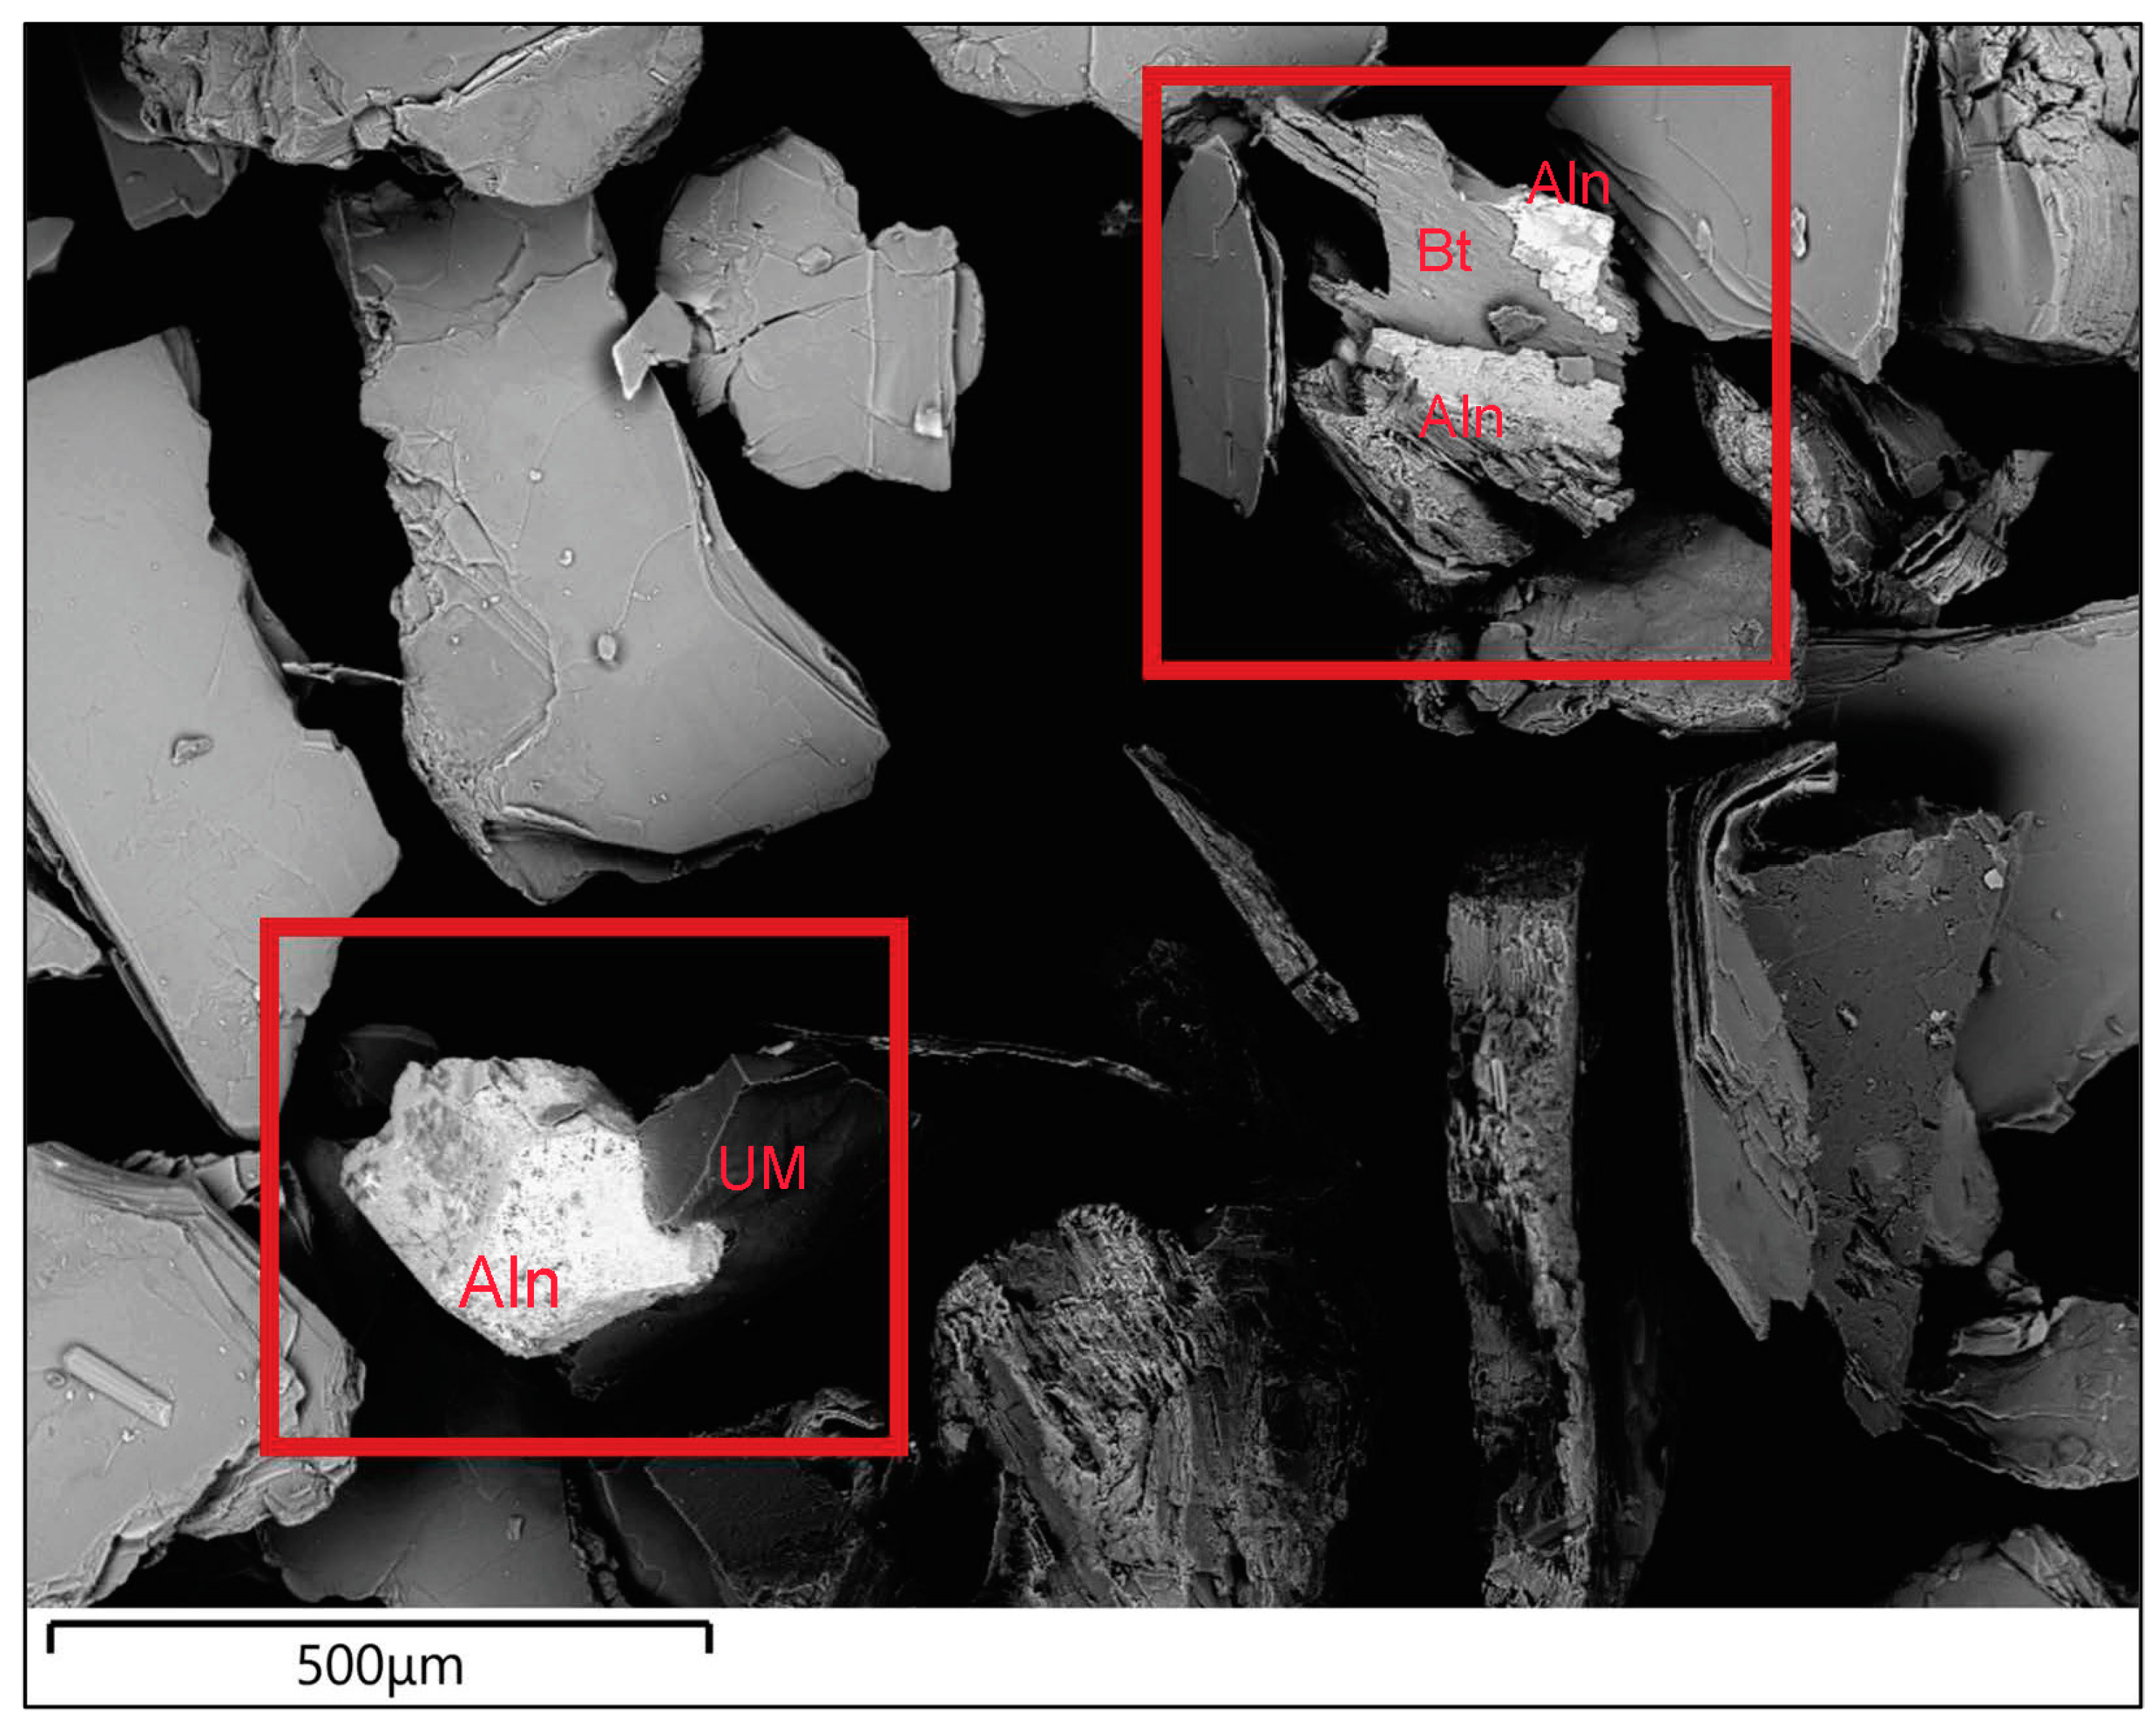
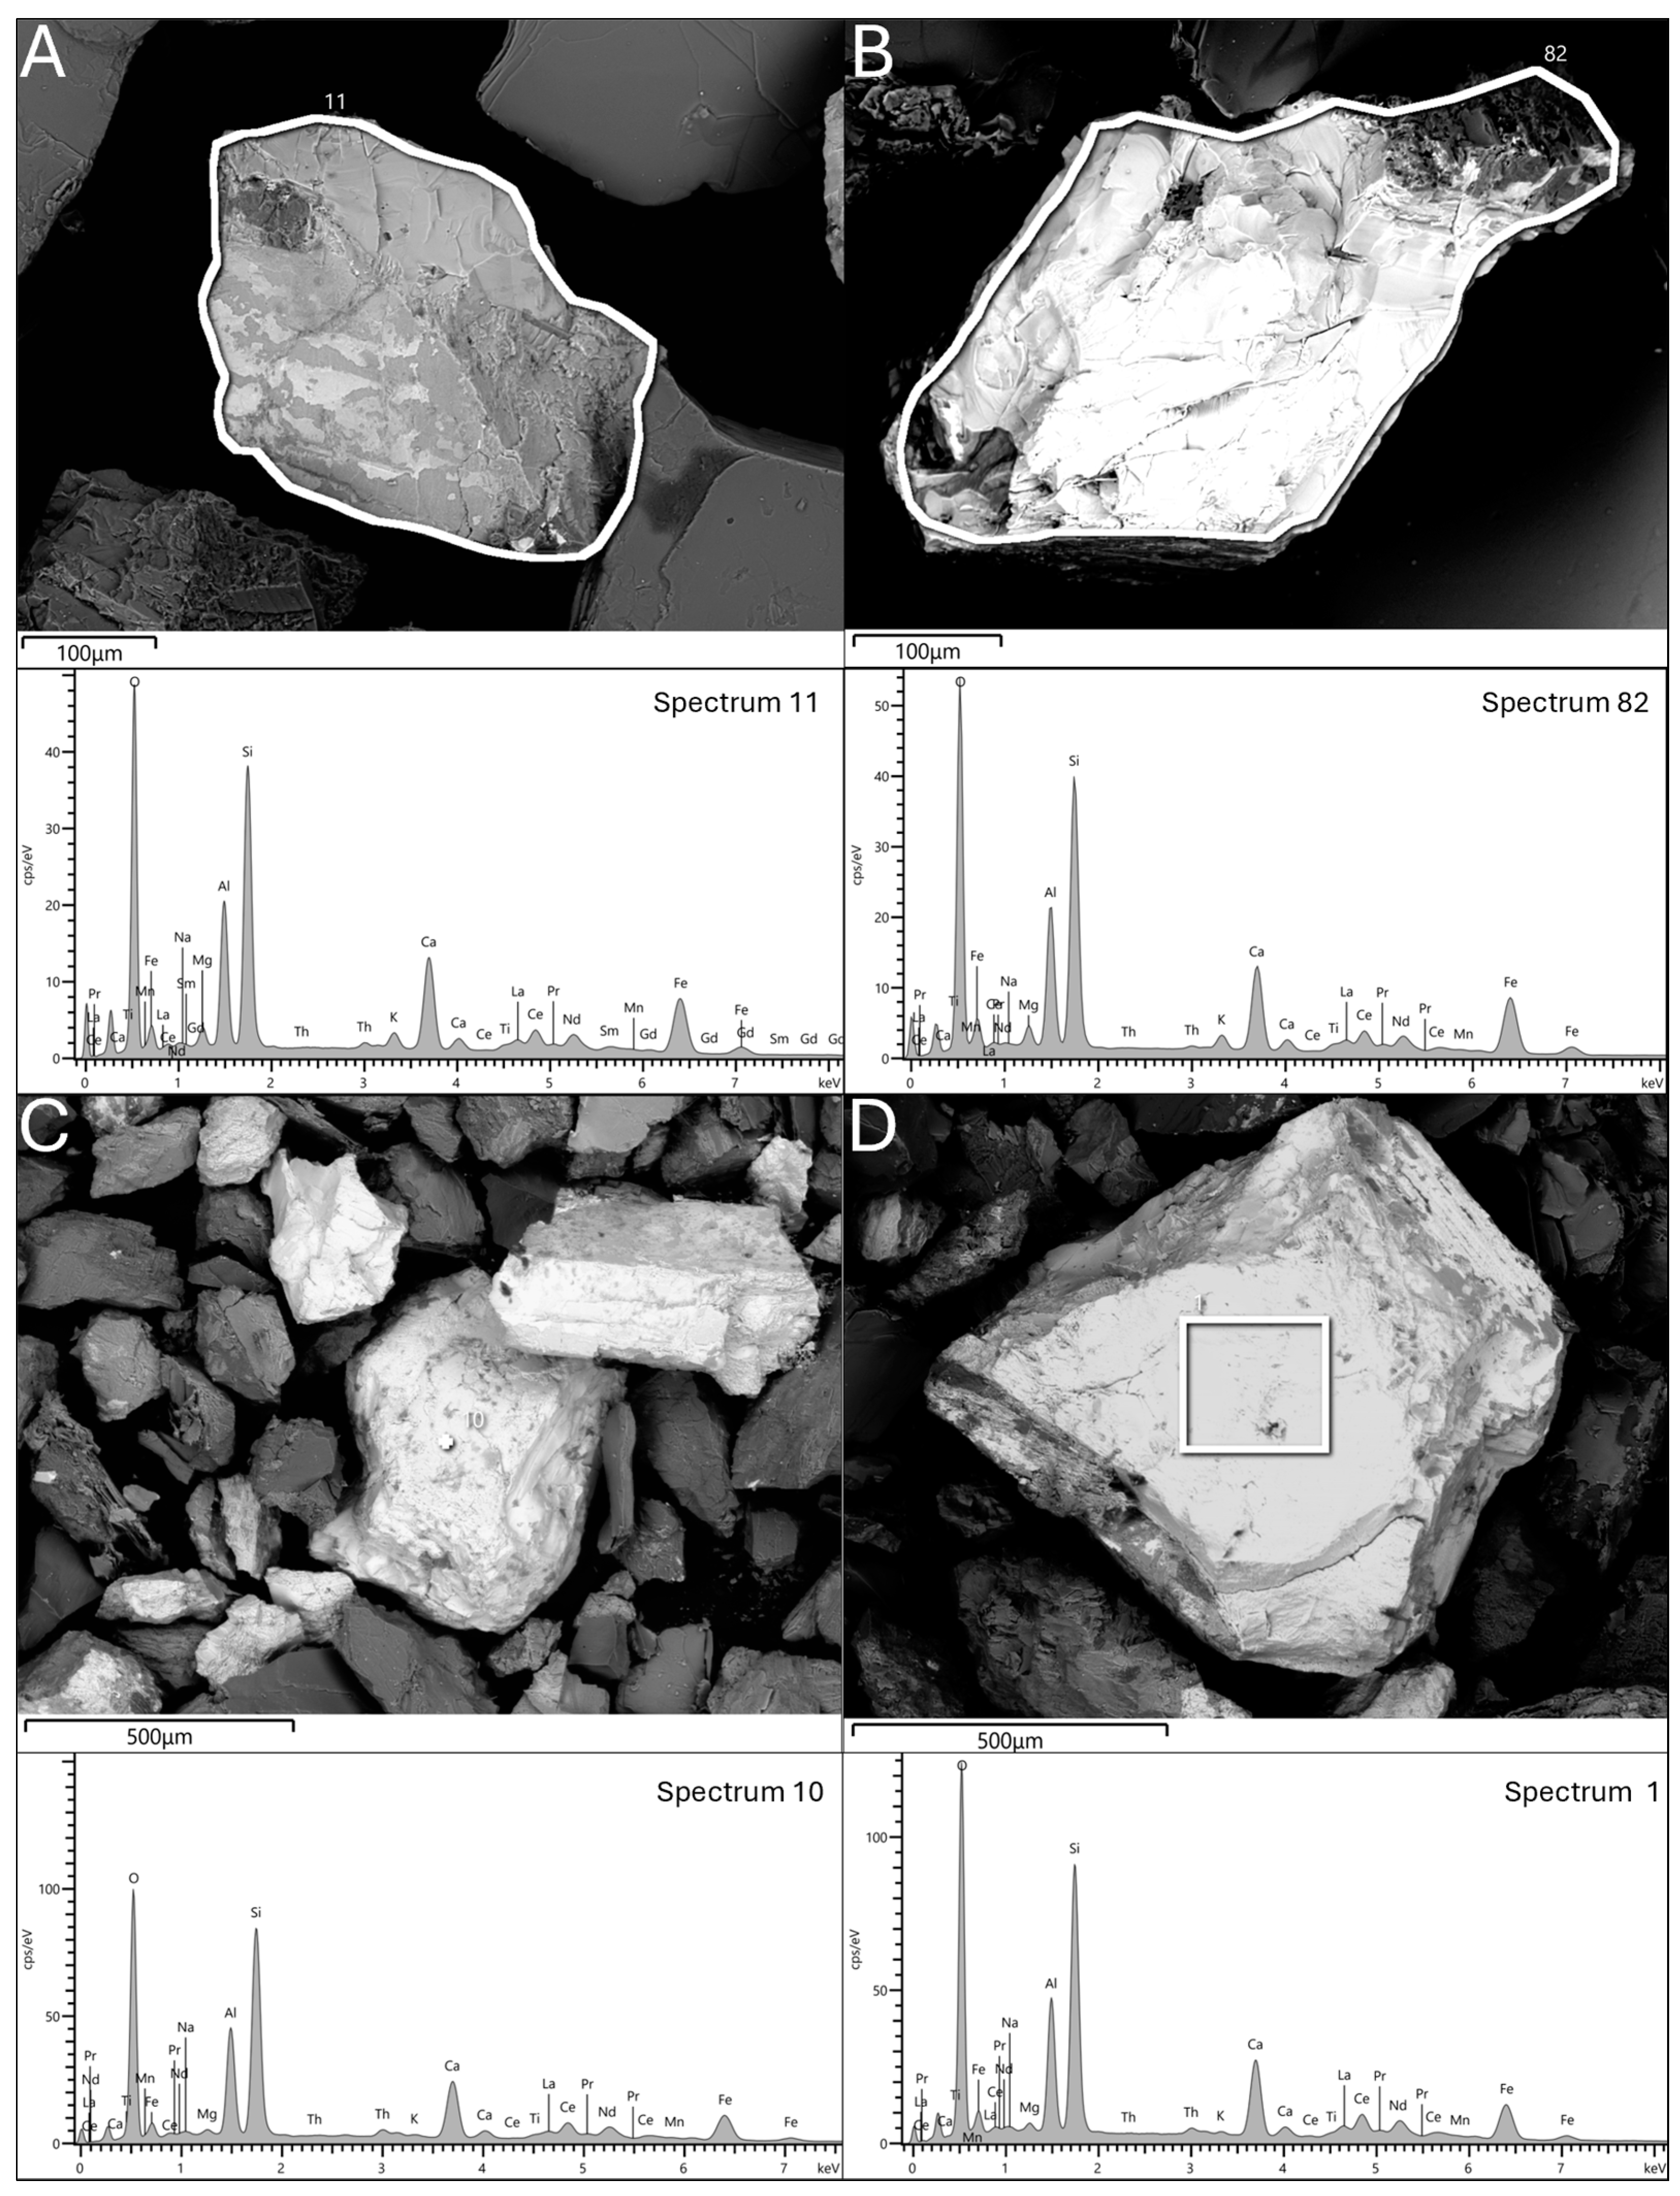
The presence of allanite, an REE-bearing epidote, in the granite EW, is confirmed by the SEM-EDS investigations. Allanite includes high concentrations of LREEs (>16 wt.%) but remains underutilized for REEs extraction due to the historical preference for other minerals. As demand for CRMs rises, research into allanite could become more relevant, supporting the EU’s CRMA objectives.
The gravity and magnetic separation tests demonstrate the potential for enriching fractions with CRMs, especially LREEs, from paramagnetic fractions. However, the maximum particle size of 850 µm should be reduced to improve separation efficiency, as some fractions contained polymineralic grains. Despite low outlook coefficients, the REEs, Sc, and Ga concentrations in these fractions suggest promising recovery potential. If all the CRMs were to be recovered, the market value could range from EUR 2.76 × 10⁴ to EUR 9.31 × 10⁴. The crushing powders, though untested, may also have high market value. Additionally, alternative approaches, such as single magnetic separation for diamagnetic quartz–feldspar concentrates, could yield valuable byproducts.
Although CRMs recovery presents challenges, particularly due to limited knowledge of beneficiation techniques and potential radiogenic elements, it remains a viable goal. Further studies on granite waste in Buddusò and the surrounding areas are needed. Establishing a treatment hub for granite waste could be a key resource for the region and to support the EU’s needs.

Supplementary Materials

The following supporting information can be downloaded at: www.mdpi.com/article/10.3390/resources14020024/s1, Table S1: Mean (±SD) trace elements abundances (±SD) of the whole rock (12 analyzed samples) and crushing powders (3 analyzed samples); Table S2: Mean (±SD) trace elements abundances (±SD) of the ferromagnetic fractions (2 analyses performed in replicate for each mixed sub-sample); Table S3: Mean (±SD) concentrations of REEs in the weakly paramagnetic fractions, based on duplicate analyses of each mixed sub-sample. For reference, REEs concentrations for WR are presented, as reported by Vaccaro et al. [22]; Table S4: Mean (±SD) trace elements abundances (±SD) of the highly paramagnetic fractions (8 analyzed sub-samples for HHP fraction; 2 analyses performed in replicate for each IHP and LHP mixed sub-sample); Table S5: Mean (±SD) concentrations of REEs in the highly paramagnetic fractions, based on eight analyzed HHP sub-samples and duplicate analyses of other mixed sub-samples. For reference, REEs concentrations for WR are presented, as reported by Vaccaro et al. [22]; Table S6: Mean (±SD) trace elements abundances of the weakly paramagnetic fractions (2 analyses performed in replicate for each mixed sub-sample); Table S7: Mean (±SD) concentrations of REEs in the weakly paramagnetic fractions, based on duplicate analyses of each mixed sub-sample. For reference, REEs concentrations for WR are presented, as reported by Vaccaro et al. [22].

Author Contributions

Conceptualization: A.A., E.M. and C.V.; methodology: A.A., E.M. and C.V.; validation: A.A., E.M. and C.V.; formal analysis: A.A.; investigation: A.A. and E.M.; resources: C.V.; data curation: A.A.; writing—original draft preparation: A.A.; writing—review and editing: A.A., E.M. and C.V.; supervision: A.A. and C.V. All authors have read and agreed to the published version of the manuscript.

Funding

This research was funded by (a) NOP Research and Innovation 2014-2020, ESF REACT-EU–ACTION IV.5 PhD Programmes on green topics, grant number F71B21005760007; (b) LIFE REGS II–LIFE19 ENV/IT/000373-CUP F79C20000330006.

Data Availability Statement

The raw data supporting the conclusions of this article will be made available by the authors upon request.

Acknowledgments

The authors extend their gratitude to Renzo Tassinari of the Department of Physics and Earth Sciences at the University of Ferrara for his invaluable assistance with the WD-XRF analysis. The authors also thank the SGA Graniti-Graniti Soro (https://www.granitisoro.com/ (accessed on 2 December 2024) company for providing the necessary materials.

Conflicts of Interest

The authors declare no conflicts of interest. The funders had no role in the design of the study; in the collection, analyses, or interpretation of data; in the writing of the manuscript; or in the decision to publish the results.

Abbreviations

ASLabove sea level
CRMscritical raw materials
CRMACritical Raw Materials Act
DEMdigital elevation model
DSMdigital surface model
EDSenergy dispersive X-ray spectroscopy
EUEuropean Union
EWextractive waste
EXWex work
FOBfree on board
HFheavy ferromagnetic
HHPheavy highly paramagnetic
HREEsheavy rare-earth elements
HREOsheavy rare-earth oxides
HWPheavy weakly paramagnetic
IFintermediate ferromagnetic
IHPintermediate highly paramagnetic
IWPintermediate weakly paramagnetic
LFlight ferromagnetic
LHPlight highly paramagnetic
LREEslight rare-earth elements
LOIloss on ignition
LWPlight weakly paramagnetic
REEsrare-earth elements
RMraw materials
RMIraw materials initiative
SEMscanning electron microscope

Appendix A

Table A1. Market price of CRMs. FOB: free on board; EXW: ex works.
MetalQuality OriginPrice—EUR/kg
Y>99.90%FOB24.90
La>99.00%FOB3.01
Ce>99.00%FOB3.30
Pr>99.50%FOB66.18
Nd>99.00%FOB65.63
Sm>99.50%FOB9.52
Eu>99.50%FOB214.71
Gd2O3>99.99%EXW25.53
Tb>99.90%FOB888.88
Dy>99.50%FOB288.47
Ho2O3>99.50%EXW65.34
Er2O3> 99.00%FOB39.52
Yb>99.99%EXW12.12
Lu>99.99%China670.68
Sc>99.99 %EXW2760.6
V2O5Flake >98.00%EXW9.39
Nb2O5>99.99%FOB51.46
Ta>99.95%FOB 266.41
Ga>99.99%FOB333.02
Table A2. Percentage yield of the fractions obtained through the processing of the granite EW.
Process Yield (%)MeanSDMinMax
CP21.597.6911.3034.31
LF0.360.160.090.55
IF0.040.020.010.09
HF0.170.050.070.22
LHP4.571.092.526.16
IHP0.120.030.090.16
HHP1.000.170.781.25
LWP1.900.531.072.95
IWP0.050.020.020.08
HWP0.210.040.130.25
Table A3. Composition of the virtual magnetic fraction, obtained in the hypothesis of solely magnetic separation for the separation of diamagnetic (quartz–feldspar) material.
Virtual
Magnetic Fraction
ppm
Y78
La375
Ce756
Pr85
Nd286
Sm45
Eu1.6
Gd28
Tb3.5
Dy17
Ho3
Er7.6
Yb6.9
Lu1.1
Sc53
V224
Nb89
Ta5
Ga49

References

  1. Commission of the European Communities. Communication from the Commission to the European Parliament and the Council—The Raw Materials Initiative—Meeting Our Crital Needs for Growth and Jobs in Europe; Commission of the European Communities: Brussels, Belgium, 2008; COM(2008)699 Final. [Google Scholar]
  2. European Commission. Communication from the Commission to the European Parliament, the Council, the European Economic and Social Committee and the Committee of the Regions—Tackling the Challenges in Commodity Markets and on Raw Materials; European Commission: Brussels, Belgium, 2011; COM(2011) 25 Final. [Google Scholar]
  3. European Commission. Communication from the Commission to the European Parliament and the Committee of the Regions on the Review of the List of Critical Raw Materials for the EU and the Implementation of the Raw Materials Initiative; European Commission: Brussels, Belgium, 2014; COM(2014) 0297 Final. [Google Scholar]
  4. European Commission. Communication from the Commission to the European Parliament, the Council, the European Economic and Social Committee and the Committee of the Regions; European Commission: Brussels, Belgium, 2017; COM(2017) 490 Final. [Google Scholar]
  5. European Commission. Communication from the Commission to the European Parliament, the Council, the European Economic and Social Committee and the Committee of the Regions—Critical Raw Material Resilience: Charting a Path towards Greater Security and Sustainability; European Commission: Brussels, Belgium, 2020; COM(2020) 474 Final. [Google Scholar]
  6. European Commission. Proposal for a Regulation of the European Parliament and of the Council—Establishing a Framework for Ensuring a Secure and Sustainable Supply of Critical Raw Materials and Amending Regulations (EU) 168/2013, (EU) 2018/858 and (EU) 2019/1020; European Commission: Brussels, Belgium, 2023; COM(2023) 160 Final. [Google Scholar]
  7. The European Parliament. The Council of the European Union Regulation (EU) 2024/1252 of the European Parliament and of the Council of 11 April 2024 Establishing a Framework for Ensuring a Secur and Sustainable Supply of Critical Raw Materials and Amending Regulations (EU) No 168/2013, (EU) 2018/858, (EU) 2018/1724 and (EU) 2019/1020; The European Parliament: Strasbourg, France, 2024; 2024/1252. [Google Scholar]
  8. Mulenshi, J.; Khavari, P.; Chehreh Chelgani, S.; Rosenkranz, J. Characterization and Beneficiation Options for Tungsten Recovery from Yxsjöberg Historical Ore Tailings. Processes 2019, 7, 895. [Google Scholar] [CrossRef]
  9. Araya, N.; Kraslawski, A.; Cisternas, L.A. Towards Mine Tailings Valorization: Recovery of Critical Materials from Chilean Mine Tailings. J. Clean. Prod. 2020, 263, 121555. [Google Scholar] [CrossRef]
  10. Mulenshi, J.; Gilbricht, S.; Chelgani, S.C.; Rosenkranz, J. Systematic Characterization of Historical Tailings for Possible Remediation and Recovery of Critical Metals and Minerals—The Yxsjöberg Case. J. Geochem. Explor. 2021, 226, 106777. [Google Scholar] [CrossRef]
  11. Sarker, S.K.; Haque, N.; Bhuiyan, M.; Bruckard, W.; Pramanik, B.K. Recovery of Strategically Important Critical Minerals from Mine Tailings. J. Environ. Chem. Eng. 2022, 10, 107622. [Google Scholar] [CrossRef]
  12. Vitti, C.; Arnold, B.J. The Reprocessing and Revalorization of Critical Minerals in Mine Tailings. Min. Metall. Explor. 2022, 39, 49–54. [Google Scholar] [CrossRef]
  13. Castro, L.; Zhang, R.; Muñoz, J.A.; Sand, W. Editorial: Bioleaching and Biorecovery of Critical Raw Materials from Secondary Sources. Front. Microbiol. 2024, 15, 1395820. [Google Scholar] [CrossRef]
  14. Istituto Superiore per la Protezione e la Ricerca Ambientale (ISPRA) GeMMA—Georisorse Minerarie d’Italia. Available online: https://sinacloud.isprambiente.it/portal/apps/sites/#/miniere (accessed on 5 November 2024).
  15. Manca, P.P.; Massacci, G.; Mercante, C. Environmental Management and Metal Recovery: Re-Processing of Mining Waste at Montevecchio Site (SW Sardinia). In Proceedings of the 18th Symposium on Environmental Issues and Waste Management in Energy and Mineral Production; Widzyk-Capehart, E., Hekmat, A., Singhal, R., Eds.; Springer International Publishing: Cham, Switzerland, 2019; pp. 149–159. ISBN 978-3-319-99902-9. [Google Scholar]
  16. Mehta, N.; Dino, G.; Passarella, I.; Ajmone-Marsan, F.; Rossetti, P.; De Luca, D. Assessment of the Possible Reuse of Extractive Waste Coming from Abandoned Mine Sites: Case Study in Gorno, Italy. Sustainability 2020, 12, 2471. [Google Scholar] [CrossRef]
  17. Balassone, G.; Manfredi, C.; Vasca, E.; Bianco, M.; Boni, M.; Di Nunzio, A.; Lombardo, F.; Mozzillo, R.; Marino, A.; Mormone, A.; et al. Recycling REEs from the Waste Products of Silius Mine (SE Sardinia, Italy): A Preliminary Study. Sustainability 2021, 13, 14000. [Google Scholar] [CrossRef]
  18. Sedda, L.; De Giudici, G.; Fancello, D.; Podda, F.; Naitza, S. Unlocking Strategic and Critical Raw Materials: Assessment of Zinc and REEs Enrichment in Tailings and Zn-Carbonate in a Historical Mining Area (Montevecchio, SW Sardinia). Minerals 2023, 14, 3. [Google Scholar] [CrossRef]
  19. Baldassarre, G.; Fiorucci, A.; Marini, P. Recovery of Critical Raw Materials from Abandoned Mine Wastes: Some Potential Case Studies in Northwest Italy. Mater. Proc. 2023, 15, 77. [Google Scholar]
  20. Cavallo, A.; Dino, G.A. Extractive Waste as a Resource: Quartz, Feldspars, and Rare Earth Elements from Gneiss Quarries of the Verbano-Cusio-Ossola Province (Piedmont, Northern Italy). Sustainability 2022, 14, 4536. [Google Scholar] [CrossRef]
  21. Zhao, X.; Khelifi, F.; Casale, M.; Cavallo, A.; Padoan, E.; Yang, K.; Dino, G.A. Critical Raw Materials Supply: Challenges and Potentialities to Exploit Rare Earth Elements from Siliceous Stones and Extractive Waste. Resources 2024, 13, 97. [Google Scholar] [CrossRef]
  22. Vaccaro, C.; Aquilano, A.; Marrocchino, E. Alternative Sources of Raw Materials for the Ceramic Industry through Granite Waste Recycling: A Case Study from Buddusò, Sardinia, Italy. Appl. Sci. 2024, 14, 7967. [Google Scholar] [CrossRef]
  23. Careddu, N.; Siotto, G.; Marras, G. The Crisis of Granite and the Success of Marble: Errors and Market Strategies. The Sardinian Case. Resour. Policy 2017, 52, 273–276. [Google Scholar] [CrossRef]
  24. Beccaluva, L.; Civetta, L.; Macciotta, G.P.; Ricci, C.A. Geochronology in Sardinia: Results and Problems. Rend. Soc. It. Min. Petr. 1985, 40, 57–72. [Google Scholar]
  25. Rossi, P.; Cocherie, A. Genesis of a Variscan Batholith: Field, Petrological and Mineralogical Evidence from the Corsica-Sardinia Batholith. Tectonophysics 1991, 195, 319–346. [Google Scholar] [CrossRef]
  26. Ferré, E.C.; Leake, B.E. Geodynamic Significance of Early Orogenic High-K Crustal and Mantle Melts: Example of the Corsica Batholith. Lithos 2001, 59, 47–67. [Google Scholar] [CrossRef]
  27. Farina, F.; Mayne, M.J.; Stevens, G.; Soorajlal, R.; Frei, D.; Gerdes, A. Phase Equilibria Constraints on Crystallization Differentiation: Insights into the Petrogenesis of the Normally Zoned Buddusò Pluton in North-Central Sardinia. Geol. Soc. Lond. Spec. Publ. 2020, 491, 243–265. [Google Scholar] [CrossRef]
  28. Barbey, P.; Gasquet, D.; Pin, C.; Bourgeix, A.L. Igneous Banding, Schlieren and Mafic Enclaves in Calc-Alkaline Granites: The Budduso Pluton (Sardinia). Lithos 2008, 104, 147–163. [Google Scholar] [CrossRef]
  29. Soorajal, R. Phase Equilibria Constraints on Crystallization Differentiation: Insights into the Petrogenesis of the Normally Zoned Buddusò Pluton in North-Central Sardinia. Ph.D. Thesis, Stellenbosch University, Stellenbosch, South Africa, 2017. [Google Scholar]
  30. Regione Autonoma della Sardegna Assessorato degli Enti Locali, Finanze e Urbanistica (Autonomous Region of Sardinia—Department of Local Authorities, Finance and Urban Planning) Dsm_build. Available online: https://www.sardegnageoportale.it/webgis2/sardegnamappe/?map=download_raster (accessed on 16 November 2024).
  31. ISO/IEC 17025:2017; General Requirements for the Competence of Testing and Calibration Laboratories. ISO: Geneva, Switzerland, 2017.
  32. Gatta, G.D.; Pagliaro, F.; Lotti, P.; Guastoni, A.; Cañadillas-Delgado, L.; Fabelo, O.; Gigli, L. Allanite at High Temperature: Effect of REE on the Thermal Behaviour of Epidote-Group Minerals. Phys. Chem. Miner. 2021, 48, 32. [Google Scholar] [CrossRef]
  33. Mahmoud, S.A.E.A. Geology, Mineralogy and Mineral Chemistry of the NYF-Type Pegmatites at the Gabal El Faliq Area, South Eastern Desert, Egypt. J. Earth Syst. Sci. 2019, 128, 156. [Google Scholar] [CrossRef]
  34. Pal, D.C.; Banerjee, A.; Dutta, A.; Sarangi, A.K. Hydrothermal Alterations and U-REE Mineralisation in the Narwapahar Uranium Deposit, Singhbhum Shear Zone, India. J. Earth Syst. Sci. 2022, 131, 31. [Google Scholar] [CrossRef]
  35. Reissner, C.E.; Bismayer, U.; Kern, D.; Reissner, M.; Park, S.; Zhang, J.; Ewing, R.C.; Shelyug, A.; Navrotsky, A.; Paulmann, C.; et al. Mechanical and Structural Properties of Radiation-Damaged Allanite-(Ce) and the Effects of Thermal Annealing. Phys. Chem. Miner. 2019, 46, 921–933. [Google Scholar] [CrossRef]
  36. Giere, R.; Sorensen, S.S. Allanite and Other REE-Rich Epidote-Group Minerals. Rev. Mineral. Geochem. 2004, 56, 431–493. [Google Scholar] [CrossRef]
  37. Levinson, A.A. A System of Nomenclature for Rare-Earth Minerals. Am. Mineral. 1966, 51, 152–158. [Google Scholar]
  38. Nickel, E.H.; Naldrett, A.J. Procedures Involving the IMA Commission On New Minerals and Mineral Names. and Guidelines on Mineral Nomenclature. Can. Mineral. 1987, 25, 353–377. [Google Scholar] [CrossRef]
  39. Bruneton, P.; Orsini, J.B. Le Massif Granitique de Buddusò (Sardaigne nord-orientale): Une Seule Intrusion de Type Zone Concentrique. C. R. Acad. Sci. 1977, 284, 151–154. [Google Scholar]
  40. Rosemblum, S.; Brownfield, I.K. Magnetic Susceptibilities of Minerals; U.S. Geological Survey: Reston, VA, USA, 2000; p. 37.
  41. Dahlin, D.C.; Rule, A.R. Magnetic Susceptibility of Minerals in High Magnetic Fields; US Bureau of Mines: Spokane, WA, USA, 1993; p. 13.
  42. Xiao, Z.; Zhang, W. Review of Allanite: Properties, Occurrence and Mineral Processing Technologies. Green Smart Min. Eng. 2024, 1, 40–52. [Google Scholar] [CrossRef]
  43. Jordens, A.; Cheng, Y.P.; Waters, K.E. A Review of the Beneficiation of Rare Earth Element Bearing Minerals. Miner. Eng. 2013, 41, 97–114. [Google Scholar] [CrossRef]
  44. Stouraiti, C.; Angelatou, V.; Petushok, S.; Soukis, K.; Eliopoulos, D. Effect of Mineralogy on the Beneficiation of REE from Heavy Mineral Sands: The Case of Nea Peramos, Kavala, Northern Greece. Minerals 2020, 10, 387. [Google Scholar] [CrossRef]
  45. Raslan, M.F.; Kharbish, S.; Fawzy, M.M.; El Dabe, M.M.; Fathy, M.M. Gravity and Magnetic Separation of Polymetallic Pegmatite from Wadi El Sheih Granite, Central Eastern Desert, Egypt. J. Min. Sci. 2021, 57, 316–326. [Google Scholar] [CrossRef]
  46. Karan, R.; Sreenivas, T.; Babu, J.M.; Kumar, M.A.; Rao, K.A.; Sahoo, H.S.; Banerjee, A.; Mundra, K.L. Hydrometallurgical Studies for the Recovery of Rare Earths from Micro-Granite Ore Deposit of Bhatikhera, Rajasthan, India. J. Geol. Soc. India 2022, 98, 1152–1158. [Google Scholar] [CrossRef]
  47. Jordens, A.; Marion, C.; Kuzmina, O.; Waters, K.E. Physicochemical Aspects of Allanite Flotation. J. Rare Earths 2014, 32, 476–486. [Google Scholar] [CrossRef]
  48. Kursun, I.; Terzi, M.; Ozdemir, O. Determination of Surface Chemistry and Flotation Properties of Rare Earth Mineral Allanite. Miner. Eng. 2019, 132, 113–120. [Google Scholar] [CrossRef]
  49. Plaksin, I.N.; Barysheva, K.F.; Solnyshkin, V.I.; Khvostova, V.A. Effect of Metamict Decomposition of Orthite on Its Floatability. Sov. Min. Sci. 1970, 6, 412–416. [Google Scholar] [CrossRef]
  50. Liu, W.; Xiao, Z.; Das, S.; Zhang, W. Mechanism and Kinetic Study of Rare Earth Extraction from Allanite by Direct Acid Leaching. Miner. Eng. 2024, 205, 108489. [Google Scholar] [CrossRef]
  51. Kärenlampi, K.; Väänänen, E.; Roivainen, T.; Perämäki, P. Low Temperature Leaching Behavior of Allanite-(Ce) in Treating an Allanite-Concentrate by Sulfuric Acid. J. Sustain. Metall. 2024, 10, 1–9. [Google Scholar] [CrossRef]
  52. Karan, R.; Sreenivas, T. Recovery of Rare Earth Values from Micro-Granite Type Hard Rocks Using Deep Eutectic Solvents. Trans. Indian Inst. Met. 2023, 77, 4321–4331. [Google Scholar] [CrossRef]
  53. Conte, A.M.; Cuccuru, S.; D’Antonio, M.; Naitza, S.; Oggiano, G.; Secchi, F.; Casini, L.; Cifelli, F. The Post-Collisional Late Variscan Ferroan Granites of Southern Sardinia (Italy): Inferences for Inhomogeneity of Lower Crust. Lithos 2017, 294–295, 263–282. [Google Scholar] [CrossRef]
  54. Ishihara, S. The Granitoid Series and Mineralization. In Seventy-Fifth Anniversary Volume; Skinner, B.J., Ed.; Economic Geology Publishing Company: Littleton, CO, USA, 1981; pp. 458–484. ISBN 978-1-934969-53-3. [Google Scholar]
  55. Zhi, Z.-Y.; Li, L.; Li, S.-R.; Santosh, M.; Yuan, M.-W.; Alam, M. Magnetite as an Indicator of Granite Fertility and Gold Mineralization: A Case Study from the Xiaoqinling Gold Province, North China Craton. Ore Geol. Rev. 2019, 115, 103159. [Google Scholar] [CrossRef]
  56. Schwertmann, U.; Taylor, R.M. Iron Oxides. In SSSA Book Series; Dixon, J.B., Weed, S.B., Eds.; Soil Science Society of America Journal: Madison, WI, USA, 2018; pp. 379–438. ISBN 978-0-89118-860-5. [Google Scholar]
  57. Taylor, S.R.; McLennan, S.M. The Geochemical Evolution of the Continental Crust. Rev. Geophys. 1995, 33, 241–265. [Google Scholar] [CrossRef]
  58. Seredin, V.V. A New Method for Primary Evaluation of the Outlook for Rare Earth Element Ores. Geol. Ore Depos. 2010, 52, 428–433. [Google Scholar] [CrossRef]
  59. Seredin, V.V.; Dai, S. Coal Deposits as Potential Alternative Sources for Lanthanides and Yttrium. Int. J. Coal Geol. 2012, 94, 67–93. [Google Scholar] [CrossRef]
  60. Wang, Z.; Li, M.Y.H.; Liu, Z.-R.R.; Zhou, M.-F. Scandium: Ore Deposits, the Pivotal Role of Magmatic Enrichment and Future Exploration. Ore Geol. Rev. 2021, 128, 103906. [Google Scholar] [CrossRef]
  61. Zhang, P.; Han, Z.; Jia, J.; Wei, C.; Liu, Q.; Wang, X.; Zhou, J.; Li, F.; Miao, S. Occurrence and Distribution of Gallium, Scandium, and Rare Earth Elements in Coal Gangue Collected from Junggar Basin, China. Int. J. Coal Prep. Util. 2019, 39, 389–402. [Google Scholar] [CrossRef]
  62. Lu, F.; Xiao, T.; Lin, J.; Ning, Z.; Long, Q.; Xiao, L.; Huang, F.; Wang, W.; Xiao, Q.; Lan, X.; et al. Resources and Extraction of Gallium: A Review. Hydrometallurgy 2017, 174, 105–115. [Google Scholar] [CrossRef]
  63. Manchanda, V.K. Thorium as an Abundant Source of Nuclear Energy and Challenges in Separation Science. Radiochim. Acta 2023, 111, 243–263. [Google Scholar] [CrossRef]
  64. Jyothi, R.K.; De Melo, L.G.T.C.; Santos, R.M.; Yoon, H.-S. An Overview of Thorium as a Prospective Natural Resource for Future Energy. Front. Energy Res. 2023, 11, 1132611. [Google Scholar] [CrossRef]
Figure 1. Satellite image of the quarry area, showing the polygons corresponding to each of the granite EW dumps.
Resources 14 00024 g001
Figure 2. Satellite image showing the digital surface model (DSM) cuttings corresponding to each of the granite EW dumps. ASL: above sea level.
Resources 14 00024 g002
Figure 3. Illustrative diagram of the working process of the granite extractive waste (EW) suggested by Vaccaro et al. [22].
Resources 14 00024 g003
Figure 4. Backscattered electron (BSE) scanning electron microscope (SEM) photomicrographs. Examples of allanite crystals identified by SEM investigations on thin sections of granite EW.
Resources 14 00024 g004
Figure 5. Scatter plot showing the average Fe2O3 and Ce2O3 content, calculated from semi-quantitative SEM-EDS analyses on allanite grains identified in thin sections of granite waste. Grey bars indicate the standard deviation (SD). The dashed line separates the fields of Fe-depleted allanites from Fe-enriched ones.
Resources 14 00024 g005
Figure 6. Micro-stereophotographs of the material constituting the light ferromagnetic (LF) fraction. Images acquired using an SZ Series stereomicroscope (OPTIKA srl, Ponteranica, Italy).
Resources 14 00024 g006
Figure 7. Top: comparison of trace element abundances in heavy ferromagnetic (HF), intermediate ferromagnetic (IF), light ferromagnetic (LF), and whole rock (WR), U concentration in WR according to Vaccaro et al. [22]. Middle: mean WR-normalized trace element patterns in ferromagnetic fractions. Bottom: mean upper continental crust (UCC)-normalized trace element patterns in ferromagnetic fractions.
Resources 14 00024 g007
Figure 8. Top: comparison of REEs abundances in HF, IF, LF, and WR as REEs concentrations in WR (excluding Y) from Vaccaro et al. [22]. Middle: mean WR-normalized REEs patterns in ferromagnetic fractions. Bottom: mean UCC-normalized REEs patterns in ferromagnetic fractions.
Resources 14 00024 g008
Figure 9. Top: comparison of trace element abundances in heavy highly paramagnetic (HHP), intermediate highly paramagnetic (IHP), light highly paramagnetic (LHP) fractions, and WR, U concentration in WR according to Vaccaro et al. [22]. Middle: mean WR-normalized trace element patterns in highly paramagnetic fractions. Bottom: mean UCC-normalized trace element patterns in highly paramagnetic fractions.
Resources 14 00024 g009
Figure 10. Top: comparison of REEs abundances in HHP, IHP, LHP, and WR and REEs concentrations in WR (excluding Y) from Vaccaro et al. [22]. Middle: mean WR-normalized REEs patterns in highly paramagnetic fractions. Bottom: mean UCC-normalized REE patterns in highly paramagnetic fractions.
Resources 14 00024 g010
Figure 11. BSE SEM photomicrographs. Polymineralic grains of allanite and biotite or other minerals in the LHP fractions are highlighted in the red boxes. Aln: allanite; Bt: biotite; UM: unidentified mineral.
Resources 14 00024 g011
Figure 12. Top: comparison of trace element abundances in heavy weakly paramagnetic (HWP), intermediate weakly paramagnetic (IWP), light weakly paramagnetic (LWP), and WR, U concentration in WR from Vaccaro et al. [22]. Middle: mean WR-normalized trace elements pattern in weakly paramagnetic fractions. Bottom: mean UCC-normalized trace element patterns in weakly paramagnetic fractions.
Resources 14 00024 g012
Figure 13. Top: comparison of REEs abundances in HWP, IWP, LWP, and WR, REEs concentrations in WR (excluding Y) according to Vaccaro et al. [22]. Middle—mean WR-normalized REEs patterns in weakly paramagnetic fractions. Bottom: mean UCC-normalized REEs patterns in weakly paramagnetic fractions.
Resources 14 00024 g013
Figure 14. BSE SEM photomicrographs: (A,B) examples of allanite grains in the highly paramagnetic fractions and examples of EDS spectra acquired; (C,D) examples of allanite grains in the weakly paramagnetic fractions and examples of EDS spectra acquired. White areas and dots represent the zones where EDS measurements were performed.
Resources 14 00024 g014
Figure 15. Scatter plot showing REEdef and Kout in WR, crushing powder (CP), and the other obtained fractions.
Resources 14 00024 g015
Figure 16. Potential market value of CRMs in obtained fractions. Columns represent recoverable amount of CRMs; red line represents market value.
Resources 14 00024 g016
Figure 17. Potential stock quantity (black lines) and total market value (red lines). The points marked with a plus sign represent the best-case scenario (5% porosity and maximum yield in separations), while the points marked with a minus sign represent the worst-case scenario (30% porosity and minimum yield in separations).
Resources 14 00024 g017
Table 1. Estimate of the volumes and masses of granite EW within the quarry under study.
LandfillVolumeMass95% Mass70% Mass
103 m3103 ton103 ton103 ton
1259670637469
237959066
35.113139.2
4566146513921026
51.03.02.41.8
628726850
755144137101
89.1242217
91.64.34.13.0
1077200190140
Total962269125561884
Table 2. Analytical results from 148 analysis points performed via SEM-EDS on 24 minerals identified within thin sections of granite EW. SD: standard deviation; b.d.l.: below the detection limit.
n = 148MeanSDMedianMaxMin
SiO236.983.4236.4548.3826.93
TiO20.970.421.021.910.00
Al2O314.831.6114.8519.6310.67
Fe2O315.162.4015.3821.907.95
MnO0.530.280.551.65b.d.l.
MgO1.040.460.972.48b.d.l.
CaO9.601.129.6013.616.38
Na2O1.060.620.994.59b.d.l.
K2O0.940.700.743.240.01
P2O50.070.29b.d.l.1.80b.d.l.
Cl0.080.20b.d.l.1.55b.d.l.
F0.241.41b.d.l.10.15b.d.l.
Ce2O38.092.238.4916.882.83
La2O33.931.304.036.39b.d.l.
Nd2O33.060.852.957.450.97
Pr2O30.680.480.812.35b.d.l.
Sm2O30.460.530.332.31b.d.l.
Gd2O30.090.29b.d.l.2.08b.d.l.
ThO22.001.151.686.51b.d.l.
Y2O30.100.41b.d.l.3.09b.d.l.
PbO0.070.26b.d.l.1.53b.d.l.
Table 3. Mean (±SD) major oxide composition of the ferromagnetic fractions (three analyses performed in replicate for each mixed sub-sample). b.d.l.: below the detection limit.
wt.%HFIFLF
SiO218.98 ± 0.0821.31 ± 0.1144.45 ± 0.24
TiO21.28 ± 0.011.23 ± 0.041.64 ± 0.01
Al2O38.43 ± 0.038.10 ± 0.1414.74 ± 0.13
Fe2O361.32 ± 0.0758.21 ± 0.3723.84 ± 0.07
MnO0.33 ± 0.000.32 ± 0.010.39 ± 0.00
MgO3.15 ± 0.014.37 ± 0.024.45 ± 0.01
CaO2.16 ± 0.022.20 ± 0.042.60 ± 0.02
Na2O1.03 ± 0.020.87 ± 0.011.59 ± 0.02
K2O2.57 ± 0.012.84 ± 0.024.92 ± 0.05
P2O50.75 ± 0.010.55 ± 0.020.40 ± 0.01
LOIb.d.l.b.d.l.1.00 ± 0.53
Table 4. Mean WR-normalized and UCC-normalized REEs composition in the ferromagnetic fractions.
WR-NormalizedUCC-Normalized
HFIFLFHFIFLF
Y6.48.65.34.86.43.9
La6.77.95.17.08.35.3
Ce7.18.15.37.38.35.4
Pr7.08.55.47.28.75.6
Nd6.98.45.46.98.35.4
Sm7.08.15.67.58.86.1
Eu1.31.41.51.11.21.3
Gd6.88.95.66.58.55.3
Tb6.89.35.85.47.44.6
Dy6.68.85.55.67.44.7
Ho7.09.65.74.86.63.9
Er6.89.95.54.66.73.7
Tm6.89.35.54.96.74.0
Yb7.49.95.55.16.83.8
Lu8.511.26.35.87.64.3
Table 5. Mean (±SD) composition of major oxides in the highly paramagnetic fractions (nine analyses performed per each HHP sub-sample; three analyses performed in replicate for IHP and LHP mixed sub-samples).
wt.%HHPIHPLHP
SiO232.57 ± 1.2631.79 ± 0.0033.14 ± 0.08
TiO23.23 ± 0.113.25 ± 0.003.25 ± 0.01
Al2O315.90 ± 0.3915.91 ± 0.0115.70 ± 0.03
Fe2O327.69 ± 1.4829.25 ± 0.0328.51 ± 0.05
MnO0.73 ± 0.070.79 ± 0.000.74 ± 0.00
MgO6.37 ± 0.626.41 ± 0.046.55 ± 0.03
CaO3.66 ± 0.743.14 ± 0.032.01 ± 0.00
Na2O0.35 ± 0.070.34 ± 0.000.39 ± 0.00
K2O5.75 ± 0.635.89 ± 0.076.75 ± 0.01
P2O50.42 ± 0.060.42 ± 0.000.34 ± 0.01
LOI3.34 ± 0.472.82 ± 0.042.63 ± 0.04
Table 6. Mean WR-normalized and UCC-normalized REEs composition in the highly paramagnetic fractions.
WR-NormalizedUCC-Normalized
HHPIHPLHPHHPIHPLHP
Y9.47.53.87.05.62.8
La40.628.64.142.630.14.4
Ce38.427.04.039.327.64.1
Pr38.827.24.339.727.84.4
Nd35.225.54.235.025.34.2
Sm27.321.14.129.522.84.4
Eu5.13.71.14.23.00.9
Gd20.215.74.419.215.04.1
Tb16.313.04.613.010.33.6
Dy12.610.14.310.68.53.6
Ho11.28.94.37.76.12.9
Er9.57.63.96.55.12.6
Tm8.77.03.96.35.12.8
Yb8.27.03.85.64.82.6
Lu8.77.64.16.05.22.8
Table 7. Mean (±SD) composition of major oxides in the weakly paramagnetic fractions (three analyses performed in replicate for each mixed sub-sample).
wt.%HWPIWPLWP
SiO257.08 ± 0.0157.3 ± 0.1961.29 ± 0.15
TiO20.92 ± 0.000.93 ± 0.000.56 ± 0.00
Al2O318.71 ± 0.0318.41 ± 0.1418.44 ± 0.08
Fe2O35.63 ± 0.005.86 ± 0.014.31 ± 0.02
MnO0.18 ± 0.000.18 ± 0.000.13 ± 0.00
MgO2.55 ± 0.022.83 ± 0.022.66 ± 0.02
CaO6.28 ± 0.015.57 ± 0.033.01 ± 0.02
Na2O3.24 ± 0.013.05 ± 0.023.73 ± 0.01
K2O3.15 ± 0.003.45 ± 0.014.03 ± 0.00
P2O50.26 ± 0.000.22 ± 0.000.15 ± 0.00
LOI2.01 ± 0.052.21 ± 0.001.7 ± 0.04
Table 8. Mean WR-normalized and UCC-normalized REEs composition in the weakly paramagnetic fractions.
WR-NormalizedUCC-Normalized
HWPIWPLWPHWPIWPLWP
Y16.512.82.712.39.52.0
La93.367.15.898.070.56.1
Ce90.566.06.092.667.56.1
Pr91.867.15.993.968.76.0
Nd87.362.85.786.762.35.6
Sm65.448.35.170.752.15.5
Eu13.310.22.310.98.41.9
Gd43.532.44.341.430.94.1
Tb33.225.23.826.420.03.0
Dy24.418.03.220.615.22.7
Ho20.115.03.113.710.22.1
Er16.712.02.911.38.11.9
Tm14.610.92.710.57.82.0
Yb13.910.42.79.57.21.9
Lu14.811.33.010.17.72.0
Disclaimer/Publisher’s Note: The statements, opinions and data contained in all publications are solely those of the individual author(s) and contributor(s) and not of MDPI and/or the editor(s). MDPI and/or the editor(s) disclaim responsibility for any injury to people or property resulting from any ideas, methods, instructions or products referred to in the content.

