Article

Visible Light-Driven Photocatalytic Degradation of Ciprofloxacin, Ampicillin and Erythromycin by Zinc Ferrite Immobilized on Chitosan

by
Nehad Ahmed Hassan Mohamed
1,
Rehab Nabil Shamma
2,*,
Sherien Elagroudy
1,3 and
Adewale Adewuyi
4,5,*
1
Public Works Department, Faculty of Engineering, Ain Shams University, Cairo 11535, Egypt
2
Department of Pharmaceutics and Industrial Pharmacy, Faculty of Pharmacy, Cairo University, Cairo 11561, Egypt
3
Egypt Solid Waste Management Center of Excellence, Ain Shams University, Cairo 11535, Egypt
4
Department of Chemical Sciences, Faculty of Natural Sciences, Redeemer’s University, Ede 230, Osun State, Nigeria
5
Yusuf Hamied Department of Chemistry, University of Cambridge, Lensfield Road, Cambridge CB2 1EW, UK
*
Authors to whom correspondence should be addressed.
Resources 2022, 11(10), 81; https://doi.org/10.3390/resources11100081
Submission received: 21 August 2022 / Revised: 11 September 2022 / Accepted: 16 September 2022 / Published: 22 September 2022
(This article belongs to the Special Issue Women's Special Issue Series: Sustainable Resource Management)

Abstract

:
This study investigated the synthesis of zinc ferrite immobilized on chitosan (ZnFe2O4@Chitosan) and its application in the photodegradation of ciprofloxacin (CIP), ampicillin (AMP) and erythromycin (ERY) in aqueous solution. Results from Fourier transform infrared spectroscopy (FTIR) revealed peaks suggesting its synthesis, while signals from X-ray diffraction (XRD) showed diffraction patterns confirming the synthesis of ZnFe2O4@Chitosan with a crystallite size of 35.14 nm. Scanning electron microscopy (SEM) revealed a homogeneous morphology with a surface area of 12.96 m2 g−1 from the Brunauer–Emmett–Teller (BET) analysis. The vibrating sample magnetometry (VSM) result revealed a saturation magnetization of 2.38 emu g−1. The photodegradation study of CIP, AMP and ERY showed that both photodegradation and adsorption were taking place at the same time with the percentage degradation efficiency in the order CIP (99.80 ± 0.20%) > AMP (94.50 ± 0.10%) > ERY (83.20 ± 0.20%). ZnFe2O4@Chitosan exhibited high stability with capacity > 90% even at the 15th regeneration cycle, suggesting a viable economic value of ZnFe2O4@Chitosan.

1. Introduction

Contamination of natural sources of drinking water by antibiotics is a global concern [1]. The contamination is on the rise because of the unregulated use of antibiotics in some nations of the world [2]. The ease of purchasing antibiotics without medical prescription in some countries has encouraged self-medication, resulting in the excessive use of antibiotics. The excessive use of antibiotics is one of the causes of their presence in environmental natural water-like surface and underground water systems. These antibiotics may become persistent in the environment or may decompose to form products that are toxic to humans and the environment. Some of the decomposition products can cause serious health challenges like cancer. Apart from this, the presence of antibiotics in the environmental natural water system has led to far more serious consequences like the emergence of drug-resistant strains of pathogenic organisms [3], which, in turn, hampered the efficacies of well-known antibiotics. Unfortunately, previously efficient antibiotics are now losing efficacy. It is important that these antibiotics are removed from water in order to avoid the challenges associated with their presence in natural sources of drinking water.
Many antibiotics have been detected in water [4,5], including ciprofloxacin (CIP), ampicillin (AMP) and erythromycin (ERY) reported in surface water as contaminants [6,7,8,9]. Their presence in water is of serious concern, although efforts have been made to remove them from water, but most of these efforts have shortcomings, like incomplete removal or being expensive. It is important to develop a process that can overcome such shortcomings with an affordable and sustainable approach. Photocatalysis is a green approach which has shown exceptional performance in the degradation of organic pollutants in water [10,11,12]. Photocatalysis has the potential of overcoming these shortcomings with the capacity for complete degradation of antibiotics in water [13]. Zinc oxide (ZnO) is an example of a photocatalyst that can be used in photocatalysis for the photocatalytic degradation of antibiotics. Unfortunately, ZnO is limited in its photocatalytic application, because it is photoactive in UV light due to its large bandgap energy.
Previous studies have reported the use of ZnO particles for the degradation of amoxicillin, CIP, AMP and cloxacillin under UV light irradiation in aqueous solutions [14]. The study revealed a degradation efficiency of approximately 50% for CIP, creating the need for improvement. ZnO is active under UV light irradiation, which increases the process cost since there is a need to get a UV light source, unlike in the case of materials which are visible-light sensitive. A similar observation was also recorded recently using ZnO-functionalized fly-ash-based zeolite for the degradation of CIP which exhibited complete degradation [15]; despite the complete degradation, provision of UV light sources is an additional cost which eventually increases process cost. Developing ZnO into materials that are visible-light sensitive will go a long way in helping to reduce process cost. One of the ways of achieving this will be to incorporate ZnO into other particles, which reduces its bandgap energy. A good example of this is zinc ferrite (ZnFe2O4). Ferrites are useful in this regard because of their relatively narrow bandgap of approximately 2.0 eV, which makes it suitable for photocatalysis in the visible-light region.
Spinel ferrites were recently reported for the degradation of tetracycline hydrochloride [16]. Moreover, magnesium ferrite (MgFe2O4) and manganese ferrite (MnxFe3-xO4) have shown similar capacities against tetracycline [17] and sulfamethoxazole [18], respectively. Furthermore, high performance has been reported from the synergistic activity of MnFe2O4 and molybdenum disulfide (MoS) for the degradation of tetracycline [19]. Photocatalytic degradation of antibiotics by ferrite has proved to be a good solution for the treatment of antibiotic-contaminated water due to its soft magnetic properties, high catalytic activities and ease of recycling through magnetic separation [20]. However, a recent study revealed that the performance of a photocatalyst can be enhanced via a simple modification process. The current study proposes the modification of ZnFe2O4 by organic molecule such as chitosan. The use of chitosan will help stabilize the particles of ZnFe2O4 by reducing aggregation and helping to promote the recovery of ZnFe2O4 particles from solution. A previous study has shown that the efficiency of modified photocatalysts may be attributed to high light absorption, formation of step scheme heterojunction and interfacial charge separation. Being a polysaccharide, chitosan contains random distribution of β-(1–4)-linked D-glucosamine and N-acetyl-D-glucosamine. It is either neutral or negatively charged in acidic medium, which allows it to form electrostatic complexes or multilayer structure. Its nontoxicity, biocompatibility and biodegradability make it suitable for various applications such as in water treatment.
This study aimed at investigating the preparation of ZnFe2O4 via coprecipitation and its immobilization on chitosan to further improve on its separation from aqueous solution when used as a photocatalyst for the photodegradation of antibiotics. ZnFe2O4@Chitosan was proposed as a photocatalyst for the degradation of CIP, AMP and ERY in aqueous solution. Therefore, this study was aimed at the photodegradation of CIP, AMP and ERY under visible-light irradiation using ZnFe2O4@Chitosan.

2. Materials and Methods

2.1. Materials

Zinc chloride hexahydrate (ZnCl2.6H2O), ferric chloride hexahydrate (FeCl3.6H2O), chitosan, acetic acid, NaOH, C2H5OH, HCl, oleic acid, ciprofloxacin (CIP), ampicillin (AMP), erythromycin (ERY), isopropyl alcohol (IPA), ammonium oxalate (AO), chloroform (CH), and all other chemicals used were purchased from the Aldrich Chemical Co., Gillingham, UK.

2.2. Synthesis of ZnFe2O4 Particles

To prepare ZnFe2O4 particles, mixtures of FeCl3.6H2O (0.4 M) and ZnCl2.6H2O (0.2M) were continuously stirred for 60 min, after which oleic acid (15 mL) was added as a capping agent. The mixture was maintained at a temperature of 80 °C and a pH range of 10–12 by dropwise addition of NaOH (2 M) until the appearance of precipitate while stirring for 2 h. The mixture was cooled to room temperature, filtered, and washed severally with water and ethanol. The residue obtained was oven-dried at 105 °C for 12 h and transferred to the furnace at 550 °C for 18 h.

2.3. Synthesis of ZnFe2O4@Chitosan Particles

To prepare ZnFe2O4@Chitosan, chitosan (1 g) was dissolved in acetic acid (50 mL, 2% v/v) and sonicated for 60 min. ZnFe2O4 (2 g) was added to the solution and stirred for 60 min. While maintaining room temperature, 30 mL of NaOH (1 M) were added and stirred for 40 min to form precipitates. The ZnFe2O4@Chitosan formed was filtered and washed severally with deionized water. The residue obtained was oven-dried at 40 °C for 12 h.

2.4. Characterization of ZnFe2O4@Chitosan Particles

The functional groups in ZnFe2O4@Chitosan were determined using FTIR (Agilent Technologies); spectrum was recorded in the range of 400–4500 cm−1. The BET surface area was determined by N2 gas adsorption using Nova 3200 quanta chrome. TG analysis was carried out using a Mettler thermogravimetric analyzer (SDT Q600 V20.9 Build 20). The X-ray diffraction pattern was measured in 2θ ranging from 5 to 90° using an X-ray diffractometer (Philip XRD-1390 PW model) with filtered Cu Kβ radiation operated at 40 kV and 40 mA. The SEM image was recorded using SEM JSM-T25 (JOEL Co., Japan), while elemental composition was estimated on EDS. VSM was carried out on a magnetometer and UV-visible absorption spectra were recorded on a UV-visible spectrophotometer (UV-vis: Cary 60).

2.5. Photocatalytic Degradation of CIP, AMP and ERY by ZnFe2O4@Chitosan

The photodegradation study was carried out under visible light using a low-cost solar simulator (LSO1O6, 150 W Xe light source) with a filter holder and 90° beam turner. The degradation was achieved by contacting 100 mL of either CIP, AMP or ERY at a concentration of 5.00 mg L−1 with 0.1 g of ZnFe2O4@Chitosan particle in a 150 mL beaker for 180 min while stirring gently at 80 rpm under the simulated visible-light irradiation, ensuring a distance of 20 cm between the UV lamp and the test solution. Samples were withdrawn at different intervals to monitor the degradation rate. The concentrations of CIP (λmax = 271 nm), AMP (λmax = 420 nm) and ERY (λmax = 285 nm) were measured using a UV-visible spectrophotometer (Perkin Elmer, Lambda 750 spectrometer). The effect of the ZnFe2O4@Chitosan weight on degradation was checked by varying the weight of ZnFe2O4@Chitosan from 0.1 to 0.5 g, while the effect of concentration of CIP, AMP or ERY on degradation capacity was evaluated by varying the concentration from 1.00 to 5.00 mg L−1 (CIP, AMP or ERY), and the effect of pH was determined by varying the pH solution from 2 to 10. The experiment was repeated in the dark to establish the adsorption–desorption equilibrium. All the experiments were repeated three times and values were presented as mean value. The degradation efficiency was calculated as:
D e g r a d a t i o n   E f f i c i e n c y   % = 100   x   ( 1 C t C o )
where Co is the initial concentration of CIP, AMP or ERY, and Ct is the concentration of CIP, AMP or ERY at time t. The adsorption capacity (qt) and the percentage removal (% removal) for the adsorption–desorption equilibrium experiment in the dark was calculated as:
q t = C o C t V m
%   r e m o v a l = C o C t C o   X   100
Equation (4) was obtained by combining Equations (2) and (3)
q t = %   r e m o v a l   X   C o   X   V 100   X   m
where   C o (mg L−1) is the initial concentration of CIP, AMP or ERY, C t   (mg L−1) is the concentration of CIP, AMP or ERY at time t; m is the weight (g) of ZnFe2O4@Chitosan used, V represents the volume in litres (L) and q t (mg g−1) is the adsorption capacity.

2.6. Evaluation of Reactive Oxygen Species Scavenging Capacity

In order to understand the mechanism of operation of ZnFe2O4@Chitosan, the role of reactive oxygen species (ROS) in the photodegradation of CIP, AMP and ERY was investigated using isopropyl alcohol (IPA) as a hydroxyl radical (OH·) scavenger, ammonium oxalate (AO) as a scavenger for hole (h+) and the scavenger for superoxide ion radical (·O2) being chloroform (CH). The scavengers were separately introduced into the photodegradation process as a concentration of 1 mM. The process conditions (ZnFe2O4@Chitosan weight, concentration of CIP, AMP or ERY, photodegradation time, and pH) for photodegradation with and without scavengers was kept constant.

2.7. Re-Useability and Stability of ZnFe2O4@Chitosan

To determine re-useability, the ZnFe2O4@Chitosan was recovered after the degradation time, washed with solvents (deionized water, 0.1 M HCl, ethanol or a mixture of ethanol and 0.1 M HCl (3:2)) and dried in the oven at 80 °C for 5 h before it was reused for the photodegradation process. The treated aqueous solution was analyzed to check for the leaching of ZnFe2O4 into solution using inductively coupled plasma–optical emission spectroscopy (ICP–OES). The ICP–OES analysis was carried out at the end of each treatment cycle with ZnFe2O4@Chitosan. The photostability of the ZnFe2O4@Chitosan for the photodegradation of CIP, AMP and ERY was evaluated in fifteen (15) successive cycles of operation.

3. Results and Discussion

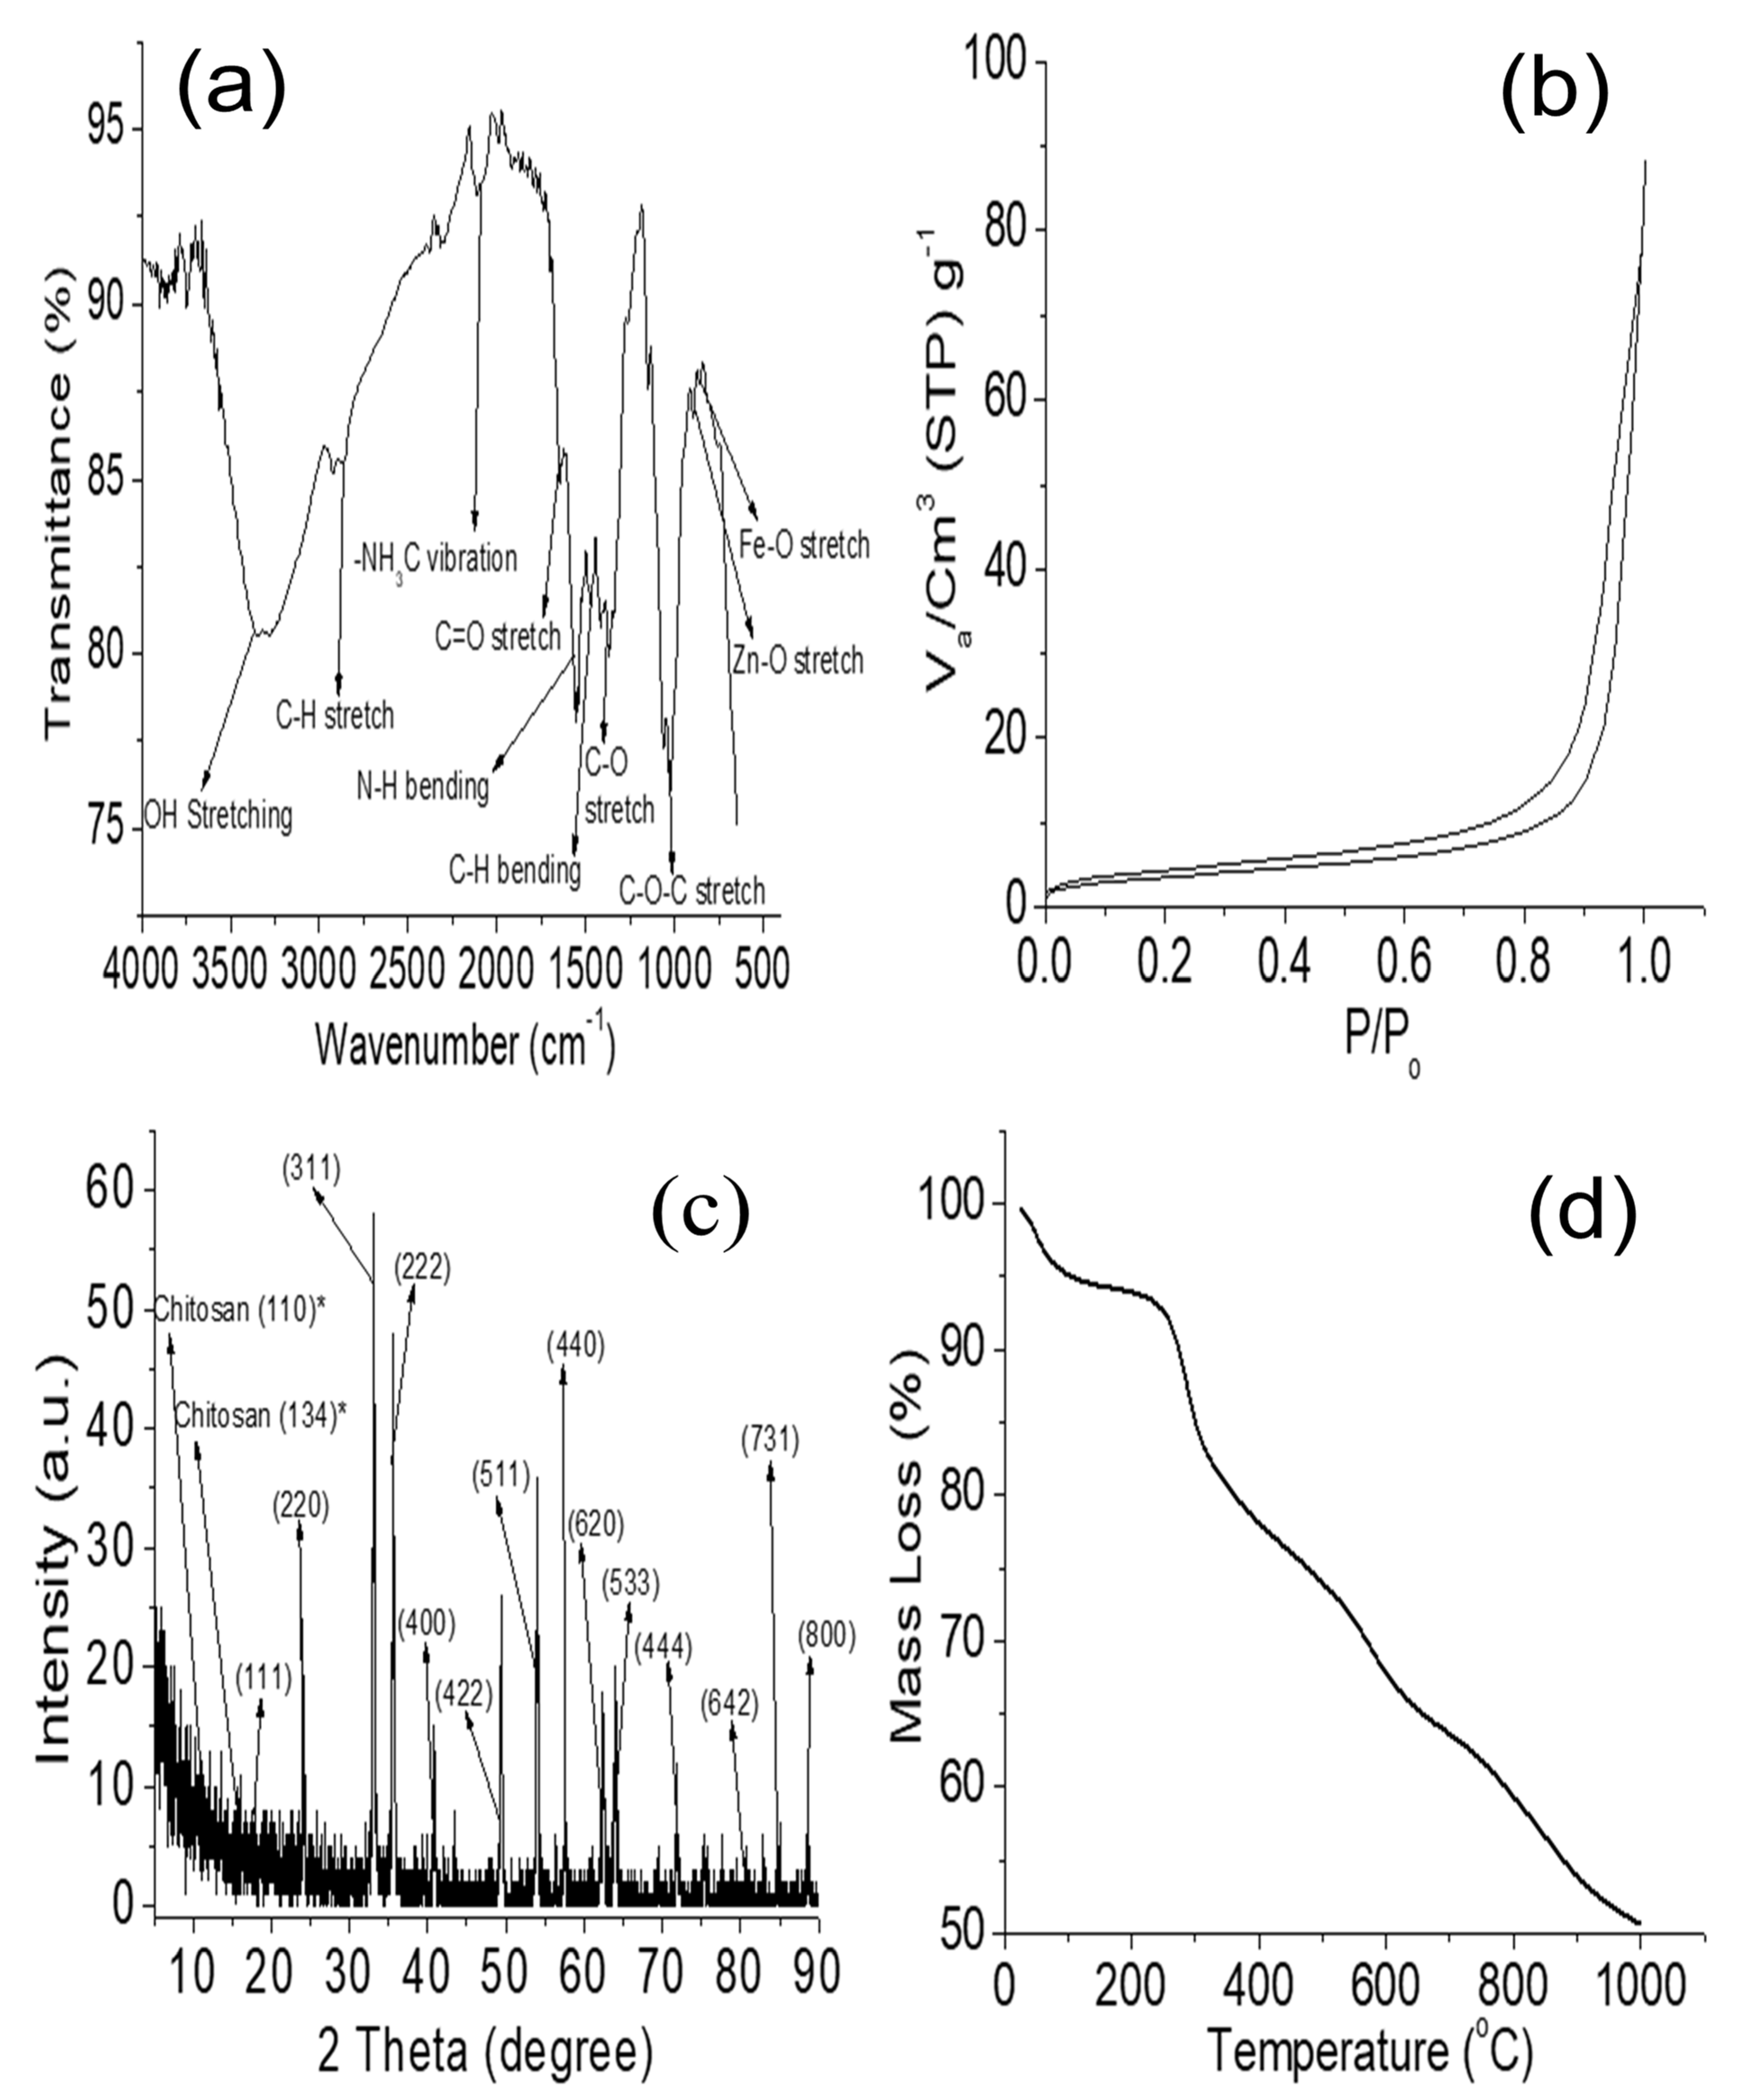
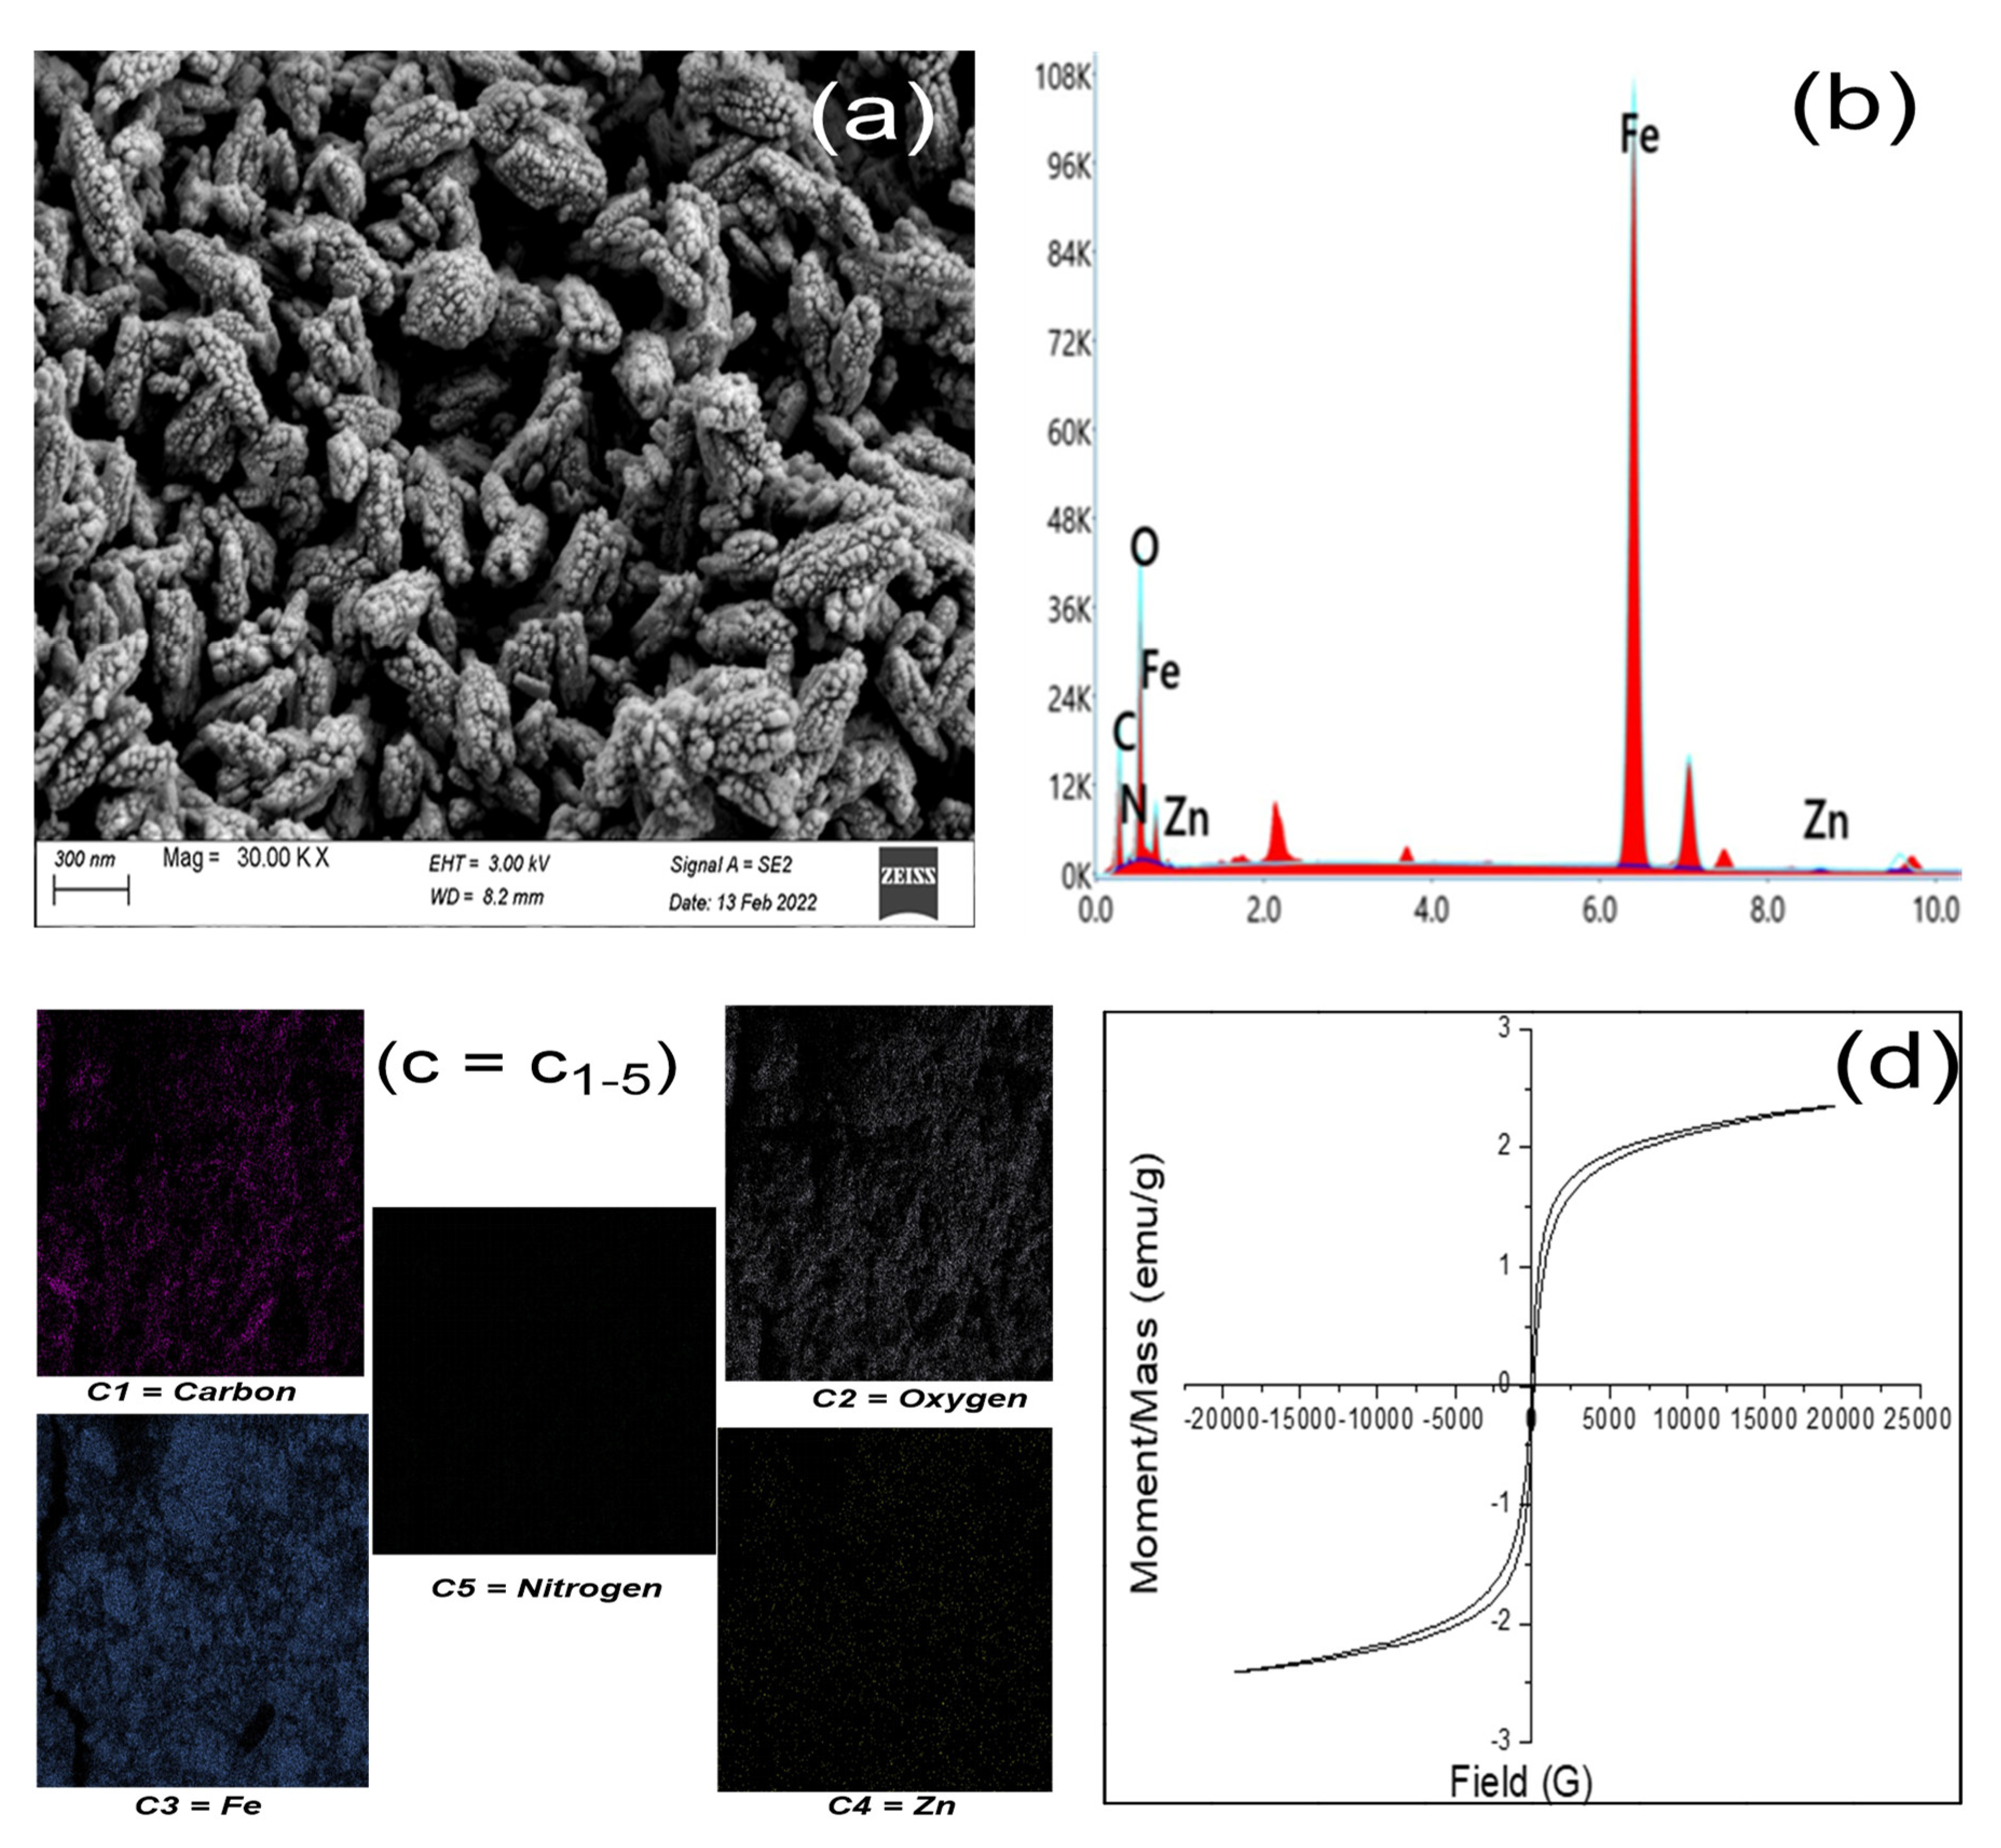
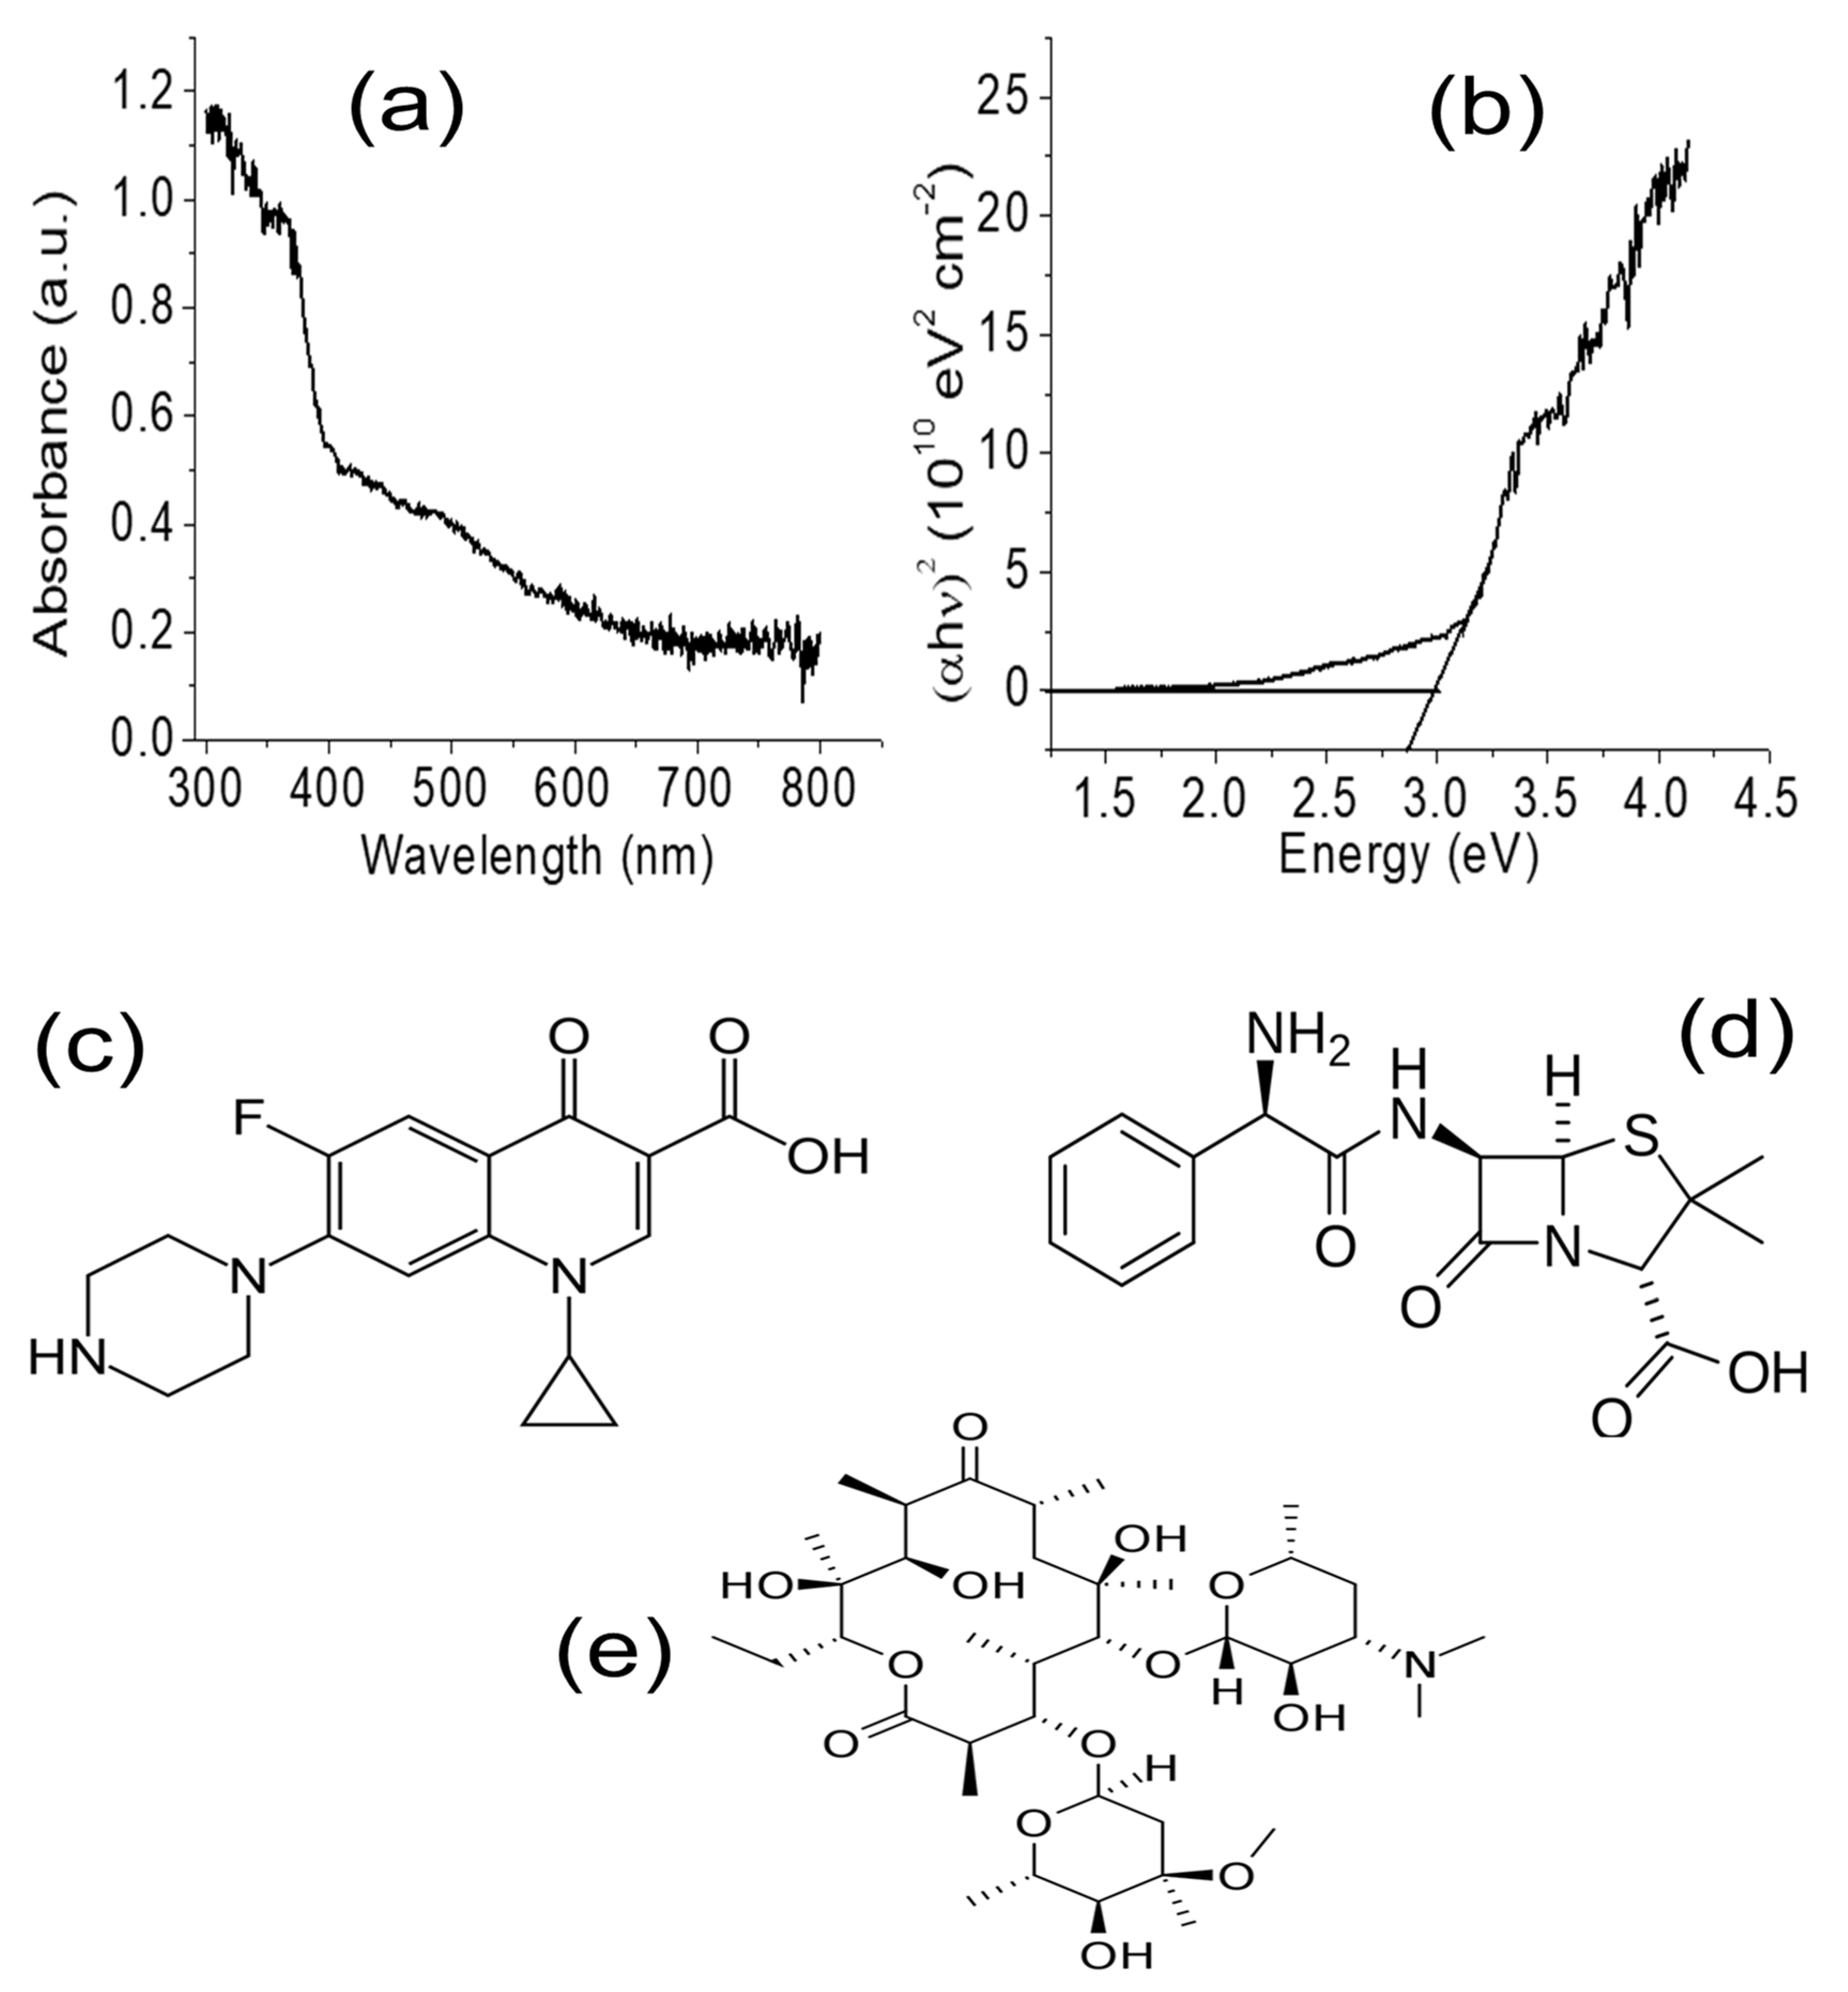
3.1. Synthesis and Characterization of ZnFe2O4@Chitosan

The FTIR spectrum of ZnFe2O4@Chitosan revealed the functional groups it contained, as shown in Figure 1a. The spectrum revealed a peak at 3420 cm−1, which was attributed to the O-H stretching, while the peak at 2892 cm−1 was assigned to the C-H stretching of alkane. The -NH3C stretch was observed at 2352 cm−1, while the signal corresponding to the C=O carbonyl stretch of amide was seen at 1612 cm−1. The N-H and C-H bending appeared at 1584 and 1580 cm−1, respectively. The peak at 1432 cm−1 was assigned to C-O stretch, while the anti-asymmetric stretching vibration of C-O-C appeared at 1027 cm−1. The signals appearing at 593 and 387 cm−1 correspond to the stretching frequencies of Zn-O and Fe-O, respectively. The BET surface area of ZnFe2O4@Chitosan is shown in Figure 1b, which revealed a surface area of 12.96 m2 g−1, total pore volume (at P/Po = 0.900) of 0.109 cm3g−1 and a mean pore diameter of 33.71 nm. The BET isotherm exhibited by ZnFe2O4@Chitosan is of type II, which suggests unrestricted monolayer–multilayer adsorption that is common to mesoporous adsorbents [21]. The XRD diffraction (Figure 1c) showed the most intense peak at 2θ = 35.61° with a plane spacing corresponding to (311), which is the plane previously reported for ZnFe2O4 particles [22] with other planes corresponding to (110), (111), (134), (220), (222), (400), (422), (511), (440), (620), (533), (444), (642), (731) and (800), as seen in the pattern [22,23]. Equation (5) shows an expression from which the crystallite size of ZnFe2O4@Chitosan may be calculated considering its X-ray line broadening from the reflections of (311) and Debye–Scherrer’s formula [24]:
D = K λ β   C o s θ
From Equation (5), D is the average crystallite size of ZnFe2O4@Chitosan, K represents a constant taken as 0.89. λ is the X-ray wavelength (1.5406 Å), while β and θ are the full width of diffraction line at half of the maximum intensity (FWHM) and Bragg’s angle (at peak (311)), respectively [25]. The crystallite size for ZnFe2O4@Chitosan was found to be 35.14 nm. The crystallite size is important in understanding its diffusion properties. Apparently, this can be expressed as [26,27]:
Ʈ = r22D
where Ʈ is the average diffusion time of charge carriers from bulk solution to the surface of ZnFe2O4@Chitosan, and D represents the diffusion coefficient of the charges. According to the expression (Equation (6)), the larger the size of a catalyst, the longer the diffusion time, which means the more susceptible it is to aggregation (recombination effect). Such recombination leads to decreased catalytic property [27,28]. It is important that the crystallite size is small. The crystallite size of ZnFe2O4@Chitosan falls withing the range of previously reported sizes (37 to 45 nm) for spinel ferrite [29], suggesting a good catalyst functional size for ZnFe2O4@Chitosan.
The thermal degradation is shown in Figure 1d, which showed three major losses. The first loss at range 0–180 °C is about 5.58%, which was attributed to a loss of volatile and adsorbed water molecules. This is followed by a second major loss at range 210–415 °C, which is 17.41% of total mass and was attributed to the decomposition of the chitosan structure with loss of H2O, NH3, CO, CO2 and CH3COOH, which was considered to be pyrrolic degradation of chitosan as previously reported [30,31]. Moreover, previous study has shown that the degradation of chitosan can take place by random breaking of the C-O-C skeletal bond [30,31,32,33], which was seen in the FTIR result (Figure 1a) at 1027 cm−1. The third important loss in the range 415–1000 °C accounts for 26.30% loss of the total mass, which may be attributed to loss of CH4 that was considered to have taken place via a dehydrogenation mechanism as previously reported [30,34,35].
The SEM micrograph is presented in Figure 2a, revealing district packs of particles on the surface of ZnFe2O4@Chitosan which may be seen to be homogeneous. The EDS result (Figure 2b) confirms the presence of carbon (c), oxygen (O), nitrogen (N), iron (Fe) and zinc (Zn) in the molecule of ZnFe2O4@Chitosan, while elemental surface mapping is shown in Figure 2c (C1–5).
The magnetic property of ZnFe2O4@Chitosan was investigated using vibration sample magnetometry and the results are presented in Figure 2d with magnetic hysteresis loop, indicating that ZnFe2O4@Chitosan is magnetic. The saturation magnetization is found to be 2.38 emu g−1, which is large enough for magnetic separation for practical applications. Previous study has reported a high saturation magnetization [22,36,37] for ZnFe2O4; however, the observed low saturation magnetization in ZnFe2O4@Chitosan compared to previous reports may be due to the immobilization of ZnFe2O4 on chitosan, which may have altered the inversion degree of ZnFe2O4.
The UV-visible spectrum is shown in Figure 3a, revealing absorbance in the visible region, which suggests that ZnFe2O4@Chitosan may have photocatalytic activity in the visible-light region. The optical bandgap was determined from the Tauc plot method, as shown in Figure 3b; this was determined as described for a transition-type semiconductor (Equation (7):
( h v ) 2 = A h v E g
where hv is the frequency of incident light, A represents the proportionality constant, Eg is the bandgap and α is the absorption coefficient. The bandgap for ZnFe2O4@Chitosan was found to be 2.98 eV, which further corroborates the fact that ZnFe2O4@Chitosan may be active for photodegradation within the visible-light region.

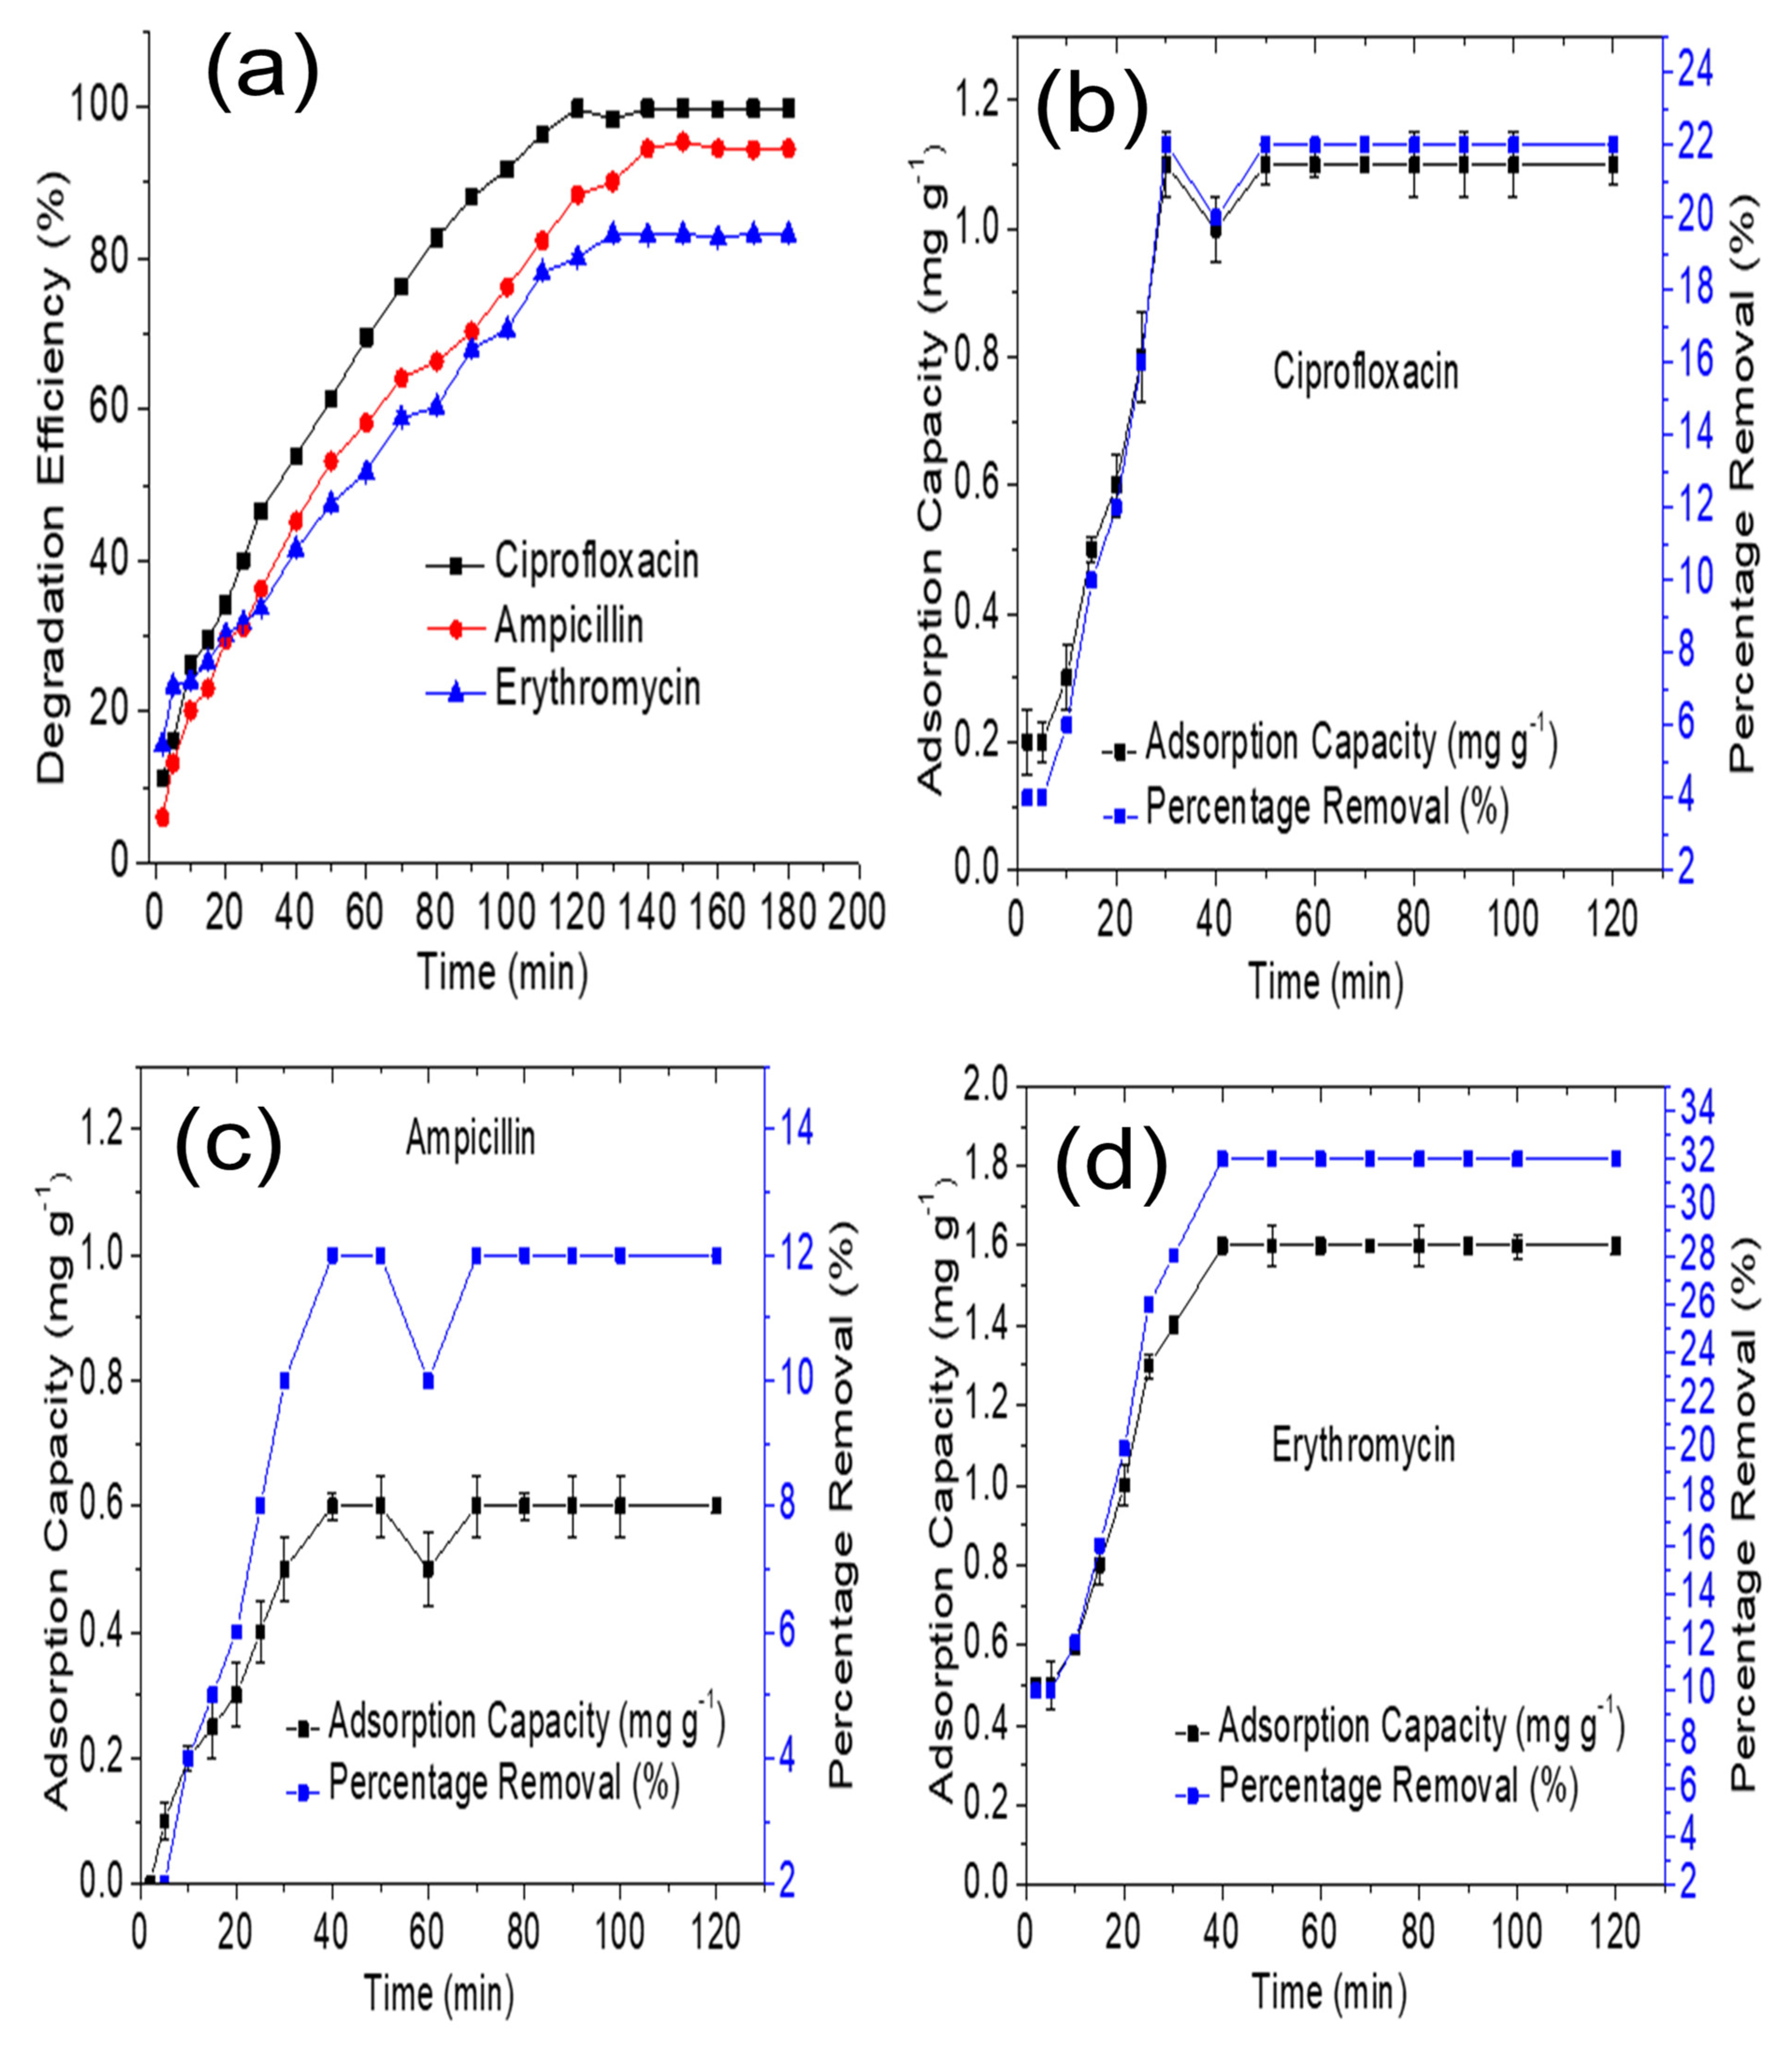
3.2. Photodegradation Study

The time-dependent degradation of CIP, AMP and ERY by ZnFe2O4@Chitosan at a concentration of 5.00 mg L−1 is presented in Figure 4a. The percentage degradation was in the following order of efficiency: CIP (99.80 ± 0.20%) > AMP (94.50 ± 0.10%) > ERY (83.20 ± 0.20%). The photodegradation reached equilibrium after 150 min of treatment. The degradation efficiency exhibited by ZnFe2O4@Chitosan towards the antibiotics might be molecular weight-dependent since the highest efficiency was found in CIP having the lowest molecular weight and the least efficiency found in ERY having the highest molecular weight. The molecular weight is in the increasing order of CIP (331.347 g mol−1) < AMP (349.406 g mol−1) < ERY (733.930 g mol−1). The molecular structures of the antibiotics are shown in Figure 3c–e; the lower the molecular weight, the higher the degradation efficiency expressed by ZnFe2O4@Chitosan. The dark experiment revealed that adsorption was taking place at the same time with the photocatalytic degradation. Therefore, the adsorption capacities as well as the percentage removal with time are presented in Figure 4b–d. The adsorption capacity and percentage removal increased with time and reached equilibrium after 30 min of treatment. The adsorption capacity was 1.1 ± 0.05 mg g−1 in CIP, 0.6 ± 0.05 mg g−1 in AMP, and 1.6 ± 0.02 mg g−1 in ERY, while the percentage removals were 22 ± 0.05, 12 ± 0.05 and 32 ± 0.02% in CIP, AMP and ERY, respectively. The highest adsorption capacity and percentage removal was expressed towards ERY.

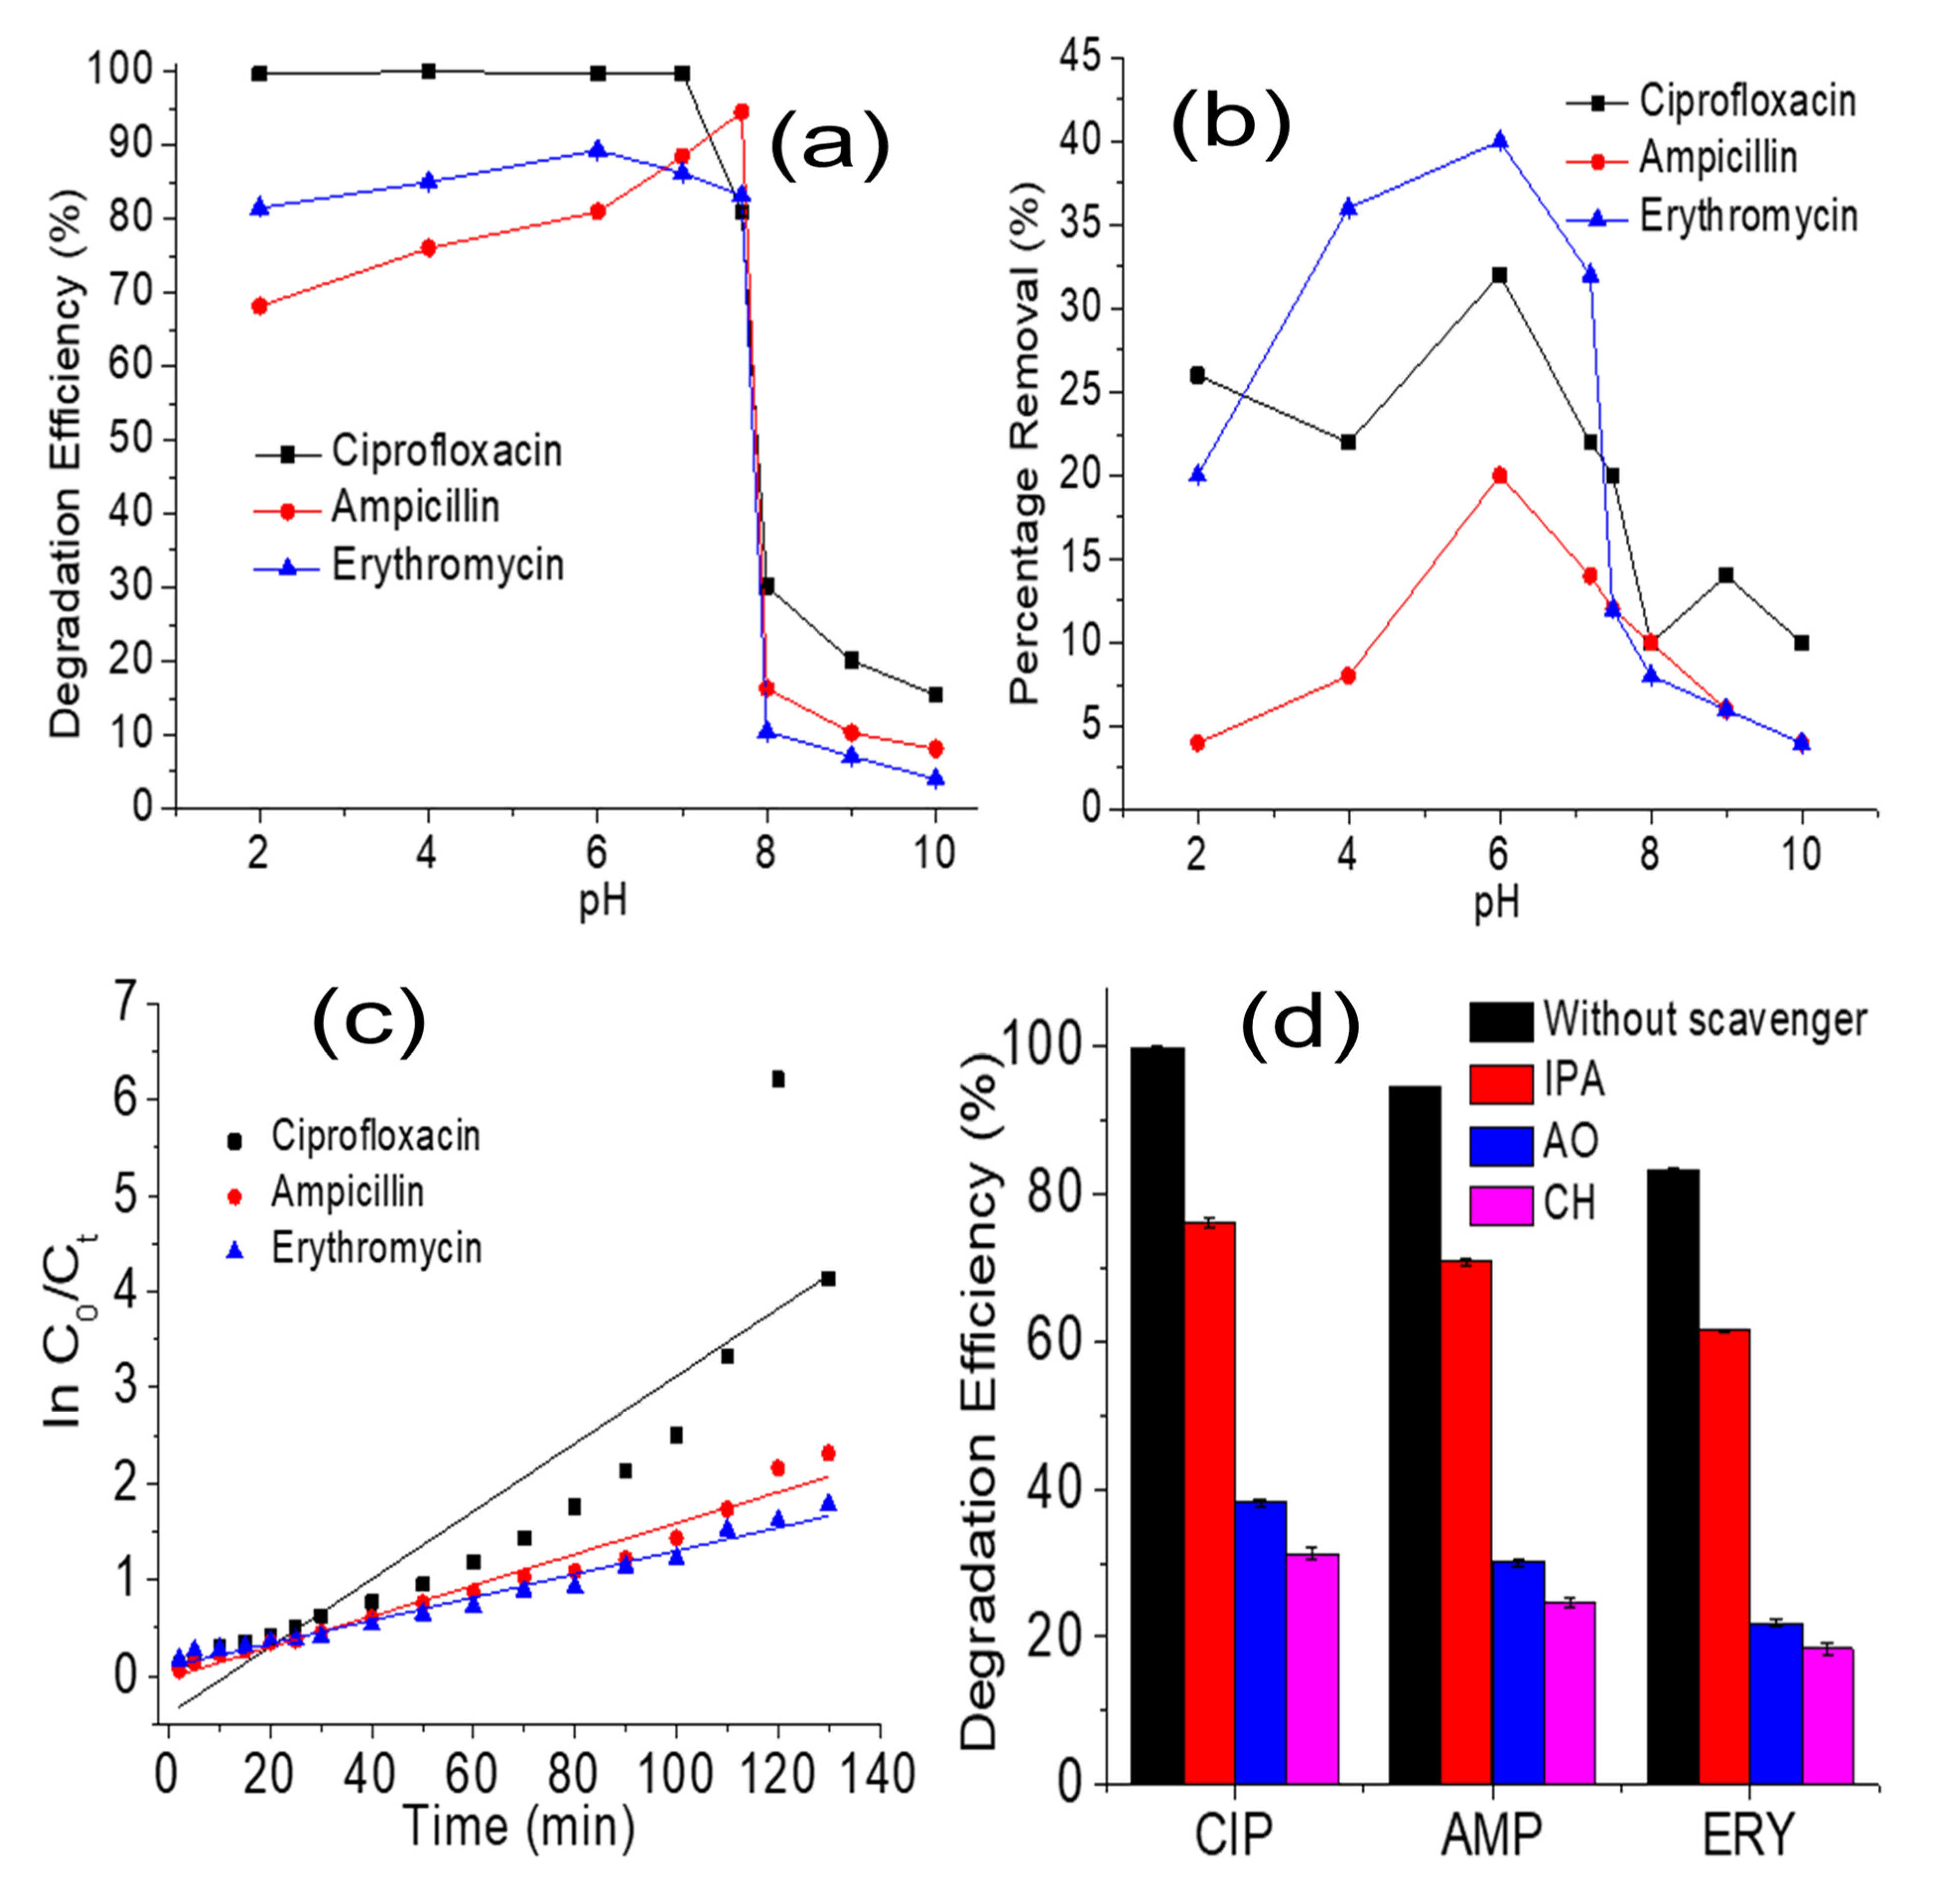
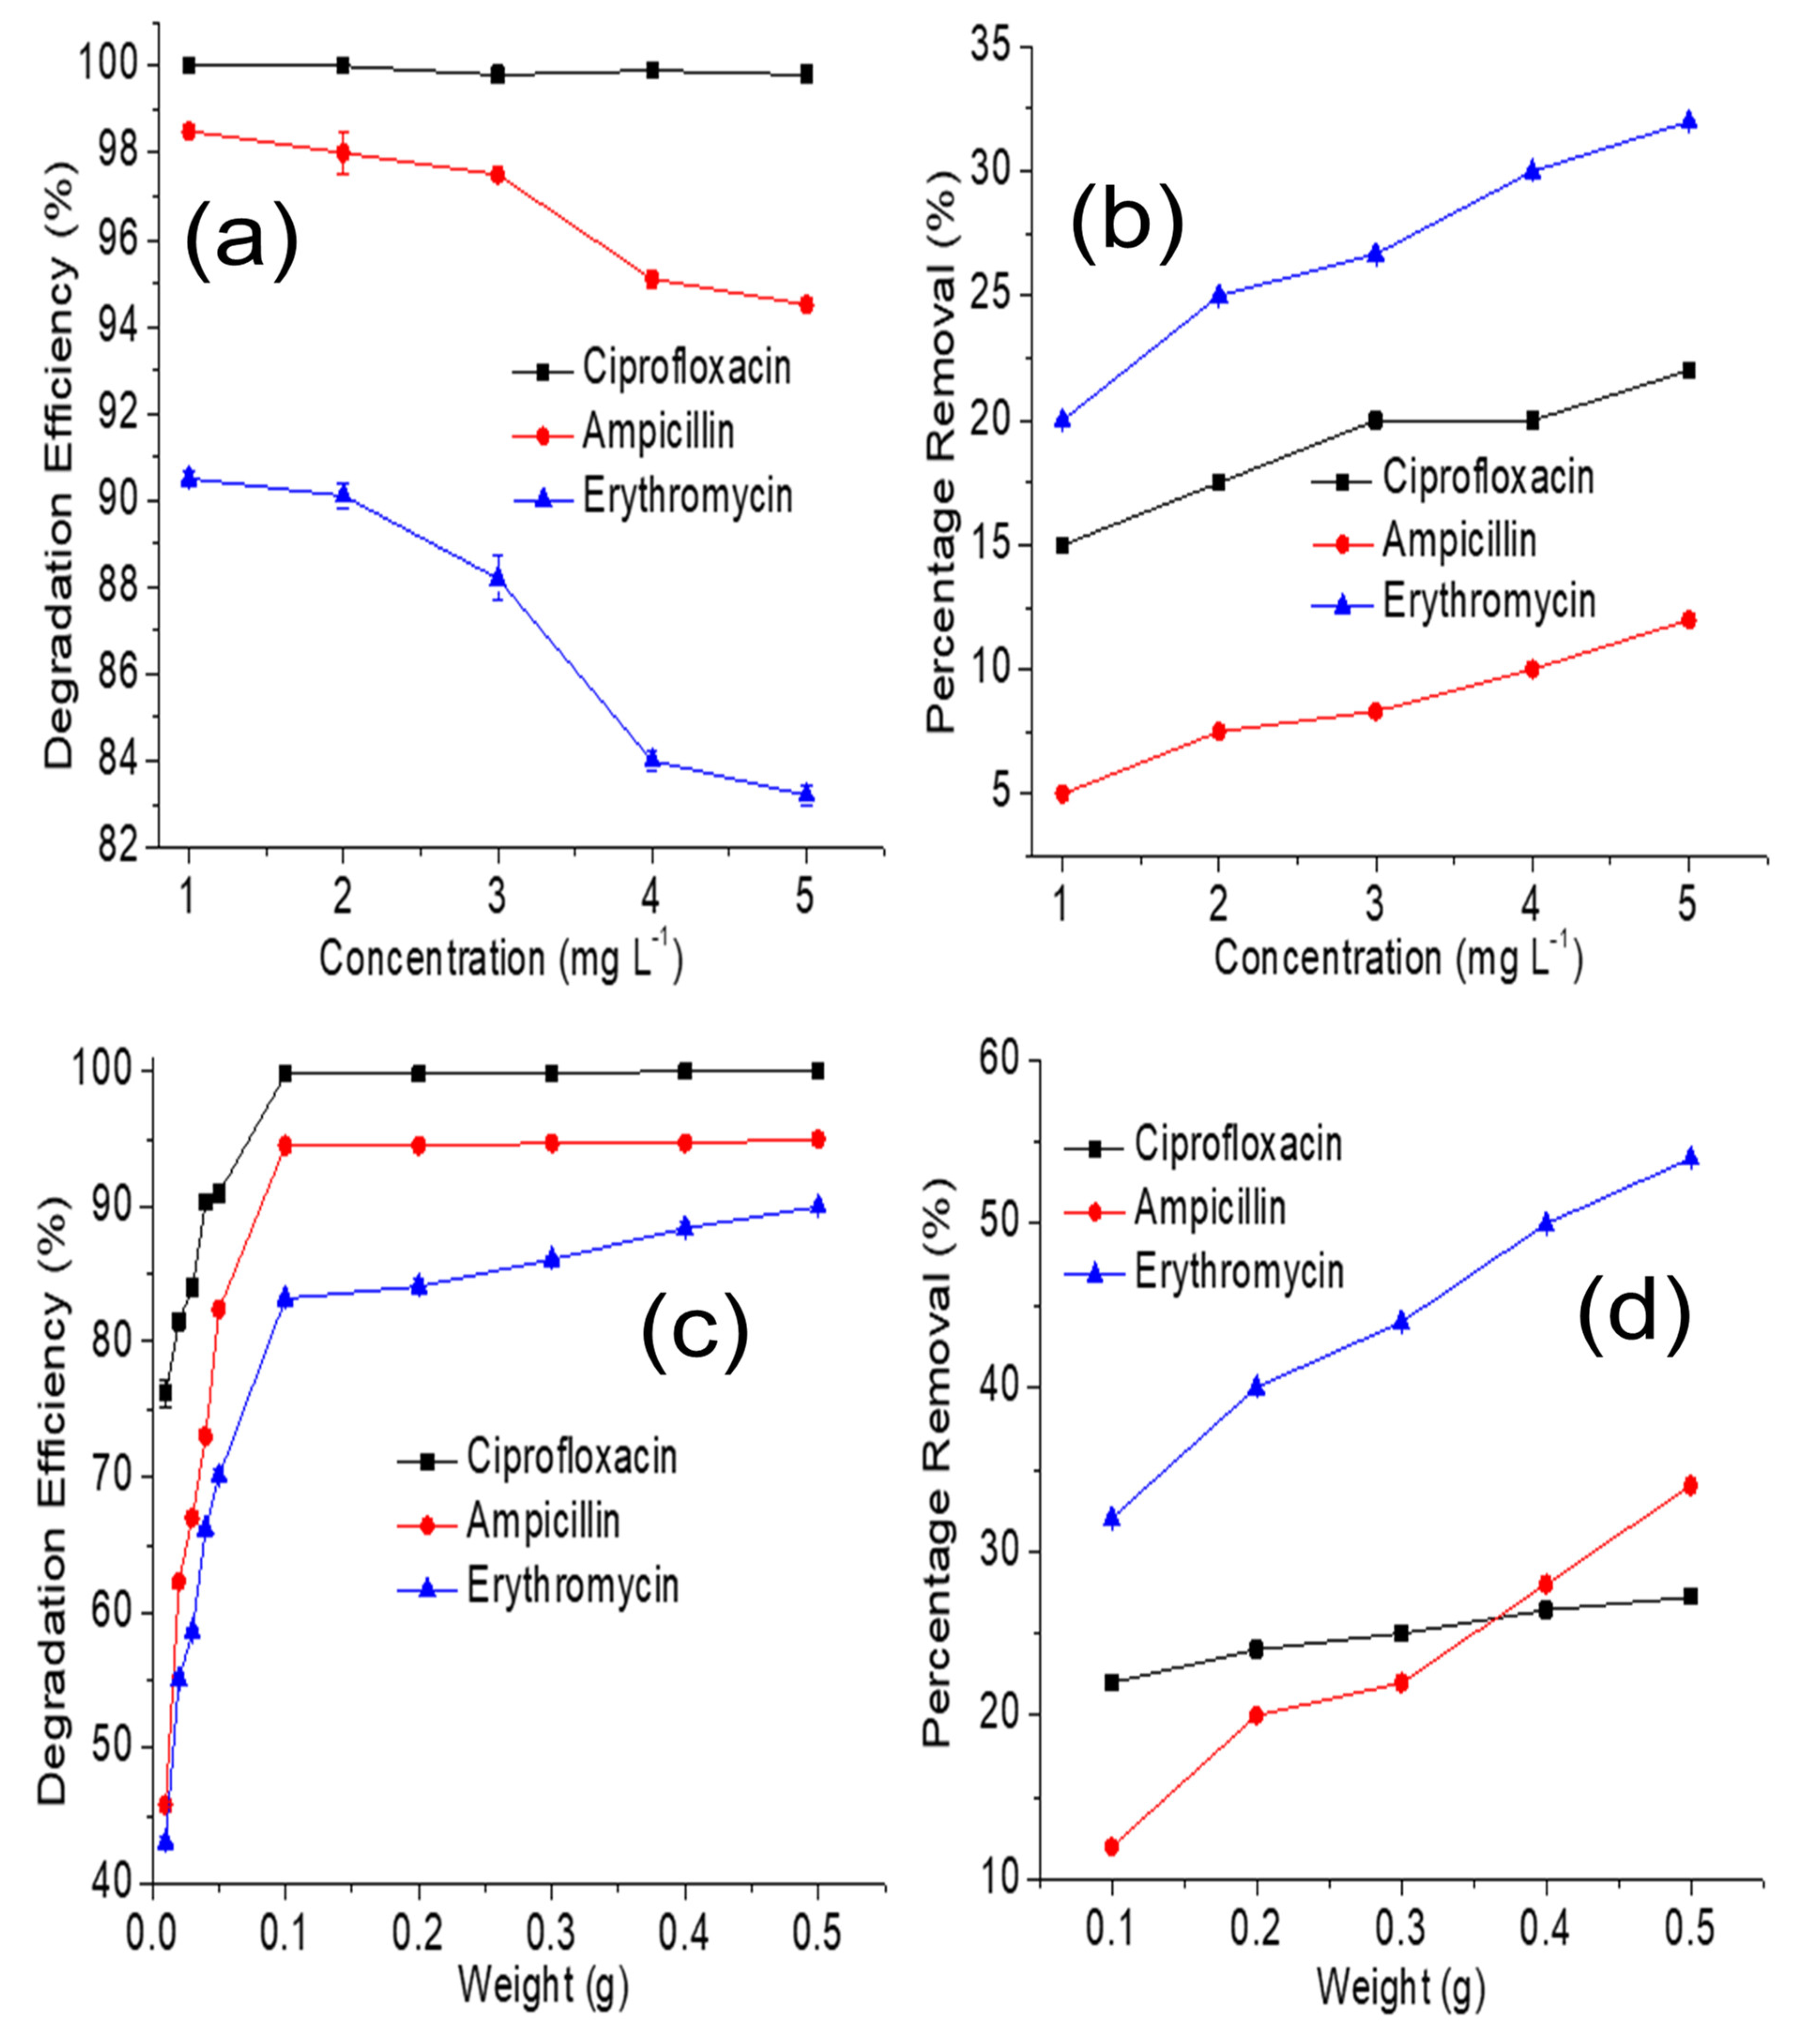
3.3. Effect of Operational Parameters

The effect of concentration (1.00 to 5.00 mg L−1) on degradation efficiency and percentage removal (dark experiment) are presented in Figure 5a,b, respectively. The degradation efficiency increased as concentration reduced from 5.00 to 1.00 mg L−1, which may be due to the reduction in the amount of antibiotic species to be degraded. As these species reduce, ZnFe2O4@Chitosan had lesser work to execute, which resulted in an increase in efficiency. Moreover, when the concentration increases, more degradation products are produced that may occupy the active photodegradation site on ZnFe2O4@Chitosan. Therefore, since adsorption has been confirmed to be taking place from the dark experiment conducted, it becomes evident that, as adsorption takes place, there is the possibility of the photodegradation sites being populated with the adsorbed species as concentration increases, allowing more adsorbate to migrate to the photocatalysis sites on ZnFe2O4@Chitosan. This occurrence will reduce photon penetration or migration to the surface of ZnFe2O4@Chitosan to initiate photocatalytic activities. This incident is capable of reducing the formation of oxidants, which limits the interaction between generated holes and electrons in the conduction band. However, contrary to this, the percentage removal increased with an increase in concentration of the antibiotics, which may be due to the fact that, as the concentration of antibiotics in solution increased, more species were available to interact with the surface of ZnFe2O4@Chitosan for adsorption.
The effect of weight of ZnFe2O4@Chitosan was also examined on the degradation efficiency and the percentage removal, as shown in Figure 5c,d. It was observed in both cases that the performance of ZnFe2O4@Chitosan towards the degradation of CIP, AMP and ERY increased as the weight of ZnFe2O4@Chitosan increased. This observation suggests that, as the weight of ZnFe2O4@Chitosan increased, more active sites were available to initiate photodegradation and adsorption. Solution pH plays an important role in the photodegradation process.
ZnFe2O4@Chitosan expressed high degradation efficiency at low pH values but the degradation efficiency decreased as the pH increases above 7 (Figure 6a,b).
The best pH for the photodegradation study is the acidic pH, which may be due to the fact that during low pH, more H+ ions are available that can react with water to form the hydroxyl radicals to promote the photodegradation process. On the other hand, the adsorption capacity was low at acidic pH (low pH value) but increased as the pH value increased towards 7 (neutral pH value). Interestingly, the percentage removal dropped as the pH value increased from 7 to 10.
The photodegradation of CIP, AMP and ERY by ZnFe2O4@Chitosan was subjected to a pseudo-first-order kinetic model, which can be described as:
I n C o C t = k t
where Co and Ct are the initial and time “t” concentrations of CIP, AMP or ERY, respectively. The pseudo-first-order rate constant was calculated from the slope of the graph of 1nCo/Ct versus time (Figure 6c) and represented as k, while t is the irradiation time. The pseudo-first-order rate constant for CIP is 0.035 min−1, AMP is 0.016 min−1 and ERY is 0.012 min−1. The values obtained for the pseudo-first-order rate constant is also reflective of the degradation efficiency exhibited by ZnFe2O4@Chitosan towards the antibiotics. The highest degradation efficiency was towards CIP (99.80 ± 0.20%), with the highest rate constant compared to other antibiotics. The higher the rate constant, the faster the process is expected with high degradation efficiency.

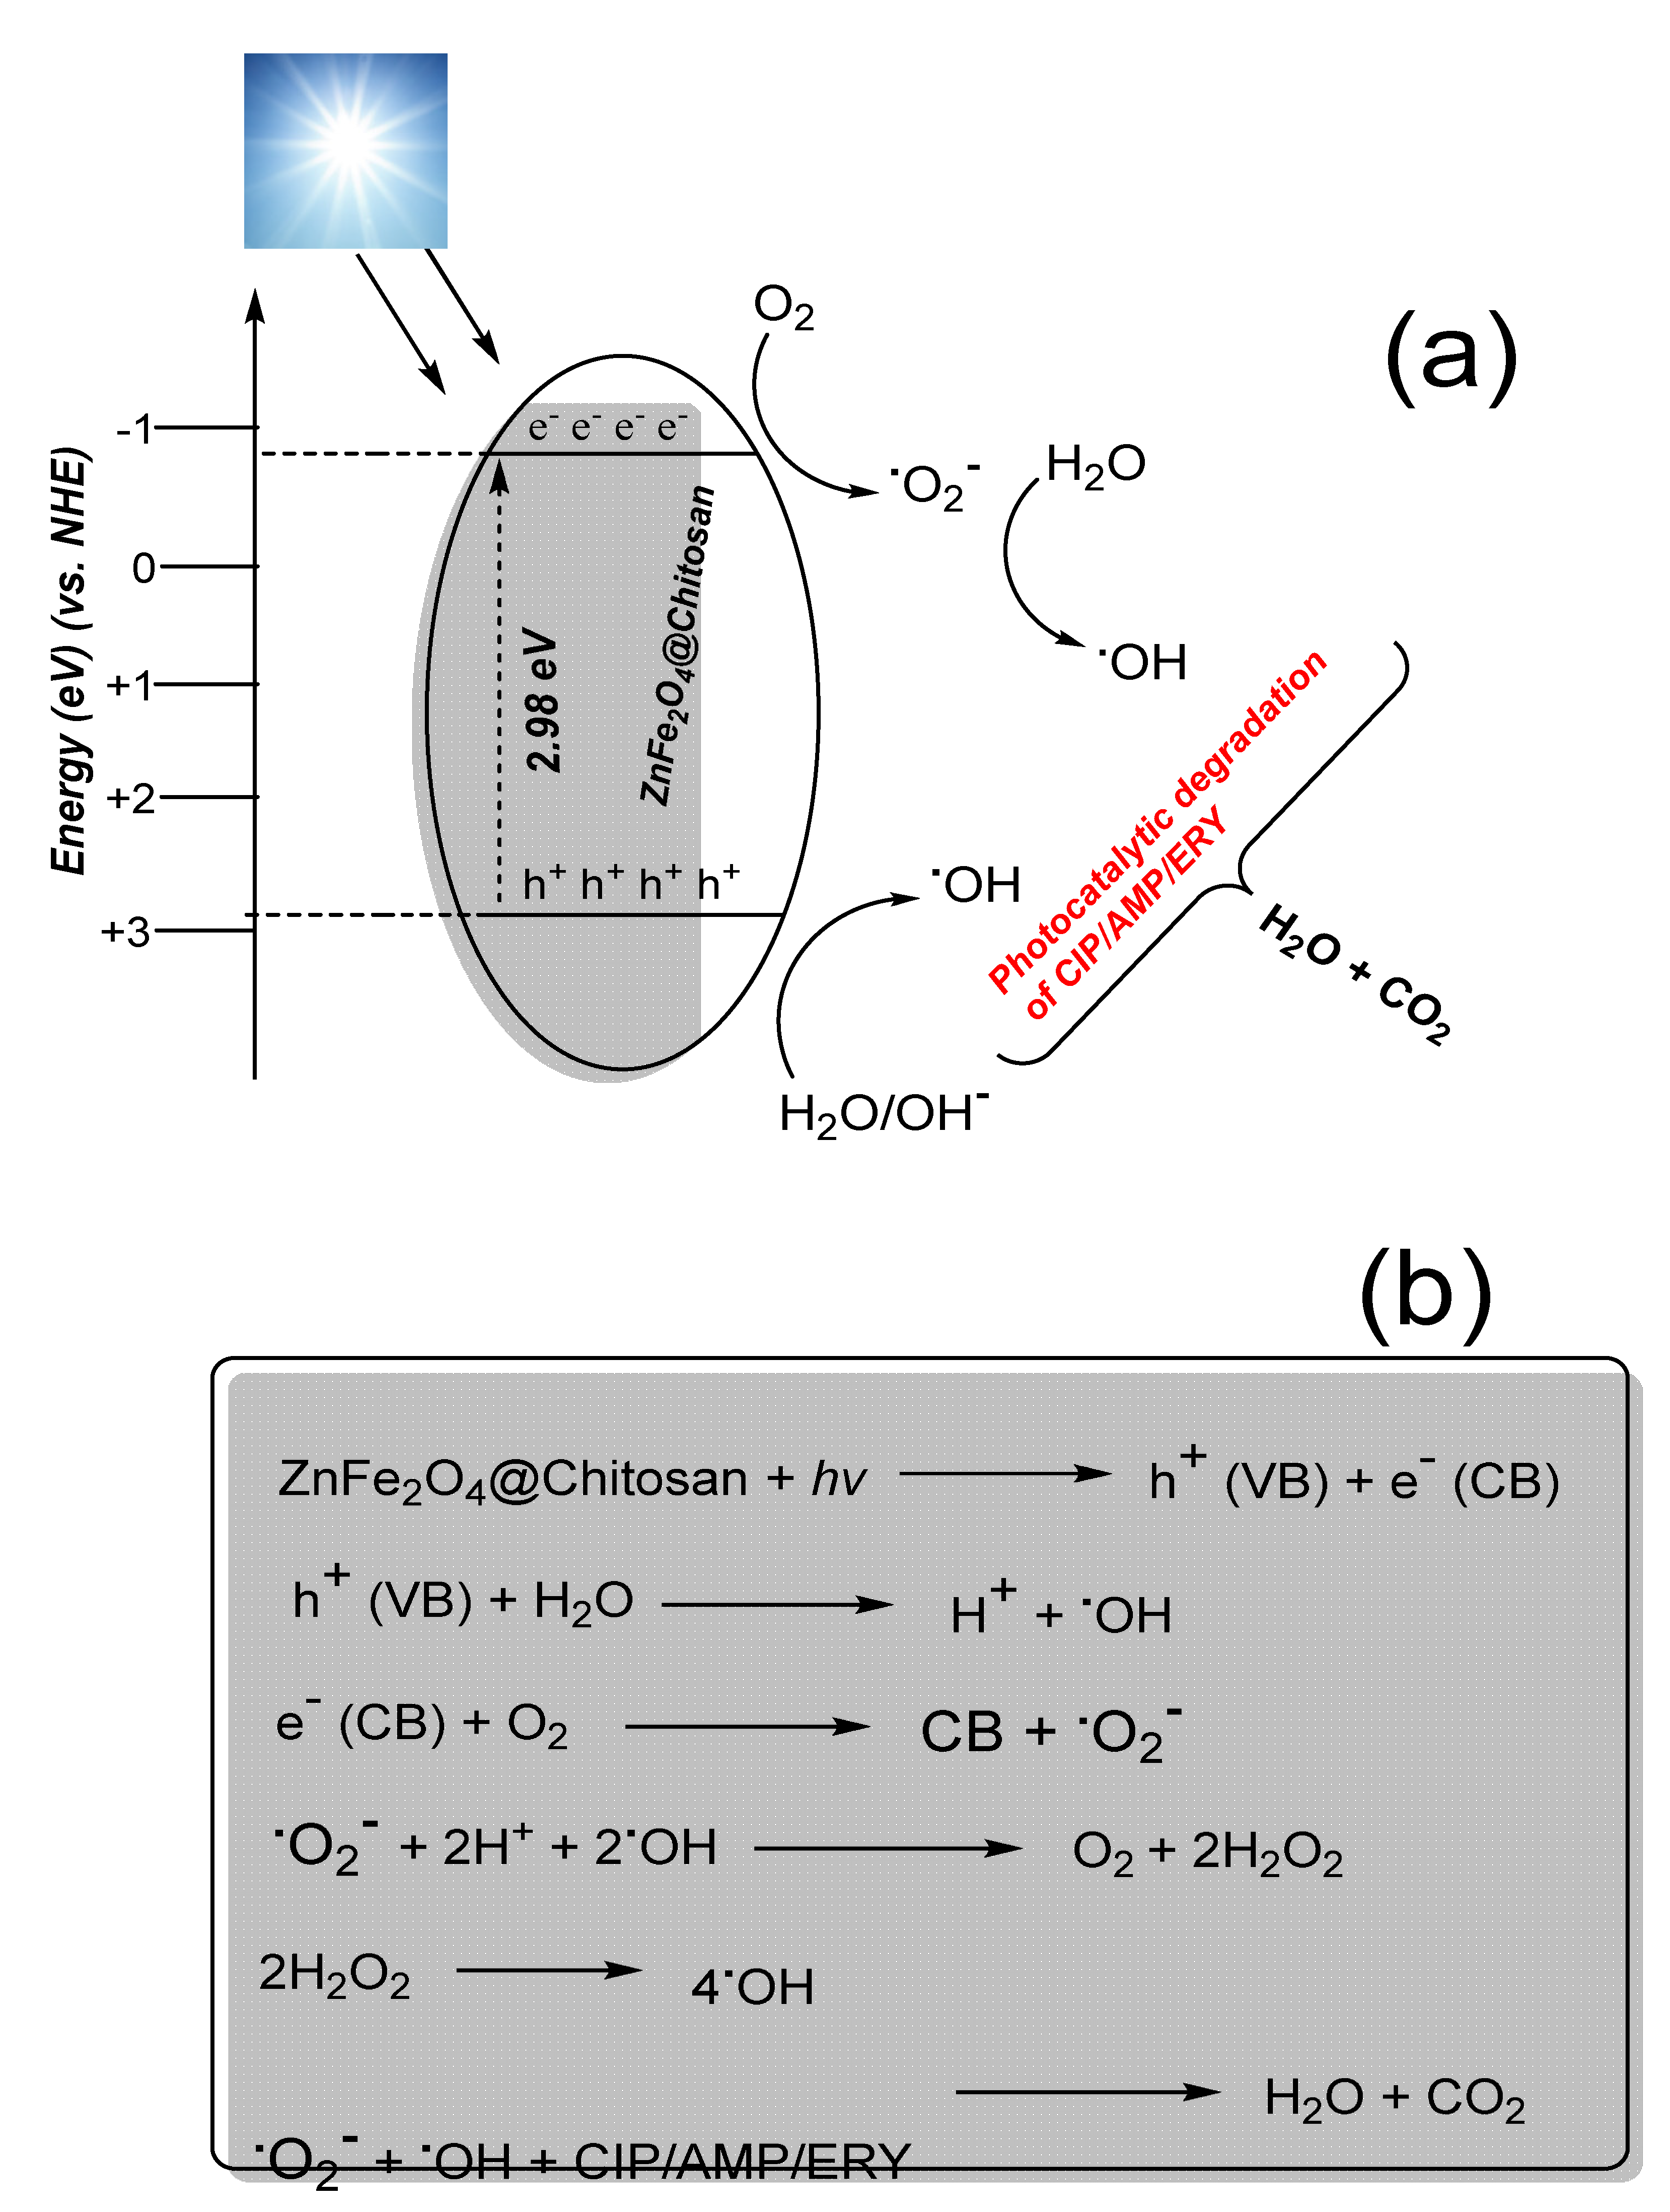
3.4. Proposed Mechanism for the Photodegradation of CIP, AMP and ERY by ZnFe2O4@Chitosan

Most photocatalytic degradation processes are known to be via reactive oxygen species (ROS) generation within the solution to be degraded. Therefore, the photocatalytic degradation exhibited by ZnFe2O4@Chitosan towards CIP, AMP and ERY was evaluated in the presence of IPA to scavenge hydroxyl radical (OH·), AO to scavenge hole (h+) and CH to scavenge superoxide ion radical (·O2), as previously reported [38]. The results obtained are presented in Figure 6d. It was observed that the photodegradation efficiency of ZnFe2O4@Chitosan was reduced in the presence of IPA, AO and CH, indicating that they all played roles in the degradation of CIP, AMP and ERY by ZnFe2O4@Chitosan. When CH was introduced into the degradation medium, there was a drastic reduction in the degradation efficiency from 99.80 ± 0.20% to 31.20 ± 0.80% in CIP, 94.50 ± 0.10% to 24.70 ± 0.50% in AMP and 83.20 ± 0.20% to 18.40 ± 0.70% in ERY. A similar observation also took place when AO was introduced into the medium, which suggested the scavenging of hole by AO and superoxide ion radicals by CH during the photodegradation process. This drastic reduction is an indication that both hole and superoxide ion radicals played an important role in the photodegradation process by ZnFe2O4@Chitosan.
Furthermore, the reduction in efficiency when IPA was introduced also confirmed that hydroxyl and superoxide ion radicals must have been generated from the photochemical reactions between the hole (h+) and photoexcited electrons (e) with H2O and O2 molecules (Figure 7). As described in Figure 7a, during the process, ZnFe2O4@Chitosan may have absorbed visible-light energy greater than its bandgap, leading to the generation of h+ in the valence band and e in the conduction band. As long as the recombination of h+ and e is hindered, the ROS continues to promote the degradation of CIP, AMP or ERY, as described in Figure 7b.

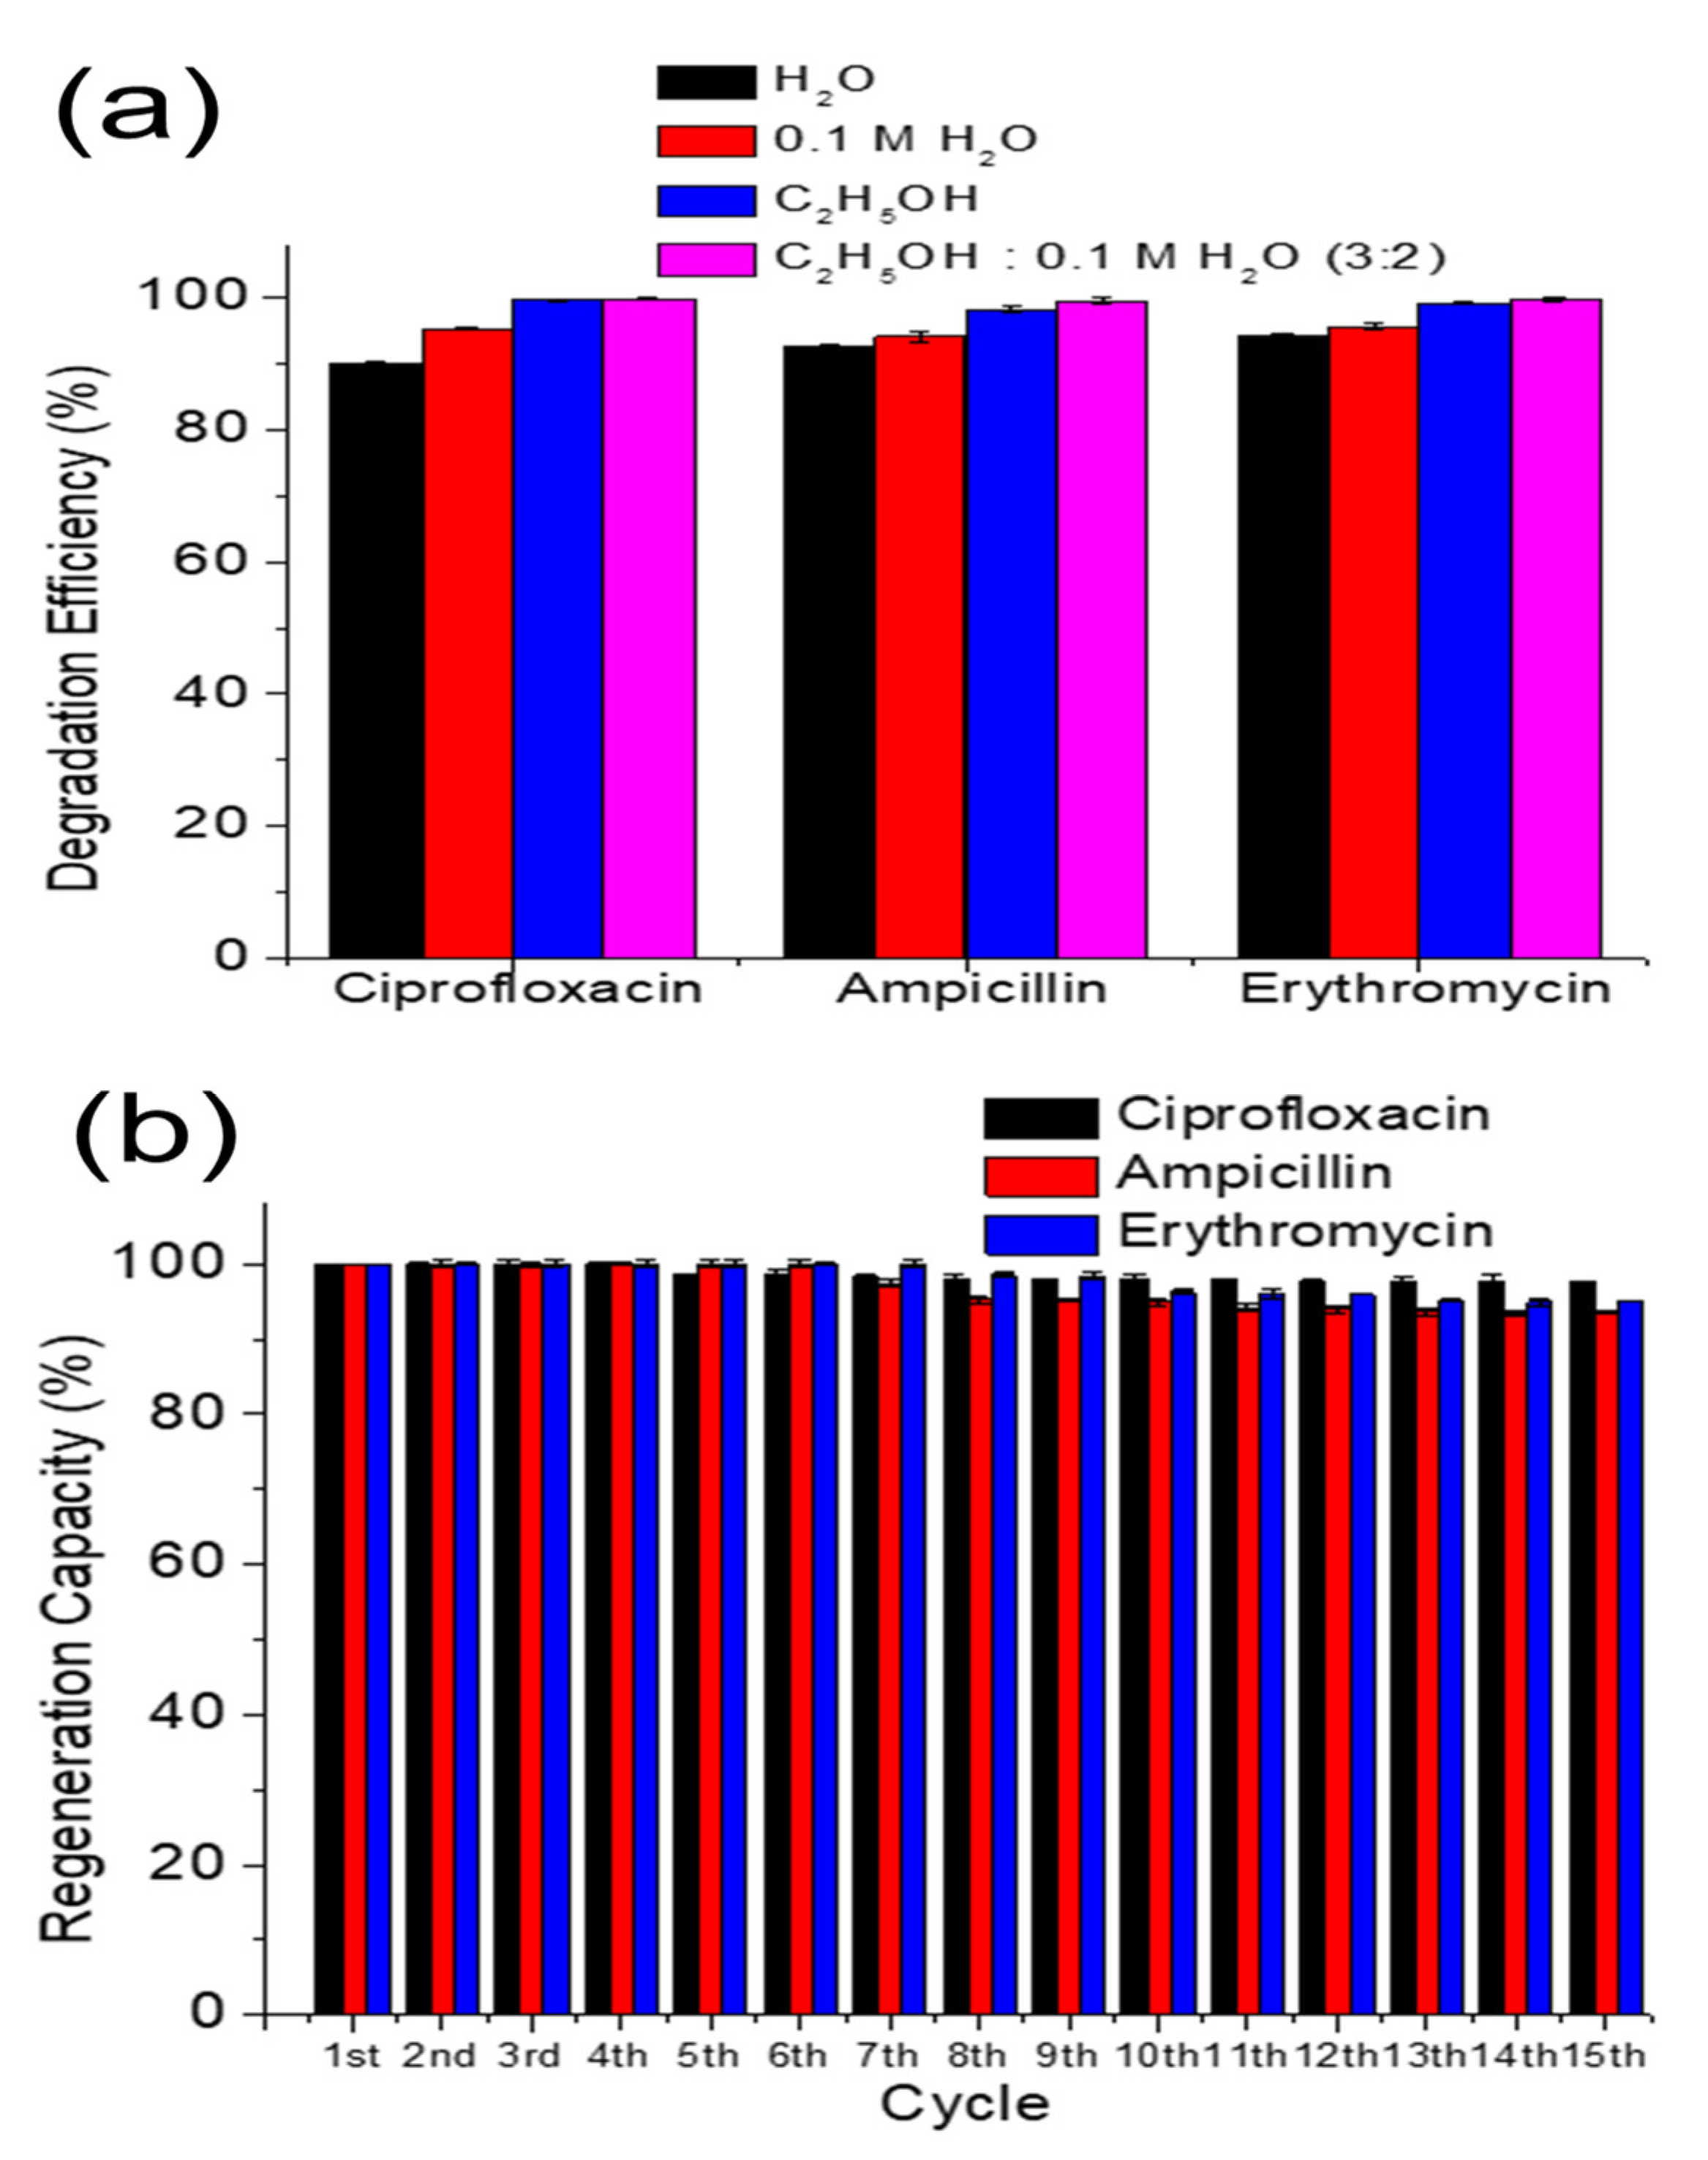
3.5. Re-Useability and Stability of ZnFe2O4@Chitosan

The re-useability and stability of a photocatalyst plays an important role in determining its economic viability. In this regard, ZnFe2O4@Chitosan was regenerated using different solvent systems based on the solubility of CIP, AMP and ERY. Solvents used included deionized water, 0.1 M HCl, ethanol or a mixture of ethanol and 0.1 M HCl (3:2). However, a mixture of ethanol and 0.1 M HCl (3:2) gave better results in regenerating ZnFe2O4@Chitosan for re-use (Figure 8a). Therefore, at the end of each cycle, ZnFe2O4@Chitosan was washed with a mixture of ethanol and 0.1 M HCl (3:2), dried and re-used for the photodegradation of CIP, AMP or ERY. The cycle was repeated until the 15th cycle and the regeneration capacity for 15 successive cycles is shown in Figure 8b. Interestingly, the capacity was 97.60 ± 0.10% for CIP, 93.50 ± 0.20% for AMP and 95.00 ± 0.10% for ERY at the 15th cycle, which suggests a high stability of ZnFe2O4@Chitosan as a viable photocatalyst for the photodegradation of CIP, AMP and ERY. The ICP–OES results revealed 0.08 ppm of Fe and 0.05 ppm of Zn in the solution after the 15th cycle, which suggests that the ZnFe2O4 particles leached into solution during the photodegradation process. However, the leached amount is within the permissible limits for Fe (0.10 ppm) and Zn (5.00 ppm) in drinking water. The results obtained in this study were also compared with a catalyst previously reported, as shown in Table 1. ZnFe2O4@Chitosan compared favourably with a previously reported photocatalyst for the degradation of CIP, AMP and ERY. Distinctly, ZnFe2O4@Chitosan exhibited an encouraging stability with capacity above 90%, even at the 15th regeneration cycle for re-use, which demonstrates the economic viability or advantage of ZnFe2O4@Chitosan over most recently reported photocatalysts it was compared with in the literature. The efficiency towards the degradation of CIP exhibited by ZnFe2O4@Chitosan is higher than values recently reported for Cu2O/MoS2/rGO (Selvamani et al. 2021) and ZnO [39]. The use of ZnFe2O4@Chitosan for photodegradation was conducted in the visible-light regions, which shows that its use does not require an additional cost for a UV source, unlike in the case of some of the previous studies [40,41,42].

4. Conclusions

ZnFe2O4@Chitosan was prepared by simple chemical process and applied in the photodegradation of CIP, AMP and ERY in aqueous solution. The results from the FTIR of ZnFe2O4@Chitosan revealed prominent peaks, suggesting its synthesis, while signals from XRD showed a diffraction pattern confirming the synthesis of ZnFe2O4@Chitosan with a crystallite size of 35.14 nm. The VSM result revealed a saturation magnetization of 2.38 emu g−1, which is large enough for magnetic separation for practical applications. The study showed that both photodegradation and adsorption were taking place at the same time with the percentage degradation efficiency in the order CIP (99.80 ± 0.20%) > AMP (94.50 ± 0.10%) > ERY (83.20 ± 0.20%). ZnFe2O4@Chitosan exhibited an encouraging stability with capacity above 90%, even at the 15th regeneration cycle. The photodegradation mechanism suggested the role of hydroxyl and superoxide ion radicals. The study revealed ZnFe2O4@Chitosan to be a promising catalyst for the degradation of CIP, AMP and ERY in aqueous solution.

Author Contributions

Formal analysis: N.A.H.M., A.A., R.N.S. Investigations: N.A.H.M., A.A., R.N.S. Methodology: N.A.H.M., A.A., R.N.S., S.E. Software: N.A.H.M., R.N.S. Resources: N.A.H.M., A.A., R.N.S. Supervision: A.A., R.N.S., S.E. Writing—original draft: A.A. Writing—review& editing: N.A.H.M., A.A., R.N.S., S.E. All authors have read and agreed to the published version of the manuscript.

Funding

This research was funded by the Joint Academy of Scientific Research and Technology – Bibliotheca Alexandrina (ASRT-BA) Research Grants Program (project No. 1325).

Data Availability Statement

Not applicable.

Acknowledgments

The authors appreciate the support from the Joint Academy of Scientific Research and Technology—Bibliotheca Alexandrina (ASRT-BA) Research Grants Program (project No. 1325), and are also grateful to the Department of Chemistry, University of Cambridge, UK, for analysis.

Conflicts of Interest

The authors declare no conflict of interest.

References

  1. Hanna, N.; Sun, P.; Sun, Q.; Li, X.; Yang, X.; Ji, X.; Zou, H.; Ottoson, J.; Nilsson, L.E.; Berglund, B.; et al. Presence of antibiotic residues in various environmental compartments of Shandong province in eastern China: Its potential for resistance development and ecological and human risk. Environ. Int. 2018, 114, 131–142. [Google Scholar] [CrossRef] [PubMed]
  2. Zalewska, M.; Błażejewska, A.; Czapko, A.; Popowska, M. Antibiotics and Antibiotic Resistance Genes in Animal Manure–Consequences of Its Application in Agriculture. Front. Microbiol. 2021, 12, 610656. [Google Scholar] [CrossRef] [PubMed]
  3. Kumar, M.; Jaiswal, S.; Sodhi, K.K.; Shree, P.; Singh, D.K.; Agrawal, P.K.; Shukla, P. Antibiotics bioremediation: Perspectives on its ecotoxicity and resistance. Environ. Int. 2019, 124, 448–461. [Google Scholar] [CrossRef] [PubMed]
  4. Lv, J.; Zhang, L.; Chen, Y.; Ye, B.; Han, J.; Jin, N. Occurrence and distribution of pharmaceuticals in raw, finished, and drinking water from seven large river basins in China. J. Water Health 2019, 17, 477–489. [Google Scholar] [CrossRef]
  5. Lyu, J.; Chen, Y.; Zhang, L. Antibiotics in Drinking Water and Health Risks—China, 2017. China CDC Wkly. 2020, 2, 413–417. [Google Scholar] [CrossRef]
  6. Azanu, D.; Styrishave, B.; Darko, G.; Weisser, J.J.; Abaidoo, R.C. Occurrence and risk assessment of antibiotics in water and lettuce in Ghana. Sci. Total Environ. 2018, 622–623, 293–305. [Google Scholar] [CrossRef]
  7. Guruge, K.S.; Goswami, P.; Tanoue, R.; Nomiyama, K.; Wijesekara, R.; Dharmaratne, T.S. First nationwide investigation and environmental risk assessment of 72 pharmaceuticals and personal care products from Sri Lankan surface waterways. Sci. Total Environ. 2019, 690, 683–695. [Google Scholar] [CrossRef]
  8. Lorenzo, P.; Adriana, A.; Jessica, S.; Carles, B.; Marinella, F.; Marta, L.; Luis, B.J.; Pierre, S. Antibiotic resistance in urban and hospital wastewaters and their impact on a receiving freshwater ecosystem. Chemosphere 2018, 206, 70–82. [Google Scholar] [CrossRef]
  9. Tran, N.H.; Hoang, L.; Nghiem, L.D.; Nguyen, N.M.H.; Ngo, H.H.; Guo, W.; Trinh, Q.T.; Mai, N.H.; Chen, H.; Nguyen, D.D.; et al. Occurrence and risk assessment of multiple classes of antibiotics in urban canals and lakes in Hanoi, Vietnam. Sci. Total Environ. 2019, 692, 157–174. [Google Scholar] [CrossRef]
  10. Gholami, P.; Khataee, A.; Soltani, R.D.C.; Dinpazhoh, L.; Bhatnagar, A. Photocatalytic degradation of gemifloxacin antibiotic using Zn-Co-LDH@biochar nanocomposite. J. Hazard. Mater. 2020, 382, 121070. [Google Scholar] [CrossRef]
  11. Khaledian, H.R.; Zolfaghari, P.; Elhami, V.; Aghbolaghy, M.; Khorram, S.; Karimi, A.; Khataee, A. Modification of immobilized titanium dioxide nanostructures by argon plasma for photocatalytic removal of organic dyes. Molecules 2019, 24, 383. [Google Scholar] [CrossRef]
  12. Zhang, S.; Khan, I.; Qin, X.; Qi, K.; Liu, Y.; Bai, S. Construction of 1D Ag-AgBr/AlOOH plasmonic photocatalyst for degradation of tetracycline hydrochloride. Front. Chem. 2020, 8, 117. [Google Scholar] [CrossRef]
  13. Yang, X.; Chen, Z.; Zhao, W.; Liu, C.; Qian, X.; Zhang, M.; Wei, G.; Khan, E.; Ng, Y.H.; Ok, Y.S. Recent advances in photodegradation of antibiotic residues in water. Chem. Eng. J. 2021, 405, 126806. [Google Scholar] [CrossRef]
  14. Elmolla, E.S.; Chaudhuri, M. Degradation of amoxicillin, ampicillin and cloxacillin antibiotics in aqueous solution by the UV/ZnO photocatalytic process. J. Hazard. Mater. 2010, 173, 445–449. [Google Scholar] [CrossRef]
  15. Amariei, G.; Valenzuela, L.; Iglesias-Juez, A.; Rosal, R.; Visa, M. ZnO-functionalized fly-ash based zeolite for ciprofloxacin antibiotic degradation and pathogen inactivation. J. Environ. Chem. Eng. 2022, 10, 107603. [Google Scholar] [CrossRef]
  16. Mishra, S.; Kumar, P.; Samanta, S.K. Microwave Catalytic Degradation of Antibiotic Molecules by 2D Sheets of Spinel Nickel Ferrite. Ind. Eng. Chem. Res. 2020, 59, 15839–15847. [Google Scholar] [CrossRef]
  17. Becker, A.; Kirchberg, K.; Marschall, R. Magnesium ferrite (MgFe2O4) nanoparticles for photocatalytic antibiotics degradation. Z. Phys. Chem. 2020, 234, 645–654. [Google Scholar] [CrossRef]
  18. Li, Y.; He, J.; Zhang, K.; Hong, P.; Wang, C.; Kong, L.; Liu, J. Oxidative degradation of sulfamethoxazole antibiotic catalyzed by porous magnetic manganese ferrite nanoparticles: Mechanism and by-products identification. J. Mater. Sci. 2020, 55, 13767–13784. [Google Scholar] [CrossRef]
  19. Yi, H.; Lai, C.; Almatrafi, E.; Huo, X.; Qin, L.; Fu, Y.; Zhou, C.; Zeng, Z.; Zeng, G. Efficient antibiotics removal via the synergistic effect of manganese ferrite and MoS2. Chemosphere 2022, 288, 132494. [Google Scholar] [CrossRef]
  20. Zhong, Y.; Shih, K.; Diao, Z.; Song, G.; Su, M.; Hou, L.; Chen, D.; Kong, L. Peroxymonosulfate activation through LED-induced ZnFe2O4 for levofloxacin degradation. Chem. Eng. J. 2021, 417, 129225. [Google Scholar] [CrossRef]
  21. Senapati, K.K.; Roy, S.; Borgohain, C.; Phukan, P. Palladium nanoparticle supported on cobalt ferrite: An efficient magnetically separable catalyst for ligand free Suzuki coupling. J. Mol. Catal. A Chem. 2012, 352, 128–134. [Google Scholar] [CrossRef]
  22. Yao, C.; Zeng, Q.; Goya, G.; Torres, T.; Liu, J.; Wu, H.; Ge, M.; Zeng, Y.; Wang, Y.; Jiang, J. ZnFe2O4 nanocrystals: Synthesis and magnetic properties. J. Phys. Chem. C 2007, 111, 12274–12278. [Google Scholar] [CrossRef]
  23. Abbasian, A.R.; Afarani, M.S. One-step solution combustion synthesis and characterization of ZnFe2O4 and ZnFe1.6O4 nanoparticles. Appl. Phys. A 2019, 125, 721. [Google Scholar] [CrossRef]
  24. Hammond, C. The Basics of Crystallography and Diffraction; Oxford University Press: New York, NY, USA, 1997. [Google Scholar]
  25. Gherca, D.; Pui, A.; Cornei, N.; Cojocariu, A.; Nica, V.; Caltun, O. Synthesis, characterization and magnetic properties of MFe2O4 (M=Co, Mg, Mn, Ni) nanoparticles using ricin oil as capping agent. J. Magn. Magn. Mater. 2012, 324, 3906–3911. [Google Scholar] [CrossRef]
  26. Bell, A.T. The impact of nanoscience on heterogeneous catalysis. Science 2013, 299, 1688–1691. [Google Scholar] [CrossRef]
  27. Shang, M.; Wang, W.; Sun, S.; Zhou, L.; Zhang, L. Bi2WO6 nanocrystals with high photocatalytic activities under visible light. The J. Phys. Chem. C 2008, 112, 10407–10411. [Google Scholar] [CrossRef]
  28. Hagfeldt, A.; Graetzel, M. Light-induced redox reactions in nanocrystalline systems. Chem. Rev. 1995, 95, 49–68. [Google Scholar] [CrossRef]
  29. Nadeem, K.; Shahid, M.; Mumtaz, M. Competing crystallite size and zinc concentration in silica coated cobalt ferrite nanoparticles. Prog. Nat. Sci. Mat. Intern. 2014, 24, 199–204. [Google Scholar] [CrossRef]
  30. Corazzari, I.; Nisticò, R.; Turci, F.; Faga, M.G.; Franzoso, F.; Tabasso, S.; Magnacca, G. Advanced physico-chemical characterization of chitosan by means of TGA coupled on-line with FTIR and GCMS: Thermal degradation and water adsorption capacity. Polym. Degrad. Stab. 2015, 112, 1–9. [Google Scholar] [CrossRef]
  31. De Britto, D.; Campana-Filho, S.P. Kinetics of the thermal degradation of chitosan. Thermochim. Acta 2007, 465, 73–82. [Google Scholar] [CrossRef]
  32. Avetta, P.; Nisticò, R.; Faga, M.G.; D’Angelo, D.; Boot, E.A.; Lamberti, R.; Martorana, S.; Calza, P.; Fabbri, D.; Magnacca, G. Hernia-repair prosthetic devices functionalised with chitosan and ciprofloxacin coating: Controlled release and antibacterial activity. J. Mater. Chem. B 2014, 2, 5287–5294. [Google Scholar] [CrossRef]
  33. Hilding, J.; Grulke, E.A.; Sinnott, S.B.; Qian, D.; Andrews, R.; Jagtoyen, M. Sorption of Butane on Carbon Multiwall Nanotubes at Room Temperature. Langmuir 2001, 17, 7540–7544. [Google Scholar] [CrossRef]
  34. De Britto, D.; Campana-Filho, S.P. A kinetic study on the thermal degradation of N,N,N-trimethylchitosan. Polym. Degrad. Stab. 2004, 84, 353–361. [Google Scholar] [CrossRef]
  35. Zeng, L.; Qin, C.; Wang, L.; Li, W. Volatile compounds formed from the pyrolysis of chitosan. Carbohydr. Polym. 2011, 83, 1553–1557. [Google Scholar] [CrossRef]
  36. Xu, Y.; Wu, S.; Li, X.; Huang, Y.; Wang, Z.; Han, Y.; Wu, J.; Meng, H.; Zhang, X. Synthesis, characterization, and photocatalytic degradation properties of ZnO/ZnFe2O4 magnetic heterostructures. New J. Chem. 2017, 41, 15433–15438. [Google Scholar] [CrossRef]
  37. Xue, H.; Li, Z.; Wang, X.; Fu, X. Facile synthesis of nanocrystalline zinc ferrite via a self-propagating combustion method. Mater. Lett. 2007, 61, 347–350. [Google Scholar] [CrossRef]
  38. Sharma, A.; Dutta, R.K. Se-doped CuO NPs/H2O2/UV as a highly efficient and sustainable photo-Fenton catalytic system for enhanced degradation of 4-bromophenol. J. Clean. Prod. 2018, 185, 464–475. [Google Scholar] [CrossRef]
  39. Ulyankina, A.; Molodtsova, T.; Gorshenkov, M.; Leontyev, I.; Zhigunov, D.; Konstantinova, E.; Lastovina, T.; Tolasz, J.; Henych, J.; Licciardello, N.; et al. Photocatalytic degradation of ciprofloxacin in water at nano-ZnO prepared by pulse alternating current electrochemical synthesis. J. Water Process Eng. 2021, 40, 101809. [Google Scholar] [CrossRef]
  40. Al-Musawi, T.J.; Rajiv, P.; Mengelizadeh, N.; Arghavan, F.S.; Balarak, D. Photocatalytic efficiency of CuNiFe2O4 nanoparticles loaded on multi-walled carbon nanotubes as a novel photocatalyst for ampicillin degradation. J. Mol. Liq. 2021, 337, 116470. [Google Scholar] [CrossRef]
  41. Alalm, M.G.; Ookawara, S.; Fukushi, D.; Sato, A.; Tawfik, A. Improved WO3 photocatalytic efficiency using ZrO2 and Ru for the degradation of carbofuran and ampicillin. J. Hazard. Mater. 2016, 302, 225–231. [Google Scholar] [CrossRef]
  42. Eskandari, M.; Goudarzi, N.; Moussavi, G. Application of low-voltage UVC light and synthetic ZnO nanoparticles to photocatalytic degradation of ciprofloxacin in aqueous sample solutions. Water Environ. J. 2018, 32, 58–66. [Google Scholar] [CrossRef]
  43. Selvamani, P.S.; Vijaya, J.J.; Kennedy, L.J.; Mustafa, A.; Bououdina, M.; Sophia, P.J.; Ramalingam, R.J. Synergic effect of Cu2O/MoS2/rGO for the sonophotocatalytic degradation of tetracycline and ciprofloxacin antibiotics. Ceram. Int. 2021, 47, 4226–4237. [Google Scholar] [CrossRef]
  44. Malakootian, M.; Nasiri, A.; Amiri Gharaghani, M. Photocatalytic degradation of ciprofloxacin antibiotic by TiO2 nanoparticles immobilized on a glass plate. Chem. Eng. Commun. 2020, 207, 56–72. [Google Scholar] [CrossRef]
  45. Sharma, G.; Gupta, V.K.; Agarwal, S.; Bhogal, S.; Naushad, M.; Kumar, A.; Stadler, F.J. Fabrication and characterization of trimetallic nano-photocatalyst for remediation of ampicillin antibiotic. J. Mol. Liq. 2018, 260, 342–350. [Google Scholar] [CrossRef]
  46. Vignesh, K.; Rajarajan, M.; Suganthi, A. Photocatalytic degradation of erythromycin under visible light by zinc phthalocyanine-modified titania nanoparticles. Mater. Sci. Semicond. Process. 2014, 23, 98–103. [Google Scholar] [CrossRef]
  47. Fakhri, A.; Rashidi, S.; Tyagi, I.; Agarwal, S.; Gupta, V.K. Photodegradation of Erythromycin antibiotic by γ-Fe2O3/SiO2 nanocomposite: Response surface methodology modeling and optimization. J. Mol. Liq. 2016, 214, 378–383. [Google Scholar] [CrossRef]
  48. Jassal, P.; Khajuria, R.; Sharma, R.; Debnath, P.; Verma, S.; Johnson, A.; Kumar, S. Photocatalytic degradation of ampicillin using silver nanoparticles biosynthesised by Pleurotus ostreatus. BioTechnologia 2020, 101, 5–14. [Google Scholar] [CrossRef]
  49. Sohrabnezhad, S.; Pourahmad, A.; Karimi, M.F. Magnetite-metal organic framework core@shell for degradation of ampicillin antibiotic in aqueous solution. J. Solid State Chem. 2020, 288, 121420. [Google Scholar] [CrossRef]
  50. Singh, P.; Priya, B.; Shandilya, P.; Raizada, P.; Singh, N.; Pare, B.; Jonnalagadda, S. Photocatalytic mineralization of antibiotics using 60% WO3/BiOCl stacked to graphene sand composite and chitosan. Arabian J. Chem. 2019, 12, 4627–4645. [Google Scholar] [CrossRef]
  51. Priya, B.; Shandilya, P.; Raizada, P.; Thakur, P.; Singh, N.; Singh, P. Photocatalytic mineralization and degradation kinetics of ampicillin and oxytetracycline antibiotics using graphene sand composite and chitosan supported BiOCl. J. Molecul. Catal. A Chem. 2016, 423, 400–413. [Google Scholar] [CrossRef]
  52. Saha, S.; Saha, T.K.; Karmaker, S.; Islam, Z.; Demeshko, S.; Frauendorf, H.; Meyer, F. Solar Light-Assisted Oxidative Degradation of Ciprofloxacin in Aqueous Solution by Iron (III) Chelated Cross-Linked Chitosan Immobilized on a Glass Plate. Catalysts 2022, 12, 475. [Google Scholar] [CrossRef]
Figure 1. FTIR (a), BET (b), XRD (c) and TGA analysis (d) of ZnFe2O4@Chitosan.
Resources 11 00081 g001
Figure 2. SEM (a), EDS (b), surface mapping (c) and VSM analysis (d) of ZnFe2O4@Chitosan.
Resources 11 00081 g002
Figure 3. UV-visible absorbance spectra of ZnFe2O4@Chitosan (a), Tauc plot for ZnFe2O4@Chitosan (b), structure of CIP (c), structure of AMP (d) and structure of ERY (e).
Resources 11 00081 g003
Figure 4. (a) = Time-dependent degradation efficiency for CIP, AMP and ERY at 5.00 mg L1, (b) = Adsorption capacity and percentage removal for CIP at 5.00 mg L−1 in the absence of visible light, (c) = Adsorption capacity and percentage removal for AMP at 5.00 mg L−1 in the absence of visible light and (d) = Adsorption capacity and percentage removal for ERY at 5.00 mg L−1 in the absence of visible light.
Resources 11 00081 g004
Figure 5. (a) = Effect of concentration of CIP, AMP and ERY on the degradation efficiency of ZnFe2O4@Chitosan, (b) = Effect of concentration of CIP, AMP and ERY on the percentage removal expressed by ZnFe2O4@Chitosan in the absence of visible light, (c) = Effect of weight of ZnFe2O4@Chitosan on degradation efficiency towards CIP, AMP and ERY at 5.00 mg L−1 and (d) = Effect of weight of ZnFe2O4@Chitosan on percentage removal expressed towards CIP, AMP and ERY at 5.00 mg L−1 in the absence of visible light.
Resources 11 00081 g005
Figure 6. (a) = Effect of solution pH on the degradation efficiency of ZnFe2O4@Chitosan (0.1 g) against CIP, AMP and ERY at 5.00 mg L−1, (b) = Effect of solution pH on the percentage removal expressed by ZnFe2O4@Chitosan (0.1 g) towards CIP, AMP and ERY at 5.00 mg L−1, (c) = Plot of 1nCo/Ct versus irradiation time for CIP, AMP and ERY at 5.00 mg L−1 and 0.1 g of ZnFe2O4@Chitosan and (d) = Degradation efficiency of ZnFe2O4@Chitosan towards CIP, AMP and ERY with and without different ROS scavengers.
Resources 11 00081 g006
Figure 7. Proposed mechanism for the photodegradation of CIP, AMP and ERY: (a) Scheme for reaction mechanism and (b) Stepwise photodegradation of CIP, AMP and ERY.
Resources 11 00081 g007
Figure 8. (a) Degradation efficiency of ZnFe2O4@Chitosan after washing with solvent systems and (b) Regeneration capacity of ZnFe2O4@Chitosan expressed towards CIP, AMP and ERY at different operational cycles.
Resources 11 00081 g008
Table 1. Comparison of the photodegradation of CIP, AMP and ERY by ZnFe2O4@Chitosan with other photocatalysts in literature.
MaterialAntibioticDE (%)LISAC (g L−1)Conc (mg L−1)Stability (%)Reference
Cu2O/MoS2/rGOCIP55.00150 W halogen lamp0.3010.00-[43]
TiO2 on glassCIP92.006 W UV-C lamp1.005.00-[44]
ZnOCIP93.008 W Hg fluorescent 0.505.00-[39]
ZnOCIP100.009 W Hg UV lamp0.1510.00-[42]
MWCNTs-CuNiFe2O4AMP100.0036 W UV0.5025.0093.72 (8th cycle)[40]
Ru/WO3/ZrO2AMP96.00150 W Xe lamp1.00 50.0092.00 (2nd cycle)[41]
La/Cu/Zr trimetallicAMP86.00Sunlight0.1050.0059.00 (6th cycle)[45]
Znpc–TiO2ERY74.21300 W Xe arc lamp0.401 × 105 M-[46]
γ-Fe2O3/SiO2ERY87.1715 W UV-C lamp0.506.00-[47]
Ag-NPAMP96.50Sunlight0.1710.00-[48]
FeSi@MNAMP70.00Sunlight0.60100.0063.00 (4th cycle)[49]
WO3/BiOCl/ChitosanAMP75.00Solar light0.50* 1 × 10−467.00 (10th cycle)[50]
BiOCl/ChitosanAMP75.00Solar light1.00* 1 × 10−467.00 (10th cycle)[51]
FeIII-CS-GLACIP90.30Solar light-** 50-[52]
ZnFe2O4@ChitosanCIP
AMP
ERY
99.80
94.50
83.20
Visible-light simulation (150 W Xe light)1.00
1.00
1.00
5.00
5.00
5.00
97.60 (15th cycle)
93.50 (15th cycle)
95.00 (15th cycle)
This study
- = Not reported. Degradation efficiency = DE, Light illumination source = LIS, Amount of catalyst = AC, Conc = Concentration of antibiotic, Nickel-copper ferrite nanoparticles onto multi-walled carbon nanotubes = MWCNTs-CuNiFe2O4, FeSi@magnetic nanoparticle = FeSi@MN, Ciprofloxacin = CIP, Ampicillin = AMP, Erythromycin = ERY, * = mol dm−3, FeIII-CS-GLA = iron (III) chelated cross-linked chitosan, ** = µM.
Publisher’s Note: MDPI stays neutral with regard to jurisdictional claims in published maps and institutional affiliations.

