


A Tool for the Selection of Food Waste Management Approaches for the Hospitality and Food Service Sector in the UK


Abstract
:1. Introduction
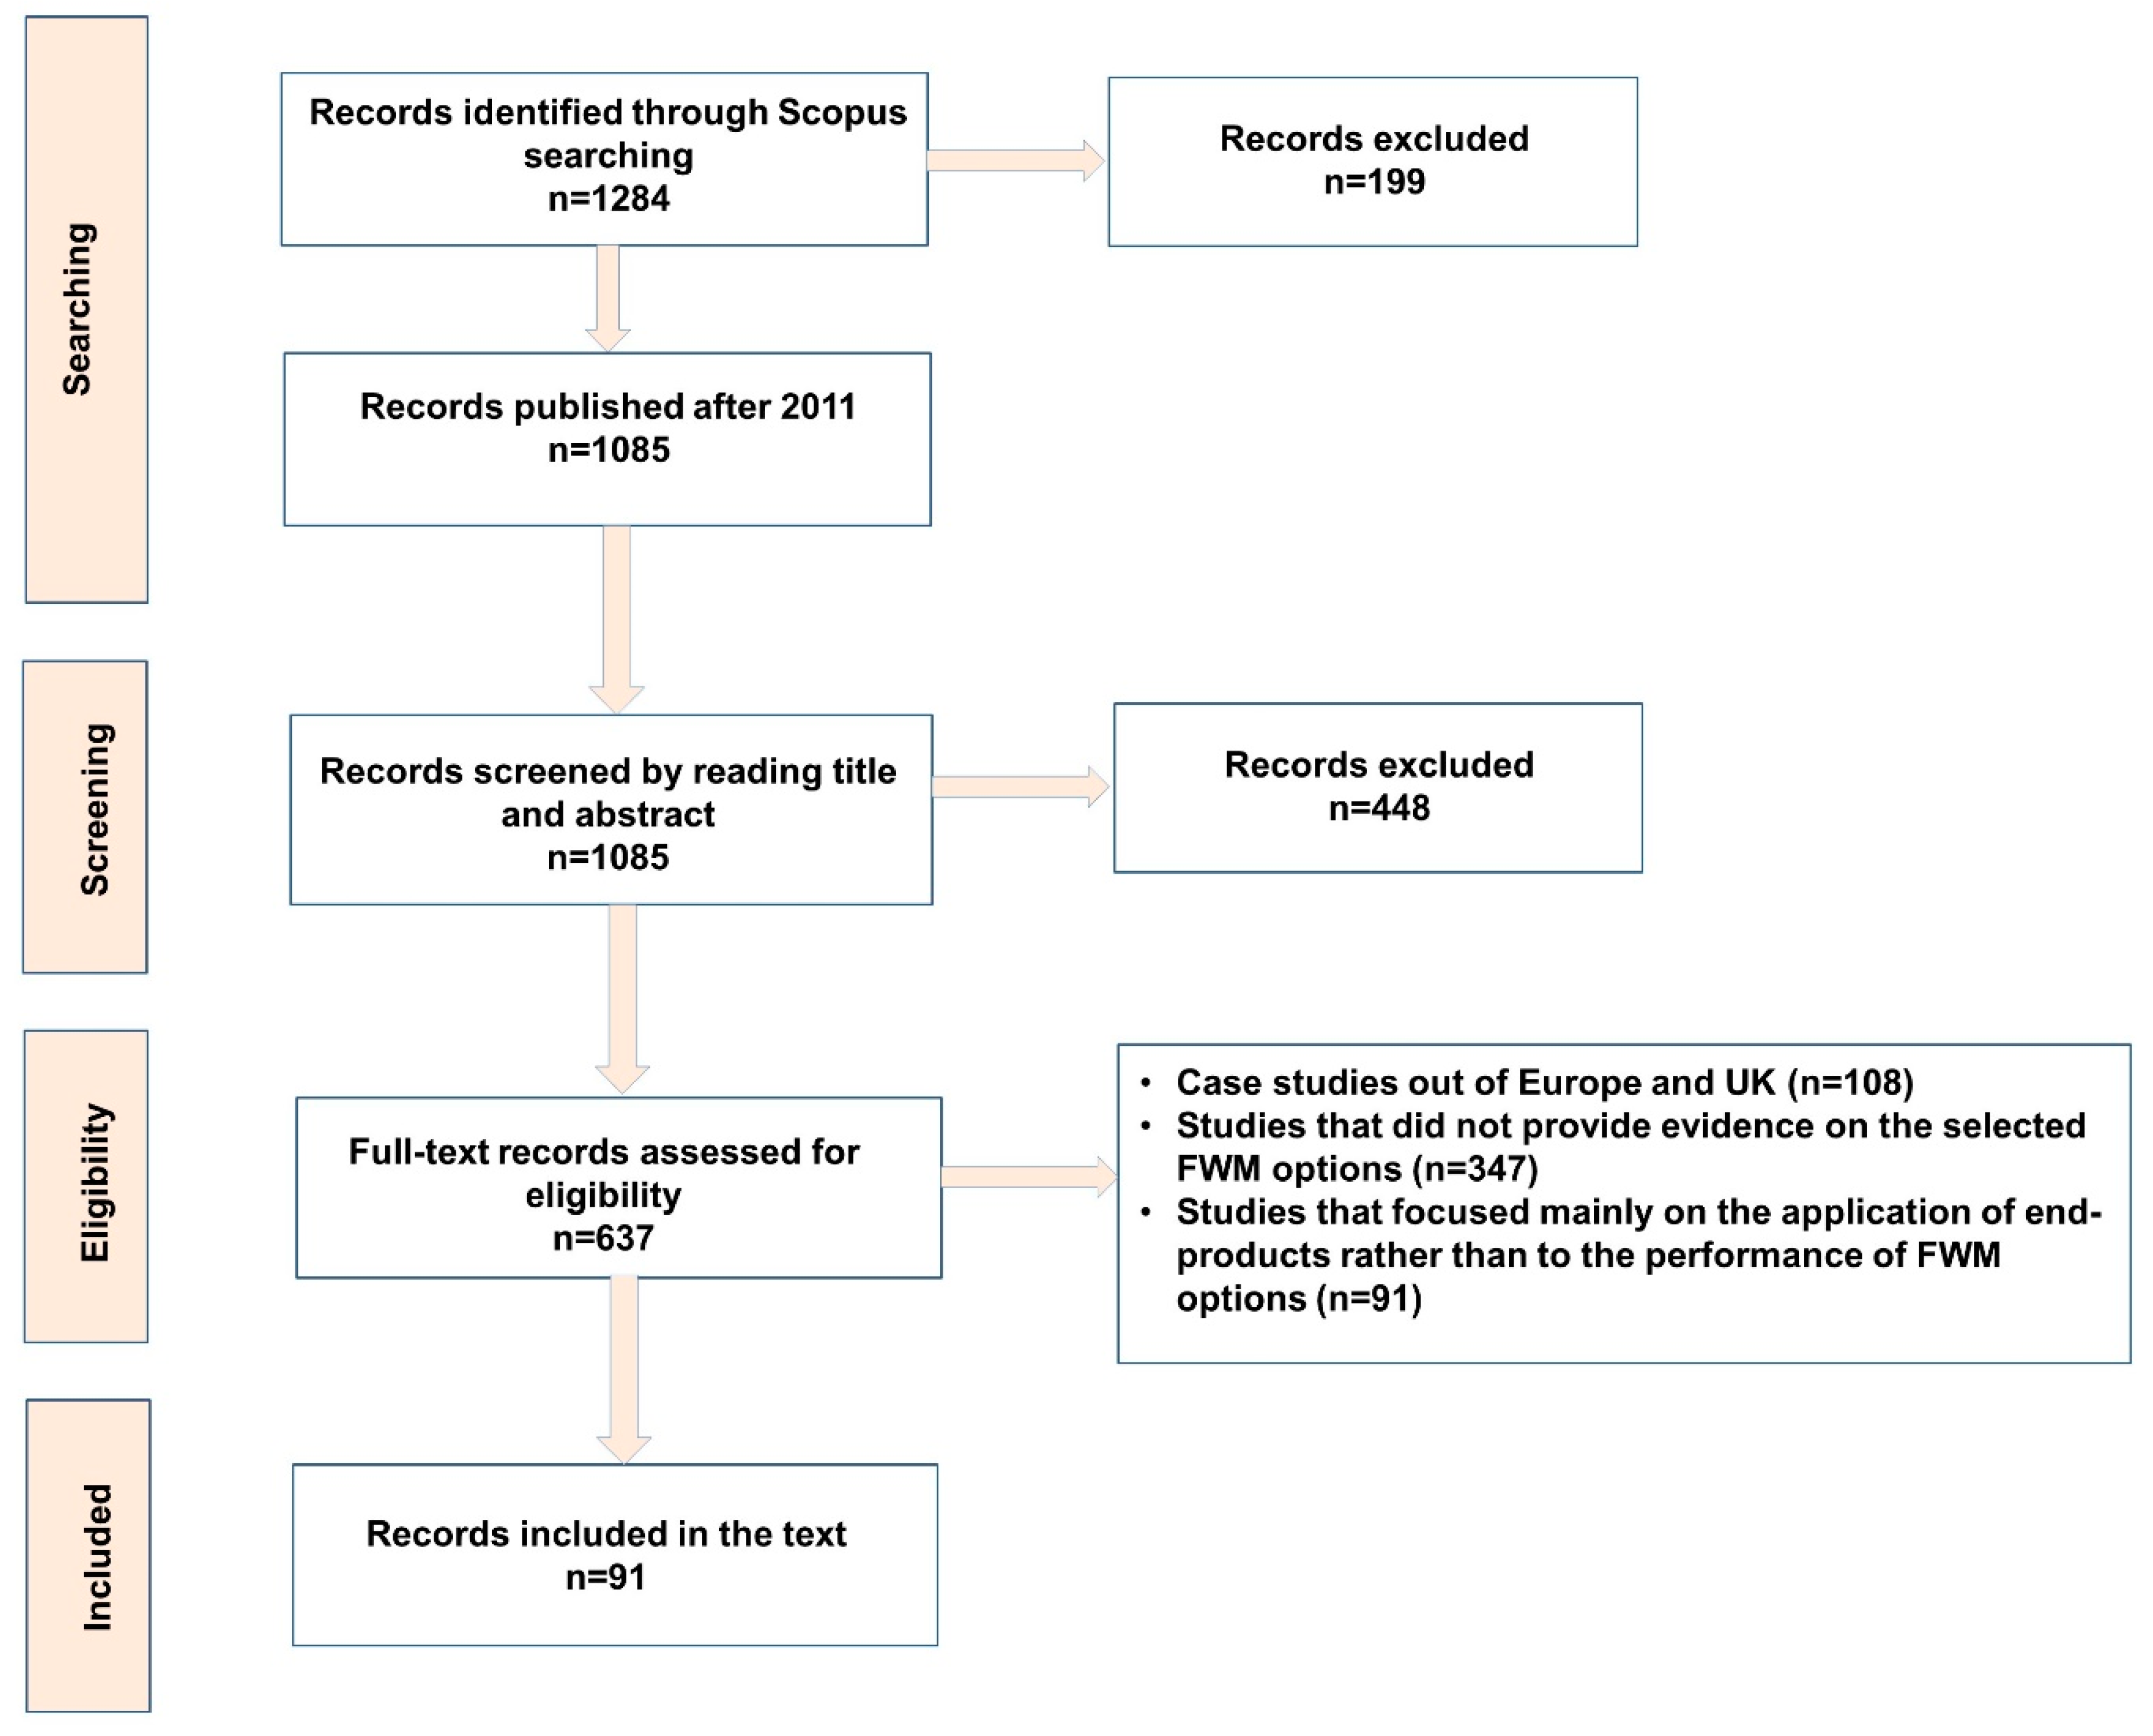
2. Methodology
3. Results
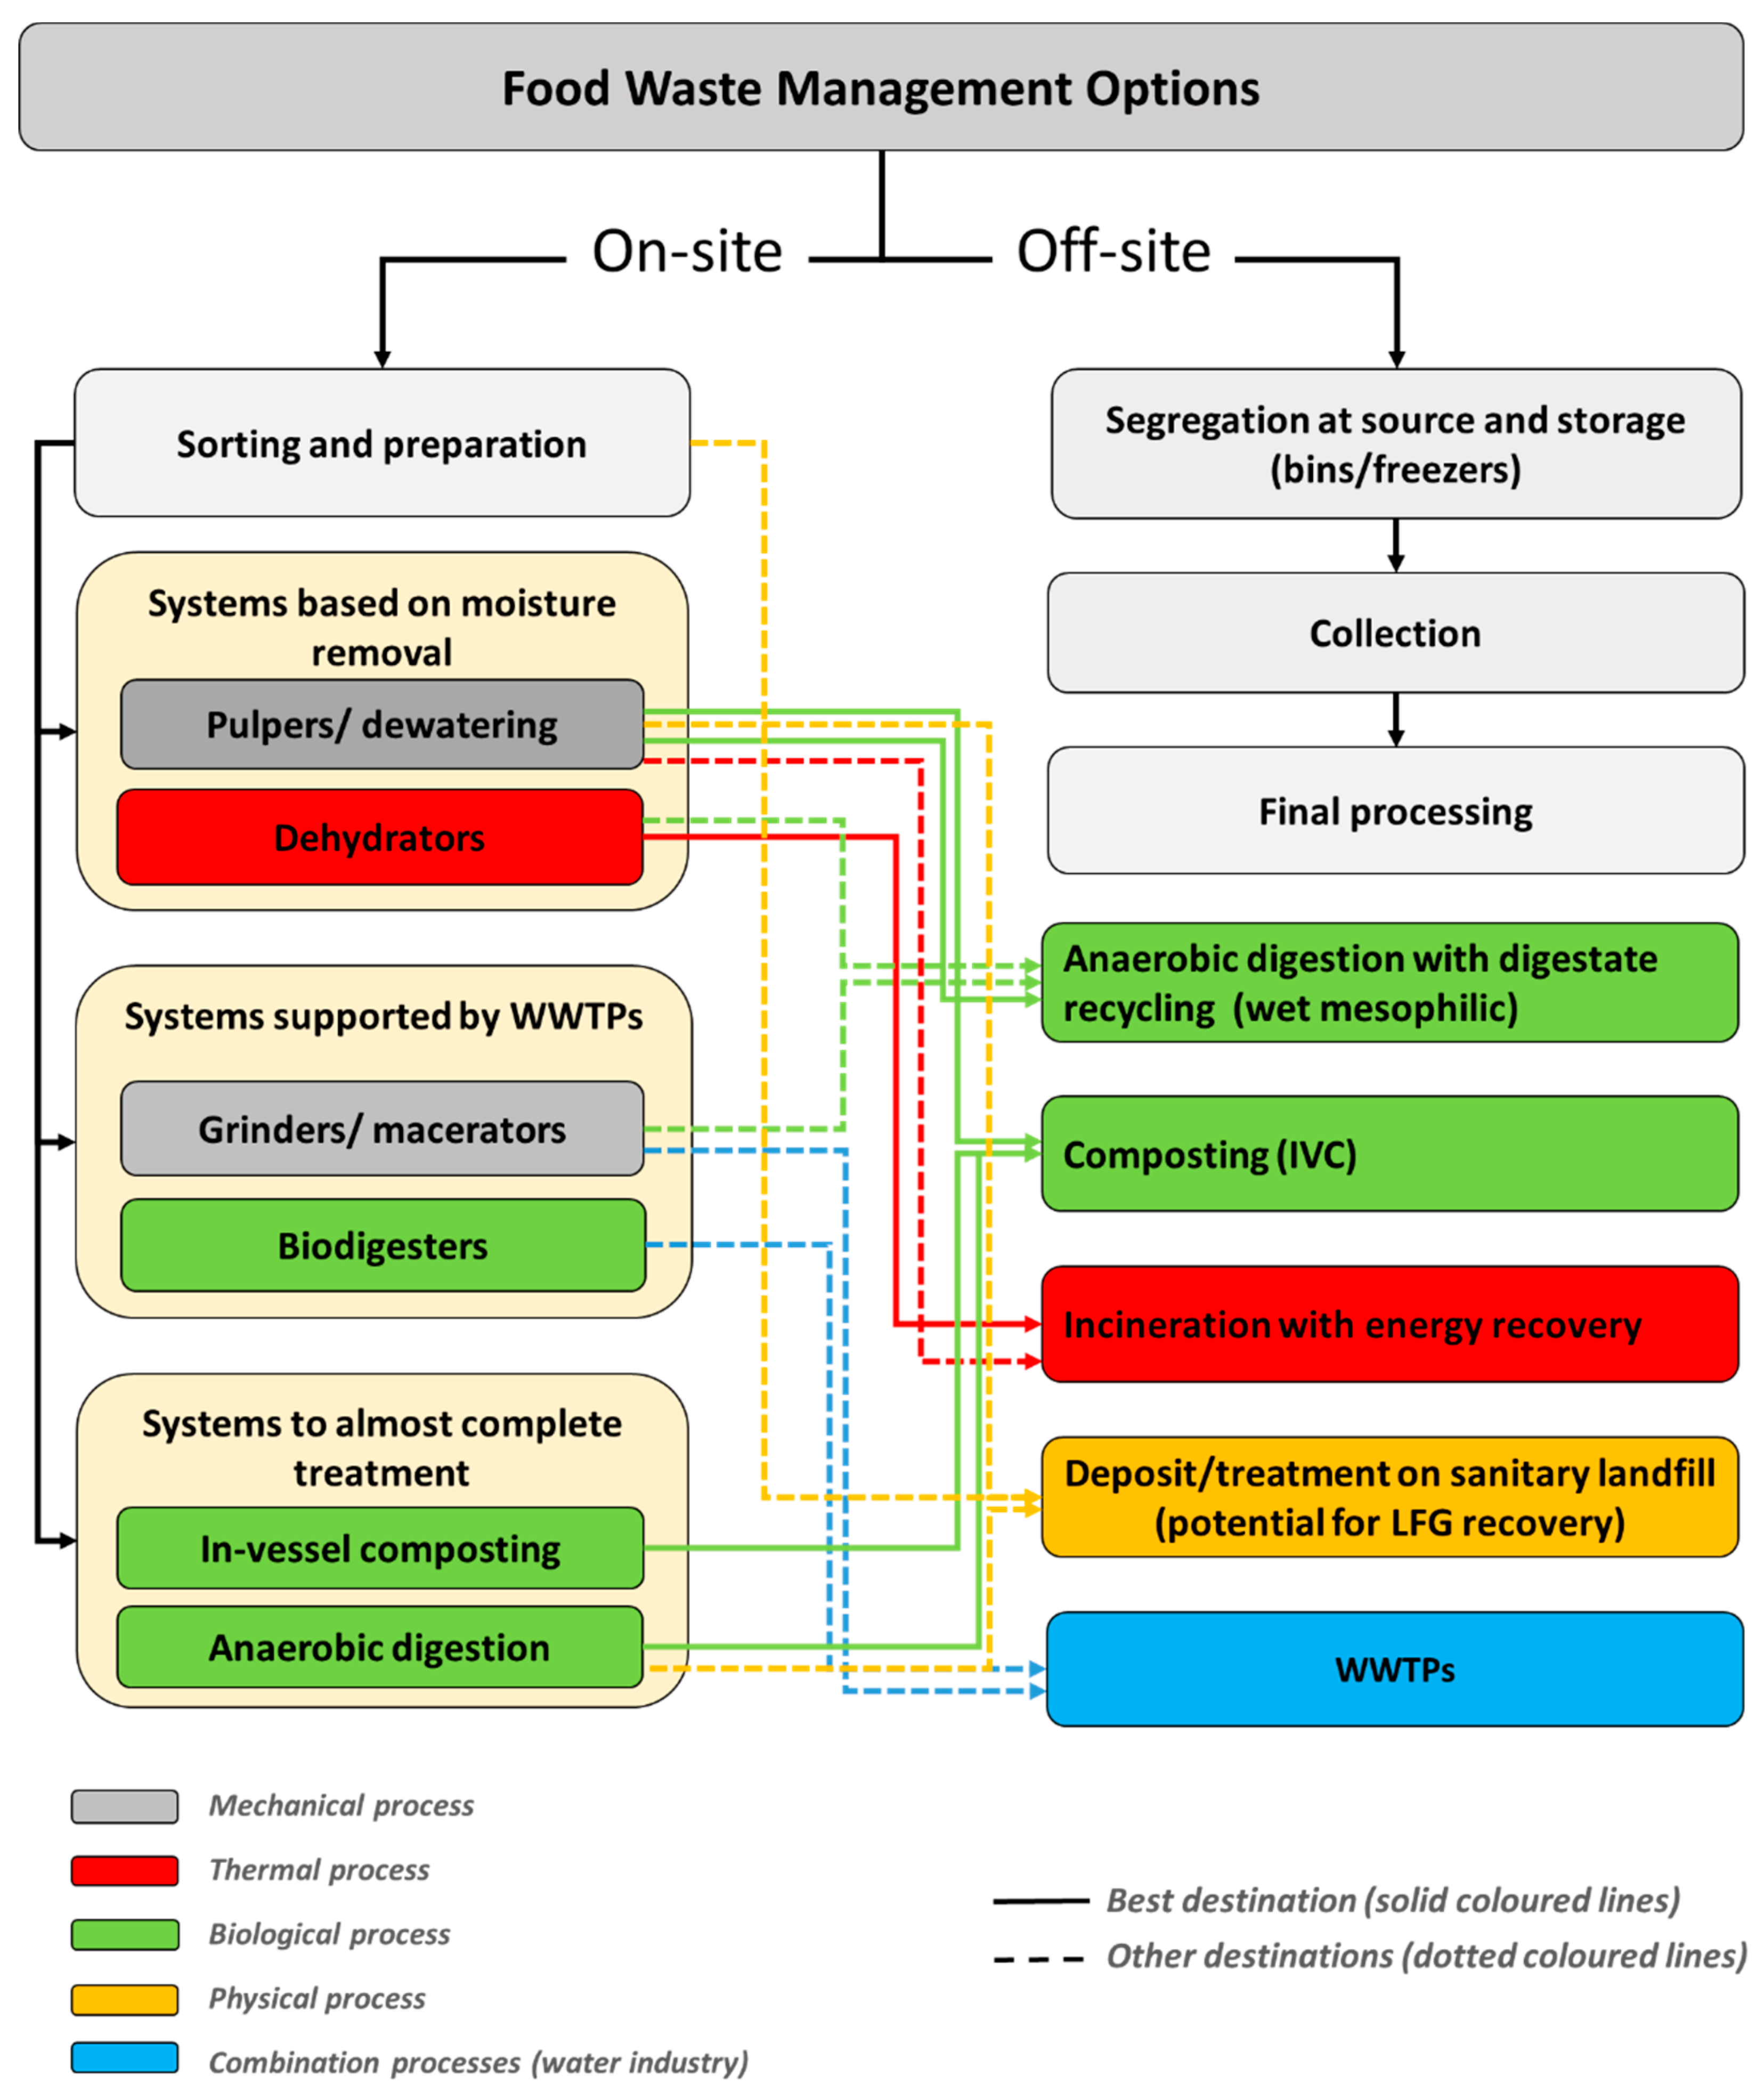
3.1. Explorative Analysis of FWM Processes Available in the UK
- Grinders (also known as macerators): mechanically reduce the volume of FW by macerating it into a slurry that is disposed of in the sewer system for treatment at the wastewater treatment plants (WWTPs);
- Biodigesters (also known as aerobic digesters): continuous feed systems that biologically break down and decompose FW at an accelerated rate (typically within 24 h) under aerobic conditions using a mechanised aeration technology (e.g., turner, agitator, or paddle arms). Most commercially available biodigester systems are equipped with scales and an integrated tool that measures the amount and type of FW fed into the unit [16];
- Pulpers (also known as dewatering systems or compactors): mechanically press out the liquid content of FW through a vacuum or pressure pump;
- Dehydrators: use heat (operate in a temperature range of 40–150 °C) to remove moisture from FW creating dry biomass; they typically have sensors that detect moisture content up to a level of 4–6%, enabling the completion of drying cycles, while steam generated from dehydration is condensed, filtered and discharged into the sewer [17];
- In-vessel composters (IVC): biologically break down and decompose FW under aerobic conditions inside an enclosed container or vessel, producing compost in the shortest time (typically within 1–2 weeks), although post-curing is usually required. The main types of IVC are horizontal reactors that can be further divided into channels, cells, containers and tunnels; vertical reactors involve some type of cylindrical container or tank and rotary drums that incorporate internal vanes [18];
- Small-scale anaerobic digesters (AD): batch systems that can be divided into two types—a liquid with a variety of control and mixing methods and dry, where liquid percolate is sprayed into the digester over the digesting feedstock to ensure enough moisture to foster microorganisms [19]. The latter fits better with FW processing. However, small-scale AD has longer reaction times and lower methane gas production than large-scale off-site AD [20].
- biological processes, i.e., composting and AD;
- thermal processes, i.e., incineration with energy recovery; and
- disposal in landfills.
3.1.1. Key Considerations Regarding the Use of On-Site Technologies
3.1.2. Key Considerations Regarding the Use of Off-Site Technologies
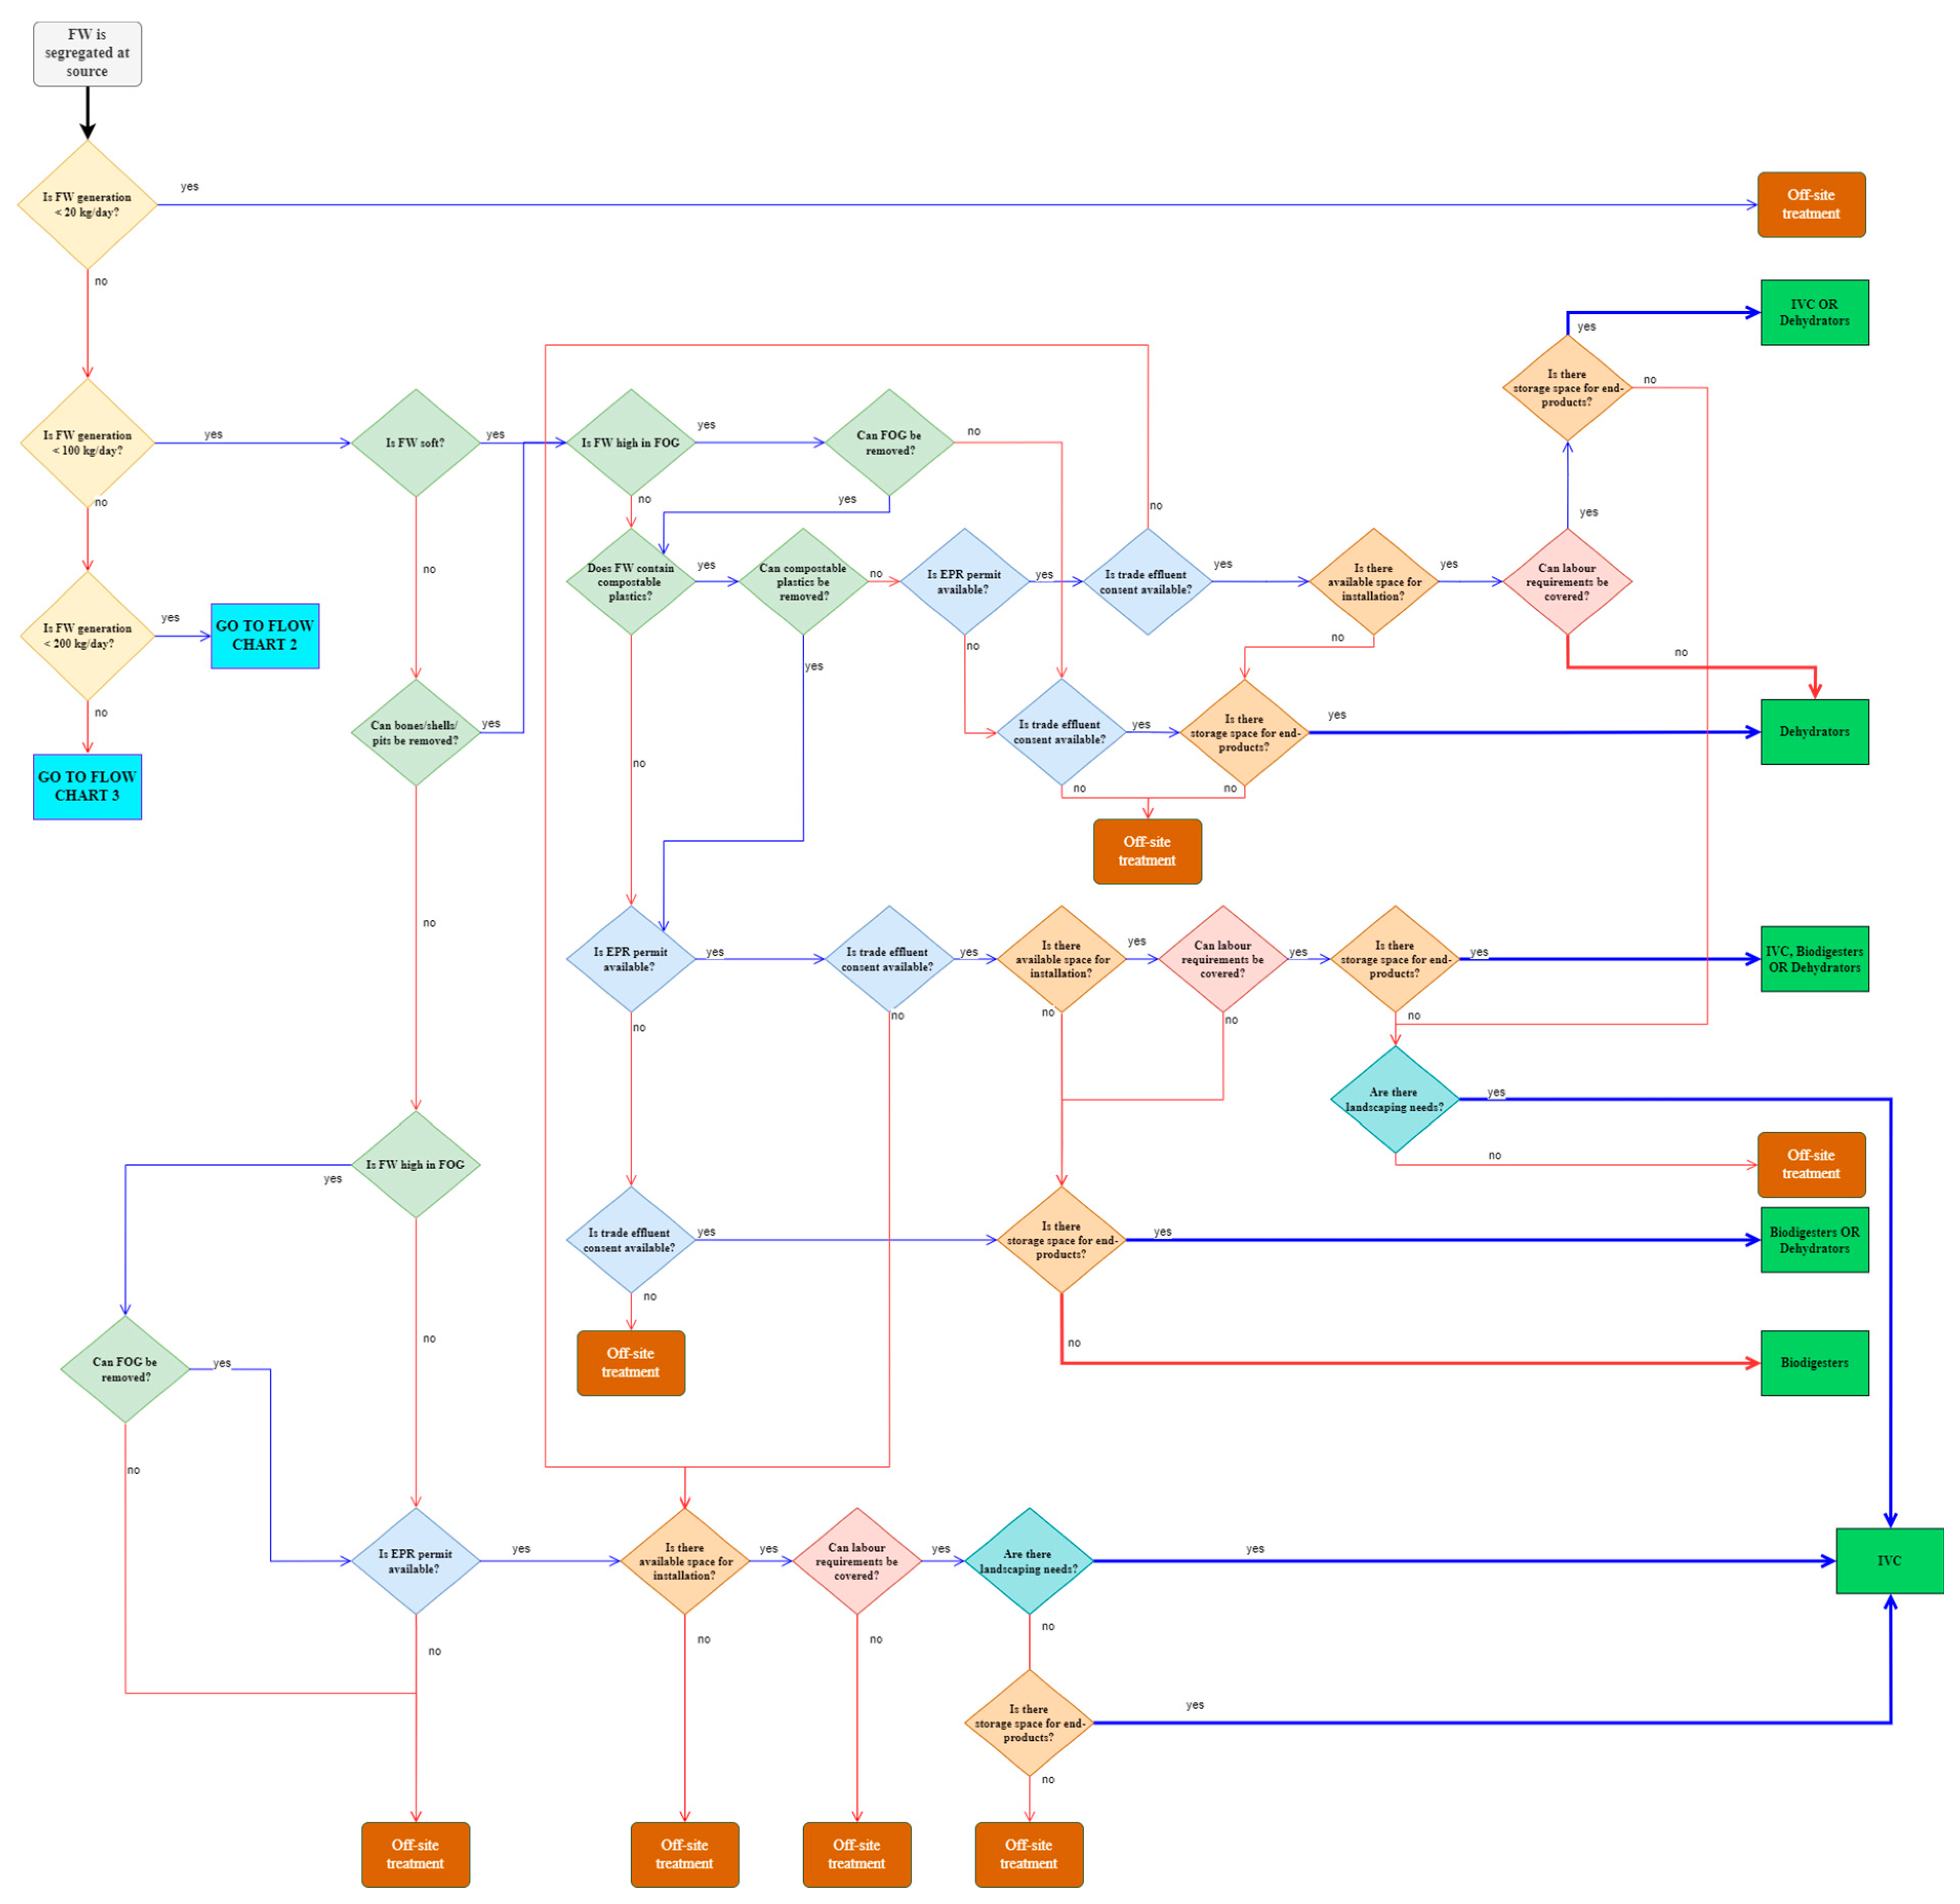
3.2. Development of the Two-Tier Decision-Making Framework
3.2.1. Tier 1: Flow Charts Aiding the Selection of an On-Site FWM System
- Processing capacity: it was divided into four ranges according to the processing capacities of on-site systems: (i) <20 kg/day, (ii) 20–100 kg/day, (iii) 100–200 kg/day, and (iv) ≥200 kg/day. Since there are no on-site systems with a processing capacity of less than 20 kg/day, on-site management of FW is not logistically possible, and diversion to off-site FWM options is the only suggested route. The flow charts are therefore split into three routes, according to each processing capacity range (ii–iv).
- FW characteristics: this is distinguished into (1) the absence of bones/shells/pits, characterised as soft FW; (2) the absence of FOG; and (3) the absence of compostable plastics; it must be clarified that this is not the same as the FW composition. FW composition can vary widely between businesses in terms of solid vs liquid and proportional distribution of carbohydrates, lipids, and proteins (e.g., restaurants, cafeterias, patisseries, etc.); hence this was excluded from the decision-making process. Each user must make his own decision based on FW composition and how seasonality affects it.
- Legislative compliance: this is separated into categories of compliance as (i) EPR permit that typically refers to the installation of a waste recycling operation [36], usually on-site IVC and AD, and (ii) trade effluent consent (see Section 3.1.1) that typically refers to all on-site systems disposing of a discharge down the drain, excluding IVC (no effluent is generated) and macerators that are connected to a storage tank. To mark this difference in the macerators configuration settings, flow charts refer to macerators (tank), macerators (drain), and macerators for both configurations.
- Space requirements: these are classified into small and large-size requirements, referring to the size of the systems and the space needed for their installation; it must be noted that variations exist from one supplier to another that the users should consider; this should not be confused with the location characteristics and conditions that must be met for health and safety regulations, permitting regulations, connection to the drain, distance from the kitchen, weather, etc.; users must incorporate location in their decision-making based on their site characteristics and spatial conditions, as these can vary widely.
- Landscaping needs: this is when the end-product of the FWM process can be utilised on-site, assuming that the assured quality of their end-products is a prerequisite. Therefore, the quality characterisation of end-products is highly recommended before application despite system manufacturers’ specifications; this criterion must be used with caution as there can be an overproduction and excess of end-product (e.g., compost-like products, digestate).
- Storage requirements: FW and end-product storage requirements are intermediary steps before final treatment off-site. The logistics can vary based on the storage bin size, storage bin type (swapping or tipping), bin location, and road miles (distance from the site to the centralised facility for management).
3.2.2. Tier 2—Sustainability Assessment of FWM Options
Sustainability Performance of Off-Site FWM Processes
Sustainability Performance of On-Site FWM Processes
4. Discussion
- potential damage to the sewerage system as an extension of its ability to receive liquefied FW, e.g., the slope of pipework (i.e., smooth slopes inhibit self-scouring velocities leading to organic trapping and degradation, leading to malodour formation and corrosion, and clogging [109]), pipe capacity, the flow rate of water, size/age (i.e., new pipes have greater carrying capacity and smaller friction from water flowing in the pipe, while aged pipes are rougher catching the debris leading to odours and clogs [110]), and pump maintenance and accessibility (i.e., pumps need to be designed with easy access for cleaning and maintenance activities [110]);
- processing efficiency of WWTPs (e.g., flow rates, organic and nutrient removal performance, the capacity of sewage sludge production, available technology for energy recovery) to properly treat liquefied FW [86];
- loss of value (e.g., nutrients, lower biogas generation yield, and fugitive emissions);
- other area-specific features [109], such as weather events and business practices;
- policy drivers for their implementation according to legislative requirements and regulations of local municipalities; and
- costs shifted to municipal ratepayers that bear the added expenses of sewer maintenance and additional treatment [16].
5. Conclusions
Supplementary Materials
Author Contributions
Funding
Institutional Review Board Statement
Informed Consent Statement
Data Availability Statement
Acknowledgments
Conflicts of Interest
References
- WRAP. UK Progress against Courtauld 2025 Targets and UN Sustainable Development Goal 12.3. Available online: https://wrap.org.uk/sites/default/files/2020-09/UK-progress-against-Courtauld-2025-targets-and-UN-SDG-123.pdf (accessed on 8 July 2022).
- Patel, S.; Dora, M.; Hahladakis, J.N.; Iacovidou, E. Opportunities, challenges and trade-offs with decreasing avoidable food waste in the UK. Waste Manag. Res. 2021, 39, 473–488. [Google Scholar] [CrossRef] [PubMed]
- WRAP. The True Cost of Food Waste within Hospitality and Food Service. Available online: https://wrap.org.uk/sites/default/files/2020-10/WRAP-The%20True%20Cost%20of%20Food%20Waste%20within%20Hospitality%20and%20Food%20Service%20Sector%20FINAL.pdf (accessed on 8 July 2022).
- Dhir, A.; Talwar, S.; Kaur, P.; Malibari, A. Food waste in hospitality and food services: A systematic literature review and framework development approach. J. Clean. Prod. 2020, 270, 122861. [Google Scholar] [CrossRef]
- Cooper, J. Briefing: Food waste–next steps for food processors and manufacturers. Proc. Inst. Civ. Eng. -Waste Resour. Manag. 2018, 171, 91–93. [Google Scholar] [CrossRef]
- Reid, C. Environment Act 2021. Scott. Plan. Environ. Law 2022, 16–17. [Google Scholar]
- NAE. Food Waste Segregation and Treatment-GUIDEBOOK. Available online: https://www.nea.gov.sg/docs/default-source/envision/food-waste/nea-fw-segregation-and-treatment-guidebook.pdf (accessed on 8 February 2022).
- Pour, F.H.; Makkawi, Y.T. A review of post-consumption food waste management and its potentials for biofuel production. Energy Rep. 2021, 7, 7759–7784. [Google Scholar] [CrossRef]
- European Commission. Communication from the Commission to the European Parliament, the Council, the European Economic and Social Committee and the Committee of the Regions-The Role of Waste-to-Energy in the Circular Economy. Available online: https://eur-lex.europa.eu/legal-content/EN/TXT/PDF/?uri=CELEX:52017DC0034 (accessed on 8 February 2022).
- WRAP. Guidance for Food and Drink Manufacturers and Retailers on the Use of Food Surplus as Animal Feed. Available online: https://wrap.org.uk/sites/default/files/2020-09/WRAP-2016-05-17-Animal-Feed-Guidance-v1.0-for-publication.pdf (accessed on 8 February 2022).
- NPA. Do Not Feed Food Waste to Pigs-Campaign Stepped Up. Available online: http://www.npa-uk.org.uk/Do_not_feed_food_waste_to_pigs-campaign_stepped_up.html (accessed on 8 February 2022).
- Burden, J. The Buyers’ Guide to In-Vessel and Anaerobic Digestion Technologies. Available online: http://www.organics-recycling.org.uk/uploads/article1762/Buyers%20Guide%20to%20in-vessel%20and%20AD.pdf (accessed on 8 February 2022).
- Wolffe, T.A.M.; Whaley, P.; Halsall, C.; Rooney, A.A.; Walker, V.R. Systematic evidence maps as a novel tool to support evidence-based decision-making in chemicals policy and risk management. Environ. Int. 2019, 130, 104871. [Google Scholar] [CrossRef]
- Aslam, S.; Emmanuel, P. Formulating a researchable question: A critical step for facilitating good clinical research. Indian J. Sex. Transm. Dis. AIDS 2010, 31, 47–50. [Google Scholar] [CrossRef]
- Siddaway, A. What is a systematic literature review and how do I do one. Univ. Stirling 2014, 1, 1–13. [Google Scholar]
- EPA. Emerging Issues in Food Waste Management: Commercial Pre-Processing Technologies. Available online: https://www.epa.gov/system/files/documents/2021-09/commercial-pre-processing-technologies_508-tagged_0.pdf (accessed on 8 February 2022).
- EPA; WSROC. Food Organics Dehydrators. Available online: https://ssroc.nsw.gov.au/wp-content/uploads/2018/12/10_RFB-Fact-Sheet_Food-Organics-Dehydrators_final-1.pdf (accessed on 8 February 2022).
- Bruni, C.; Akyol, Ç.; Cipolletta, G.; Eusebi, A.L.; Caniani, D.; Masi, S.; Colón, J.; Fatone, F. Decentralized Community Composting: Past, Present and Future Aspects of Italy. Sustainability 2020, 12, 3319. [Google Scholar] [CrossRef]
- Platt, B.; Goldstein, N.; Coker, C.; Brown, S. State of Composting in the US. Available online: https://ilsr.org/wp-content/uploads/2014/07/state-of-composting-in-us.pdf (accessed on 10 February 2022).
- Zheng, M.; Orbell, J.D.; Fairclough, R.J. Household Food Waste Treatment Technologies-A Systematic Review; Victoria University: Melbourne, Australia, 2017. [Google Scholar]
- PW. Small-Scale On-Site Organic Waste Processing Technologies. Available online: https://pw.lacounty.gov/epd/socalconversion/PDFS/2020_Small_Scale_Food_Waste_Technology.pdf (accessed on 8 February 2022).
- RecyclingWorks. On-Site Systems for Managing Food Waste. Available online: https://recyclingworksma.com/wp-content/uploads/2016/07/On-Site-Systems_edits_031716.pdf (accessed on 8 February 2022).
- UK Water. National Guidance for Healthcare Waste Water Discharges. Available online: https://www.water.org.uk/guidance/national-guidance-for-healthcare-waste-water-discharges/ (accessed on 14 July 2022).
- DMS. Analysis of Organics Diversion Alternatives. Available online: https://dswa.com/wp-content/uploads/2015/02/Final-Report-to-DSWA-Organics-Analysis-September-8-2017.pdf (accessed on 8 February 2022).
- Naroznova, I.; Møller, J.; Larsen, B.; Scheutz, C. Evaluation of a new pulping technology for pre-treating source-separated organic household waste prior to anaerobic digestion. Waste Manag. 2016, 50, 65–74. [Google Scholar] [CrossRef]
- Schroeder, J.T.; Labuzetta, A.L.; Trabold, T.A. Assessment of Dehydration as a Commercial-Scale Food Waste Valorization Strategy. Sustainability 2020, 12, 5959. [Google Scholar] [CrossRef]
- Bernstad, A.; la Cour Jansen, J. Separate collection of household food waste for anaerobic degradation – Comparison of different techniques from a systems perspective. Waste Manag. 2012, 32, 806–815. [Google Scholar] [CrossRef] [PubMed]
- WRAP; UK EA. Compost-End of Waste Criteria for the Production and Use of Quality Compost from Source-Segregated Biodegradable Waste. Available online: https://assets.publishing.service.gov.uk/government/uploads/system/uploads/attachment_data/file/297215/geho0812bwpl-e-e.pdf (accessed on 8 February 2022).
- Styles, D.; Schönberger, H.; Galvez Martos, J. Best Environmental Management Practice in the Tourism Sector; Publications Office of the European Union: Luxembourg, 2017; pp. 1–657. [Google Scholar]
- SCS ENGINEERS; CCG. Composting Processing Capacity and Organic Materials Diversion Study. Available online: https://www.losaltoshills.ca.gov/DocumentCenter/View/3285/Santa-Clara-County-Organics_Final-Report-10-31-17 (accessed on 8 February 2022).
- WRAP. Anaerobic Digestate-End of Waste Criteria for the Production and Use of Quality Outputs from Anaerobic Digestion of Source-Segregated Biodegradable. Available online: https://www.biofertiliser.org.uk/pdf/Anaerobic-Digestion-Quality-Protocol.pdf (accessed on 26 February 2022).
- EPA. Fact Sheet: In-Vessel Composting of Biosolids. Available online: https://www.epa.gov/biosolids/fact-sheet-vessel-composting-biosolids (accessed on 8 February 2022).
- Jouhara, H.; Czajczyńska, D.; Ghazal, H.; Krzyżyńska, R.; Anguilano, L.; Reynolds, A.J.; Spencer, N. Municipal waste management systems for domestic use. Energy 2017, 139, 485–506. [Google Scholar] [CrossRef]
- Mu, D.; Horowitz, N.; Casey, M.; Jones, K. Environmental and economic analysis of an in-vessel food waste composting system at Kean University in the U.S. Waste Manag. 2017, 59, 476–486. [Google Scholar] [CrossRef] [PubMed]
- Lu, H.R.; Qu, X.; El Hanandeh, A. Towards a better environment - the municipal organic waste management in Brisbane: Environmental life cycle and cost perspective. J. Clean. Prod. 2020, 258, 120756. [Google Scholar] [CrossRef]
- GOV.UK. Check If You Need an Environmental Permit. Available online: https://www.gov.uk/guidance/check-if-you-need-an-environmental-permit (accessed on 11 March 2022).
- GOV.UK. T23 Waste Exemption: Aerobic Composting and Associated Prior Treatment. Available online: https://www.gov.uk/guidance/waste-exemption-t23-aerobic-composting-and-associated-prior-treatment (accessed on 11 March 2022).
- GOV.UK. T25 Waste Exemption: Anaerobic Digestion at Premises Not Used for Agriculture and Burning Resulting Biogas. Available online: https://www.gov.uk/guidance/waste-exemption-t25-anaerobic-digestion-at-premises-not-used-for-agriculture-and-burning-resulting-biogas (accessed on 11 March 2022).
- GOV.UK. Guidance-Treating Food Waste Where the Food Was Served and Consumed: RPS 229. Available online: https://www.gov.uk/government/publications/treating-food-waste-where-the-food-was-served-and-consumed-rps-229/treating-food-waste-where-the-food-was-served-and-consumed-rps-229 (accessed on 11 March 2022).
- Bulson, H.; Pickering, J.; Henderson, A.; Shape, N. Managing NHSS Food Waste; Organic Resource Agency (ORA) Ltd.: Scotland, UK, 2012. [Google Scholar]
- Schüch, A.; Morscheck, G.; Lemke, A.; Nelles, M. Bio-waste recycling in Germany–further challenges. Procedia Environ. Sci. 2016, 35, 308–318. [Google Scholar] [CrossRef]
- Van Fan, Y.; Lee, C.T.; Klemeš, J.J.; Bong, C.P.C.; Ho, W.S. Economic assessment system towards sustainable composting quality in the developing countries. Clean Technol. Environ. Policy 2016, 18, 2479–2491. [Google Scholar] [CrossRef]
- WRAP. Open Windrow Composting. Available online: https://wrap.org.uk/resources/guide/open-windrow-composting (accessed on 8 February 2022).
- Iacovidou, E.; Millward-Hopkins, J.; Busch, J.; Purnell, P.; Velis, C.A.; Hahladakis, J.N.; Zwirner, O.; Brown, A. A pathway to circular economy: Developing a conceptual framework for complex value assessment of resources recovered from waste. J. Clean. Prod. 2017, 168, 1279–1288. [Google Scholar] [CrossRef]
- Cristóbal, J.; Limleamthong, P.; Manfredi, S.; Guillén-Gosálbez, G. Methodology for combined use of data envelopment analysis and life cycle assessment applied to food waste management. J. Clean. Prod. 2016, 135, 158–168. [Google Scholar] [CrossRef]
- Slorach, P.C.; Jeswani, H.K.; Cuéllar-Franca, R.; Azapagic, A. Environmental and economic implications of recovering resources from food waste in a circular economy. Sci. Total Environ. 2019, 693, 133516. [Google Scholar] [CrossRef]
- Djekic, I.; Sanjuán, N.; Clemente, G.; Jambrak, A.R.; Djukić-Vuković, A.; Brodnjak, U.V.; Pop, E.; Thomopoulos, R.; Tonda, A. Review on environmental models in the food chain - Current status and future perspectives. J. Clean. Prod. 2018, 176, 1012–1025. [Google Scholar] [CrossRef]
- Bernstad, A.; la Cour Jansen, J. Review of comparative LCAs of food waste management systems – Current status and potential improvements. Waste Manag. 2012, 32, 2439–2455. [Google Scholar] [CrossRef] [PubMed]
- Ingrao, C.; Faccilongo, N.; Di Gioia, L.; Messineo, A. Food waste recovery into energy in a circular economy perspective: A comprehensive review of aspects related to plant operation and environmental assessment. J. Clean. Prod. 2018, 184, 869–892. [Google Scholar] [CrossRef]
- Salemdeeb, R.; Bin Daina, M.; Reynolds, C.; Al-Tabbaa, A. An environmental evaluation of food waste downstream management options: A hybrid LCA approach. Int. J. Recycl. Org. Waste Agric. 2018, 7, 217–229. [Google Scholar] [CrossRef]
- Chiew, Y.L.; Spångberg, J.; Baky, A.; Hansson, P.-A.; Jönsson, H. Environmental impact of recycling digested food waste as a fertilizer in agriculture—A case study. Resour. Conserv. Recycl. 2015, 95, 1–14. [Google Scholar] [CrossRef]
- Mondello, G.; Salomone, R.; Ioppolo, G.; Saija, G.; Sparacia, S.; Lucchetti, M.C. Comparative LCA of Alternative Scenarios for Waste Treatment: The Case of Food Waste Production by the Mass-Retail Sector. Sustainability 2017, 9, 827. [Google Scholar] [CrossRef]
- Colón, J.; Cadena, E.; Pognani, M.; Barrena, R.; Sánchez, A.; Font, X.; Artola, A. Determination of the energy and environmental burdens associated with the biological treatment of source-separated municipal solid wastes. Energy Environ. Sci. Technol. 2012, 5, 5731–5741. [Google Scholar] [CrossRef]
- Manfredi, S.; Cristobal, J. Towards more sustainable management of European food waste: Methodological approach and numerical application. Waste Manag. Res. 2016, 34, 957–968. [Google Scholar] [CrossRef]
- Evangelisti, S.; Lettieri, P.; Borello, D.; Clift, R. Life cycle assessment of energy from waste via anaerobic digestion: A UK case study. Waste Manag. 2014, 34, 226–237. [Google Scholar] [CrossRef]
- Dragicevic, I.; Eich-Greatorex, S.; Sogn, T.A.; Linjordet, R.; Krogstad, T. Fate of copper, nickel and zinc after biogas digestate application to three different soil types. Environ. Sci. Pollut. Res. 2017, 24, 13095–13106. [Google Scholar] [CrossRef]
- Morris, J.; Brown, S.; Cotton, M.; Matthews, H.S. Life-Cycle Assessment Harmonization and Soil Science Ranking Results on Food-Waste Management Methods. Environ. Sci. Technol. 2017, 51, 5360–5367. [Google Scholar] [CrossRef]
- Bernstad, A.; la Cour Jansen, J. A life cycle approach to the management of household food waste – A Swedish full-scale case study. Waste Manag. 2011, 31, 1879–1896. [Google Scholar] [CrossRef]
- Slorach, P.C.; Jeswani, H.K.; Cuéllar-Franca, R.; Azapagic, A. Environmental sustainability in the food-energy-water-health nexus: A new methodology and an application to food waste in a circular economy. Waste Manag. 2020, 113, 359–368. [Google Scholar] [CrossRef]
- Chiu, S.L.H.; Lo, I.M.C. Reviewing the anaerobic digestion and co-digestion process of food waste from the perspectives on biogas production performance and environmental impacts. Environ. Sci. Pollut. Res. 2016, 23, 24435–24450. [Google Scholar] [CrossRef] [PubMed]
- Ascher, S.; Li, W.; You, S. Life cycle assessment and net present worth analysis of a community-based food waste treatment system. Bioresour. Technol. 2020, 305, 123076. [Google Scholar] [CrossRef]
- Colón, J.; Cadena, E.; Pognani, M.; Maulini, C.; Barrena, R.; Sánchez, A.; Font, X.; Artola, A. Environmental burdens of source-selected biowaste treatments: Comparing scenarios to fulfil the European Union landfill directive, The case of Catalonia. J. Integr. Environ. Sci. 2015, 12, 165–187. [Google Scholar] [CrossRef]
- Styles, D.; Dominguez, E.M.; Chadwick, D. Environmental balance of the UK biogas sector: An evaluation by consequential life cycle assessment. Sci. Total Environ. 2016, 560–561, 241–253. [Google Scholar] [CrossRef] [PubMed]
- Huang, Y.; Zhao, C.; Gao, B.; Ma, S.; Zhong, Q.; Wang, L.; Cui, S. Life cycle assessment and society willingness to pay indexes of food waste-to-energy strategies. J. Environ. Manag. 2022, 305, 114364. [Google Scholar] [CrossRef]
- Ahamed, A.; Yin, K.; Ng, B.J.H.; Ren, F.; Chang, V.W.C.; Wang, J.Y. Life cycle assessment of the present and proposed food waste management technologies from environmental and economic impact perspectives. J. Clean. Prod. 2016, 131, 607–614. [Google Scholar] [CrossRef]
- Albizzati, P.F.; Tonini, D.; Astrup, T.F. A Quantitative Sustainability Assessment of Food Waste Management in the European Union. Environ. Sci. Technol. 2021, 55, 16099–16109. [Google Scholar] [CrossRef]
- Lin, Z.; Ooi, J.K.; Woon, K.S. An integrated life cycle multi-objective optimization model for health-environment-economic nexus in food waste management sector. Sci. Total Environ. 2022, 816, 151541. [Google Scholar] [CrossRef]
- Di Maria, F.; Micale, C. Life cycle analysis of management options for organic waste collected in an urban area. Environ. Sci. Pollut. Res. 2015, 22, 248–263. [Google Scholar] [CrossRef]
- Wang, S.; Zeng, Y. Ammonia emission mitigation in food waste composting: A review. Bioresour. Technol. 2018, 248, 13–19. [Google Scholar] [CrossRef]
- Slorach, P.C.; Jeswani, H.K.; Cuéllar-Franca, R.; Azapagic, A. Assessing the economic and environmental sustainability of household food waste management in the UK: Current situation and future scenarios. Sci. Total Environ. 2020, 710, 135580. [Google Scholar] [CrossRef]
- Kibler, K.M.; Reinhart, D.; Hawkins, C.; Motlagh, A.M.; Wright, J. Food waste and the food-energy-water nexus: A review of food waste management alternatives. Waste Manag. 2018, 74, 52–62. [Google Scholar] [CrossRef]
- Makan, A.; Fadili, A. Sustainability assessment of large-scale composting technologies using PROMETHEE method. J. Clean. Prod. 2020, 261, 121244. [Google Scholar] [CrossRef]
- Tonini, D.; Albizzati, P.F.; Astrup, T.F. Environmental impacts of food waste: Learnings and challenges from a case study on UK. Waste Manag. 2018, 76, 744–766. [Google Scholar] [CrossRef]
- Edwards, J.; Othman, M.; Crossin, E.; Burn, S. Life cycle inventory and mass-balance of municipal food waste management systems: Decision support methods beyond the waste hierarchy. Waste Manag. 2017, 69, 577–591. [Google Scholar] [CrossRef]
- Colón Jordà, J. Towards the implementation of new regional biowaste management plans: Environmental assessment of different waste management scenarios in Catalonia. Resour. Conserv. Recycl. 2015, 95, 143–155. [Google Scholar] [CrossRef]
- Mpanang’ombe, W.; Tilley, E.; Zabaleta, I.; Zurbrügg, C. A Biowaste Treatment Technology Assessment in Malawi. Recycling 2018, 3, 55. [Google Scholar] [CrossRef]
- Tonini, D.; Wandl, A.; Meister, K.; Unceta, P.M.; Taelman, S.E.; Sanjuan-Delmás, D.; Dewulf, J.; Huygens, D. Quantitative sustainability assessment of household food waste management in the Amsterdam Metropolitan Area. Resour. Conserv. Recycl. 2020, 160, 104854. [Google Scholar] [CrossRef] [PubMed]
- Mayer, F.; Bhandari, R.; Gäth, S.A. Life cycle assessment on the treatment of organic waste streams by anaerobic digestion, hydrothermal carbonization and incineration. Waste Manag. 2021, 130, 93–106. [Google Scholar] [CrossRef] [PubMed]
- Garcia-Garcia, G.; Woolley, E.; Rahimifard, S.; Colwill, J.; White, R.; Needham, L. A Methodology for Sustainable Management of Food Waste. Waste Biomass Valorization 2017, 8, 2209–2227. [Google Scholar] [CrossRef] [PubMed]
- Morris, J.; Scott Matthews, H.; Morawski, C. Review and meta-analysis of 82 studies on end-of-life management methods for source separated organics. Waste Manag. 2013, 33, 545–551. [Google Scholar] [CrossRef]
- Vaverková, M.D.; Elbl, J.; Voběrková, S.; Koda, E.; Adamcová, D.; Mariusz Gusiatin, Z.; Al Rahman, A.; Radziemska, M.; Mazur, Z. Composting versus mechanical–biological treatment: Does it really make a difference in the final product parameters and maturity. Waste Manag. 2020, 106, 173–183. [Google Scholar] [CrossRef]
- Colazo, A.-B.; Sánchez, A.; Font, X.; Colón, J. Environmental impact of rejected materials generated in organic fraction of municipal solid waste anaerobic digestion plants: Comparison of wet and dry process layout. Waste Manag. 2015, 43, 84–97. [Google Scholar] [CrossRef]
- Yu, Q.; Li, H. Moderate separation of household kitchen waste towards global optimization of municipal solid waste management. J. Clean. Prod. 2020, 277, 123330. [Google Scholar] [CrossRef]
- OQM. On-Site Organic Management Options Review. Available online: http://www.metrovancouver.org/services/solid-waste/SolidWastePublications/On-site_Organics_Management_Options_Review-Dec-14.pdf (accessed on 8 February 2022).
- Guven, H.; Wang, Z.; Eriksson, O. Evaluation of future food waste management alternatives in Istanbul from the life cycle assessment perspective. J. Clean. Prod. 2019, 239, 117999. [Google Scholar] [CrossRef]
- Iacovidou, E.; Ohandja, D.-G.; Gronow, J.; Voulvoulis, N. The Household Use of Food Waste Disposal Units as a Waste Management Option: A Review. Crit. Rev. Environ. Sci. Technol. 2012, 42, 1485–1508. [Google Scholar] [CrossRef]
- Maalouf, A.; El-Fadel, M. Carbon footprint of integrated waste management systems with implications of food waste diversion into the wastewater stream. Resour. Conserv. Recycl. 2018, 133, 263–277. [Google Scholar] [CrossRef]
- Carlsson, M.; Naroznova, I.; Møller, J.; Scheutz, C.; Lagerkvist, A. Importance of food waste pre-treatment efficiency for global warming potential in life cycle assessment of anaerobic digestion systems. Resour. Conserv. Recycl. 2015, 102, 58–66. [Google Scholar] [CrossRef]
- Mayer, F.; Bhandari, R.; Gäth, S.A.; Himanshu, H.; Stobernack, N. Economic and environmental life cycle assessment of organic waste treatment by means of incineration and biogasification. Is source segregation of biowaste justified in Germany? Sci. Total Environ. 2020, 721, 137731. [Google Scholar] [CrossRef] [PubMed]
- Giudicianni, P.; Ciajolo, A.; Sferragatta, N.; Cavaliere, A.; Ragucci, R. Mechanical and Thermal Treatments of Municipal Solid Waste Organic Fraction in Small Dehydration Units. Chem. Eng. Trans. 2014, 37, 625–630. [Google Scholar]
- Dhar, A. Evaluation of Food Waste Diversion Potential and Economics of Using Food Waste Dehydrators. Master of Science, The University of Texas, Arlington, TX, USA, 2016. [Google Scholar]
- Adhikari, B.K.; Trémier, A.; Martinez, J.; Barrington, S. Home and community composting for on-site treatment of urban organic waste: Perspective for Europe and Canada. Waste Manag. Res. 2010, 28, 1039–1053. [Google Scholar] [CrossRef]
- Hénault-Ethier, L.; Martin, J.-P.; Housset, J. A dynamic model for organic waste management in Quebec (D-MOWIQ) as a tool to review environmental, societal and economic perspectives of a waste management policy. Waste Manag. 2017, 66, 196–209. [Google Scholar] [CrossRef] [PubMed]
- Frederickson, J.; Boardman, C.; Gladding, T.; Simpson, A.; Howell, G.; Sgouridis, F. Biofilter Performance and Operation as Related to Commercial Composting [Online], Bristol, Environment Agency. Available online: https://assets.publishing.service.gov.uk/government/uploads/system/uploads/attachment_data/file/291249/LIT_8166_d2eca5.pdf (accessed on 12 March 2022).
- Oldfield, T.L.; White, E.; Holden, N.M. The implications of stakeholder perspective for LCA of wasted food and green waste. J. Clean. Prod. 2018, 170, 1554–1564. [Google Scholar] [CrossRef]
- Vieira, V.H.A.d.M.; Matheus, D.R. Environmental assessments of biological treatments of biowaste in life cycle perspective: A critical review. Waste Manag. Res. 2019, 37, 1183–1198. [Google Scholar] [CrossRef] [PubMed]
- Hobbs, S.R.; Harris, T.M.; Barr, W.J.; Landis, A.E. Life Cycle Assessment of Bioplastics and Food Waste Disposal Methods. Sustainability 2021, 13, 6894. [Google Scholar] [CrossRef]
- Tufaner, F. Environmental assessment of refectory waste based on approaches zero-waste project in Turkey: The production of biogas from the refectory waste. Environ. Monit. Assess. 2021, 193, 403. [Google Scholar] [CrossRef]
- Arafat, H.A.; Jijakli, K.; Ahsan, A. Environmental performance and energy recovery potential of five processes for municipal solid waste treatment. J. Clean. Prod. 2015, 105, 233–240. [Google Scholar] [CrossRef]
- Oldfield, T.L.; White, E.; Holden, N.M. An environmental analysis of options for utilising wasted food and food residue. J. Environ. Manag. 2016, 183, 826–835. [Google Scholar] [CrossRef] [PubMed]
- Salvador, R.; Barros, M.V.; Rosário, J.G.D.P.D.; Piekarski, C.M.; da Luz, L.M.; de Francisco, A.C. Life cycle assessment of electricity from biogas: A systematic literature review. Environ. Prog. Sustain. Energy 2019, 38, 13133. [Google Scholar] [CrossRef]
- Tang, Q.; Cotton, A.; Wei, Z.; Xia, Y.; Daniell, T.; Yan, X. How does partial substitution of chemical fertiliser with organic forms increase sustainability of agricultural production? Sci. Total Environ. 2022, 803, 149933. [Google Scholar] [CrossRef] [PubMed]
- Lim, L.; Lee, C.; Lim, J.; Klemeš, J.; Ho, C.; Mansor, N.A. Feedstock amendment for the production of quality compost for soil amendment and heavy metal immobilisation. Chem. Eng. Trans. 2017, 56, 499–504. [Google Scholar]
- Zeller, V.; Lavigne, C.; D’Ans, P.; Towa, E.; Achten, W.M.J. Assessing the environmental performance for more local and more circular biowaste management options at city-region level. Sci. Total Environ. 2020, 745, 140690. [Google Scholar] [CrossRef] [PubMed]
- Yoshikawa, N.; Matsuda, T.; Amano, K. Life cycle environmental and economic impact of a food waste recycling-farming system: A case study of organic vegetable farming in Japan. Int. J. Life Cycle Assess. 2021, 26, 963–976. [Google Scholar] [CrossRef]
- Filimonau, V.; Todorova, E.; Mzembe, A.; Sauer, L.; Yankholmes, A. A comparative study of food waste management in full service restaurants of the United Kingdom and the Netherlands. J. Clean. Prod. 2020, 258, 120775. [Google Scholar] [CrossRef]
- Ascher, S.; Watson, I.; Wang, X.; You, S. Township-based bioenergy systems for distributed energy supply and efficient household waste re-utilisation: Techno-economic and environmental feasibility. Energy 2019, 181, 455–467. [Google Scholar] [CrossRef]
- Zan, F.; Iqbal, A.; Lu, X.; Wu, X.; Chen, G. “Food waste-wastewater-energy/resource” nexus: Integrating food waste management with wastewater treatment towards urban sustainability. Water Res. 2022, 211, 118089. [Google Scholar] [CrossRef]
- local.gov.uk. The Potential of Food Waste Disposal Units to Reduce Costs-A Literature Review. Available online: https://www.local.gov.uk/sites/default/files/documents/potential-food-waste-disp-077.pdf (accessed on 11 March 2022).
- CWWA. Residential Food Waste Grinders. Available online: https://cwwa.ca/wp-content/uploads/2019/10/Food-Waste-Grinder_WhitePaper.pdf (accessed on 8 February 2022).


| LCA Impact Category | Unit | AD | IVC | Incineration | Landfill | Evidence of Scoring Card | Contradictory Evidence of This Scorecard | Reference of Contradictory Evidence |
|---|---|---|---|---|---|---|---|---|
| GWP | kg of CO2 eq. | 1 | 3 | 2 | 4 | Systematic evidence mapping | Incineration is better than AD | [50,51] |
| ADP | kg Sb eq. | 1 | 3 | 2 | 4 | [52,53] | ||
| PED | GJ | 1 | 3 | 2 | 4 | Systematic evidence mapping | Landfill better than IVC | [46] |
| Incineration is better than AD | [50,52] | |||||||
| FD | kg oil eq. | 1 | 4 | 2 | 3 | [46,52,53] | ||
| ODP | kg of CFC-11 eq. | 1 | 3 | 2 | 4 | Systematic evidence mapping | Landfill better than IVC | [46] |
| Incineration is better than AD | [50] | |||||||
| HT | kg 1,4-DB eq. | Systematic evidence mapping | AD is better than incineration | [46] | ||||
| Incineration is better than AD | [52] | |||||||
| IR, hh | kg U235 eq. | Different ranking by 3 studies | [46,50,54] | |||||
| POP | kg NMVOC eq. | Systematic evidence mapping | IVC is better than AD | [50,53] | ||||
| Landfill better than ICV | [46] | |||||||
| EP | kg PO4− eq. | 2 | 3 | 1 | 4 | [52] | ||
| FE | kg P eq. | 1 | 2 | 4 | 3 | [46] | ||
| ME | kg N eq. | Systematic evidence mapping | Incineration is better than IVC AND AD is better than landfill | [46] | ||||
| AD is better than incineration | [50] | |||||||
| FET | kg 1,4-DB eq. | Different ranking by 3 studies | [46,52,54] | |||||
| MET | kg 1,4-DB eq. | [46,52] | ||||||
| TET | kg 1,4-DB eq. | [46,52] | ||||||
| AP | kg SO2 eq. | 2 | 3 | 1 | 4 | Systematic evidence mapping | Landfill better than incineration, AD, IVC | [46] |
| TA | kg SO4 eq. | 3 | 4 | 2 | 1 | [46] | ||
| TE | mol N eq. | 3 | No info | 2 | 1 | [54] | ||
| PM | kg PM2.5 eq. | Systematic evidence mapping | Landfill better than incineration | [46] | ||||
| Incineration is better than landfill | [54] | |||||||
| IVC is better than AD and incineration | [50] | |||||||
| MD | kg Fe eq. | 1 | 3 | 4 | 2 | [46] | ||
| LO | m2yr | 2 | 3 | 1 | 4 | [50,54] |
| Life Cycle Costs (GBP/t FW) | AD 1 | IVC 2 | Incineration 3 | Landfill 4 |
|---|---|---|---|---|
| Costs to local authorities for gate fees | 29 | 46 | 83 | 107 |
| Cost to local authorities for FW collection | 108 | 63 | 25 | 25 |
| Costs to local authorities (FW collection and gate fees) | 137 | 109 | 108 | 132 |
| Capital costs to operators * | 7 | 4 | 28 | 12 |
| Operating costs to operators * | 8 | 14 | 26 | 5 |
| Revenue for operators from tipping fees | 29 | 46 | 83 | 22 |
| Revenue for operators from end-product sales | 14 | 0.23 | 8 | 3 |
| Overall cost | 110 | 80 | 71 | 123 |
| Domain | Metric | Pulpers | Macerators (Connected to Drain) | Biodigesters | On-Site IVC | Dehydrators | On-Site AD |
|---|---|---|---|---|---|---|---|
| Environmental | FW volume reduction (%w/w) | 85–88 | Reported as significant, but no evidence is given | 15–80 | 80–93 | 40–80 | |
| Water consumption (m3/h) | 0.2–0.7 | 0.2–1.8 | ≥0.05 | No | No | * | |
| Electricity consumption | |||||||
| Potential for energy recovery | 3 | 4 | 5 | 6 | 2 | 1 | |
| Diversion from landfill | (landscaping needs: green) | (landscaping needs: green) | |||||
| Other input requirements | |||||||
| End-product to off-site incineration | NA | NA | NA | NA | |||
| End-product to off-site AD | NA | NA | |||||
| End-product to off-site IVC | NA | NA | (available landscaping needs: NA) | (available landscaping needs: NA) | |||
| Carbon savings from avoided waste collection | ** | ** | |||||
| BOD load of effluent discharged | Macerators are worse than biodigesters | NA | |||||
| Technical | Continuous FW processing | ||||||
| Operability (time and effort) | |||||||
| Long-term storage potential of end-products | NA | NA | (available landscaping needs: NA) | (available landscaping needs: NA) | |||
| Maintenance | |||||||
| Analytics technology (scaling and/or conditions monitoring) 1 | |||||||
| Social | Odour | ||||||
| Hygiene (vermin/pests) | |||||||
| Economic | Capital cost | 3 | 1 | 2 | 5 | 4 | 6 |
| Savings from FW collection costs and tipping fees | ** | ** | |||||
| Domain | Metric | Pulpers | Macerators (Connected to a Tank) | On-Site IVC | Dehydrators | On-Site AD |
|---|---|---|---|---|---|---|
| Environmental | FW volume reduction (%w/w) | 85–88 | No evidence | 15–80 | 80–93 | 40–80 |
| Water consumption (m3/h) | 0.23–0.68 | 0.23–1.82 | No | No | * | |
| Electricity consumption | ||||||
| Potential for energy recovery | ||||||
| Diversion from landfill | (landscaping needs: green) | (landscaping needs: green) | ||||
| Other input requirements | ||||||
| End-product destination to off-site incineration | NA | NA | ||||
| End-product destination to off-site AD | NA | NA | ||||
| End-product destination to off-site IVC | (landscaping needs: NA) | (landscaping needs: NA) | ||||
| Carbon savings from avoided waste collection | ** | ** | ||||
| BOD load of effluent discharged | ||||||
| Technical | Continuous FW processing | |||||
| Operability (time and effort) | ||||||
| Long-term storage potential of end-products | (landscaping needs: NA) | (landscaping needs: NA) | ||||
| Maintenance | ||||||
| Analytics technology (scaling and/or conditions monitoring) 1 | ||||||
| Social | Odour issues | |||||
| Hygiene (vermin/pests) | ||||||
| Economic | Capital cost | 2 | 1 | 4 | 3 | 5 |
| Savings from FW collection costs and tipping fees | ** | ** |
Publisher’s Note: MDPI stays neutral with regard to jurisdictional claims in published maps and institutional affiliations. |
© 2022 by the authors. Licensee MDPI, Basel, Switzerland. This article is an open access article distributed under the terms and conditions of the Creative Commons Attribution (CC BY) license (https://creativecommons.org/licenses/by/4.0/).
Share and Cite
Gerassimidou, S.; Dora, M.; Iacovidou, E. A Tool for the Selection of Food Waste Management Approaches for the Hospitality and Food Service Sector in the UK. Resources 2022, 11, 80. https://doi.org/10.3390/resources11100080
Gerassimidou S, Dora M, Iacovidou E. A Tool for the Selection of Food Waste Management Approaches for the Hospitality and Food Service Sector in the UK. Resources. 2022; 11(10):80. https://doi.org/10.3390/resources11100080
Chicago/Turabian StyleGerassimidou, Spyridoula, Manoj Dora, and Eleni Iacovidou. 2022. "A Tool for the Selection of Food Waste Management Approaches for the Hospitality and Food Service Sector in the UK" Resources 11, no. 10: 80. https://doi.org/10.3390/resources11100080
APA StyleGerassimidou, S., Dora, M., & Iacovidou, E. (2022). A Tool for the Selection of Food Waste Management Approaches for the Hospitality and Food Service Sector in the UK. Resources, 11(10), 80. https://doi.org/10.3390/resources11100080