Article

Worry about Climate Change and Urban Flooding Risk Preparedness in Southern Italy: A Survey in the Simeto River Valley (Sicily, Italy)

Department of Civil Engineering and Architecture, University of Catania, 95123 Catania, Italy
*
Author to whom correspondence should be addressed.
Resources 2021, 10(3), 25; https://doi.org/10.3390/resources10030025
Submission received: 17 February 2021 / Revised: 8 March 2021 / Accepted: 11 March 2021 / Published: 14 March 2021
(This article belongs to the Special Issue Analysis of Extreme Hydrometeorological Events)

Abstract

:
Intensive urbanization and related increase of impervious surfaces, causes negative impacts on the hydrological cycle, amplifying the risk of urban floods. These impacts can get even worse due to potential climate change impacts. The urban areas of the Simeto River Valley (SRV), the largest river valley in Sicily (Italy), have been repeatedly hit by intense rainfall events in the last decades that lead to urban flooding, causing several damages and, in some instances, threats to population. In this paper, we present the results of a 10-question survey on climate change and risk perception in 11 municipalities of the SRV carried out within the activities of the LIFE project SimetoRES, which allowed to collect 1143 feedbacks from the residents. The survey investigated: (a) the level of worry about climate change in relation to extreme storms, (b) elements of urban flooding risk preparedness: the direct experience of the residents during heavy rain events, their trust in a civil protection regional alert system, and their knowledge of the correct behavior in case of flood, and (c) the willingness of citizens to implement sustainable drainage actions for climate change adaptation in their own municipality and real estates. The results show that more than 52% of citizens has inadequate knowledge of the correct behavior during flooding events and only 30% of them feel responsible for mitigation of flooding risk. There is a modest willingness by the population to support the construction of sustainable urban drainage infrastructures. A statistical cross-analysis of the answers to the different questions, based on contingency matrices and conditional frequencies, has shown that a greater worry about climate change has no significant impact either on the behavior of people in dangerous situations occurring during flooding events or on the willingness to support financially sustainable solutions. These results suggest that to build a higher worry about climate change and related urban flooding risk is not sufficient to have better preparedness, and that more direct educative actions are necessary in the area.

1. Introduction

Climate change (CC) is a major societal risk issue and there are increasing calls for urgent mitigation and adaptation actions [1]. Over the last decade, many studies have highlighted the importance of adaptation by testing ecosystem-based approaches as a means of understanding and improving the integration of such approaches into climate change adaptation and mitigation strategies [2,3,4,5]. The traditional approach to urbanization based exclusively on impervious paving of surfaces and stormwater management relying on grey infrastructures (sewers), is not sustainable and thus is no longer compatible with climate change adaptation strategies [6,7,8]. The increasing urbanization leads to a greater share of impervious areas that result in increased flood risk and overloaded storm water pipe systems. For this reason, blue-green storm water and nature-based solutions have come to be seen as efficient measures against increasing flood risk in urban areas [9,10,11].
Flood risk may be defined as the product between the probability of flood hazard and the consequence of occurrence of flood event [12] according to
Flood risk = probability of flood hazard × consequence of occurrence of flood event
where consequence of occurrence of flood event is a function of hazard × vulnerability, the latter here including both exposure and susceptibility of harm. Several studies state that current understanding of flood risk focuses on two main factors: climate change and socioeconomic growth [11,12,13].
The risk of flooding for city population has been generally increasing in the past decades, and not sufficiently contrasted in terms of retrofitting urban drainage systems to urban expansion, mainly because of the significant monetary investments needed, which are not sufficiently stimulated by citizens and local administrators due to low awareness of the issue [14,15]. Hence, soft measures (i.e., non-infrastructural) oriented to increase risk awareness and preparedness of the population at all levels are of key importance, also given the comparatively low investments needed with respect to hard (i.e., infrastructural) urban flooding mitigation measures. In fact, education to flood risk awareness and preparedness has led to many benefits in several cases [16]. Several episodes in Italy have demonstrated that inadequate preparedness to urban flooding risk is a factor that contributed significantly to many casualties. Many news and videos show an incautious exposure to dangerous situations by people, which demonstrates their low levels of risk awareness. For instance, while torrents within a town were flooding with water levels near to the intrados of a bridge, people crossed it and stood upon it for mere curiosity and to shoot videos with their smartphones. Similar situations have occurred with respect to underpasses. As a confirmation that this issue does exist and is of particular concern, it can be mentioned that the Italian Civil Protection has promoted an educational campaign named “Io non rischio” (I don’t take risks) in order to help people to understand which is the correct behavior during floods and other natural hazards (http://iononrischio.protezionecivile.it/en/homepage/, last accessed on 15 February 2021).

1.1. Natural Hazard Risk and Climate Change Perception

Early analyses of risk from natural hazards focused on the search for physical and tangible causes, while recently risk awareness has been gradually incorporated in several studies [17,18,19,20,21]. Focus has been put, particularly, on the risk of floods and landslides [16,22,23,24,25].
The spectrum of risk perception in natural hazards includes three distinct elements: worry, awareness, and preparedness [24,26,27,28,29]. In particular, according to [24], the following definitions can be given, which we use within this study: worry is the level of dread or concern associated with the given risk (climate change or urban flooding); awareness can be defined as knowledge or consciousness of the risk that an individual or a group of individuals is exposed to; preparedness is both the capability of coping with a flood throughout the inundation period, and post-flood recovery capability and strategies, and can be described in social, technical, economic and institutional dimensions.
Bubeck et al. (2012) [30] suggest that the relationship between individual flood risk perceptions and mitigation behavior is hardly observed in empirical studies. Other research has included the social perception of risk by using approaches that combine data on physical processes with individual interpretations of the risk [31,32,33]. At a national scale, investigators have estimated the individual and collective risk posed by landslides and floods to the population [34], though the assessment of public perception of the risk posed by landslides and floods in Italy remains mostly unexplored. A number of studies have been focused on the use of specific surveys to investigate natural hazard risk perception. For example, Avvisati et al. (2019) [17] carried out a study of multi-risk perception in 12 municipalities and 2 territorial unions of Campania Region characterized by different risks: seismic, volcanic, hydrogeological (floods and landslides). The results showed that historical memory plays a crucial role in the perception of natural hazards.
On the other hand, looking at studies related to Europe, Diakakis et al. (2018) [22] administered questionnaires to the population of the Attica Region in Greece, to obtain basic information on how individuals understand flood risk, risk mitigation and to what degree they take protection measures, investigating on which degree they trust relevant institutions and their awareness of flood warning and flood protection actions. Their results showed that respondents rank floods third in terms of importance—behind earthquakes and forest fires—among the more relevant risks in the region, despite the clear majority believed the risk is increasing, mostly due to anthropogenic factors. Responses illustrated low levels of trust in authorities and low levels of knowledge of protection actions and awareness regarding floods, as well as low levels of preparedness, in terms of undertaking private mitigation measures.
Other studies claim that the communication of information about natural hazard risks to the public is a difficult task for decision-makers. Feldman et al. (2016) [35] suggest that newer forms of technology present useful options for building disaster resilience and that age is the central factor in predicting the sources people use to receive risk information.
The literature concerning the perception of climate change has developed mainly in the last decade. S. Van Der Linden (2014) [36] claims that climate change compared with many other hazards is therefore relatively unique: not only because of its scope and breadth but also in the sense that it is not directly “situated” in our daily environment [37]. Nevertheless, an increasing amount of research has shown that people can (to some extent) accurately detect changes in their local climate and relate this perceptual experience to climate change [38]. Moreover, the rising incidence rate of extreme weather events is now increasingly being associated with climate change [39]. In fact, a number of studies have indicated that personal experience with extreme weather events is a significant predictor of climate change risk perceptions [38,40,41,42].
The link between the various facets of risk perception (worry, awareness, and preparedness) is difficult to capture. In particular, as reviewed by [43], the literature reports either indifference or positive association between worry about risk and preparedness against it. Hence, further contributions to this aspect are important.

1.2. Aim of the Study

This study aims at understanding, with reference to the Simeto River Valley (SRV) area in Sicily, Italy:
(a)
what is the current level of worry of the population about the climate change issue and to which extent they link urban flooding to climate change;
(b)
the level of individuals’ risk preparedness (short-term preparedness), specifically with reference to the way a person behaves during urban flooding events;
(c)
long-term preparedness, specifically, people’s willingness to invest as individuals and as a community in climate change adaptation infrastructures for sustainable urban drainage.
We also want to explore some of the links between the three listed aspects and in particular, the link between the level or worry about climate change and the short-term and long-term preparedness to urban flooding issues potentially exacerbated by climate change. To investigate these issues, a survey has been administered to the population, as part of the activities of EU LIFE project SimetoRES (www.lifesimetores.it, accessed on 15 February 2021). In order to involve all age categories of the local population, the survey has been conceived to be simple and short. Given the characteristics of the population, the survey constituted also a “hook” for involving the citizens in more intensive and active initiatives. The survey was open for about three months and 1143 responses were received, which constitutes a large dataset in comparison to many other studies. The survey, consistent with the aims of the study, was articulated in three respective sections exploring each of the above-mentioned aspects.
The collected data can be considered representative of the perception of climate change effects on flood risk within urban contexts typical of Southern Italy. In this geographical area, urbanization has developed quite often with low attention to storm water management and urban planning in general; also, the seniors may have a quite low degree of education, given the predominantly agricultural vocation of the past economy in the area. Given these characteristics of the area, existing literature on the subject, and relative to other sites in the globe, may not be enough representative.

2. Materials and Methods

2.1. Description of Survey Area

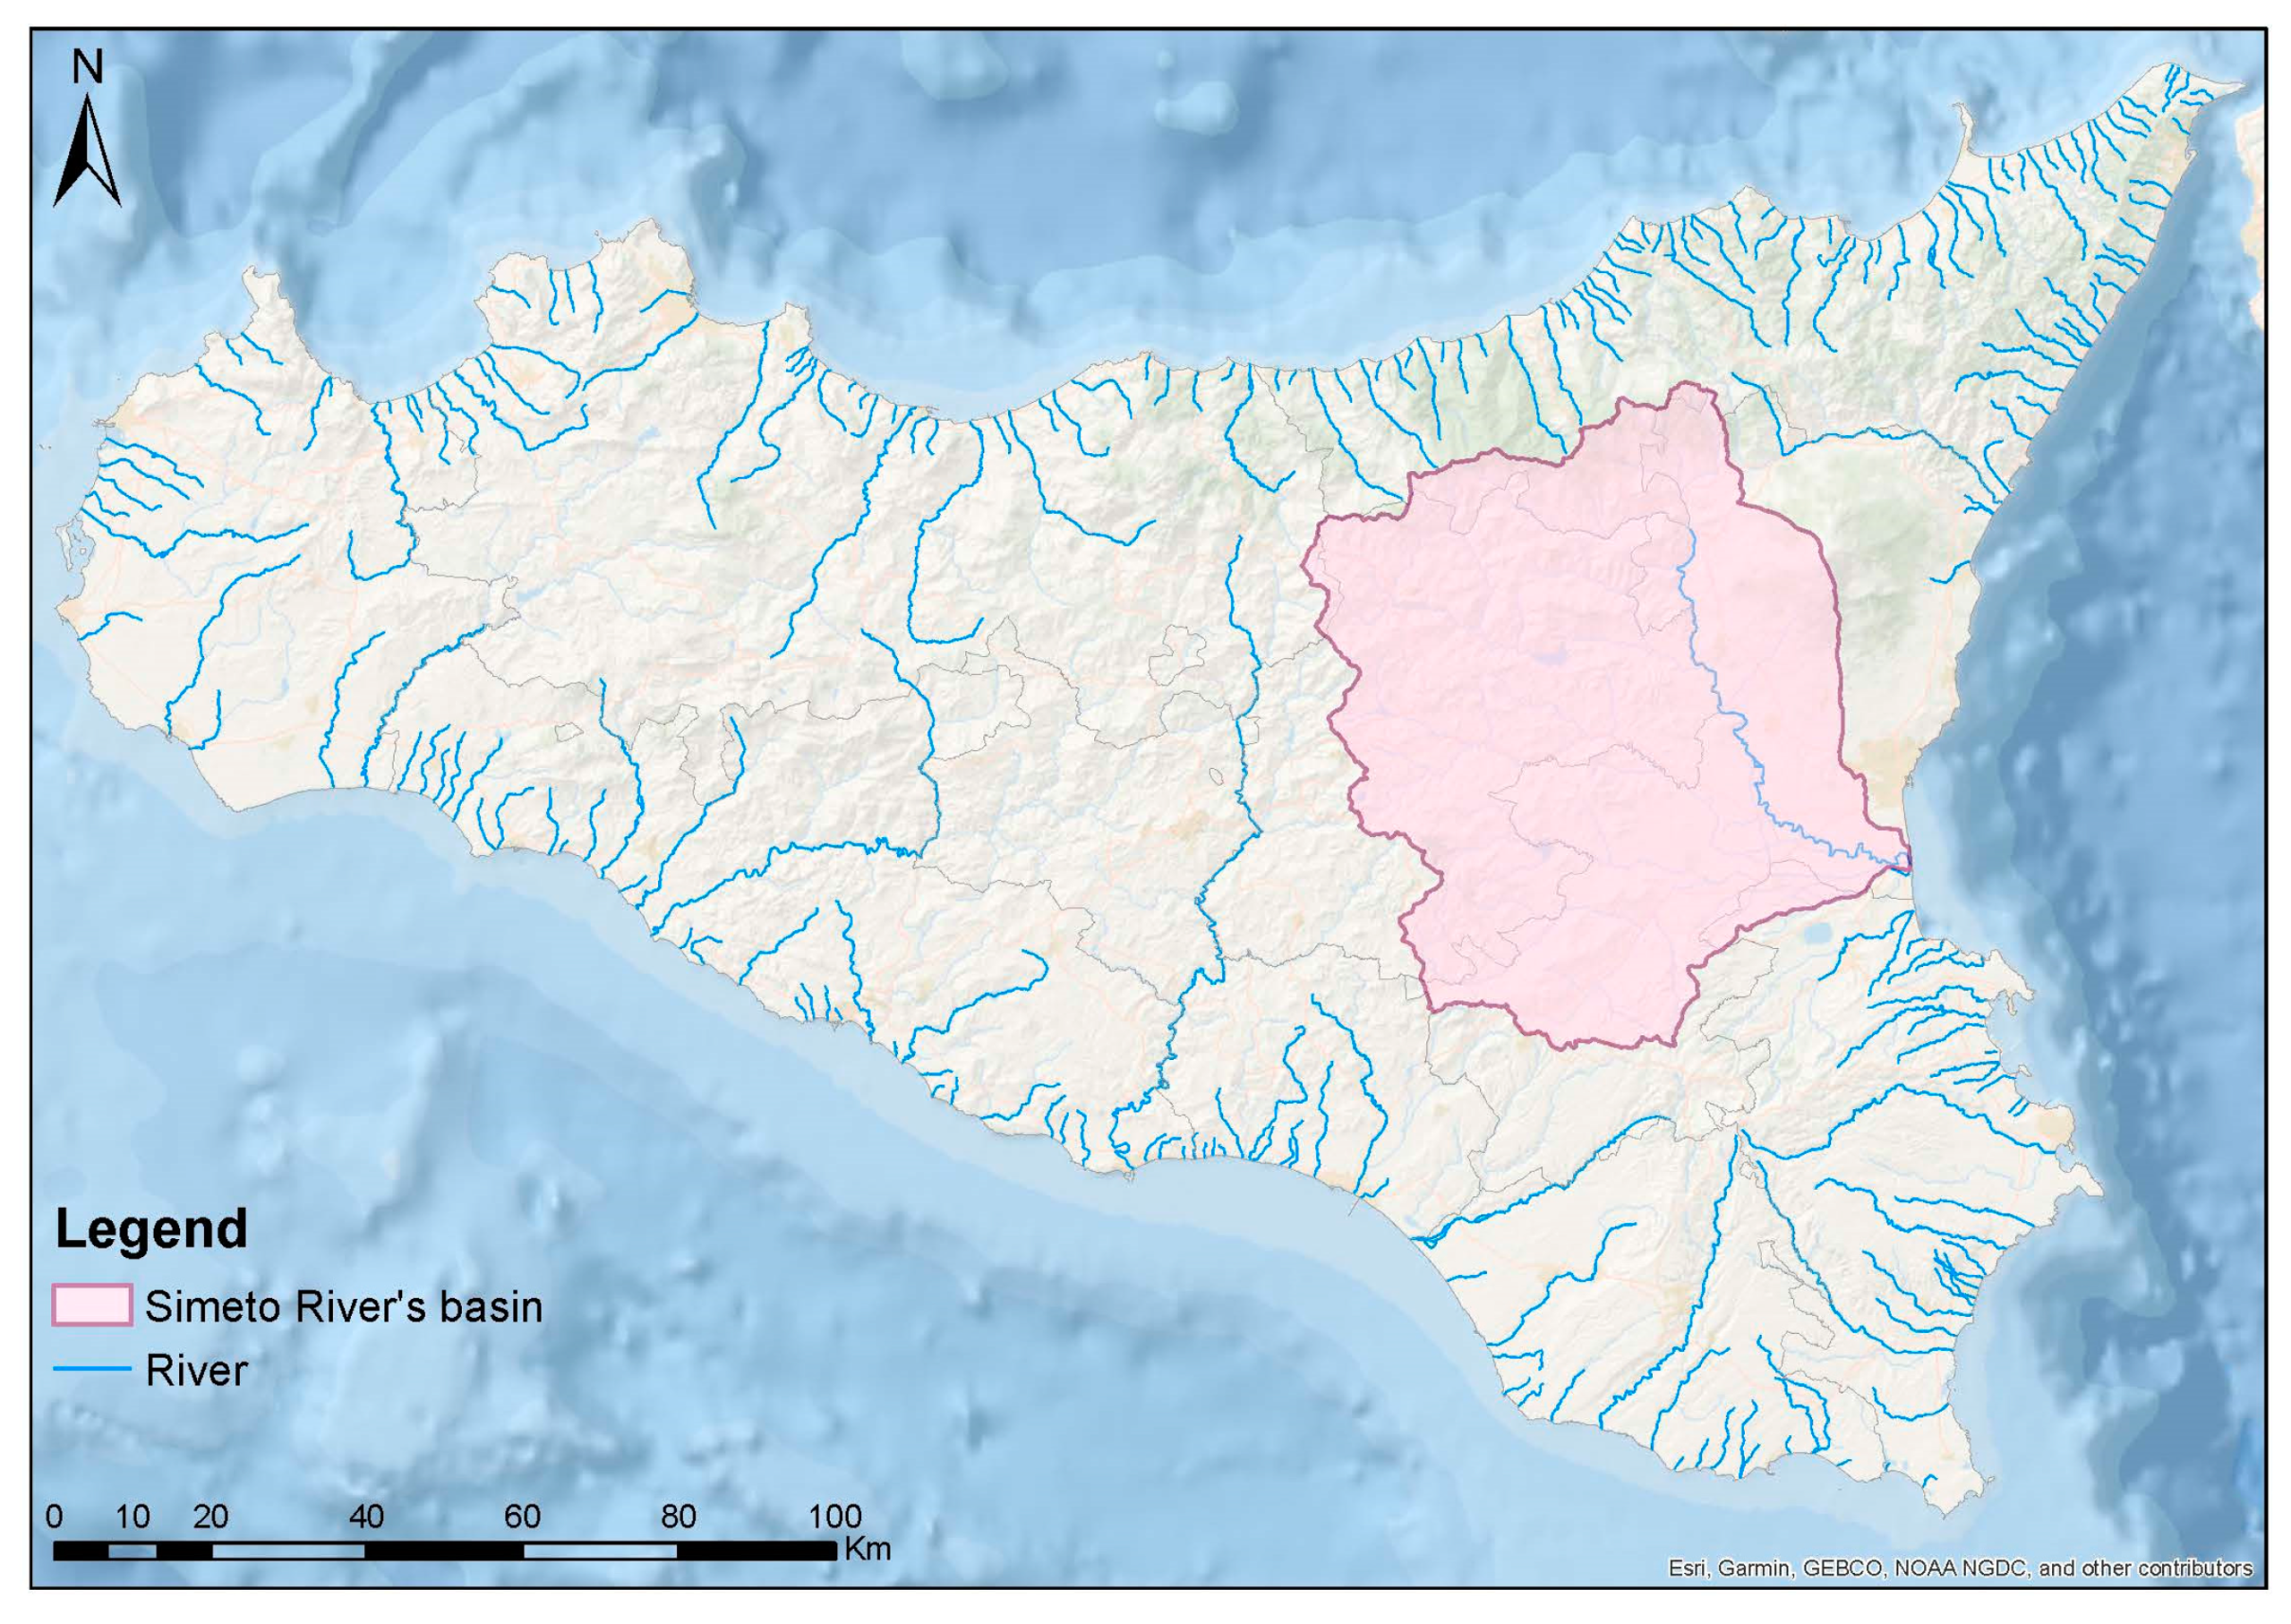
The Simeto River basin (Figure 1) is located on the Southwest of Mount Etna, the largest active volcano in Europe, and is therefore characterized by quite unique natural features [44]. The basin extends in the territories of the provinces of Catania, Enna, and Messina, with a surface that measures approximately 4030 km2. The SRV is an area located along the central stretch of the Simeto River, which is the main river in Sicily, a few kilometers west of the Catania Metropolitan Area. Approximately 150,000 people live in the SRV area, distributed in 10 medium-small towns: the largest community is the city of Paternò with 50,000 residents, while the smallest is Ragalna with around 4000 [45]. In the last two decades, part of this community has been involved in participatory actions for the sustainable development of the area. In particular, thanks to the cooperation between local groups of citizens, organized in an association named Participatory Presidium of the Simeto River Agreement (PSRA) [
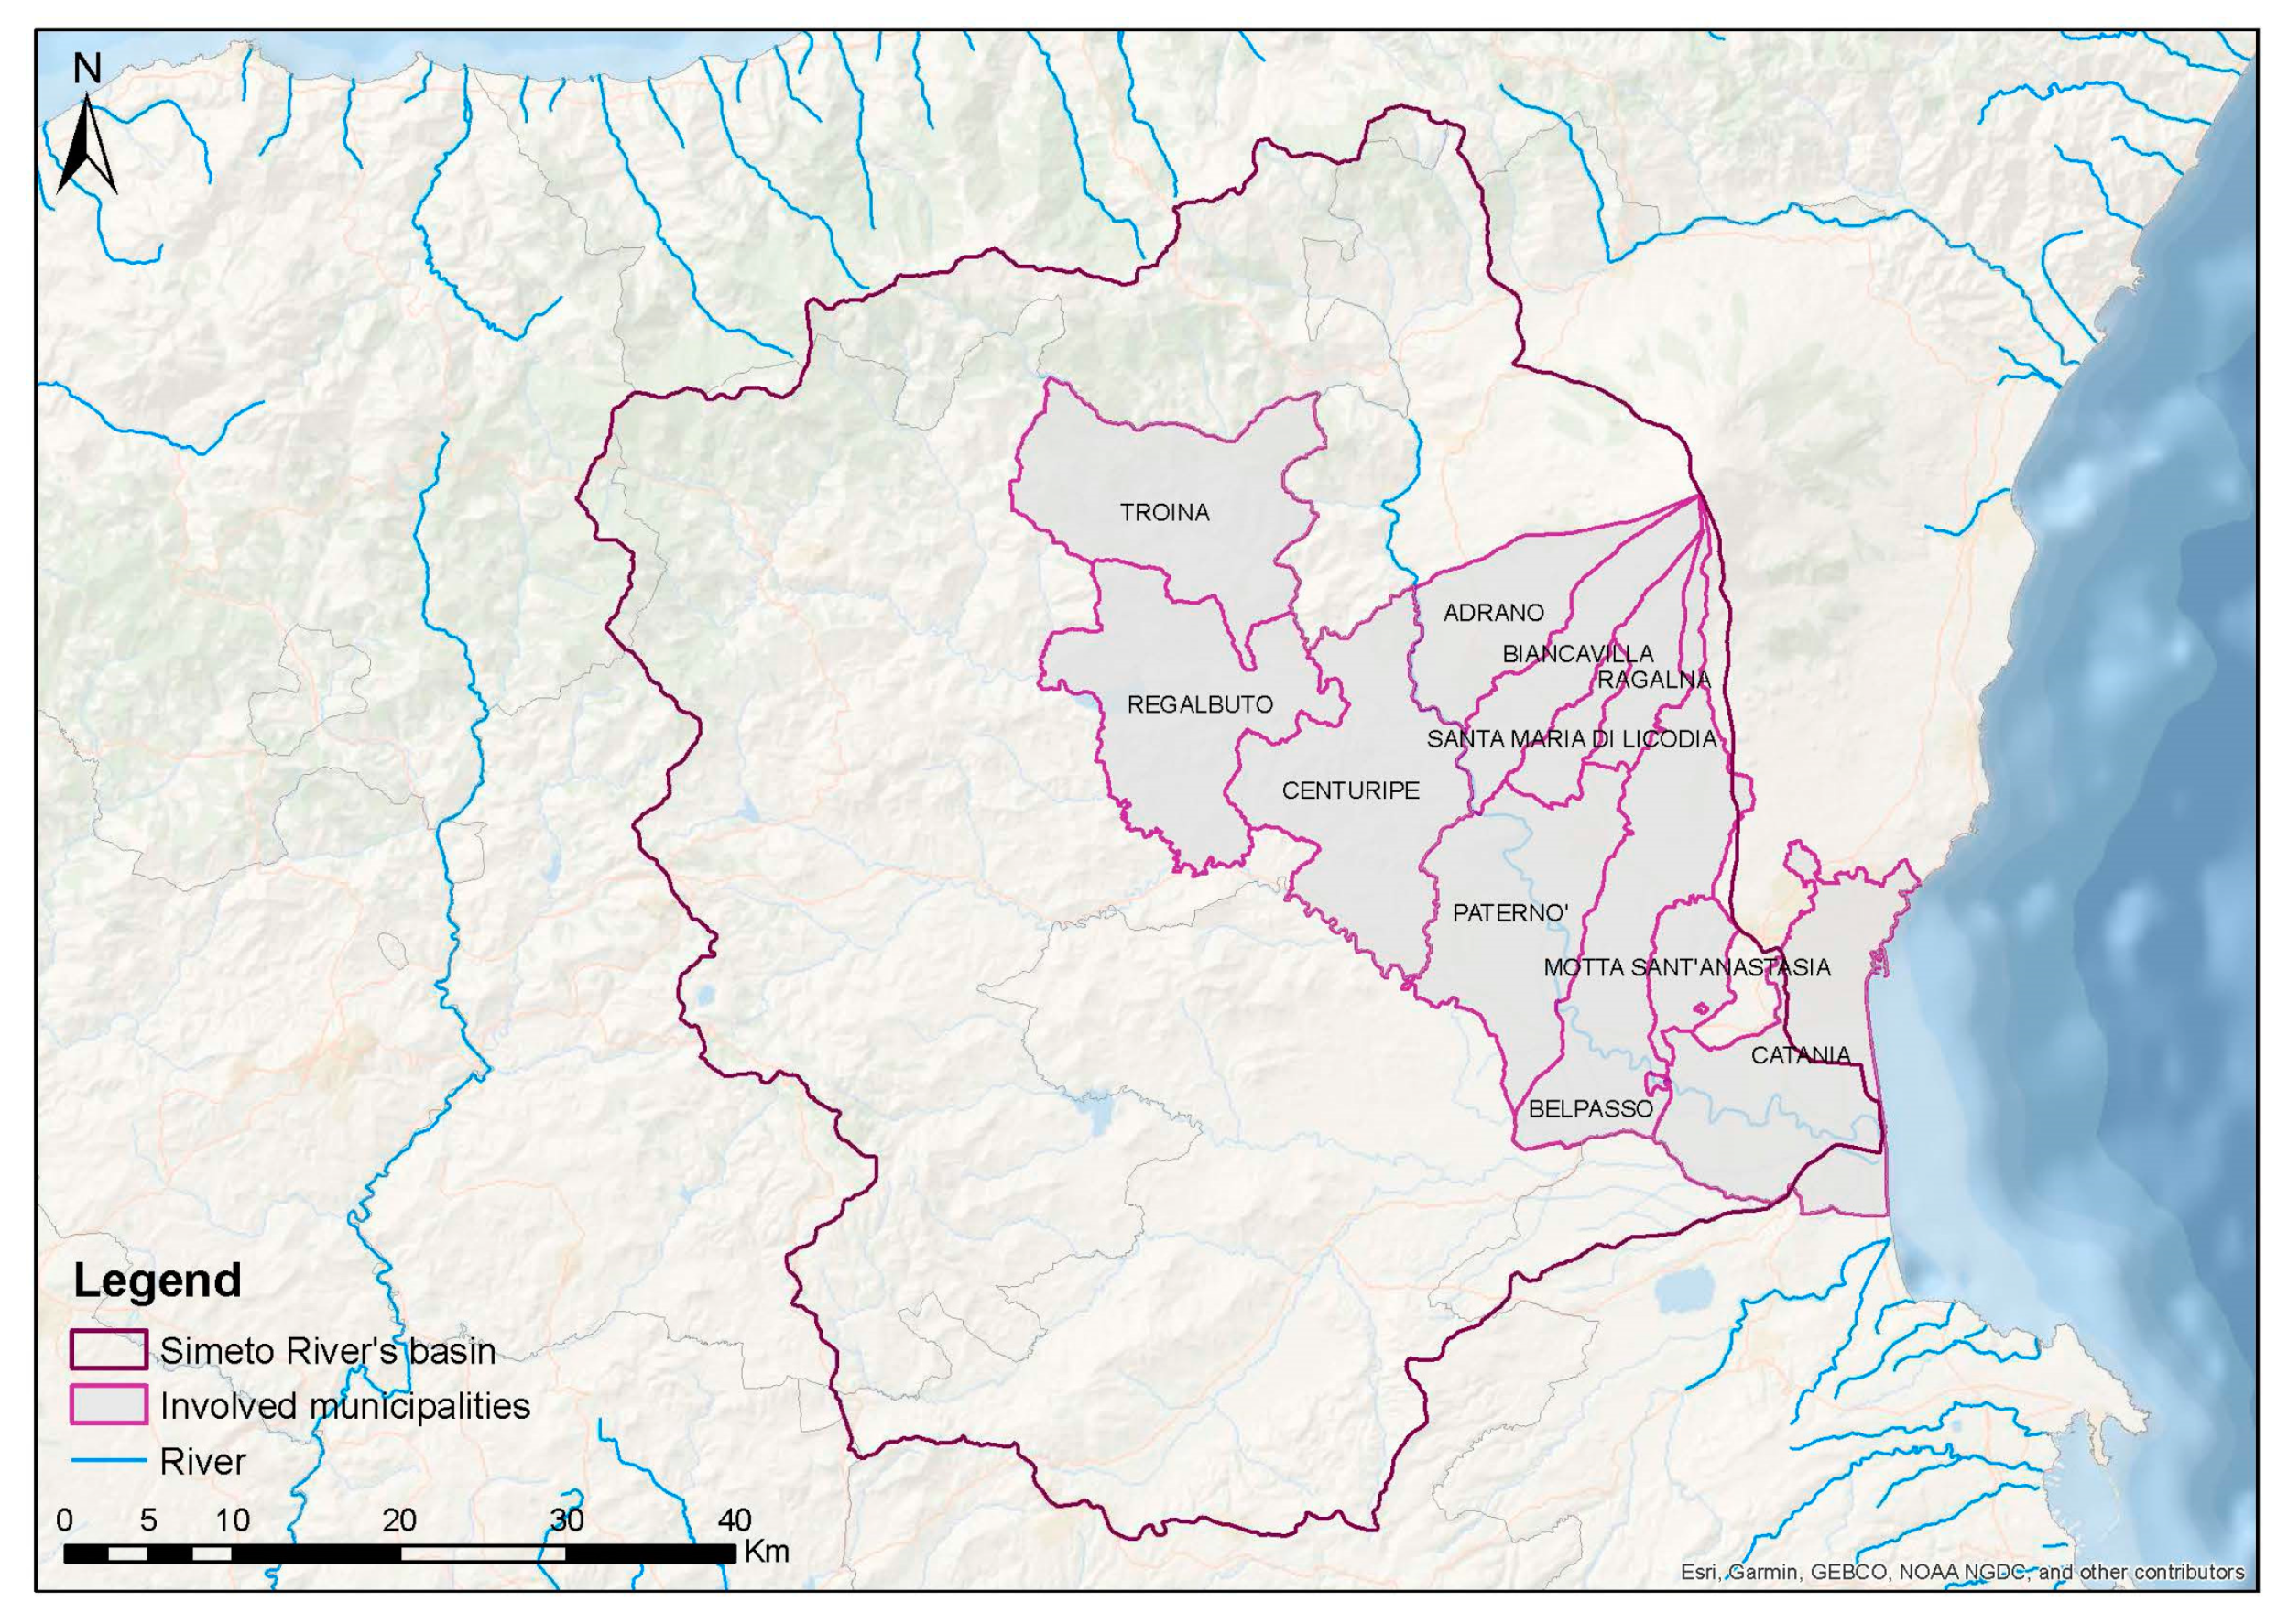
46], local administration bodies and the University of Catania, in 2015 the municipalities of Paternò, Ragalna, S.M. di Licodia, Motta Sant’Anastasia, Belpasso, Biancavilla, Adrano, Centuripe, Troina, and Regalbuto, for a total of about 100,000 inhabitants, the PSRA and the University of Catania have signed the Simeto River Agreement (SRA), a river contract aiming at encouraging local development through participatory approaches (Figure 2). Figure 2 shows the location of the municipalities involved in the SRA along with the location of Catania, where the University of Catania is based, and where the present survey was also administered.
The pluviometric regime in the Simeto River basin is characterized by maximum average values in the month of December and, progressively smaller, in the months of January, November, and October and the minimum average values in July or in August. The Simeto River basin, particularly in the central area at higher elevations, is subject to heavy rainfall events in autumn and spring [47]. With the increase of urban sprawl, impervious surfaces replaced the more permeable ancient streets, small retention areas have been covered, and new roads interrupted the hillslopes or new constructions have been introduced. This intensive urbanization has not been accompanied by adequate retrofitting for urban flood control. In the case of the municipalities on the slopes of Etna, the situation is further complicated by the need for an inter-municipal view of stormwater management, which is seldom fostered. The development of commercial, industrial, and urbanization services along the road axes realized a real urbanized continuum. It follows that this area is particularly vulnerable to changes induced by geomorphological and hydrogeological processes, which may exacerbate if solutions are not properly implemented. The current Basin Plan technical documentation quantifies the hazard and risk related to geo-hydrological hazards for the municipalities of the Simeto Valley. A summary of the figures for hydraulic and geo-hydrological hazard is shown in Table 1 and Table 2. These data can be an element of comparison with the results of the survey, i.e., to see how risk awareness of the population corresponds to the expert knowledge of flooding hazard in the area. It is worthwhile to mention that, in such technical documentation, geo-hydrological risk is defined as the risk connected to the instability of the slopes, due to particular geological and geomorphological processes, while the hydraulic risk is linked to large river flooding following particular environmental, atmospheric, or meteorological and climatic conditions affecting rainwater and their hydrological cycle, with possible consequences on the safety of the population and on the safeguard of services and activities. As shown in the table of geomorphological hazard (Table 1), the municipalities with the highest surface area at risk are Centuripe, Regalbuto, and Troina, while the ones with the highest surface at hydraulic risk (Table 2) are Catania, Paternò, and Belpasso.
In addition to these figures, it should be mentioned that the SRV has been repeatedly hit in recent years by intense pluvial flooding events, caused by heavy rain in combination with an overwhelmed drainage system. These events proved that it is important to develop strategies with different time horizons and priorities for management alternatives to mitigate pluvial flooding risk.
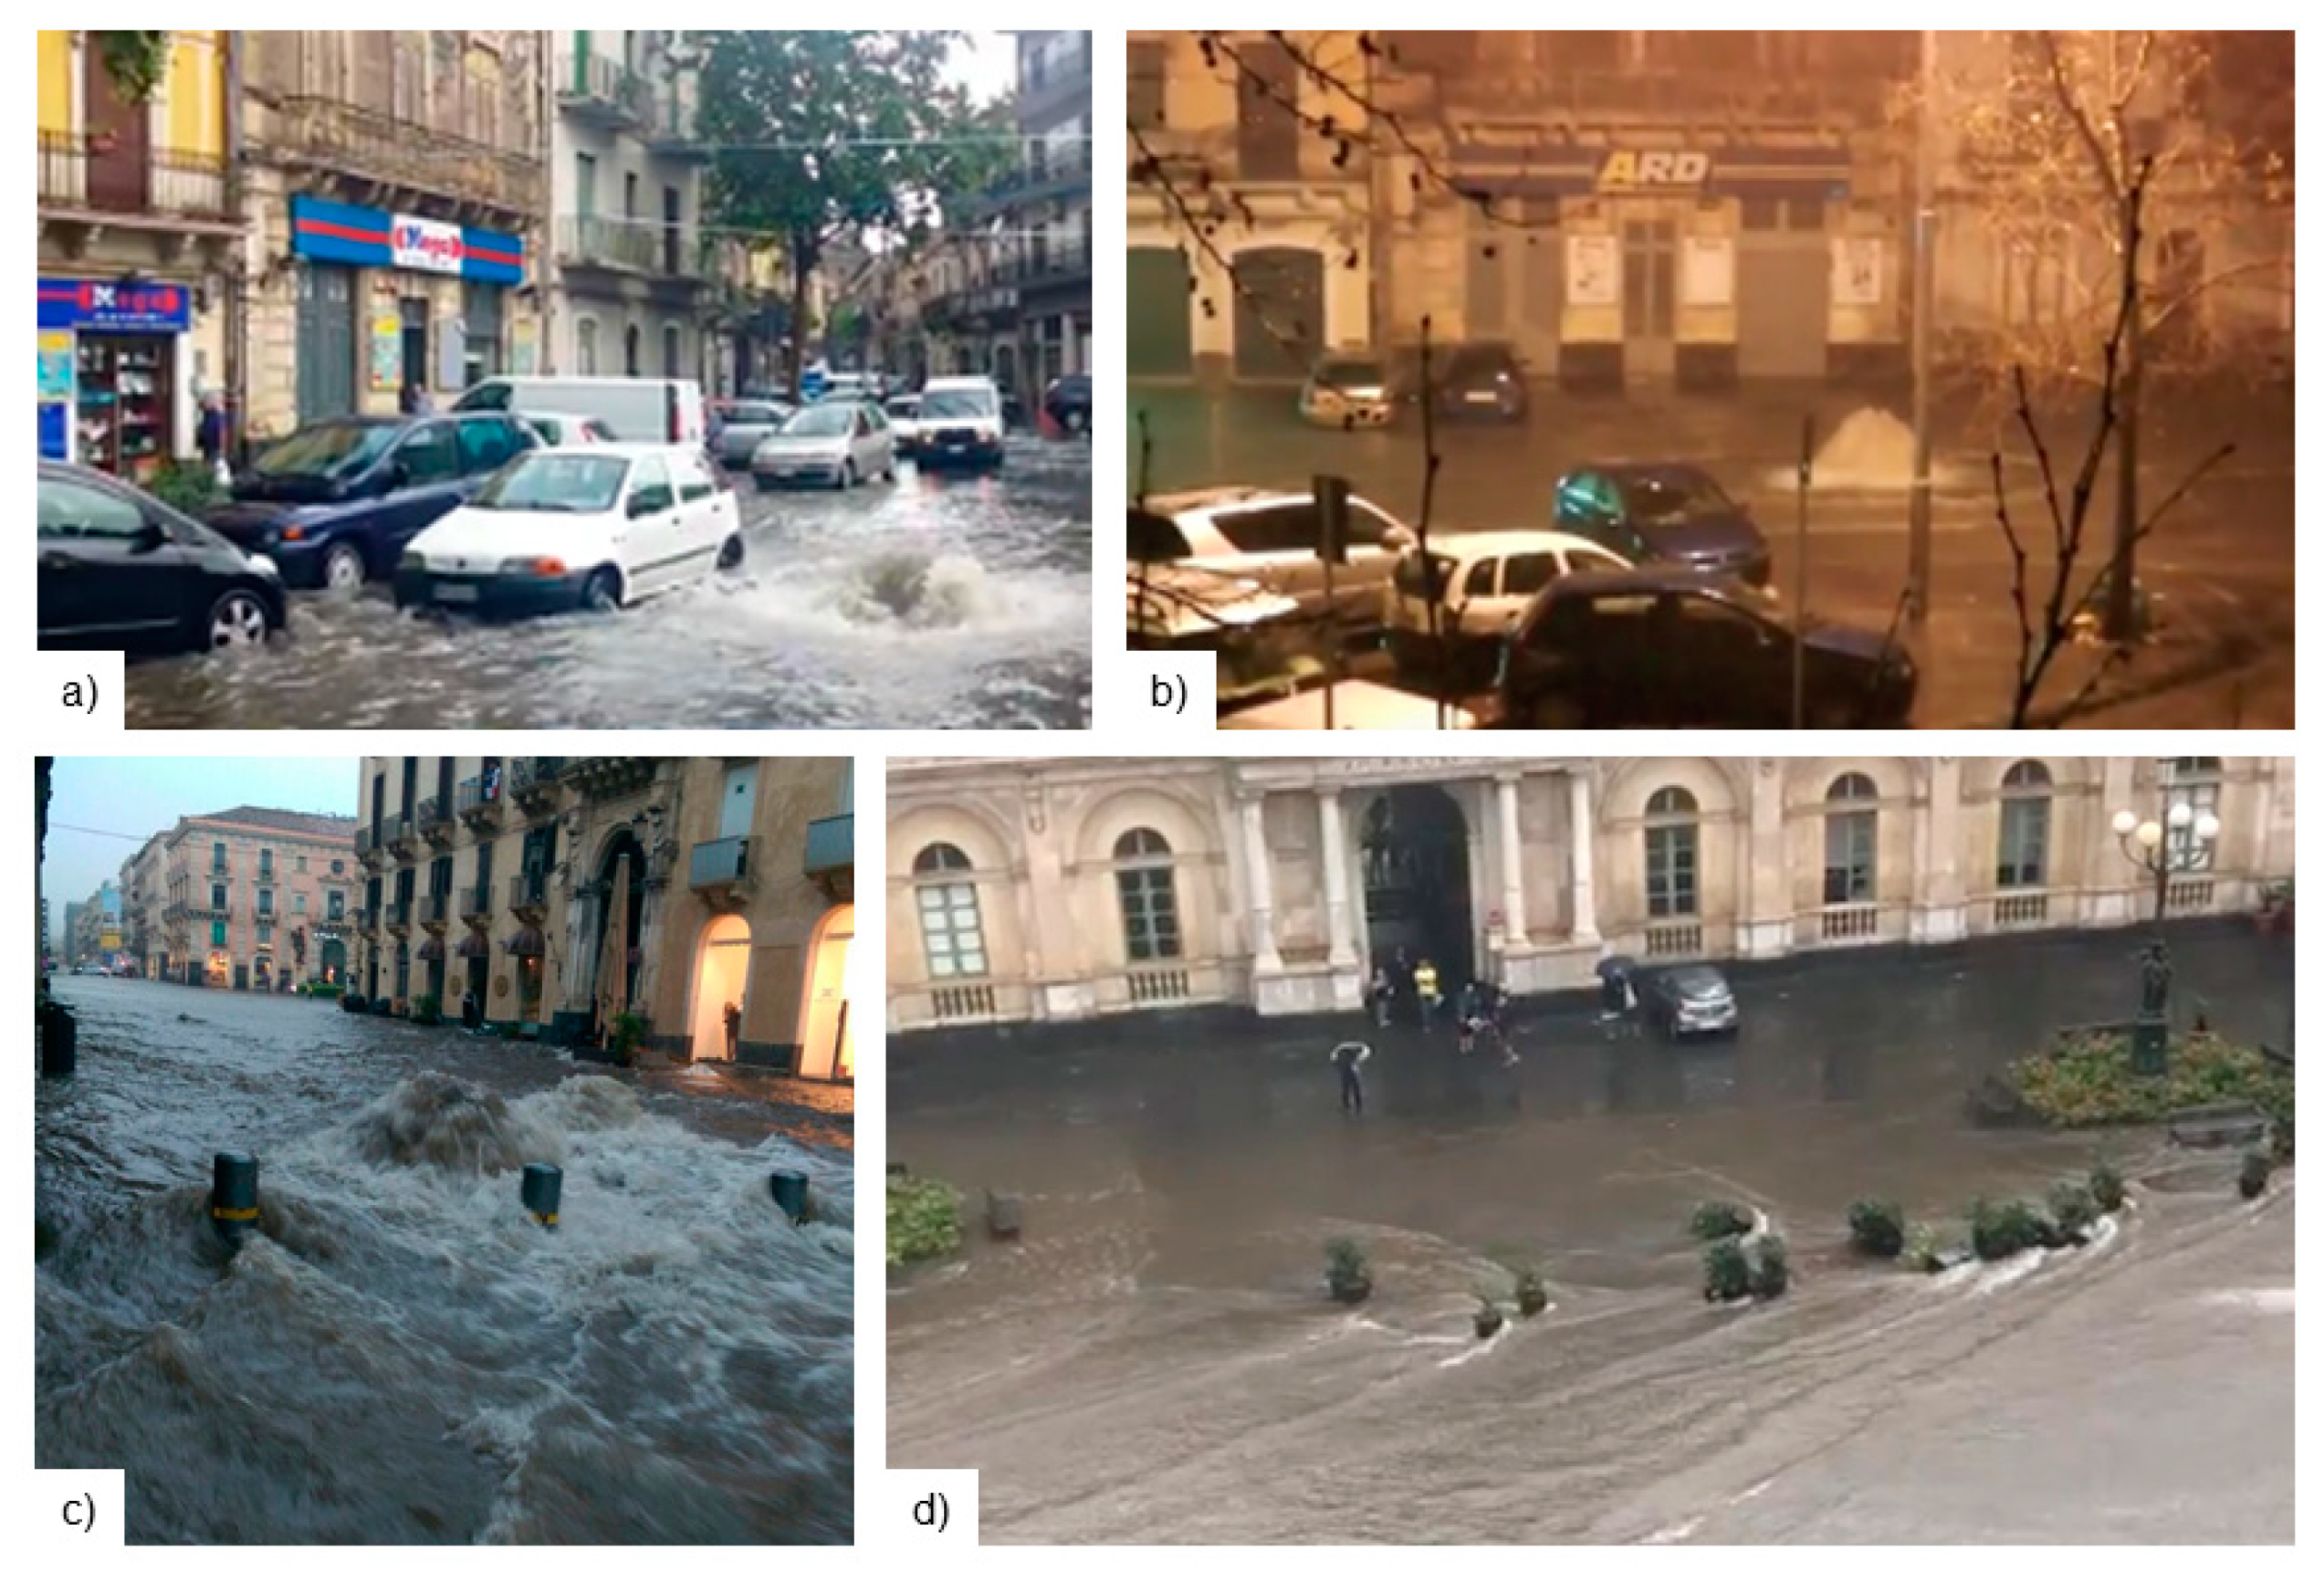
The city of Paternò, which has about 50,000 residents, has experienced several times pluvial flooding episodes that affected the entire city. For instance, in the fall of 2009 and subsequently, in November 2011, March 2013, and August 2015, this city has been hit by intense rainfall and the city drainage system proved insufficient, with the consequence of flooding of the roadways and damages to public and private buildings. More recently, in October 2018, a flood caused a dangerous situation near the riverbed of the Simeto River, where some houses that fall along the banks had already been invaded by water and mud. The greatest damages recorded were those caused by the overflow of the Simeto River. The waters of the river invaded the Catania-Siracusa Highway, which was temporarily closed. Another event occurred in October 2019, when Paternò and the surrounding cities were hit by a heavy storm. The situation appeared critical and the peripheral roads were invaded by water and mud, a person was trapped in an underpass. Another person was rescued in extremis by a truck driver after his car was left at the mercy of the river of mud with no possibility of movement. These episodes are just a few of the many signs that reveal the need for a better understanding of the potential risks for people’s lives during intense rainfall and consequent flooding. Figure 3 shows some images of floods of recent years in the cities of Paternò and Catania.
It is important to specify that insurance against flood damages is not so common among citizens. The Ministry of infrastructure and transport and the Ministry of the Environment and Land and Sea Protection, as well as local departments, allocate funds for hard and soft measures against floods and other natural disasters. State and Regional special laws are emanated in case of catastrophic natural disasters for compensating flood damages and for reconstruction of damaged areas.

2.2. Study Design

The design of the survey considered some other works, both Italian and foreign, which have a similar structure. For example, the municipality of Ferrara (Italy) in 2010 conducted a study based on nine multiple-choice questions to better understand knowledge, sensitivity, and interest in climate change through the population [48]. The Joint Disaster Management Risk Assessment and Preparedness in the Danube Macro-region project [49] conducted a study to evaluate climate change perception, submitting to citizens multiple-choice questions, as in our case, about the involvement by the media on the treatment of the topic, the perception of climate change compared to past decades (especially for the adult population) and the actual derived risks, including extreme precipitation events and floods. A study by Yale University estimates U.S. climate change beliefs, risk perceptions, and policy preferences at State and local scale using the Yale Climate Opinion Maps based on 2018 data [50]. This survey, with its about 20 questions with Likert scale [51], tried to investigate the opinions of the community regarding climate change and the risks deriving from it.
In 2017, the European Commission published the special Eurobarometer 459, with the result of a large-scale survey proposed in some European countries. The key topic was, again, the perception of climate change, but with a focus on the responsibilities of national governments [52].
The survey here in question, reported entirely in the Appendix A, consisted of 10 questions, some of them structured with answers requiring a numerical value, following the Likert scale [51]. The questions were formulated independently against each other and their number was reduced to the minimum in order to keep it less tedious for respondents, in order to reach a high number of participants.
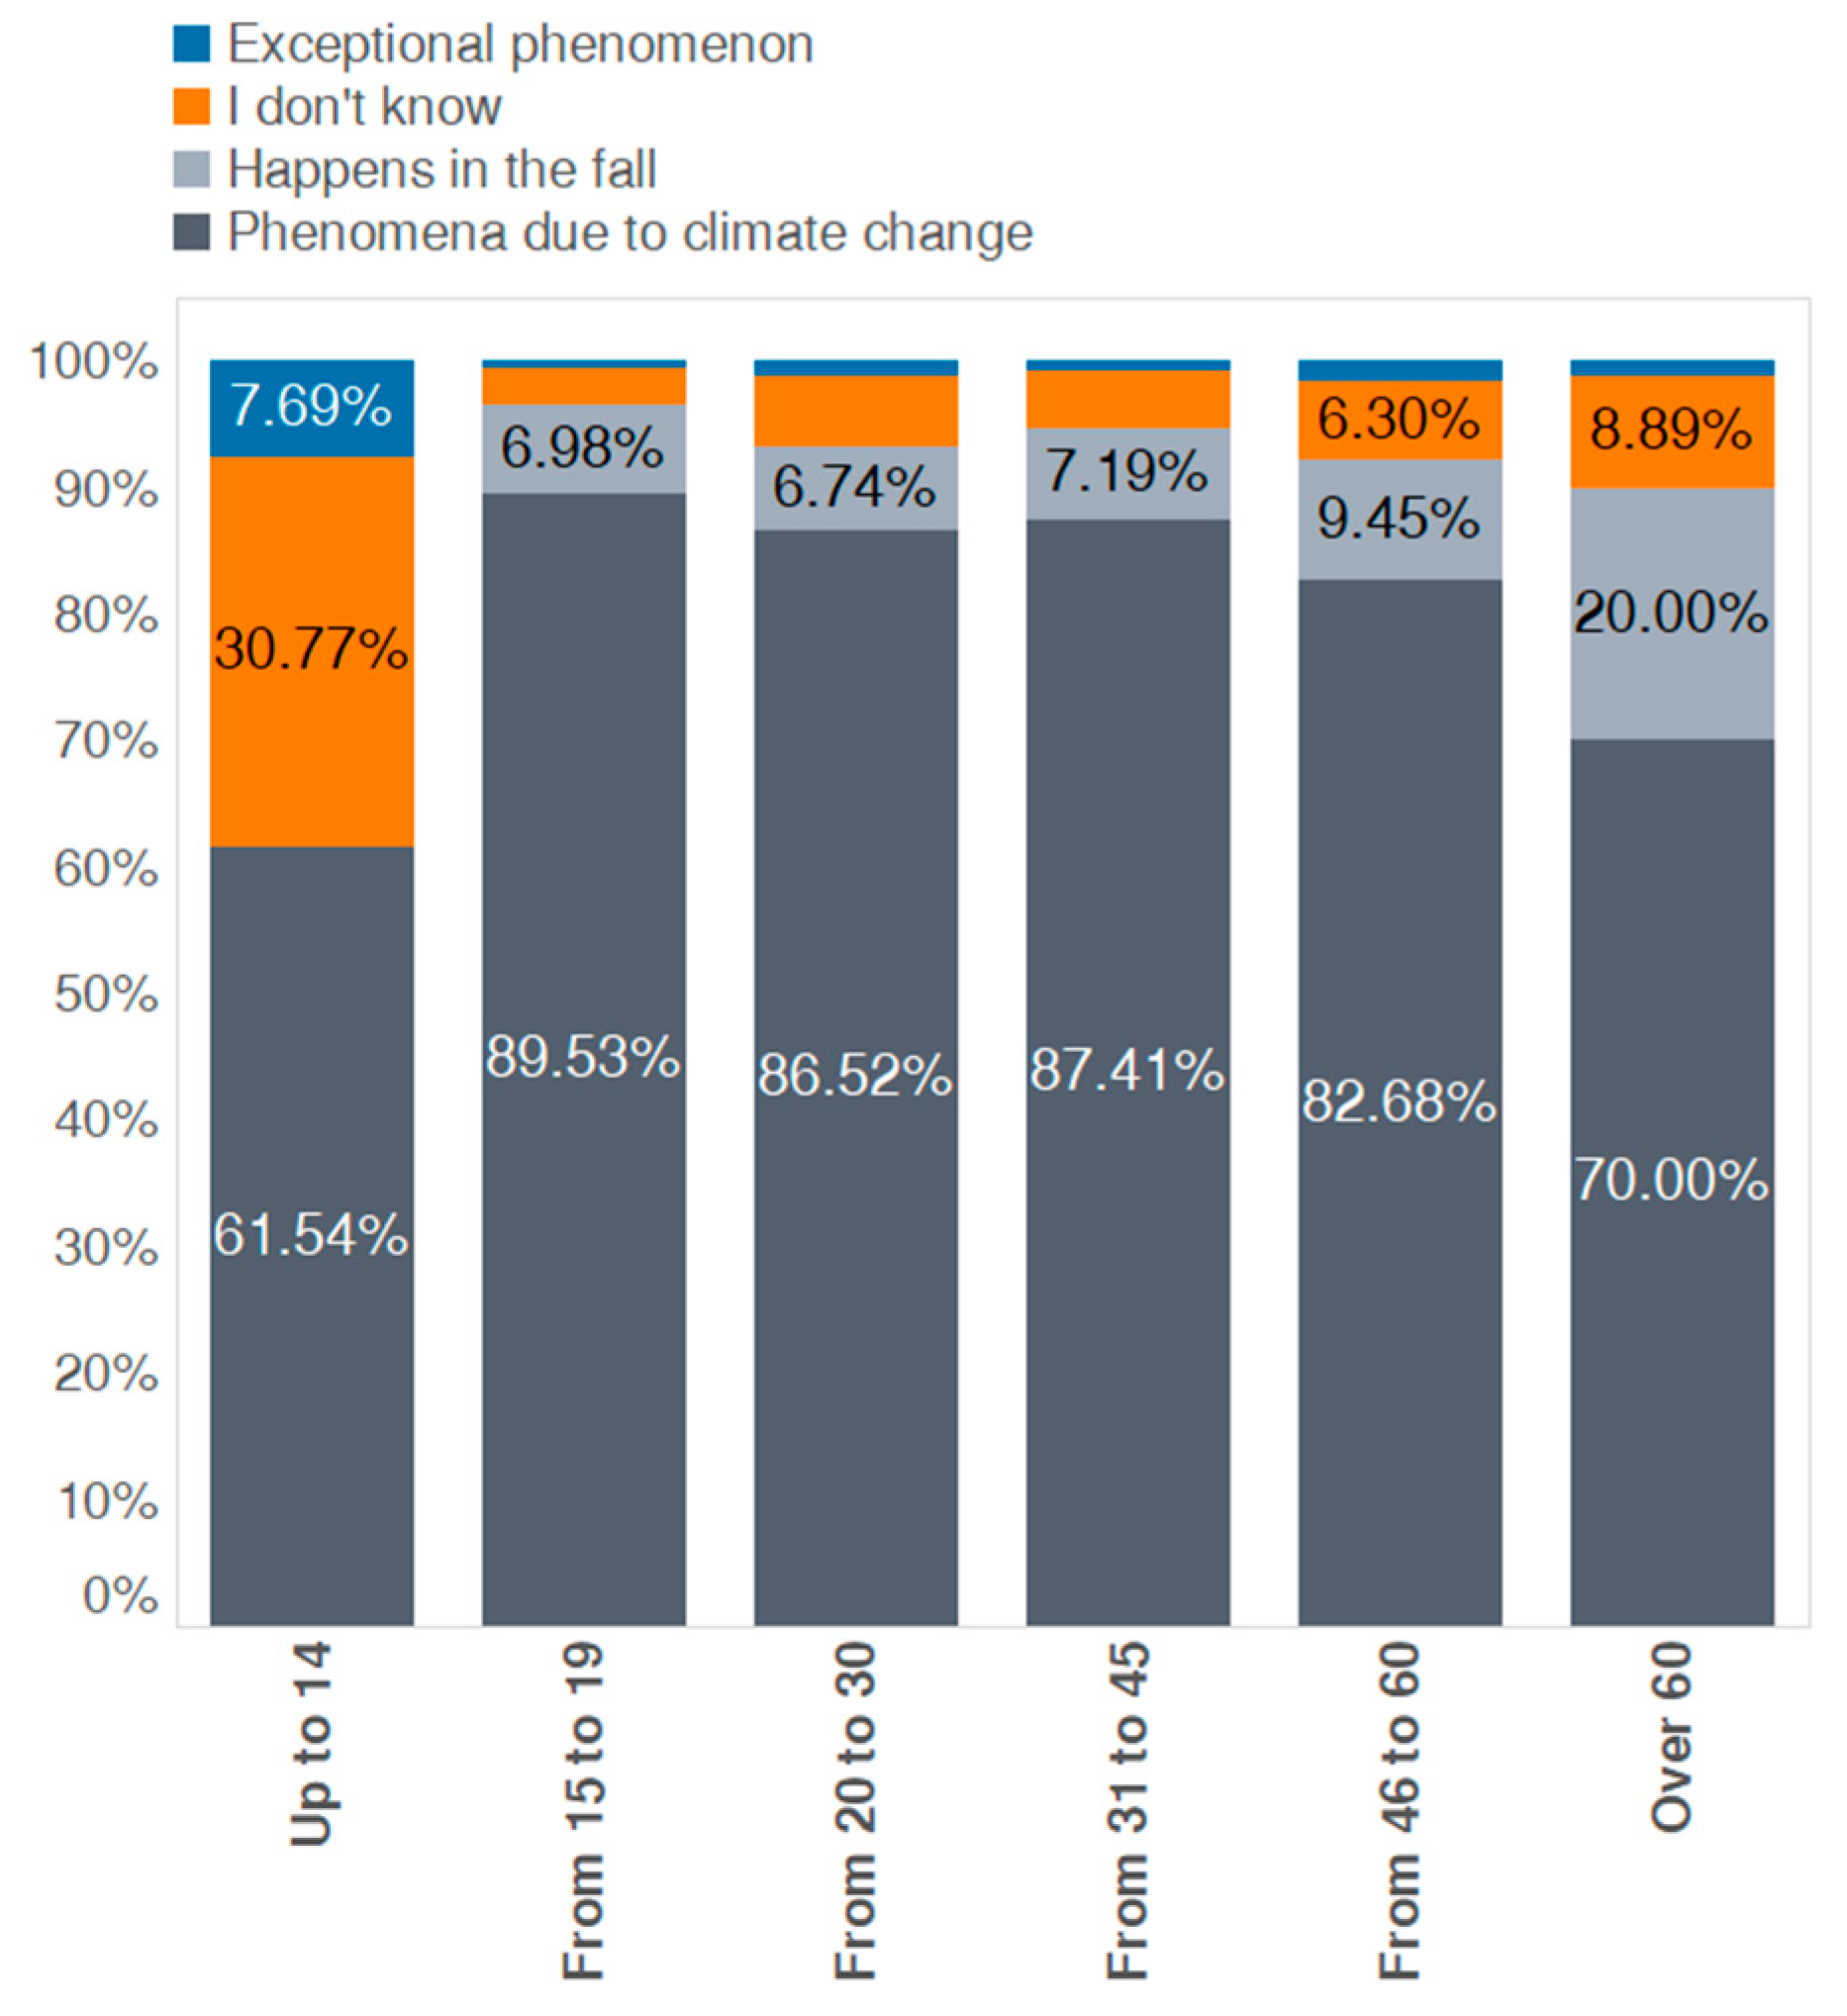
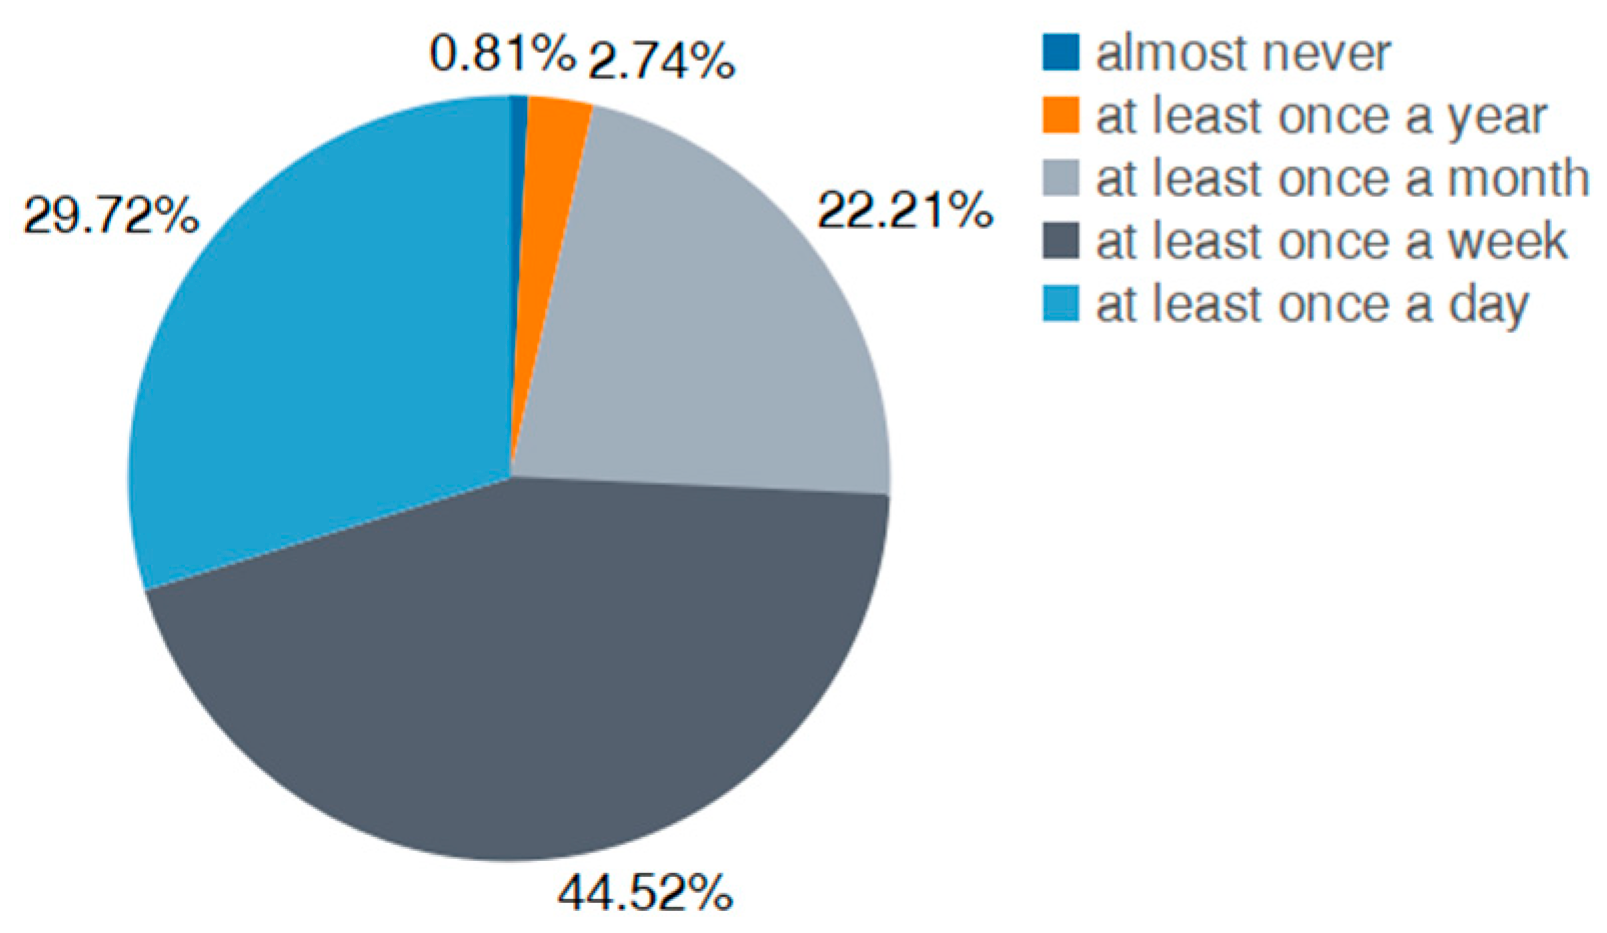
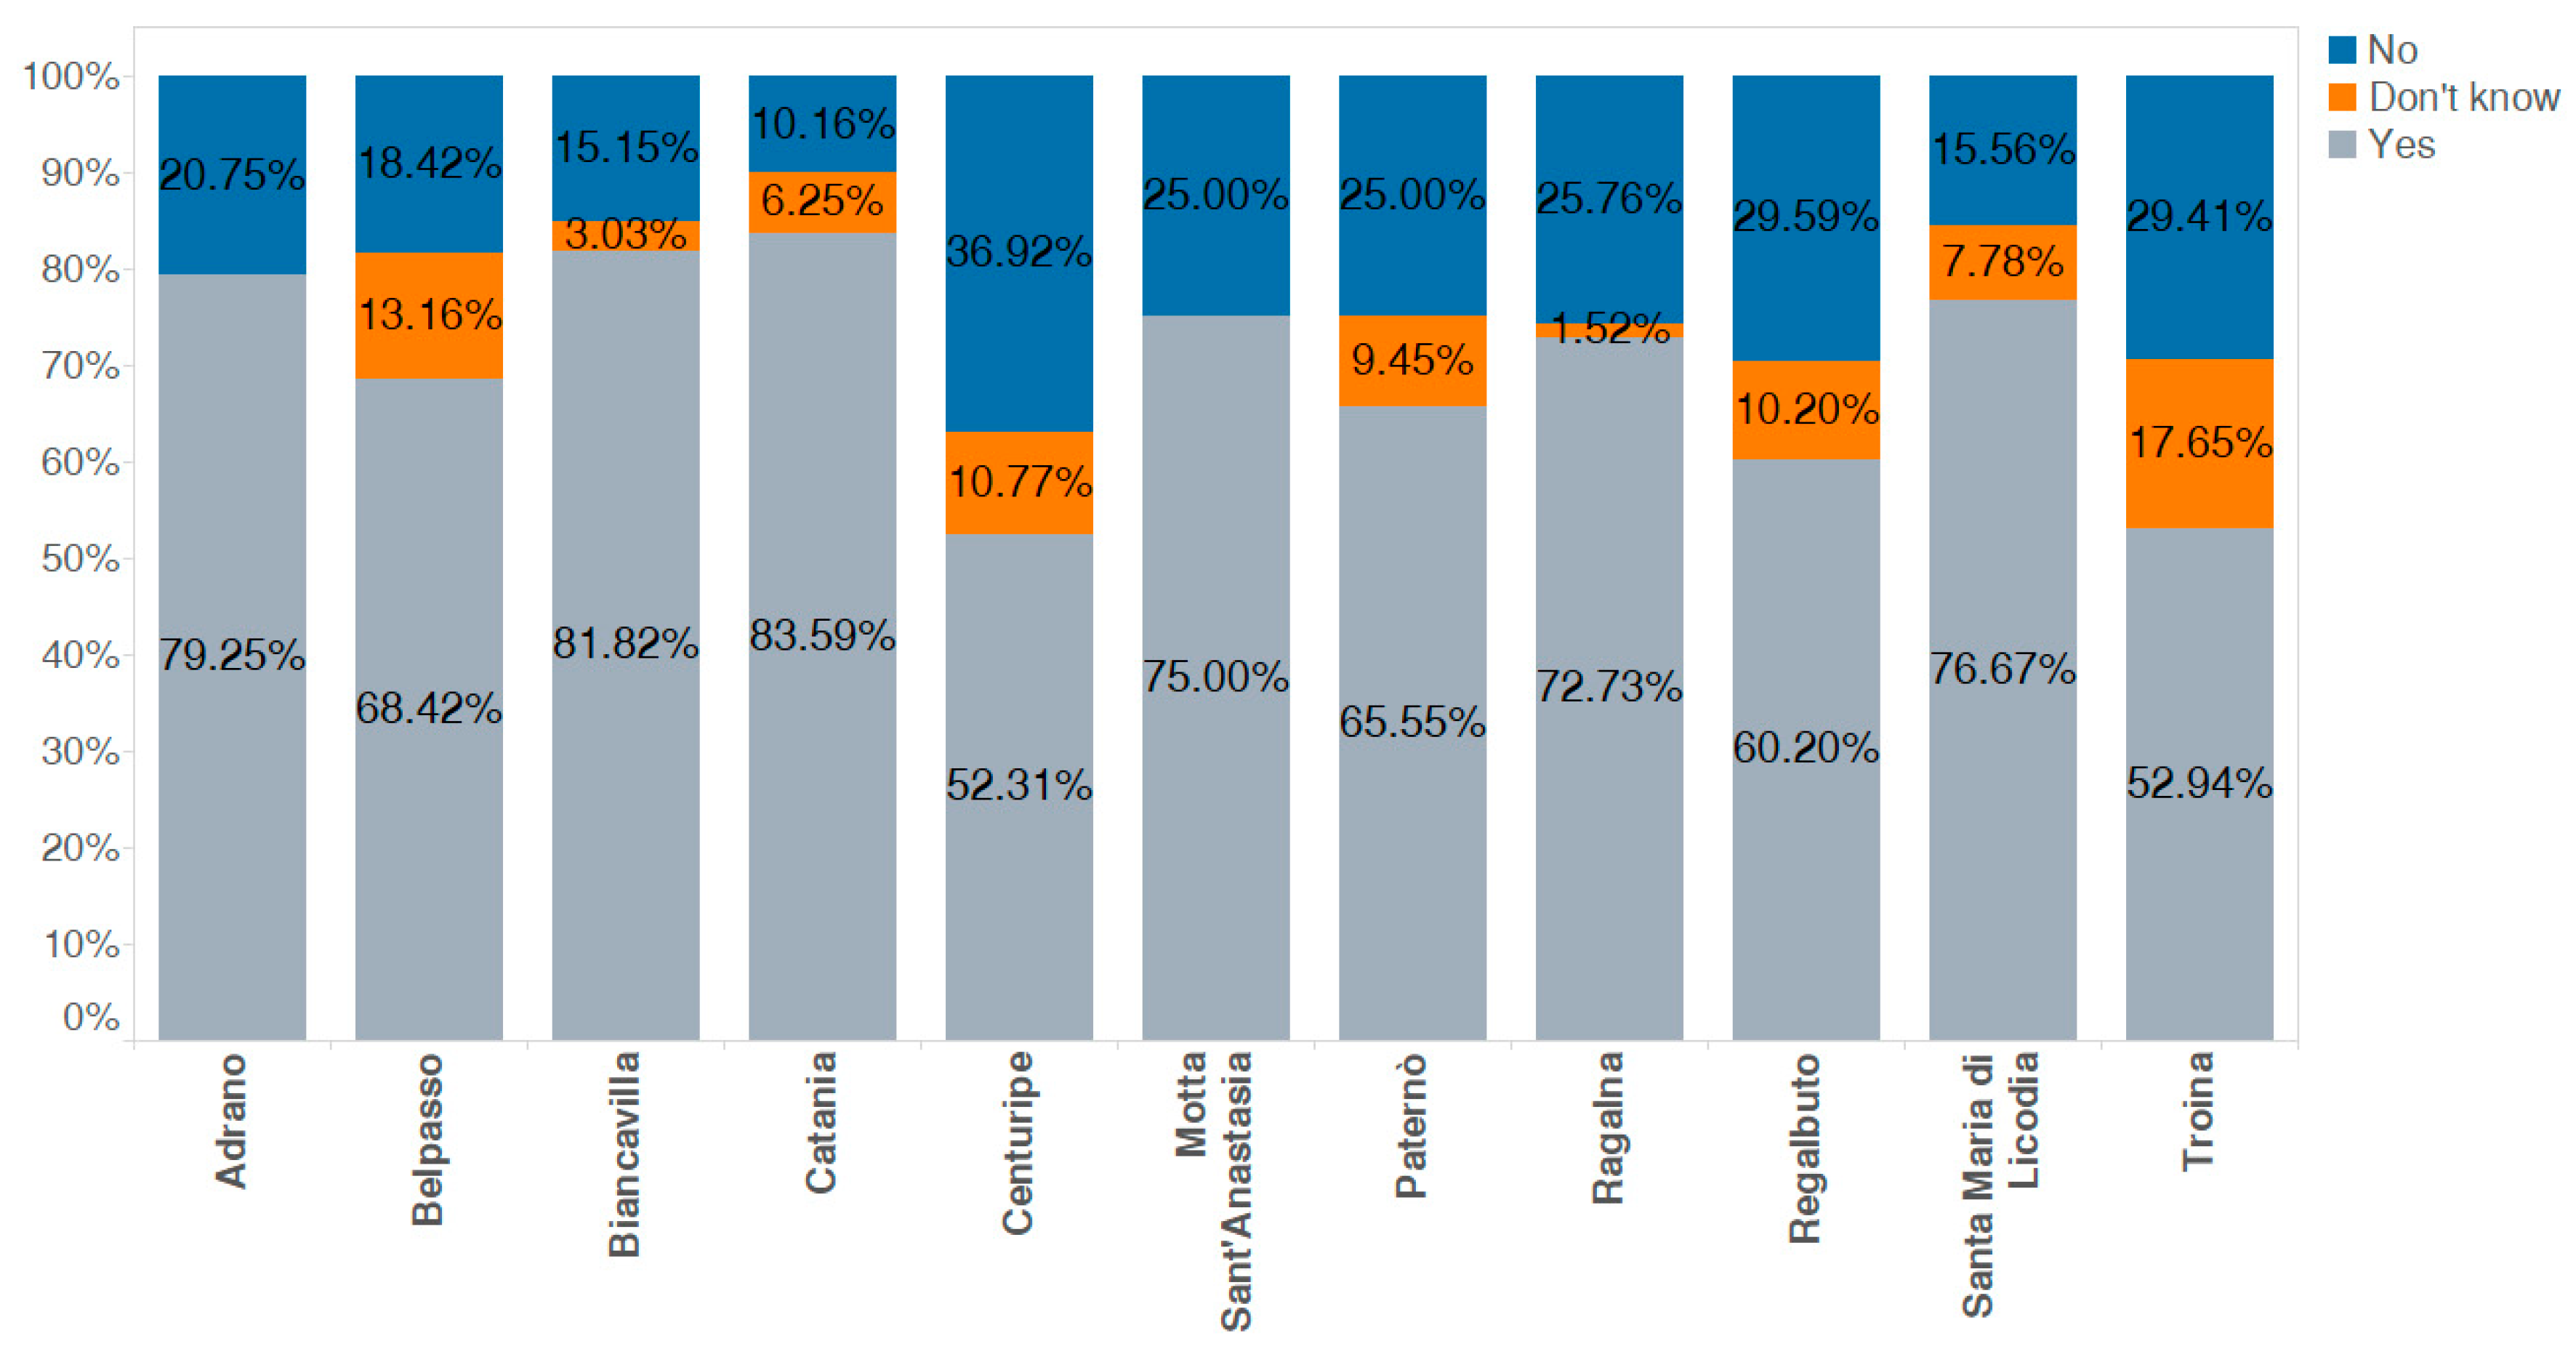
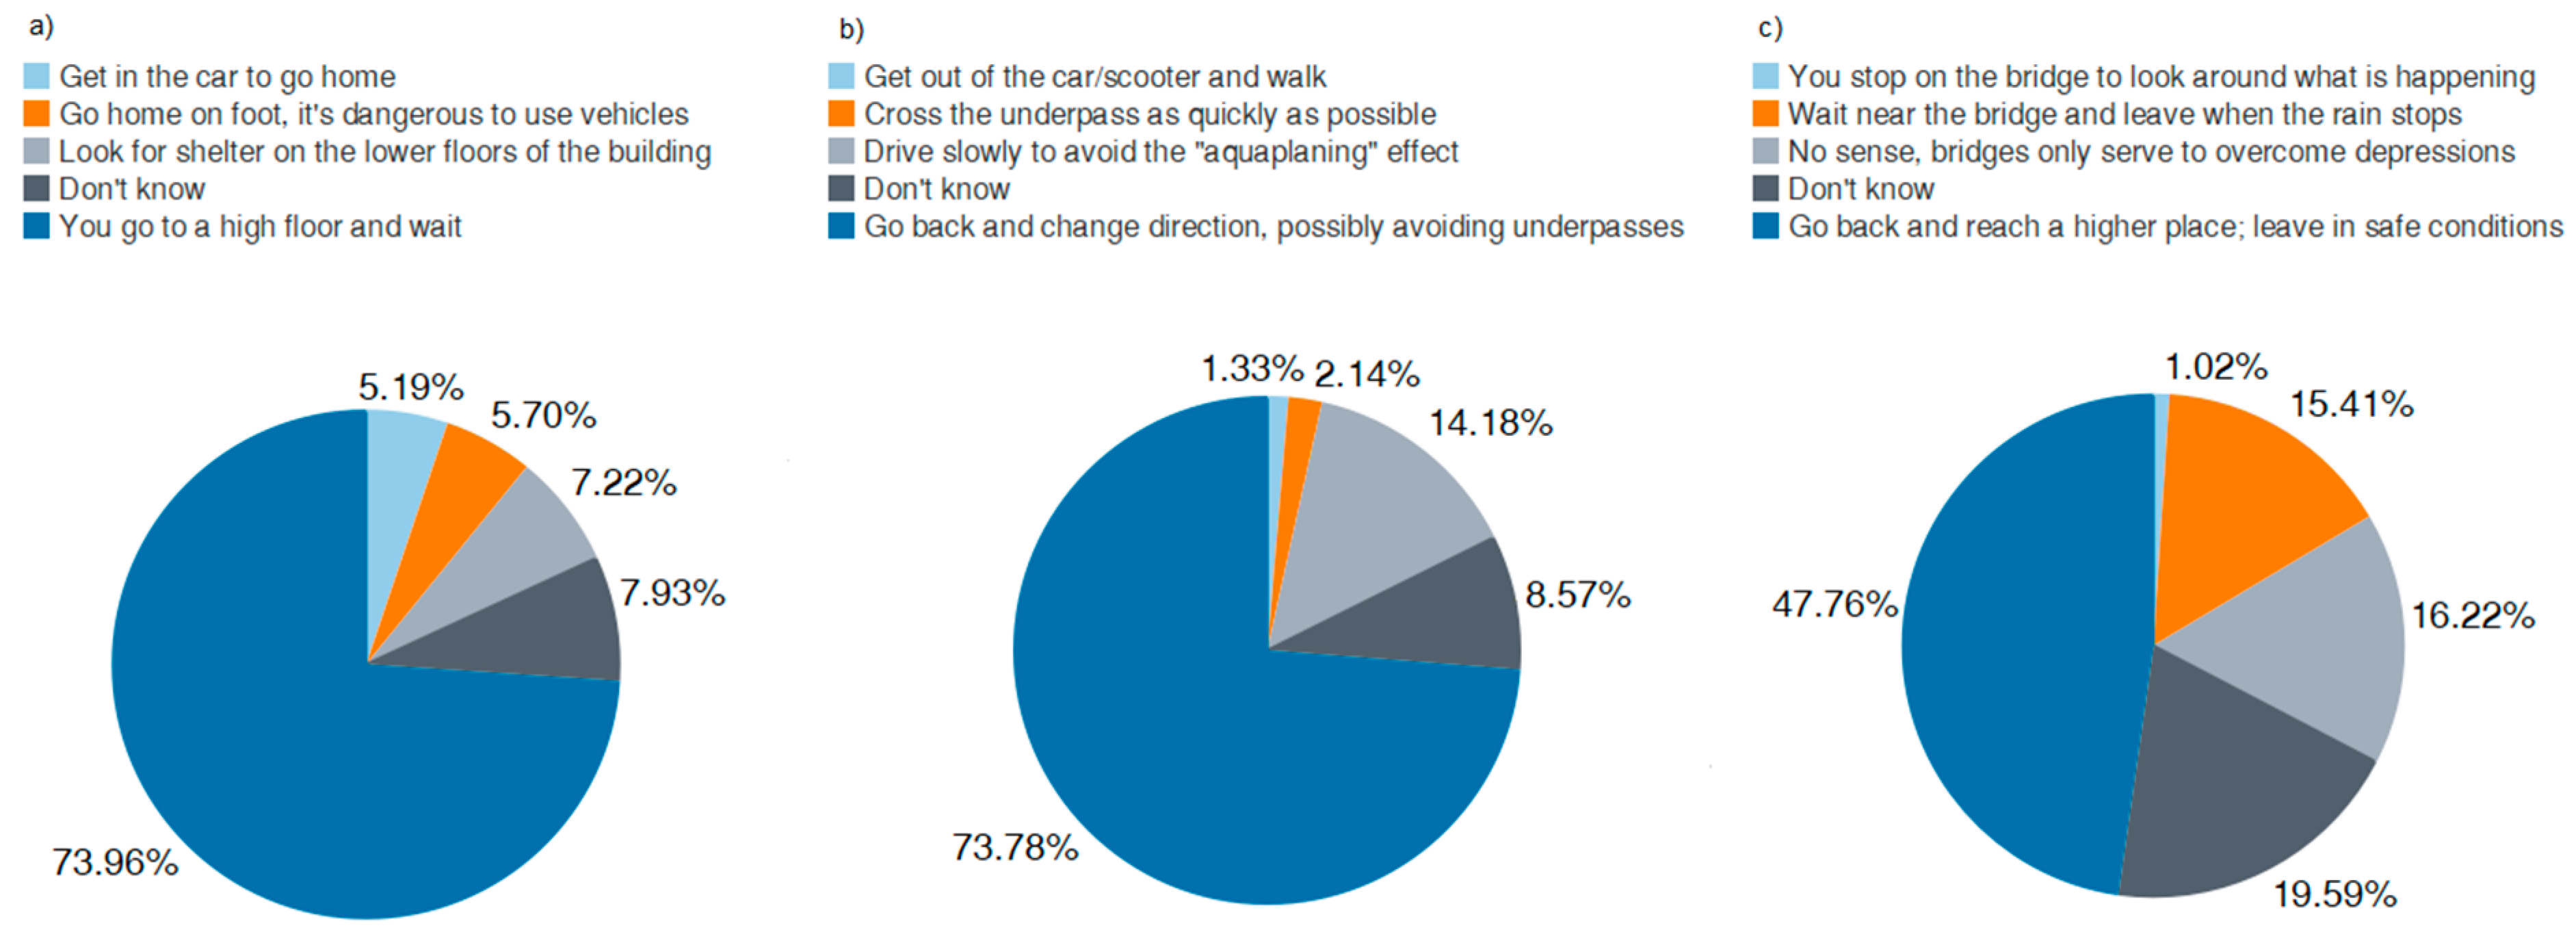
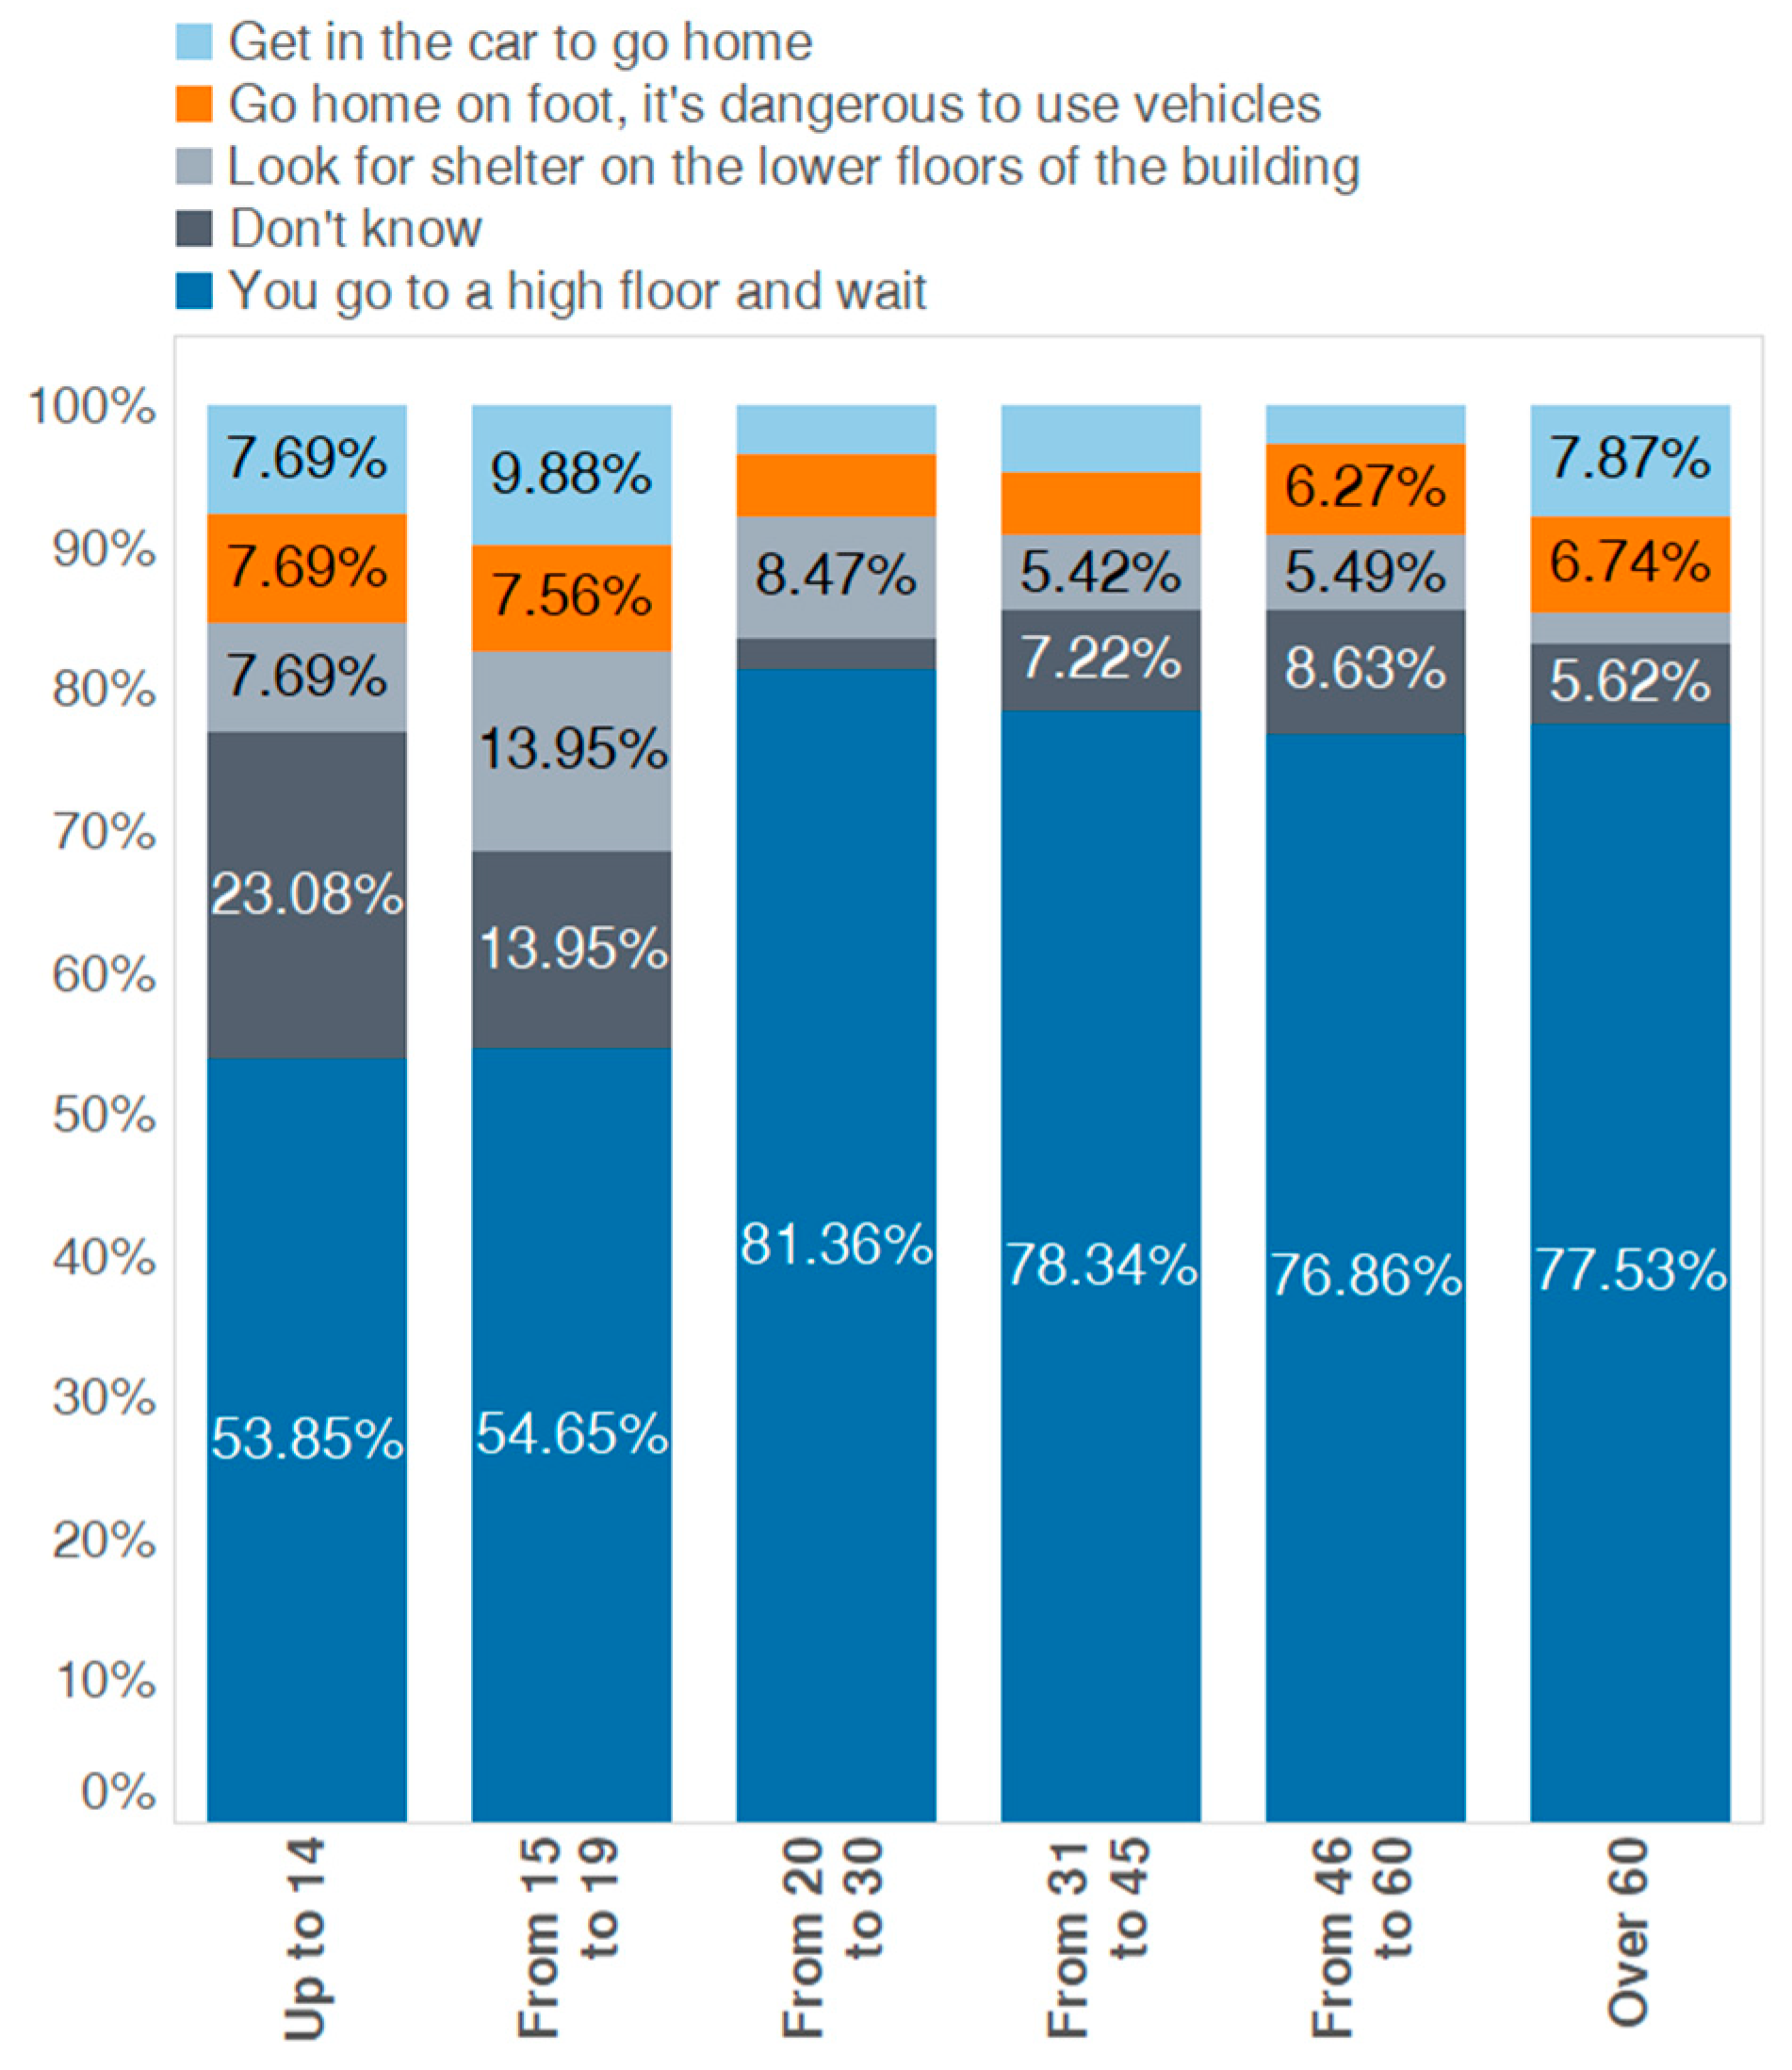
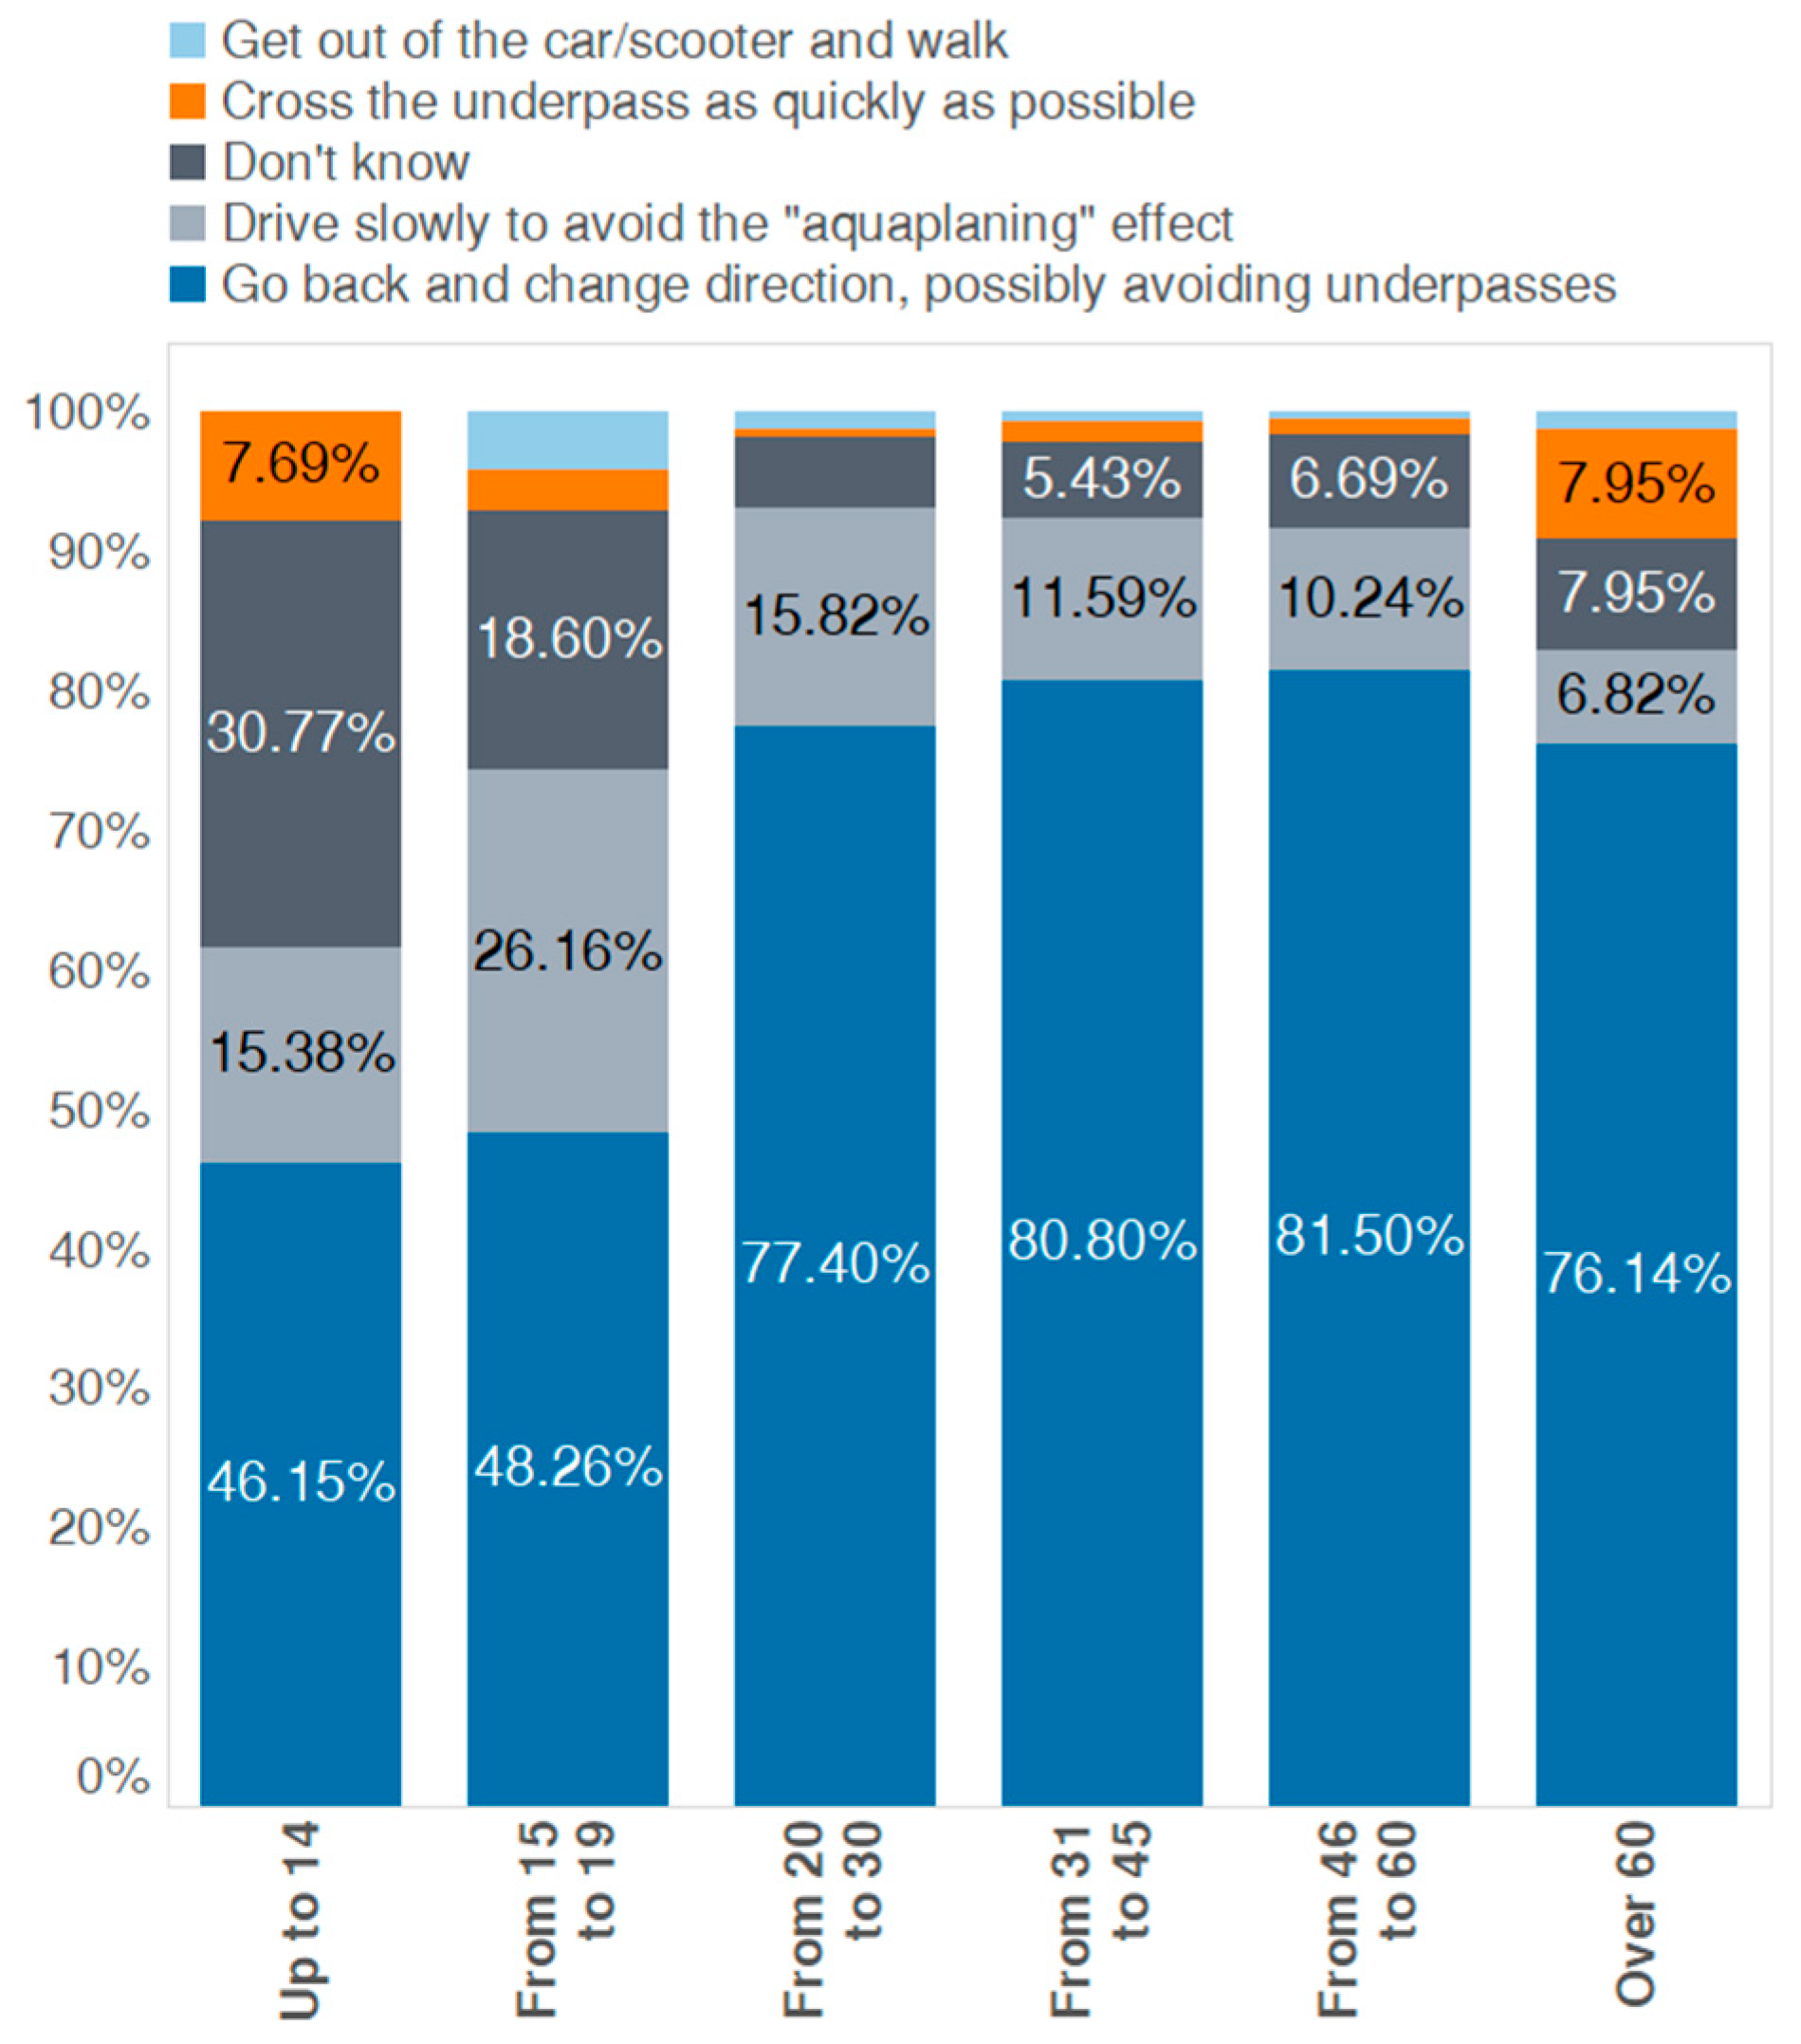
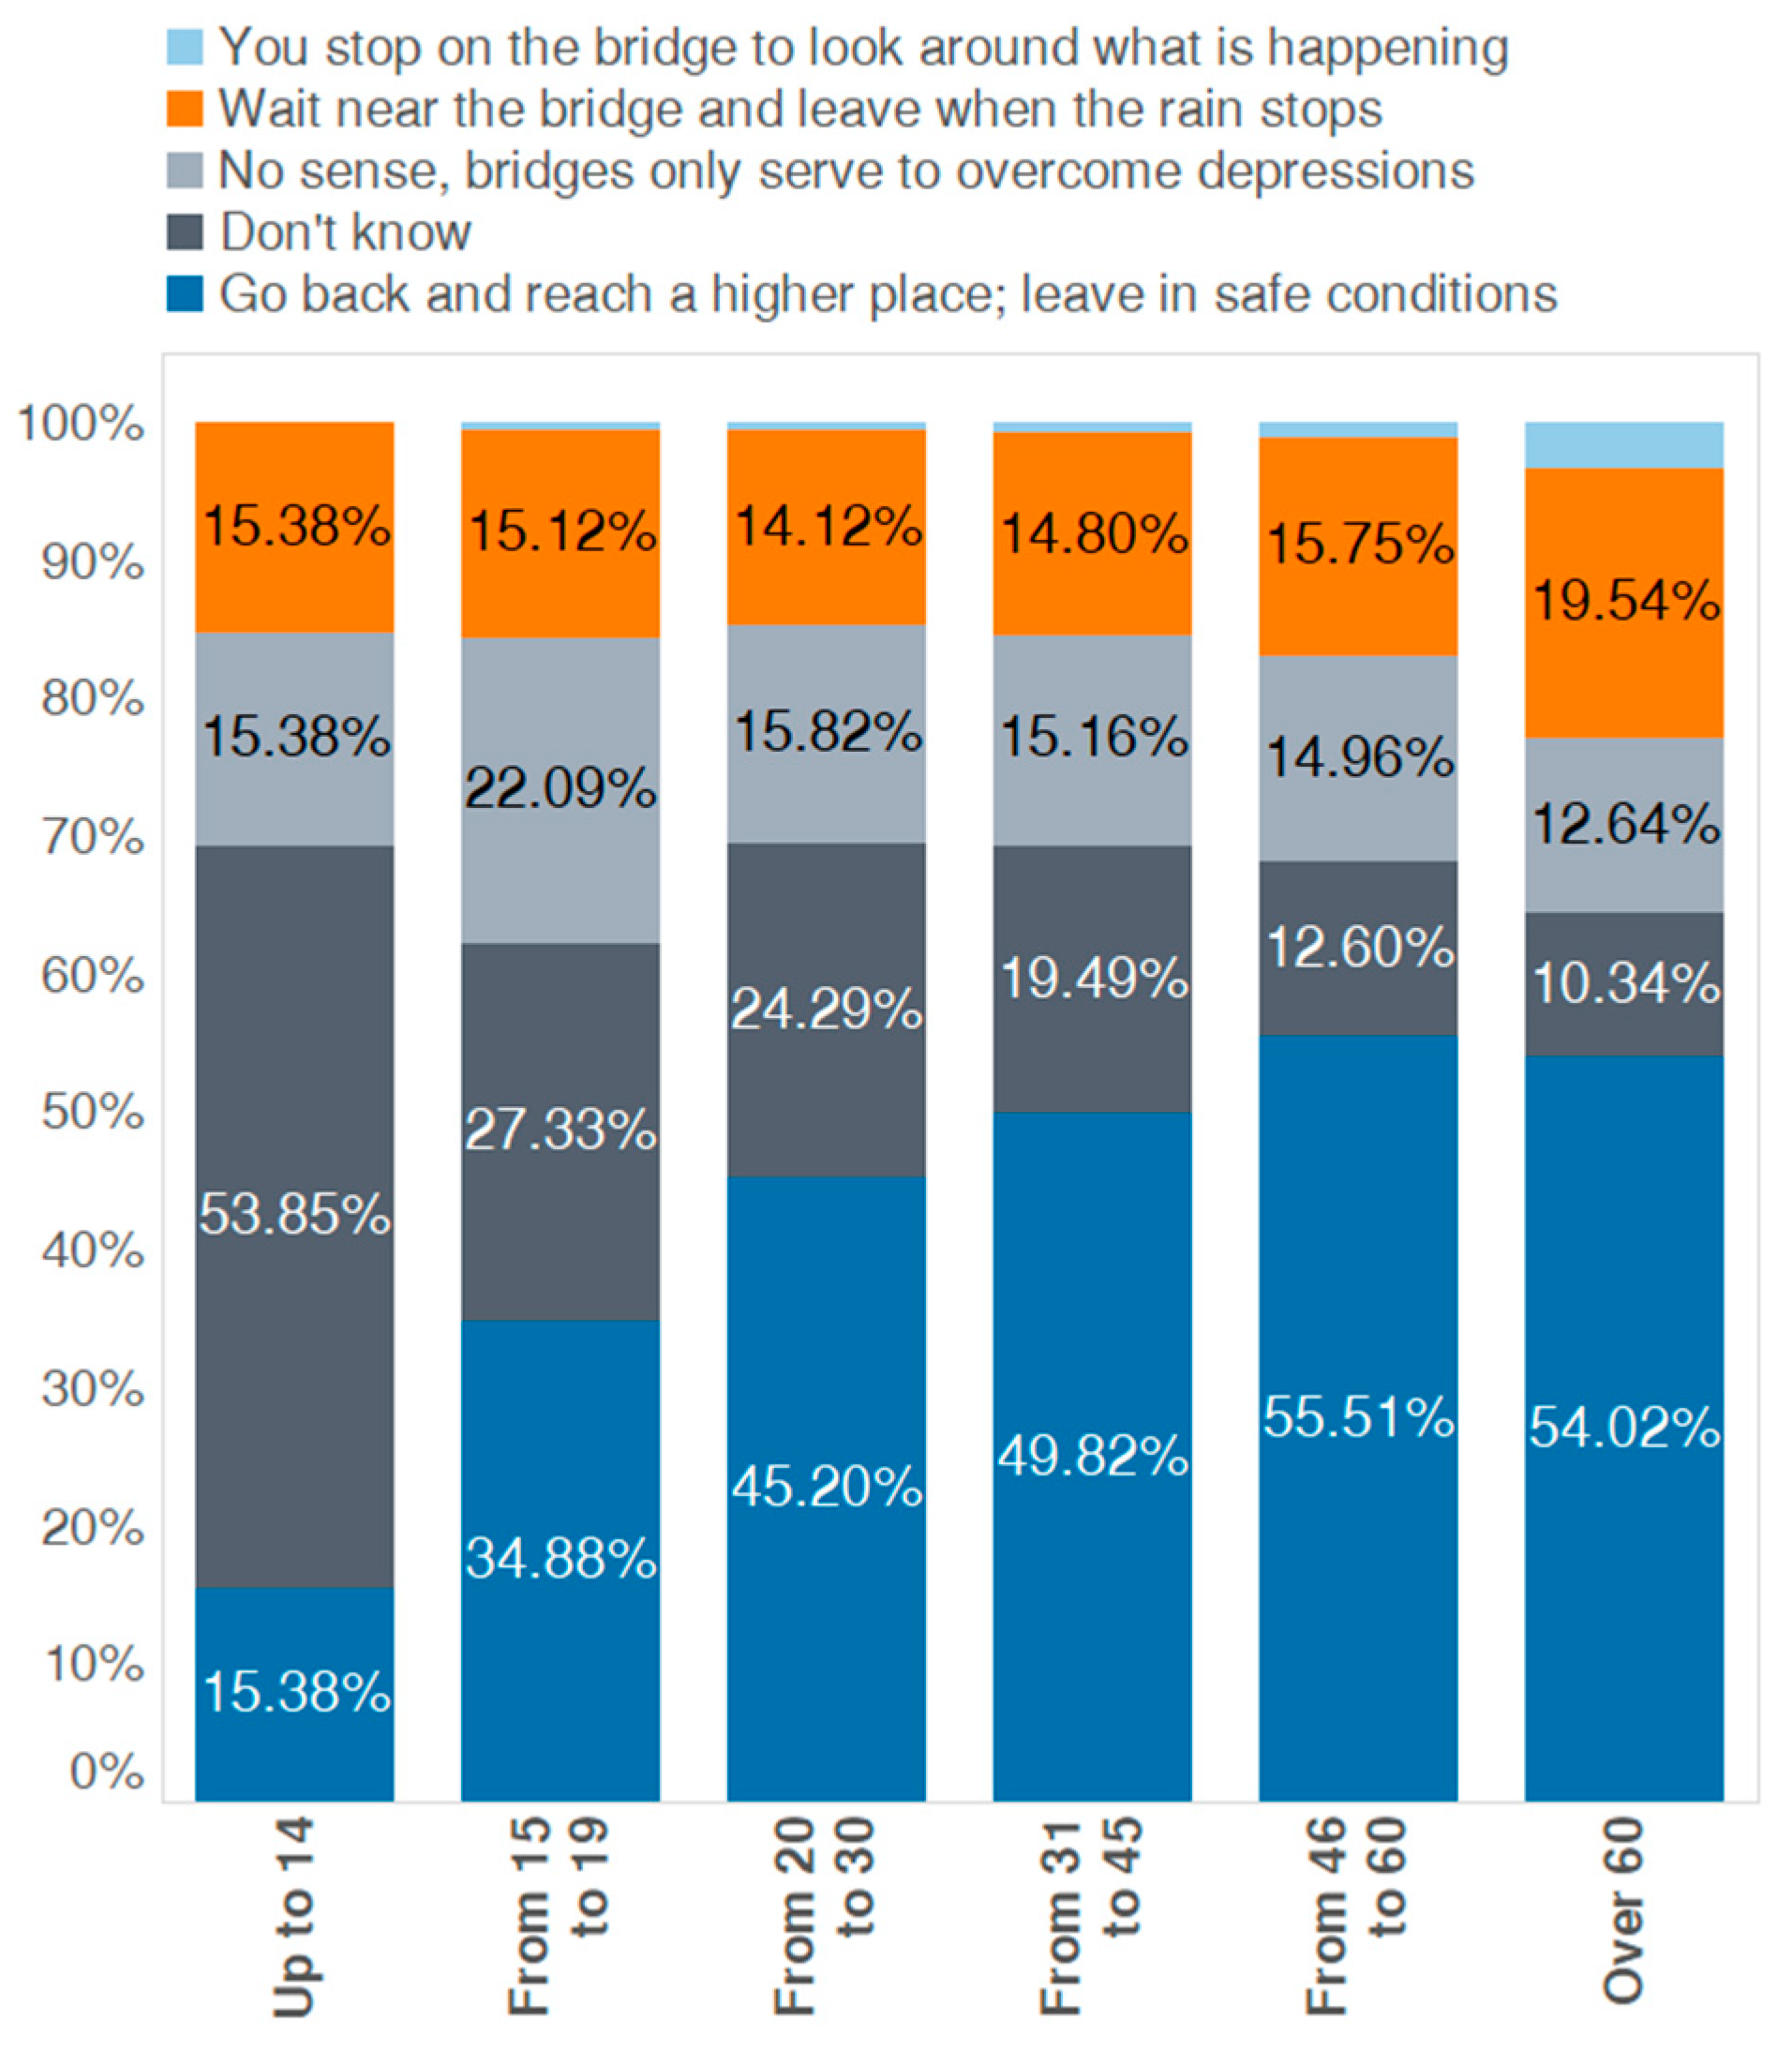
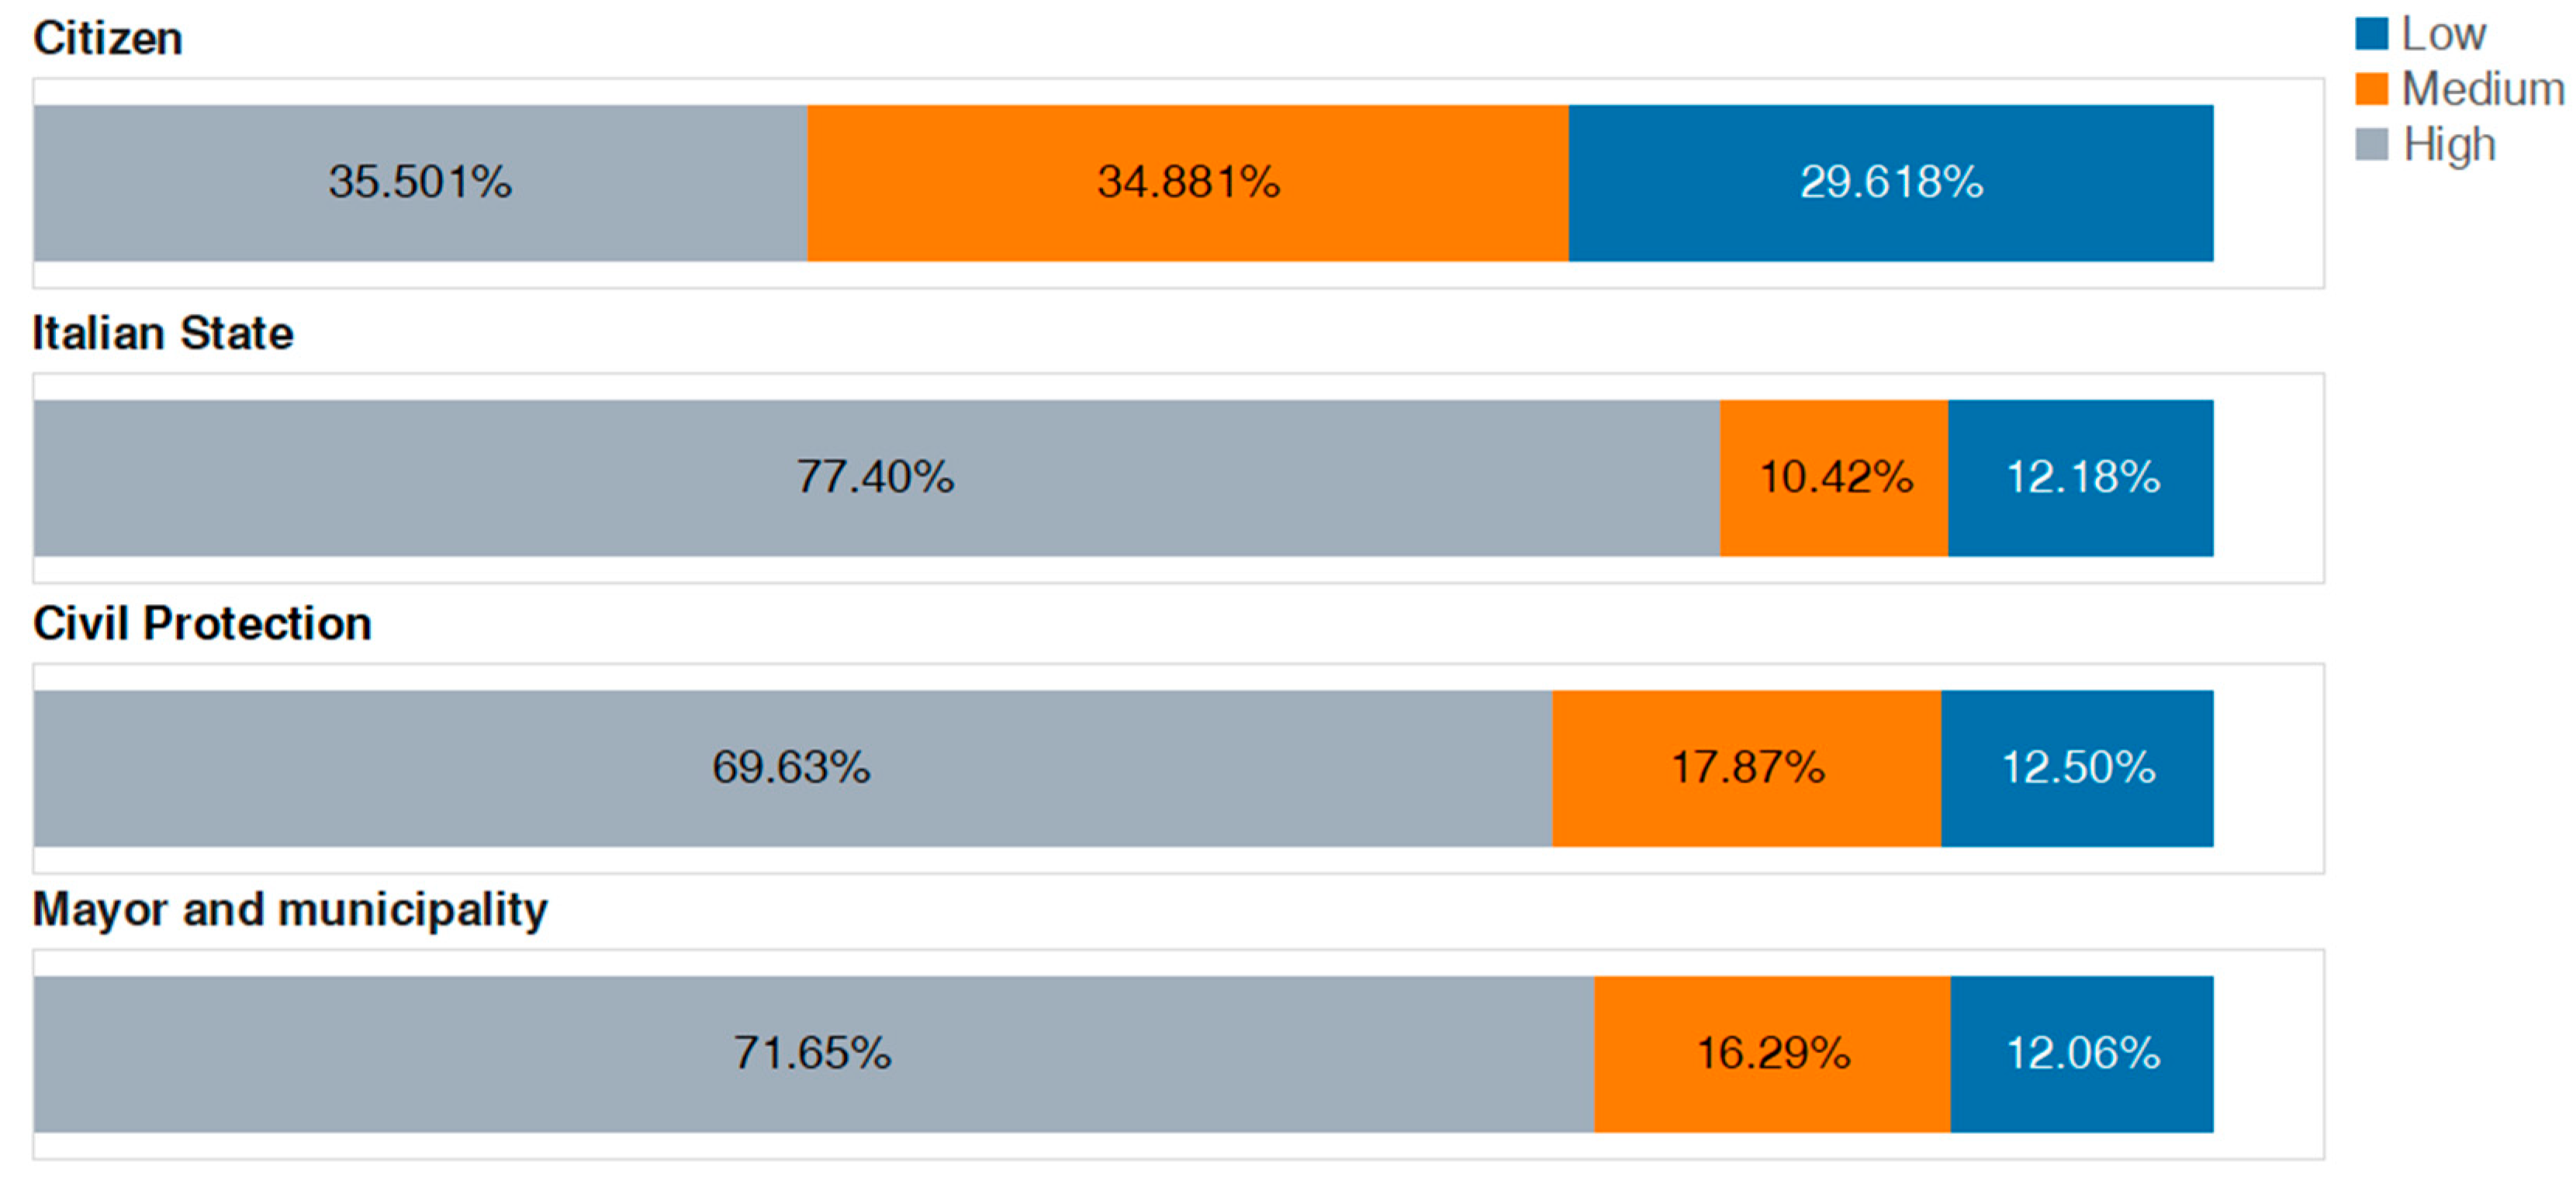
As already mentioned, the survey is divided into three sections. In detail, the first part of the survey recalled recent episodes of severe flooding occurred in the Simeto Valley in the autumn of 2018. We asked if such events were related to climate change, or if they could be considered frequent events during the fall season or else if they were isolated phenomena. Subsequently, we asked how often they heard about climate change and through which channels. The central part of the questionnaire started by analyzing the day-life experience of citizens, by asking if they pass or live close to places frequently flooded during extreme rain events. Then we asked, using a Likert scale, how worried they feel about weather alerts, to understand how much confidence the citizen have in the Civil Protection and local authorities, which are responsible for issuing such alerts. Finally, we investigated their individual preparedness, i.e., their tendency to behave correctly during urban flooding, asking them what they would do in three distinct possible scenarios: they are at work or at school, they have to go through an underpass or they have to pass a bridge.
The last part of the questionnaire concerned the community’s willingness to adapt to climate change, as a further measure of long-term preparedness. First, we asked about the best practices for adapting to climate change according to citizens, to investigate whether they really knew the meaning of this type of practice. Finally, we investigated how much they would be willing to spend to implement measures for climate change adaptation. In this sense, they were asked whether they were willing to accept a municipal expense for the purpose and whether they were willing to invest in new adaptation works on their private properties. This last part has been automatically submitted only to adults (over 19 years old), as for the children these questions are of difficult understanding or not relevant. The survey had anonymous answers, but prior to the 10 illustrated questions, the participants had to fill some general information on their age, gender, main occupation, education level, and city of residence in order to socio-geographically characterize the answers.
It should be pointed out that this survey has been carried out in a local context where various community involvement actions are already active. As mentioned above, recently part of this community has been involved in participatory actions for the sustainable development of the area, therefore some citizens are already somehow sensible to some of the topics of the survey. In a context such as this, the present questionnaire aims to serve not only as a statistical and investigative tool but also represents a training opportunity for citizens, bringing their attention to its topics, as well as the possibility of encouraging and strengthening community involvement within the SRA.

2.3. Distribution of the Survey and Sample Characterization

The survey was published and distributed mainly electronically through the web-platform EU Survey (
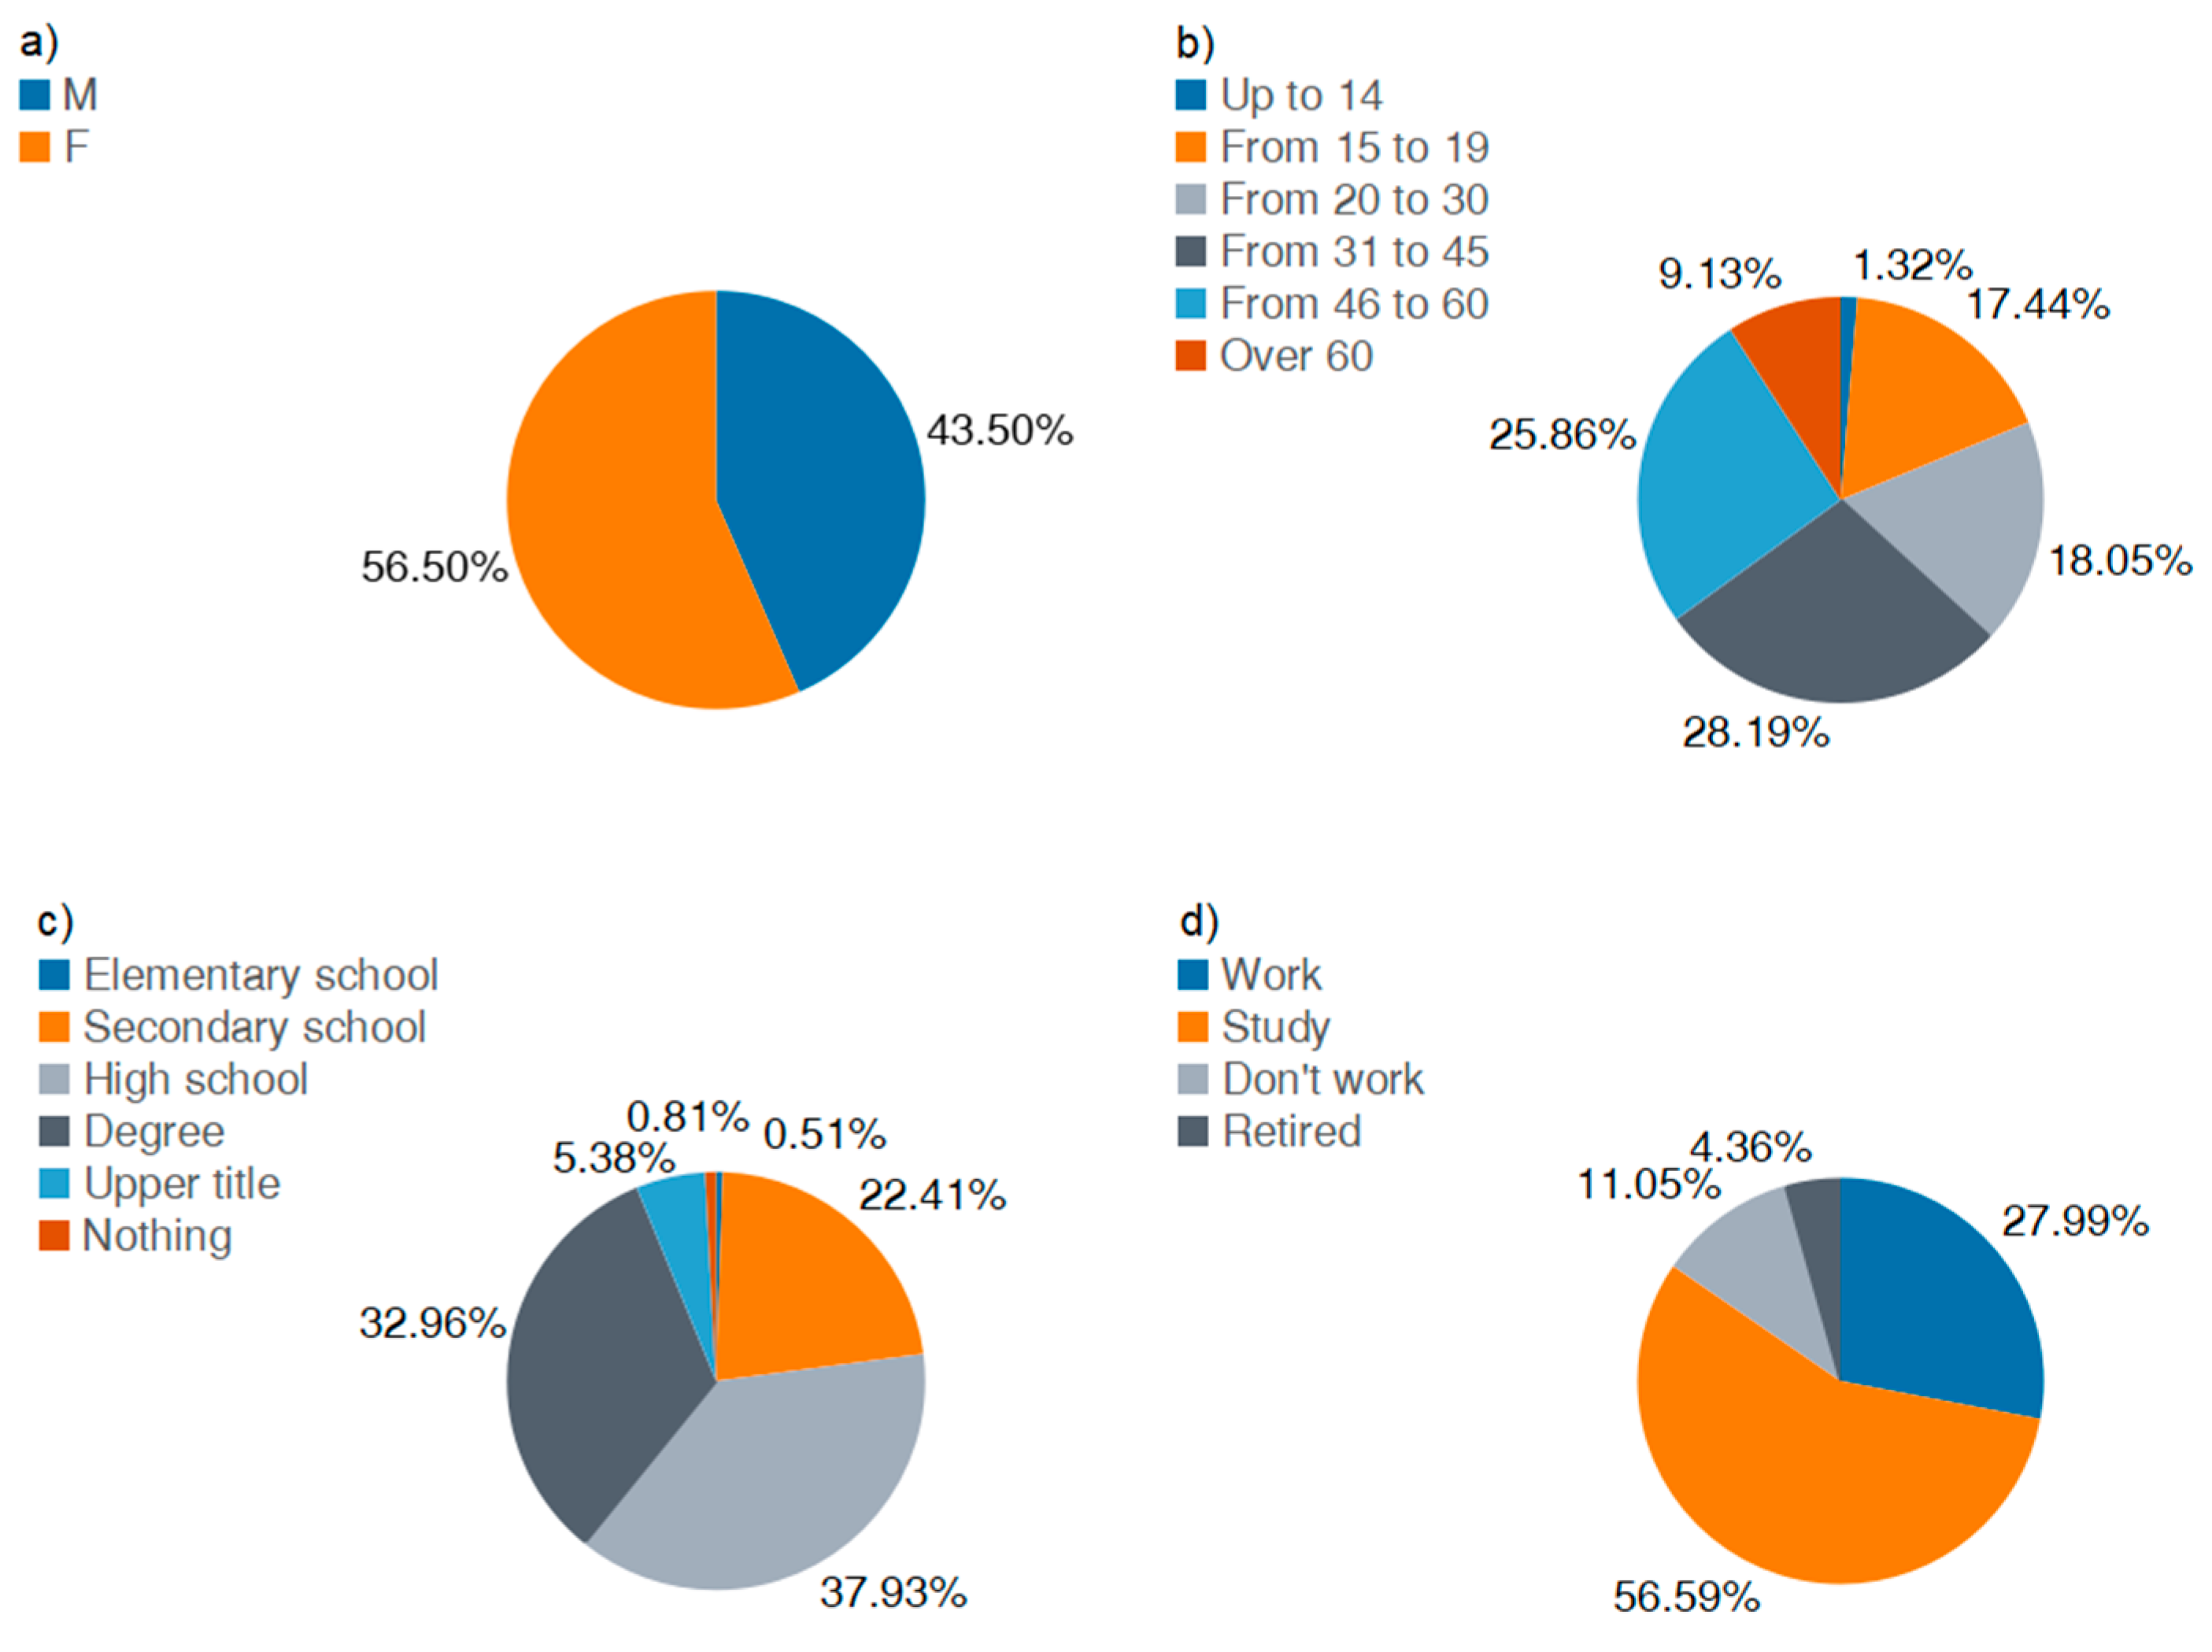
https://ec.europa.eu/eusurvey, accessed on 15 February 2021), for a period of about three months and was advertised through the social channels of the LIFE SimetoRES Project IT-LIFE17_CCA_IT_000115, Simeto River Agreement, and the University of Catania social channels (Facebook, Twitter, institutional websites). Such distribution was supported by the active work of volunteers from the Participatory Presidium of the Simeto river agreement, the umbrella of volunteer organizations deeply involved in several aspects of the project. Instant messaging (mainly WhatsApp) was also effectively used, sharing the link to the questionnaire in chatting groups of local community associations, school (parents and classes), professional orders, and others. A paper hardcopy version of the survey was also distributed during some public events in order to involve even those that may have been reached by social media only marginally. The answers were 1143 in total, 1078 collected electronically, and 65 hardcopies formats, distributed per municipality as shown in Table 3, and by individuals’ characteristics as illustrated in Figure 4. The percentage of women is slightly higher than the percentage of men, the age groups are adequately represented except for the group of children (younger than 14 years old) who are only about 1% of the respondents. Almost 38% of the participants are high school graduates and approximately one-third are university graduates. Most of the participants study or work, only 11% are unemployed, and just slightly more than 4% are retired.

3. Results

3.1. Worry about Climate Change

There has been lengthy debate in the scholarly community about whether individuals can “experience” climate change on a first-hand basis [38]. Some studies claim that global climate change is effectively invisible to laypeople, as climate change, by scientific definition, relies on statistical data compiled over long periods of time [53,54]. Ethnographic and survey results, however, have suggested that some members of the public believe that they have experienced climate change through seasonal changes, or living through extreme weather events [38,55,56].
In this case, in particular, around 84% of interviewees responded that the extreme rainfall events that hit Sicily in 2018 were mainly due to climate change. Only 8.7% of respondents believe that these phenomena have occurred as they are extreme events due to natural climate of the area. As a matter of fact, the study area has experienced even more severe events in the past, therefore the link with climate change is highly uncertain, so this question contributes by measuring the level of worry by the population. It is interesting to note that the likely correct interpretation (heavy rainfall events occur quite often in autumn, so there are quite normal in this season) is more frequent within the age group of over-60s, as the 20% of them answered so, while in the other age groups the percentage remains less than 10%. Additionally, rather a considerable percentage of school-age students (30.77%) are not able to decide whether such events are due to natural climate variability or to changed conditions, i.e., they are not able to identify a possible cause for this type of events (Figure 5).
Regarding the exposure to information on climate change, over 44% of participants answered that they hear about climate change “at least once a week” and almost 30% even “once a day” (Figure 6). This indicates that the population is quite interested and worried about climate change as it is discussed in usual conversations, within all age groups. Table 4 shows the different information sources through which the inhabitants declared to “hear about” climate change. For this question, multiple answers were allowed. The table shows that the most frequent source of information on climate change is newspapers, radio, and television (77.89%), followed by social media and the internet in general (66.53%).

3.2. Direct Experience of Urban Flooding and Risk Preparedness

More than 62% of the respondents answered that they cross areas prone to flooding during heavy rainfall events. This could be related to the fact that the problem is diffused within a large area. Figure 7 shows the answers divided into the different municipalities. The chart shows that the municipalities where the higher number of respondents declared to cross floodable areas are Catania, Biancavilla, and Adrano. Instead, the less interested in floods are Centuripe, Troina, and Regalbuto, cities which are located at the top of mountain areas. However, even in these municipalities, more than 50% of participants stated that they cross dangerous areas during intense storms: this could is related to the fact that these cities have many commuters that move out of their town for work/school on a daily basis, for example, it is possible that many citizens need to go to Catania for work, study or other needs, which is the closest city with services. After this question, participants were asked to indicate their degree of concern during weather alerts. Table 5 shows that most respondents (around 45%) have a “medium” level of concern and only 32% have a high or very high level of concern (the sum of 23% and 9%). This happens probably because of the relatively large spatial and temporal uncertainty of the weather alerts in the region, which remains significant to a degree that may induce a partial distrust about them—a phenomenon also known as cry wolf syndrome [57]. In fact, in recent years, there have been several cases in which weather warnings have been issued without any rain occurring, other times there have been very intense rain events without there being any weather warnings: these situations contribute to confuse citizens, who lose confidence in the weather alert service.
Regarding risk preparedness, the charts in Figure 8 show the answers on the behavior during potentially dangerous scenarios in three different cases. In the first question, we asked how the citizens would behave in case of a storm if they were indoors at school, work or gym. The chart shows that almost 74% know the right behavior to take; in the second question, we asked what behavior they would have if they were in the situation to decide to cross an underpass, even in this case almost 74% of the interlocutors answered correctly; instead, the third question asked about their choice in case of crossing of a bridge during an exceptional rain event. In this case, only about 48% of participants gave the answer corresponding to the correct behavior. As it can be seen from the graph, 20% of people would not actually know how to behave and about 33% of participants would have risky behavior. It is also interesting to investigate the answers according to the different age groups (Figure 9, Figure 10 and Figure 11). We note that young people are actually the least aware about what to do in the case of an extreme rain event. Only 15% of children (up to 14) and 35% of teenagers (from 15 to 19) answered correctly.
Moreover, we asked if they feel personally responsible for flood prevention, and how much they think other public bodies are responsible for protection from the induced risk. The citizen had the possibility to assign a score based on the degree of assigned responsibility in the case of flood event for the different bodies indicated. Using a Likert scale the responsibilities were divided into low, medium, or high. The result shows that only 35.5% of citizens consider themselves to have a responsibility in flood prevention, while almost 30% believe they have a very low responsibility. It also shows that there is a high tendency to attribute most of the responsibility to public bodies, in particular to the Central Government (Figure 12).

3.3. Willingness to Adaptation

The first question of this section asked the participants to identify the best practices for adapting to climate change, in order to investigate whether respondents know the meaning of adaptation and how it differs from the concept of mitigation. Knowledge of this difference is fundamental to the population to be a catalyst for the implementation of adaptation actions, as these are of different nature than the mitigation actions. In fact, the former does not focus on a reduction of greenhouse gas emissions, while the latter is mainly oriented to that scope, thus requiring totally different strategies.
The outcomes of the survey show that citizens are mostly confused about this point (Table 6). Almost 44% of the interviewees answered that waste sorting is an adaptation measure and over 58% indicated renewable energy production, while both should be mainly considered mitigation measures. Then, more direct questions on the willingness for adaptation were asked. In particular, participants were first asked if they would be favorable to an increase of investments in sustainable drainage infrastructures by their municipality. The answers have been represented in Figure 13, as a function of the age group. Overall, almost 80% of the answers indicated willingness to accept an increase in public costs if well justified; however, mainly adult groups (i.e., over 30 years old) seemed more favorable to this type of initiative. Then, the question was oriented to a more individual statement: citizens were asked whether while restructuring their own properties, they would be willing to increase their expenses to put in place sustainable drainage practices, such as increasing the surrounding pervious surfaces (Figure 14). Over 82% of young adults in the age between 31 and 45 years have responded to be willing to do that, while people aged less than 30 years seem to be the less willing to make such an investment.

4. Discussion

4.1. Analysis of Direct Results

In this section we firstly present an overall summary of the direct results of the survey, we briefly compare our results with those presented in related studies in the literature, and finally, we carry out some cross-analysis of the various factors explored with the survey, and in particular the possible links between the worry of population about climate change and how this may influence their preparedness.
Table 7 presents a short overview of the main direct results of the survey, which were presented in detail in the Results section. With “direct results” we mean those that can be derived from one single question, without analyzing possible relationships between the answers.
Our investigation indicated that most of the citizens are worried about climate change and confirmed that they are highly interested in the topic, as they follow information coming from multiple media streams and discuss it prevalently on a weekly (44%) or daily basis (30%). The predominant perception is that there is a link between floods in the last decade and climate change (84%). With reference to the direct experience of residents during heavy rain events and related urban flooding, most citizens agree that the urban areas of the SRV are prone to flooding, as many of them report to cross flooded streets. However, they are quite sceptical regarding the weather alerts, as they perceive them more as a problem in their daily activities rather than a protection of their safety. A significant percentage of the population is unaware of the basic rules for individual safety during a heavy rainfall event, as more than 1 out of 4 persons would have wrong behavior during urban flooding risky situations. Finally, it seems that there is a modest willingness of citizens to implement adaptation actions in their own municipality and real estate. Although it is not possible to know if citizens actually carry out works (public or private), the answers to the last questions reveal a certain desire of the population to accept new measures if it means adapting to climate change and thus improving safety.

4.2. Comparison and European and National Studies

We attempted to compare these direct results with those of other areas, as reported in recent similar studies, in order to find possible divergences, which we discuss in the following. For example, at the European scale, according to the 2017 Eurobarometer Report [52], it is clear that 74% of citizens actually consider climate change as a serious problem, while in our case over 83% of respondents believe that climate change is responsible for exceptional phenomena that cause serious problems and damage, showing potentially a higher degree of concern. As regards responsibilities, in Europe, only 43% of the responsibility for preventing the risks associated with climate change is attributed to the government, while in the SRV the percentage of citizens of the SRV who hold the government responsible is higher than 77.4%. On the other hand, European citizens that feel personally responsible for the prevention of the flood risk are only 22% against the 35% of our respondents. This in general indicates that the population agrees on the fact that the local and national administrators do not take sufficient actions for protection of the territory against urban flooding. At a national level, the only survey deemed to have comparable questions with ours is the one conducted for the Municipality of Ferrara [48], in the north of Italy, in which however only 164 questionnaires were analyzed (approximately 0.1% of the population). The analysis found that about 61% of citizens perceive the evidence of climate change (vs. 83% in our case, based on question 1) and about 58.5% believe that it is very important to take actions to mitigate the impacts of climate change (vs. 79.9% for the SRV). In the Municipality of Ferrara, 20% of the responsibility for preventing the risks associated with climate change is attributed to the State and over 55% to the Municipality, while the citizens of the SRV hold the State the most responsible (77.4%). The percentage that feels directly involved and responsible for risk prevention is more or less the same in the two areas, around 35%. Citizens of Ferrara that are moderately willing to invest in adaptation measures are about 37.5%, while 37% are very willing. Regarding SRV citizens, more than 77% of them are very willing to personally support the costs for adaptation measures.
Of course, the presented comparison is subject to some limitations mainly due to the fact that not the exact questions and methodologies have been done and applied. Nevertheless, the differences are quite high and potentially significant also taking into account the possible influence of the above-mentioned limitation. Hence the comparison confirms the relevance of investigating the SRV, as it presents specific features that other studies do not allow to infer.

4.3. Cross-Analysis: Link between Worry about Climate Change and Urban Flooding Preparedness

In many parts of the industrially-developed world, efforts in the media and in schools are mainly oriented to build awareness of the climate change issue, as also stimulated by several activist movements, such as Extinction Rebellion (https://extinctionrebellion.uk/the-truth/, accessed on 15 February 2021) and Fridays for Future (https://fridaysforfuture.org/, accessed on 15 February 2021), whose real impacts and advantages are under study by several scholars [58,59,60]. Here, we wanted to explore, the possible linkages between building an awareness of the risks related to climate change and the advantages in terms of a possible increase in the awareness of related urban flooding risk and the willingness to adaptation. This is allowed by the data collected in our survey by cross-analysis of part 2 (direct experience of urban flooding and risk awareness) and 3 (willingness to adaptation) vs. part 1 (concern of climate change and connection with urban flooding). To investigate these aspects, two contingency matrices have been derived linking respectively relevant questions of part 1 with part 2 (Table 8) and part 1 with part 3 (Table 9) of the survey. This approach is similar to that applied in the case of prediction problems where the use of the contingency matrix (also termed as confusion matrix) allows the understanding of the performance of the predictor in terms of Receiver Operating Characteristics (ROC) [61,62]. In particular, the following assumptions were made in computing the quantities in Table 8 and Table 9:
  • Degree of interest and concern for climate change:
    A partial score of 1 was assigned when the interviewee answered “These are phenomena due to climatic changes taking place on the planet” to question 1, a score of 0 otherwise
    A partial score of 1 for who hears about climate change at least once a day, 0 otherwise
    The degree was classified as “higher” if total score (sum first and second item) was at least 1, “lower” otherwise
  • Correct behavior during urban flooding:
    A partial score of 1 was assigned to each answer corresponding to correct behavior (questions 6a–c), and 0 to a wrong behavior
    A “likely” correct behavior was assigned to individuals that had a total score of 2 or more, while it was deemed “unlikely” otherwise
  • Willingness to invest in adaptation actions (sustainable drainage):
    A partial score equal to 1 was attributed to answers “It’s well-spent money, the Municipality has done a good thing” (question 9) and “Absolutely yes” (question 10)
    A “higher” willingness level to individuals that had a total score of 1 or more, “lower” otherwise
Once the categorization has been done and entries of the contingency tables have been counted, conditional frequencies have been computed to test whether the degree of interest and concern for climate change is related to a variation of the likelihood of correct behavior during urban flooding events and a higher willingness to invest in adaptation. In particular, to test whether there is a significant variation the following conditional frequencies have been computed: frequency that a person behaves correctly during urban floods (is willing to invest in adaptation actions) given that he is highly concerned about climate change, and frequency that a person behaves correctly during urban floods (is willing to invest in adaptation actions) given that he is lowly concerned about climate change. These two conditional frequencies correspond to A/(A + B) and C/(C + D).
H = A/(A + B) − C/(C + D)
The difference provides an indication whether the conditioning factor is important or not: if H is significantly greater than zero the concern about climate change positively affects behavior during floods (increases willingness to invest in adaptation actions), if is significantly less than zero than the influence is negative, if H is approximately zero then there is no influence. We consider a threshold of |H| = 0.2 for significance. In the context of ROC analysis, H is also termed as true skill statistic or Hanssen–Kuipers discriminant [63,64,65]. As can be derived from Table 8 and Table 9, the difference in both cases is 0.05, i.e., non-significant. This means that to be concerned by climate change does not give any advantage in resilience, i.e., does not induce a better behavior against the climate-related hazard of urban flooding, nor on the willingness to invest in a sustainable solution for adaptation to climate change increases. In other words, people are not as willing to take actions as they are to be concerned when it comes to climate change.

5. Conclusions

The results of a survey exploring worry about climate change and its possible relation with the behavior during urban floods and the willingness to invest in adaptation actions have been presented, relatively to the Simeto River Valley area in Sicily. The data collection that was made is quite relevant with respect to other studies, as here more than 1000 persons were interviewed, while it is difficult to find regional studies with more than a few hundreds of participants involved. The simplicity of the survey was a crucial factor for collecting such a high number of answers, but, on the other hand, has not undermined the possibility to arrive at important conclusions about the issues explored. The overall picture deriving from the present analysis highlights how there is a high concern for the possible impacts of climate change, specifically in connection to urban flooding. The climate change issue entered in almost every-day conversations by the population. However, this high level of concern does not correspond to a comparable level of knowledge of the correct behavior during climate-related extreme events—specifically urban flooding—and the willingness to invest in adaptation measures. In fact, the population tends to attribute increasingly intense events to climate change but does not know the correct behavior to take during the emergencies, does not correctly attribute the responsibility for flood-caused damage, and does not trust authorities that are in charge of human safety. The cross-analysis that we carried out, shows that there is no gain for these two resilience factors associated with a higher degree of concern about climate change. Overall, the outcomes of the survey suggest that the information that is conveyed by the media and taught in schools is mainly oriented to increase the worry about climate change and that this is not significantly useful for an increase in the resilience of the populations, i.e., specifically a higher risk awareness during urban flooding events and of the importance of investment in sustainable drainage practices. Hence, greater efforts should be spent through media and education to build a greater risk preparedness rather than prevalently a greater worry about climate change.

Author Contributions

Conceptualization, all authors; Formal analysis, P.N. and D.J.P.; Funding acquisition, A.C., R.E.M. and D.J.P.; Investigation, all authors; Methodology, all authors; Project administration, A.C. and R.E.M.; Resources, A.C. and R.E.M.; Supervision, D.J.P., A.C. and R.E.M.; Visualization, P.N. and D.J.P.; Writing—original draft, P.N. and D.J.P.; Writing—review & editing, all authors. All authors have read and agreed to the published version of the manuscript.

Funding

This work has been partly funded by the EU project LIFE SimetoRES (IT-LIFE17_CCA_IT_000115), whose partners are the municipalities of Paternò, Ragalna, Santa Maria di Licodia and the Department of Civil and Environmental Engineering of the University of Catania.

Institutional Review Board Statement

Not applicable.

Informed Consent Statement

Not applicable.

Data Availability Statement

Data are available by request to the authors.

Acknowledgments

The Participatory Presidium of the Simeto River Agreement is strongly acknowledged for its active support in all the communication activities of the project, and in the dissemination and collection of the questionnaires. The authors thank Laura Saija for the fruitful discussions and Gabriele Gugliuzzo for the collaboration in organizing the results. This work is in partial fulfilment of the Ph.D. activities of P.N.

Conflicts of Interest

The authors declare no conflict of interest.

Appendix A

The survey consists of a combination of 10 questions, including some multiple choice and others using the Likert scale (1932), preceded by 5 questions related to the characterization of the sample. The questions were formulated to be independent of each other and each of them is aimed at extrapolating precise information. The survey was administered in Italian language. Below we show the questions translated in English.
Sample characterization:
Gender
  • M
  • F
How old are you?
  • Up to 14 years
  • Between 15 and 19 years old
  • Between 20 and 30 years
  • Between 31 and 45 years old
  • Between 46 and 60 years old
  • Over 60 years old
Education
  • None
  • Primary school diploma
  • Middle School diploma
  • High school diploma
  • Graduation
  • Higher qualification (Ph.D., Master, etc.)
What is your current occupation?
  • Student
  • Worker
  • Unemployed
  • Retired
Where do you live?
  • Adrano
  • Belpasso
  • Biancavilla
  • Catania
  • Centuripe
  • Motta Sant’Anastasia
  • Paternò
  • Ragalna
  • Regalbuto
  • Santa Maria di Licodia
  • Troina
  • Other
Perception of climate change:
Question No. 1
During the autumn of 2018, Sicily was hit by heavy rains in both the eastern and western parts, what do you think these phenomena are due?
  • Heavy rainfall events occur quite often in autumn, so there are quite normal in this season;
  • These are phenomena due to climatic changes taking place on the planet;
  • It was an isolated phenomenon;
  • I do not know.
Question No. 2
In the last years, how often have you heard about climate change?
  • At least once a day;
  • At least once a week;
  • At least once a month;
  • At least once a year;
  • Almost never;
  • Never.
Question No. 3
Where did you hear about climate change? (More options can be selected)
  • Talking to friends, family;
  • Social networks/internets;
  • Newspapers/magazines/TV/Radio;
  • At school/university/work;
  • During events/conferences;
  • I don’t remember hearing about it.
Perception of flood events, behaviour during weather alerts and related responsibilities:
Question No. 4
Do you cross areas that are likely to be flooded during a rain event?
  • Yes;
  • No;
  • I do not know.
Question No. 5
The news talks about a serious weather alert for tomorrow, how do you feel? Indicate your degree of worry (1 means “very little”, 5 means “very much”)
  • 1;
  • 2;
  • 3;
  • 4;
  • 5.
Question No. 6
In the event of a flood what do you do if:
a. you are at work/school/gym
  • Make sure you get in the car to go home;
  • You go to a mezzanine floor of a building, and wait for the return to normality before going out;
  • Go home by feet as quickly as possible because it could be dangerous to use any means of transport;
  • You take shelter on the lower floors of a building, and wait for the return to normality before going out;
  • I do not know.
b. you are in your car/scooter and you have to pass an underpass?
  • You go through the underpass as fast as possible to get into safety;
  • You go back and change directions, possibly avoiding other underpasses;
  • You cross slowly to avoid the danger of “aquaplaning”;
  • Get off the car/scooter and cross on foot;
  • I do not know.
c. you are in your car/scooter and you have to pass a bridge?
  • You stop on the bridge to check what’s going on;
  • Go back and reach a higher place; leave only after the situation has returned to normal;
  • The question makes little sense, bridges only serve to overcome dips of the soil that have little relationship with water;
  • Wait near the bridge and leave when it stops raining;
  • I do not know.
Question No. 7
Indicates the degree of responsibility for the prevention of flood risk of the following figures where 1 means very little and very much 5.
The citizens
  • 1;
  • 2;
  • 3;
  • 4;
  • 5.
The Mayor and the Municipality
  • 1;
  • 2;
  • 3;
  • 4;
  • 5.
Civil Protection and Firefighters
  • 1;
  • 2;
  • 3;
  • 4;
  • 5.
The State
  • 1;
  • 2;
  • 3;
  • 4;
  • 5.
Willingness to adapt to climate change
Question No. 8
What are good practices for adaptation? (Choose max 3 options)
  • Waste sorting
  • Improve the quality of weather warnings
  • Sewer maintenance
  • Avoid wasting water
  • Build infrastructures that help to avoid flooding
  • Production and use of energy from renewable sources
Question No. 9
Your municipality is investing funds for the construction of a new parking and decides to spend 10% more for make it with pervious materials that allow stormwater retention and therefore reduce urban flooding. What do you think about that?
  • It’s well-spent money, the Municipality has done a good thing;
  • I understand the reason, but there are other priorities to invest in;
  • It seems absurd to me; it is an unjustified increase of public expenditures;
  • Indifferent.
Question No. 10
In building or renovating your home would you be willing to spend more to introduce more green areas and less asphalted surfaces to better adapt to climate change?
  • Absolutely yes;
  • Maybe, as I have other priorities;
  • No.

References

  1. Spence, A.; Poortinga, W.; Pidgeon, N. The Psychological Distance of Climate Change. Risk Anal. 2012, 32, 957–972. [Google Scholar] [CrossRef] [PubMed] [Green Version]
  2. Naumann, S.; Gerardo, A.; Berry, P. Assessment of the Potential of Ecosystem-Based Approaches to Climate Change Adaptation and Mitigation in Europe; Final report to the European Commission, DG Environment, Contract no. 070307/2010/580412/SER/B2; Ecologic institute and Environmental Change Institute, Oxford University Centre for the Environment: Oxford, UK, 2011. [Google Scholar]
  3. Prutsch, A.; Felderer, A.; Balas, M.; Konig, M.; Clar, C.; Steurer, R. Methods and Tools for Adaptation to Climate Change. A Handbook for Provinces, Regions and Cities; Climate ADAPT: Vienna, Austria, 2014; ISBN 9783990042977. [Google Scholar]
  4. Demski, C.; Capstick, S.; Pidgeon, N.; Sposato, R.G.; Spence, A. Experience of extreme weather affects climate change mitigation and adaptation responses. Clim. Chang. 2017, 140, 149–164. [Google Scholar] [CrossRef] [Green Version]
  5. Sussams, L.W.; Sheate, W.R.; Eales, R.P. Green infrastructure as a climate change adaptation policy intervention: Muddying the waters or clearing a path to a more secure future? J. Environ. Manag. 2015, 147, 184–193. [Google Scholar] [CrossRef] [PubMed]
  6. Du, J.; Qian, L.; Rui, H.; Zuo, T.; Zheng, D.; Xu, Y.; Xu, C.Y. Assessing the effects of urbanization on annual runoff and flood events using an integrated hydrological modeling system for Qinhuai River basin, China. J. Hydrol. 2012, 464–465, 127–139. [Google Scholar] [CrossRef]
  7. Palla, A.; Sansalone, J.J.; Gnecco, I.; Lanza, L.G. Storm water infiltration in a monitored green roof for hydrologic restoration. Water Sci. Technol. 2011, 64, 766–773. [Google Scholar] [CrossRef] [PubMed]
  8. Haghighatafshar, S.; Becker, P.; Moddemeyer, S.; Persson, A.; Sörensen, J.; Aspegren, H.; Jönsson, K. Paradigm shift in engineering of pluvial floods: From historical recurrence intervals to risk-based design for an uncertain future. Sustain. Cities Soc. 2020, 61, 102317. [Google Scholar] [CrossRef]
  9. Hammond, M.J.; Chen, A.S.; Djordjević, S.; Butler, D.; Mark, O. Urban flood impact assessment: A state-of-the-art review. Urban Water J. 2015, 12, 14–29. [Google Scholar] [CrossRef] [Green Version]
  10. Haaland, C.; van den Bosch, C.K. Challenges and strategies for urban green-space planning in cities undergoing densification: A review. Urban For. Urban Green. 2015, 14, 760–771. [Google Scholar] [CrossRef]
  11. Berndtsson, R.; Becker, P.; Persson, A.; Aspegren, H.; Haghighatafshar, S.; Jönsson, K.; Larsson, R.; Mobini, S.; Mottaghi, M.; Nilsson, J.; et al. Drivers of changing urban flood risk: A framework for action. J. Environ. Manag. 2019, 240, 47–56. [Google Scholar] [CrossRef]
  12. Saidu, I.; Lal, M.D. Flood risk inevitability and flood risk management in urban areas: A review. J. Geogr. Reg. Plan. 2015, 8, 205–209. [Google Scholar] [CrossRef] [Green Version]
  13. Jongman, B.; Ward, P.J.; Aerts, J.C.J.H. Global exposure to river and coastal flooding: Long term trends and changes. Glob. Environ. Chang. 2012, 22, 823–835. [Google Scholar] [CrossRef]
  14. Petry, B. Keynote lecture: Coping with floods: Complementarity of structural and non-structural measures. Flood Def. 2002, 60–70. [Google Scholar]
  15. Meyer, V.; Priest, S.; Kuhlicke, C. Economic evaluation of structural and non-structural flood risk management measures: Examples from the Mulde River. Nat. Hazards 2012, 62, 301–324. [Google Scholar] [CrossRef]
  16. Salvati, P.; Bianchi, C.; Fiorucci, F.; Giostrella, P.; Marchesini, I.; Guzzetti, F. Perception of flood and landslide risk in Italy: A preliminary analysis. Nat. Hazards Earth Syst. Sci. 2014, 14, 2589–2603. [Google Scholar] [CrossRef] [Green Version]
  17. Avvisati, G.; Bellucci Sessa, E.; Colucci, O.; Marfè, B.; Marotta, E.; Nave, R.; Peluso, R.; Ricci, T.; Tomasone, M. Perception of risk for natural hazards in Campania Region (Southern Italy). Int. J. Disaster Risk Reduct. 2019, 40, 101164. [Google Scholar] [CrossRef]
  18. Davis, M.S.; Ricci, T.; Mitchell, L.M. Perceptions of risk for volcanic hazards at Vesuvio and Etna, Italy. Australas. J. Disaster Trauma Stud. 2005, 2005, 21. [Google Scholar]
  19. Paton, D.; Johnston, D. Disasters and communities: Vulnerability, resilience and preparedness. Disaster Prev. Manag. An Int. J. 2001, 10, 270–277. [Google Scholar] [CrossRef]
  20. Ricci, T.; Nave, R.; Barberi, F. Vesuvio civil protection exercise MESIMEX: Survey on volcanic risk perception. Ann. Geophys. 2013, 56. [Google Scholar] [CrossRef]
  21. Wachinger, G.; Renn, O. Risk perception of natural hazards. WP3-Report of the CapHaz-Net Projekt. 2010, pp. 1–111. Available online: http://www.caphaz-net.org (accessed on 15 February 2021).
  22. Diakakis, M.; Priskos, G.; Skordoulis, M. Public perception of flood risk in flash flood prone areas of Eastern Mediterranean: The case of Attica Region in Greece. Int. J. Disaster Risk Reduct. 2018, 28, 404–413. [Google Scholar] [CrossRef]
  23. Gravina, T.; Figliozzi, E.; Mari, N.; De Luca Tupputi Schinosa, F. Landslide risk perception in Frosinone (Lazio, Central Italy). Landslides 2017, 14, 1419–1429. [Google Scholar] [CrossRef]
  24. Raaijmakers, R.; Krywkow, J.; van der Veen, A. Flood risk perceptions and spatial multi-criteria analysis: An exploratory research for hazard mitigation. Nat. Hazards 2008, 46, 307–322. [Google Scholar] [CrossRef] [Green Version]
  25. Shen, X. Flood Risk Perception and Communication within Risk Management in Different Cultural Contexts a Comparative Case Study between Wuhan, China and cologne, germany Xiaomeng Shen Beijing, VR China; UNU-EHS: Bonn, Germany, 2009. [Google Scholar]
  26. Lechowska, E. What determines flood risk perception? A review of factors of flood risk perception and relations between its basic elements. Nat. Hazards 2018, 94, 1341–1366. [Google Scholar] [CrossRef] [Green Version]
  27. Bouman, T.; Verschoor, M.; Albers, C.J.; Böhm, G.; Fisher, S.D.; Poortinga, W.; Whitmarsh, L.; Steg, L. When worry about climate change leads to climate action: How values, worry and personal responsibility relate to various climate actions. Glob. Environ. Chang. 2020, 62, 102061. [Google Scholar] [CrossRef]
  28. Whitmarsh, L.; Capstick, S. Perceptions of Climate Change; Elsevier Inc.: Amsterdam, The Netherlands, 2018; ISBN 9780128131305. [Google Scholar]
  29. van der Linden, S.; van der Linden, S. Determinants and Measurement of Climate Change Risk Perception, Worry, and Concern; Oxford University Press: Oxford, UK, 2017; ISBN 9780190228620. [Google Scholar]
  30. Bubeck, P.; Botzen, W.J.W.; Aerts, J.C.J.H. A Review of Risk Perceptions and Other Factors that Influence Flood Mitigation Behavior. Risk Anal. 2012, 32, 1481–1495. [Google Scholar] [CrossRef] [PubMed] [Green Version]
  31. Capstick, S.B.; Pidgeon, N.F.; Corner, A.J.; Spence, E.M.; Pearson, P.N. Public understanding in Great Britain of ocean acidification. Nat. Clim. Chang. 2016, 6, 763–767. [Google Scholar] [CrossRef] [Green Version]
  32. Morton, T.A.; Rabinovich, A.; Marshall, D.; Bretschneider, P. The future that may (or may not) come: How framing changes responses to uncertainty in climate change communications. Glob. Environ. Chang. 2011, 21, 103–109. [Google Scholar] [CrossRef]
  33. Johannesson, M.P.; Gjerstad, Ø.; Nordø, Å.D.; Tvinnereim, E.; Fløttum, K. Citizens’ preferences for tackling climate change. Quantitative and qualitative analyses of their freely formulated solutions. Glob. Environ. Chang. 2017, 46, 34–41. [Google Scholar] [CrossRef]
  34. Guzzetti, F.; Stark, C.P.; Salvati, P. Evaluation of flood and landslide risk to the population of Italy. Environ. Manag. 2005, 36, 15–36. [Google Scholar] [CrossRef]
  35. Feldman, D.; Contreras, S.; Karlin, B.; Basolo, V.; Matthew, R.; Sanders, B.; Houston, D.; Cheung, W.; Goodrich, K.; Reyes, A.; et al. Communicating flood risk: Looking back and forward at traditional and social media outlets. Int. J. Disaster Risk Reduct. 2016, 15, 43–51. [Google Scholar] [CrossRef] [Green Version]
  36. Van Der Linden, S. On the relationship between personal experience, affect and risk perception: The case of climate change. Eur. J. Soc. Psychol. 2014, 44, 430–440. [Google Scholar] [CrossRef] [Green Version]
  37. Helgeson, J.; van der Linden, S.; Chabay, I. The role of knowledge, learning and mental models in public perceptions of climate change related risks. Learn. Sustain. Times Accel. Chang. 2012, 381–394. [Google Scholar] [CrossRef]
  38. Akerlof, K.; Maibach, E.W.; Fitzgerald, D.; Cedeno, A.Y.; Neuman, A. Do people “personally experience” global warming, and if so how, and does it matter? Glob. Environ. Chang. 2013, 23, 81–91. [Google Scholar] [CrossRef]
  39. Coumou, D.; Rahmstorf, S. A decade of weather extremes. Nat. Clim. Chang. 2012, 2, 491–496. [Google Scholar] [CrossRef]
  40. Brody, S.D.; Zahran, S.; Vedlitz, A.; Grover, H. Examining the Relationship Between Physical Vulnerability and Public Perceptions of Global Climate Change in the United States. Environ. Behav. 2007, 40, 72–95. [Google Scholar] [CrossRef] [Green Version]
  41. Krosnick, J.A.; Holbrook, A.L.; Lowe, L.; Visser, P.S. The origins and consequences of democratic citizens’ policy agendas: A study of popular concern about global warming. Clim. Chang. 2006, 77, 7–43. [Google Scholar] [CrossRef]
  42. Spence, A.; Poortinga, W.; Butler, C.; Pidgeon, N.F. Perceptions of climate change and willingness to save energy related to flood experience. Nat. Clim. Chang. 2011, 1, 46–49. [Google Scholar] [CrossRef] [Green Version]
  43. Miceli, R.; Sotgiu, I.; Settanni, M. Disaster preparedness and perception of flood risk: A study in an alpine valley in Italy. J. Environ. Psychol. 2008, 28, 164–173. [Google Scholar] [CrossRef]
  44. Raciti, A.; Saija, L. From ecosystem services to Ecological Devices: The CoPED Summer School experience in the Simeto River Valley, Italy. J. Urban Manag. 2018, 7, 161–171. [Google Scholar] [CrossRef]
  45. ISTAT. Sistema Statistico Nazionale Istituto Nazionale Di Statistica; ISTAT: Rome, Italy, 2018; Volume 1, ISBN 9788845818660. [Google Scholar]
  46. Saija, L.; De Leo, D.; Forester, J.; Pappalardo, G.; Rocha, I.; Sletto, B.; Corburn, J.; Mwau, B.; Magnaghi, A. Learning from practice: Environmental and community mapping as participatory action research in planning. Plan. Theory Pract. 2017, 18, 127–153. [Google Scholar] [CrossRef]
  47. Italiana, R. Piano Stralcio di Bacino per l’ Assetto Idrogeologico della Regione Siciliana. PAI. 2004. Available online: http://www.osservatorioacque.it/documenti/pta/allegati/18/all.18%20-%20pai.pdf (accessed on 15 February 2021).
  48. Comune di Ferrara & Servizio Ambiente—Ufficio Agenda 21L. L’adattamento ai Cambiamenti Climatici. Esito Delle Indagini Condotte nel Comune di Ferrara (No. 1). Comune di Ferrara. December 2010. Available online: https://servizi.comune.fe.it/4786/cambiamenti-climatici (accessed on 15 February 2021).
  49. SEERISK Joint Disaster Management Risk Assessment and Preparedness in the Danube Macro-region (SEERISK) project—Social awareness questionnaire. Jt. Disaster Manag. Risk Assess. Prep. Danube Macro-Region Proj. 2013, 1, 84–86.
  50. Howe, P.; Mildenberger, M.; Marlon, J.; Leiserowitz, A. Geographic variation in opinions on climate change at state and local scales in the USA. Nat. Clim. Chang. 2015. [Google Scholar] [CrossRef] [Green Version]
  51. Likert, R. A technique for the measurement of attitudes. Arch. Psychol. 1932, 22, 140–155. [Google Scholar]
  52. European Commission, Directorate-General for Climate Action, & Directorate-General for Communication. Special Eurobarometer 459—Climate Change (No. 459). Wave EB87.1—TNS Opinion & Social. September 2017. Available online: https://ec.europa.eu/clima/sites/clima/files/support/docs/report_2017_en.pdf (accessed on 15 February 2021).
  53. Moser, S.C.; Dilling, L. Making climate hot. Environment 2004, 46, 32–46. [Google Scholar] [CrossRef]
  54. Weber, E.U. What shapes perceptions of climate change? New research since 2010. Wiley Interdiscip. Rev. Clim. Chang. 2016, 7, 125–134. [Google Scholar] [CrossRef]
  55. Ballew, M.T.; Leiserowitz, A.; Roser-Renouf, C.; Rosenthal, S.A.; Kotcher, J.E.; Marlon, J.R.; Lyon, E.; Goldberg, M.H.; Maibach, E.W. Climate change in the american mind: Data, tools, and trends. Environment 2019, 61, 4–18. [Google Scholar] [CrossRef]
  56. Osaka, S.; Bellamy, R. Natural variability or climate change? Stakeholder and citizen perceptions of extreme event attribution. Glob. Environ. Chang. 2020, 62, 102070. [Google Scholar] [CrossRef]
  57. Breznitz, S. Cry Wolf; New York Psychol. Press: New York, NY, USA, 1984. [Google Scholar]
  58. Marris, E. Why young climate activists have captured the world’s attention. Nature 2019, 573, 471–472. [Google Scholar] [CrossRef] [PubMed]
  59. Feldman, L.; Hart, P.S. Using Political Efficacy Messages to Increase Climate Activism. Sci. Commun. 2016, 38, 99–127. [Google Scholar] [CrossRef]
  60. Roser-Renouf, C.; Maibach, E.W.; Leiserowitz, A.; Zhao, X. The genesis of climate change activism: From key beliefs to political action. Clim. Chang. 2014, 125, 163–178. [Google Scholar] [CrossRef] [Green Version]
  61. Staley, D.M.; Kean, J.W.; Cannon, S.H.; Schmidt, K.M.; Laber, J.L. Objective definition of rainfall intensity-duration thresholds for the initiation of post-fire debris flows in southern California. Landslides 2013, 10, 547–562. [Google Scholar] [CrossRef]
  62. Peres, D.J.; Cancelliere, A. Derivation and evaluation of landslide-triggering thresholds by a Monte Carlo approach. Hydrol. Earth Syst. Sci. 2014, 18, 4913–4931. [Google Scholar] [CrossRef] [Green Version]
  63. Peirce, C.S. The numerical measure of the success of predictions. Science 1884, 4, 453–454. [Google Scholar] [CrossRef] [PubMed] [Green Version]
  64. Wilks, D.S. Chapter 8—Forecast Verification. In Statistical Methods in the Atmospheric Sciences; Wilks, D.S.B.T.-I.G., Ed.; Academic Press: New York, NY, USA, 2011; Volume 100, pp. 301–394. ISBN 0074-6142. [Google Scholar]
  65. Marino, P.; Peres, D.J.; Cancelliere, A.; Greco, R.; Bogaard, T.A. Soil moisture information can improve shallow landslide forecasting using the hydrometeorological threshold approach. Landslides 2020, 17, 2041–2054. [Google Scholar] [CrossRef]
Figure 1. Location of the Simeto River basin on the east of Sicily (Italy).
Resources 10 00025 g001
Figure 2. Location of the municipalities involved in the Simeto River Agreement, plus the city of Catania.
Resources 10 00025 g002
Figure 3. Images of the floods of recent years: (a) street of Paternò during the flood of August 2015, (b) square of Paternò during the flood of March 2013, (c) Via Etnea of Catania during the flood of October 2018, (d) Piazza Università of Catania during the flood of October 2018.
Resources 10 00025 g003
Figure 4. Social characterization of the participants to the survey in terms of (a) gender, (b) age, (c) education, (d) work.
Resources 10 00025 g004
Figure 5. Results for the question: ‘During the autumn of 2018, Sicily was hit by heavy rains in both the eastern and western parts, what do you think these phenomena are due?’ Answers classified according to different age groups.
Resources 10 00025 g005
Figure 6. Responses to question ‘In the last years, how often have you heard about climate change?’.
Resources 10 00025 g006
Figure 7. Responses to question ‘Do you cross areas that are likely to be flooded during a rain event?’ The size of the indicator represents the quantity of responses coming from individual municipalities, while the color indicates the type of response.
Resources 10 00025 g007
Figure 8. (a) Answers to the question: “What do you do if there is a storm and you are at work/school/gym?” (b) Answers to the question: “What do you do if there is a storm and you are in your car/scooter and you have to pass an underpass?” (c) Answers to the question: “What do you do if there is a storm and you are in your car/scooter and you have to pass a bridge?”.
Resources 10 00025 g008
Figure 9. Responses to question ‘What do you do if there is a storm and you are at work/school/gym?’.
Resources 10 00025 g009
Figure 10. Responses to question ‘What do you do if there is a storm and you are in your car/scooter and you have to pass an underpass?’.
Resources 10 00025 g010
Figure 11. Responses to question ‘What do you do if there is a storm and you are in your car/scooter and you have to pass a bridge?’.
Resources 10 00025 g011
Figure 12. Answer to the question concerning the attribution of responsibility for the prevention of flood risk.
Resources 10 00025 g012
Figure 13. Answer to the question: “Your municipality is investing funds for the construction of a new parking and decides to spend 10% more for make it with pervious materials that allow stormwater retention and therefore reduce urban flooding. What do you think about that?”.
Resources 10 00025 g013
Figure 14. Answer to question: “In building or renovating your home would you be willing to spend more to introduce more green areas and less asphalted surfaces to better adapt to climate change?”
Resources 10 00025 g014
Table 1. Extension of the areas with different levels of geomorphological hazard, as quantified by the plan for the Simeto River basin, P4 indicates the highest level of hazard, P1 the lowest [47].
MunicipalityTotal Surface (ha)Geomorphological Hazard Surfaces (ha)
P4P3P2P1
Centuripe17,419.715.6640.95822.4374.41
Regalbuto17,029.4185.7545.78606.05151.33
Troina16,828.038.3031.72964.58331.71
Adrano8322.222.4746.4849.4414.40
Belpasso16,632.80.000.0050.370.00
Biancavilla7027.621.0028.190.000.00
Catania18,290.011.952.7342.955.47
Motta Sant’Anastasia3570.61.3717.08187.765.06
Paternò14,468.25.4614.96196.394.95
Santa Maria di Licodia2627.61.736.760.000.00
Ragalna3952.80.000.000.000.00
Table 2. Extension of the areas at different levels of hydraulic hazard for the Simeto River basin, P3 indicates the highest level of hazard, P1 the lowest [47].
MunicipalityTotal Surface (ha)Hydraulic Hazard Surfaces (ha)
P3P2P1
Centuripe17,419.7162.76195.65406.48
Regalbuto17,029.431.7884.25100.66
Troina16,8280.000.000.00
Adrano8322.20.000.000.00
Belpasso16,632.8639.473270.934970.44
Biancavilla7027.690.2998.84103.67
Catania18,2904104.728821.159192.27
Motta Sant’Anastasia3570.657.04192.02197.39
Paternò14,468.21043.631583.982191.85
Santa Maria di Licodia2627.60.000.000.00
Ragalna3952.80.000.000.00
Table 3. Number of responses received from each municipality and percentage of responses out of the total answers to the survey.
MunicipalityInhabitants (2018)Number of AnswersPercentage of Answers to the Survey
Adrano35,633534.64%
Belpasso28,126383.33%
Biancavilla23,948332.89%
Catania31,162012811.21%
Centuripe537313011.38%
Motta Sant’Anastasia12,18940.35%
Paternò47,82732928.81%
Ragalna3960665.78%
Regalbuto7190988.58%
Santa Maria di Licodia7691907.88%
Troina9202171.49%
Other 15613.66%
Table 4. Sources from which population responded to hear about climate change. Respondents could select more than one answer (percentages do not sum up to 100% as multiple answers were accepted).
SourcePercentage of Answers
Talking with friends and family44.12%
Social network/Internet66.53%
Newspapers, Radio, TV77.89%
At school/work33.87%
During events/conferences23.83%
Never heard of it0.01%
Table 5. Level of concern during a weather alert.
Level of ConcernPercentage of Answers
very low level of concern5.17%
low level of concern16.53%
medium level of concern45.84%
high level of concern23.23%
very high level of concern9.23%
Table 6. Responses to question ‘Which of these are good practices for adaptation?’.
Good Practices for AdaptationPercentage of Answers
Waste sorting43.61%
Improve the quality of weather alerts17.78%
Sewer maintenance 51.75%
Avoid wasting water19.81%
Build infrastructures for flood protection60.07%
Production and use of energy from renewable sources 58.23%
Table 7. Summary table with main direct results of the survey.
QuestionOverall Results
Link between climate change and floodsPresent for over 80%
How often you hear about climate changeAt least once a week
What sources discuss about climate changeRadio/TV/Newspaper/Social
Direct experience with floodable areasPresent for over 50%
Confidence in weather alertMedium/Low
Good practices during floodsNot always correct
Responsibility for the prevention of flood riskItalian State and other institutions
Good practices for adaptationLittle knowledge of adaptation actions
Public adaptation actionsModestly favorable
Private adaptation actionsModestly favorable
Table 8. Contingency table for exploring link between concern for climate change and the possible correct behavior of individuals during urban flooding.
Degree of Worry about Climate Change
HigherLower
Correct behavior during urban floodsLikely707 (A)93 (C)
Unlikely293 (B)49 (D)
Total1000 (A + B)142 (C + D)
Conditional frequenciesA/(A + B) = 0.71C/(C + D) = 0.66
Table 9. Contingency table for exploring link between concern for climate change and the possible willingness to invest in adaptation actions.
Degree of Worry about Climate Change
HigherLower
Willingness to invest in adaptation actionsHigher915 (A)123 (C)
Lower85 (B)19 (D)
Total1000 (A + B)142 (C + D)
Conditional frequenciesA/(A + B) = 0.92C/(C + D) = 0.87
Publisher’s Note: MDPI stays neutral with regard to jurisdictional claims in published maps and institutional affiliations.

