1. Introduction
Pluvial (or urban) floods occur when surface runoff generation exceeds drainage capacity, often during high-intensity short-duration rainfall events [
1,
2]. Increasing urbanization aggravates pluvial floods by expanding impervious surface areas and modifying flow paths. Future changes in land cover will increase the vulnerability of many urban areas to pluvial flooding due to extreme rainfall events [
3]. Pluvial flooding can cause major disruptions in cities, and lead to significant impacts on people, the economy and the environment [
4].
Management of pluvial flood risks is important to mitigate flood damages and losses. Flood risk is defined as the probability that a flood event of a given magnitude and with a given loss will occur [
5]. Therefore, flood risk involves two aspects: (i) flood hazard or the probability of occurrence and duration of flood events, which is determined by physical–environmental factors; (ii) flood vulnerability, which describes the elements that are exposed to the flooding event and their susceptibility to damages and losses [
6,
7,
8]. Flood depth is often regarded as the main factor responsible for flood damages, but flood variables such as flow velocity or duration can also play a role [
9,
10]. Therefore, not only flood depth but also flow velocity were selected in this study as key parameters to assess flood damage.
Nature-based solutions (NBS) have been proposed for reducing flood hazard, especially in the context of ongoing climate changes and rapid urbanization [
11]. NBS can be defined as solutions that simulate the services provided by ecosystems in terms of environmental, social and economic benefits [
12,
13]. These ecosystem services can come from natural as well as anthropogenic ecosystems, whether created intentionally or not by humans [
14,
15]. A large variety of NBS for flood risk mitigation can be found in the literature. Examples range from green roofs and walls at the scale of individual buildings to vegetation formations at the scale of entire streets and parks. NBS have the advantage of retrofitting existing structures, to improve the storage capacity of the drainage system by increasing infiltration, as well as water retention capacity and, hence, decreasing the peak discharge of the existing sewage system and, ultimately, the occurrence of flooding [
16]. NBS are now widely envisaged as effective measures against urban flood risks, in particular for those floods caused by precipitation events that occur with high frequency and, at the same time, provoke substantial environmental, social and economic impacts [
17,
18].
The effectiveness of NBS for flood risk mitigation has been addressed by several prior studies, mainly focusing on the reduction in peak flow [
19,
20,
21], runoff [
22,
23,
24], flood volume [
25], inundation area and hazard level [
26,
27]. Nevertheless, the effects of NBS on flood extent, water depth and flow velocity are still poorly known [
28], while they are crucial for implementing NBS [
16]. Furthermore, the effectiveness of NBS has been found to vary with different storms [
29,
30]. Numerical models have been used to select and design flood risk strategies [
31]. However, more results regarding NBS impacts on flood mitigation are needed, namely flood depth and velocity, since the problems are usually complex and can have multiple solutions [
32].
The objective of this study is to comprehensively compare the effectiveness of contrasting, stakeholder-selected scenarios of NBS for flood risk mitigation in a flood-prone highly-urbanized area. To this end, an integrated assessment of flood risk combining flood extent with water depth and flow velocity, for design storms with short, medium and long return periods was performed.
2. Case Study Eindhoven
Eindhoven is located in the North Brabant province, in the southern part of The Netherlands, and is the country’s fifth-largest city, with an area of 89 km
2 and 224,755 inhabitants in 2016 [
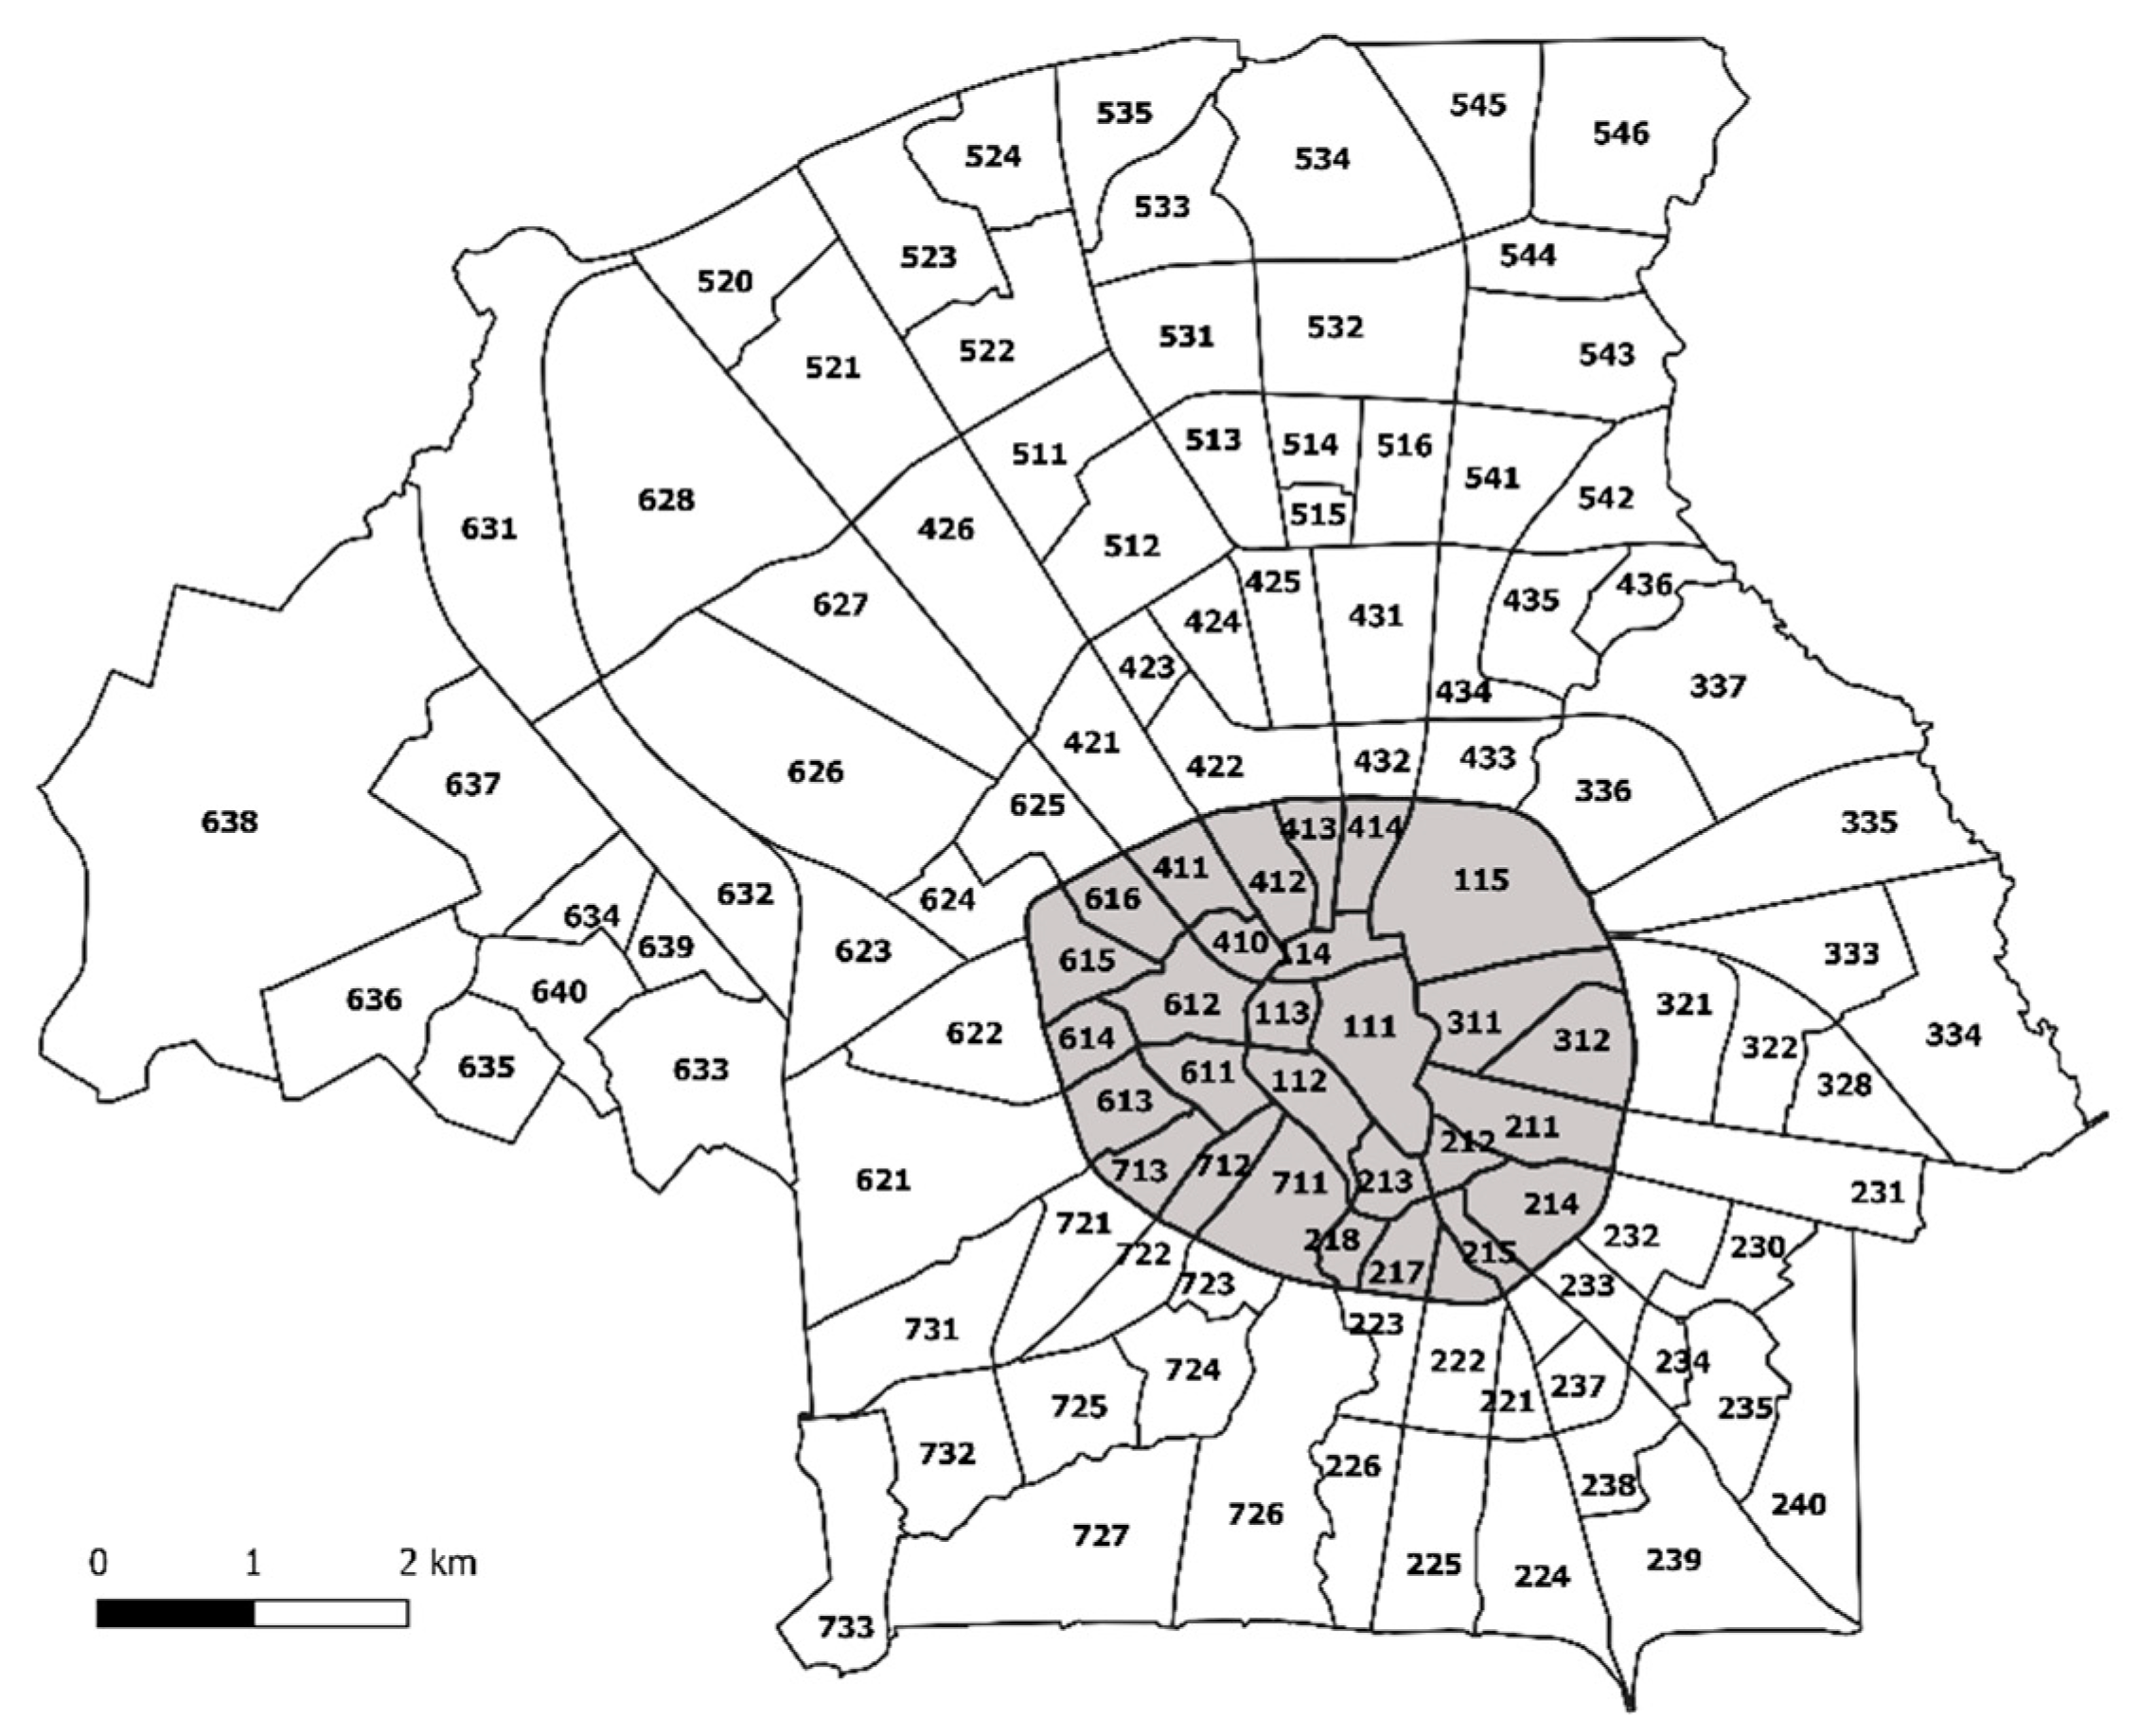
32,
33]. Eindhoven is divided into 116 administrative boroughs or neighborhoods, of which 29 constitute the city center (
Figure 1).
Like in many other modern European cities, urban development in Eindhoven has not been accompanied by an adequate expansion and upgrading of the sewer and stormwater networks [
34,
35]. Only 28% of the combined sewer–stormwater network shown in
Figure 2 has a separate collection of the surface runoff and the sewage water.
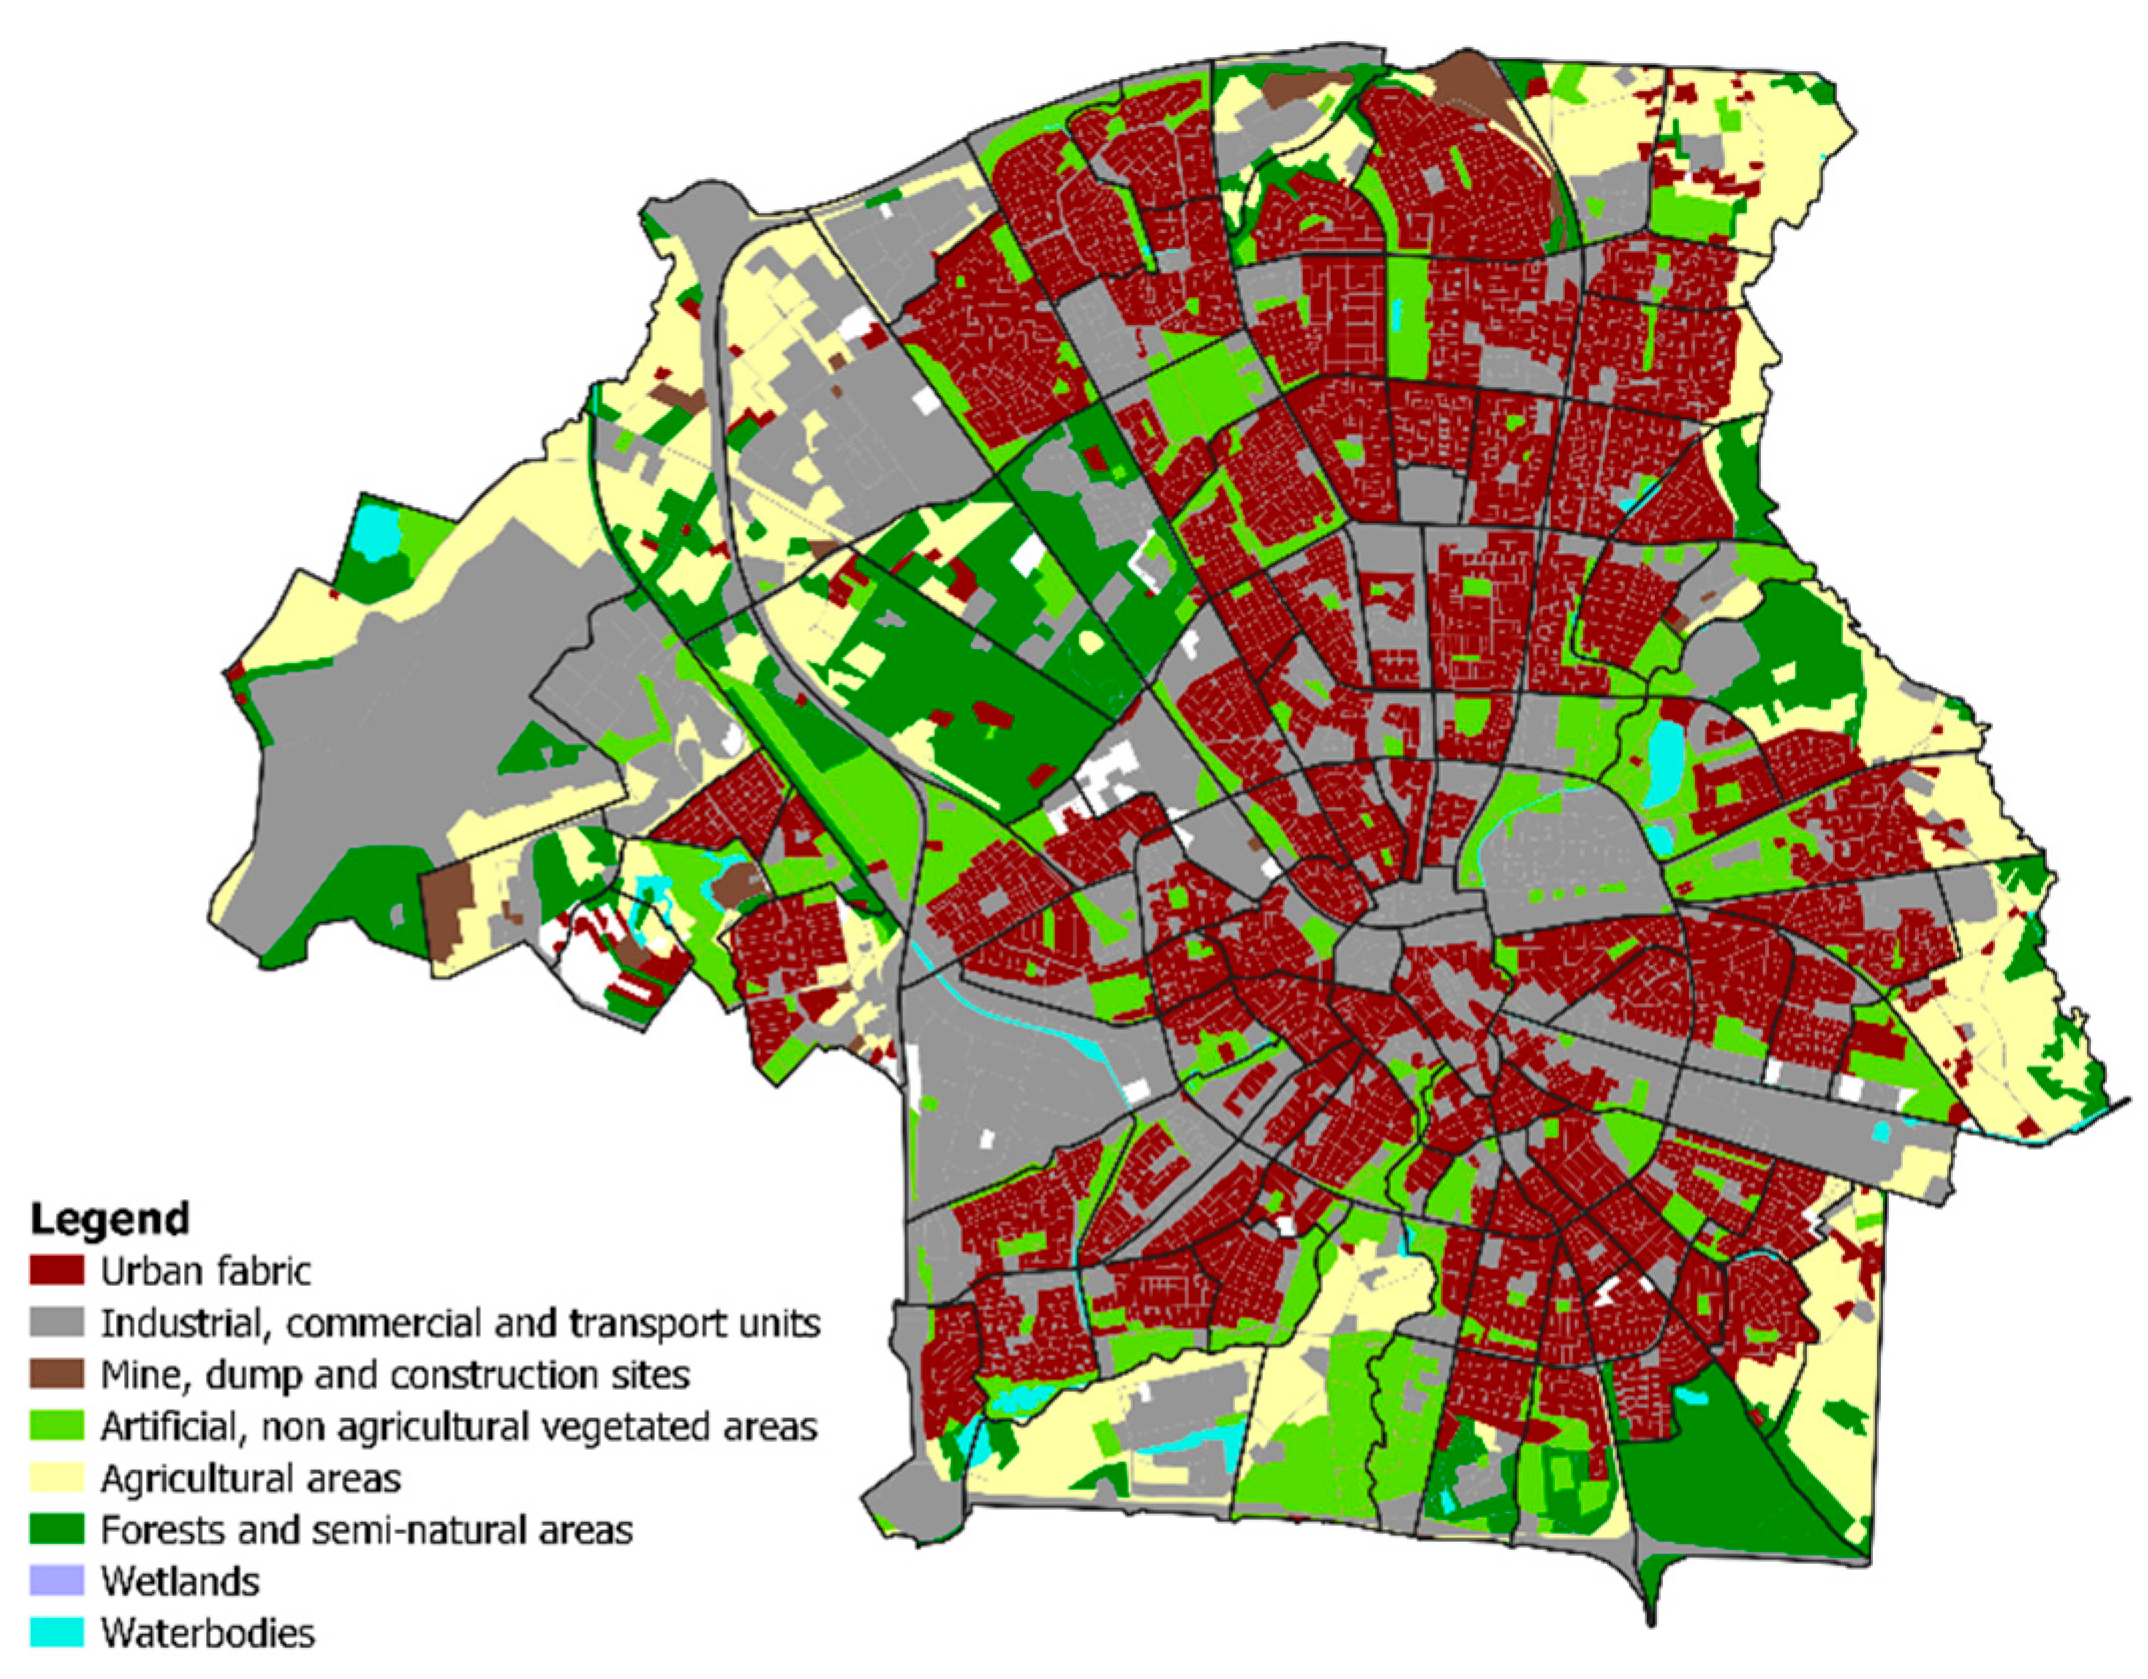
Most of the area of Eindhoven comprises urban, commercial and industrial areas or, in other words, houses, buildings and paved areas that are impervious (
Figure 3). Furthermore, the soils in Eindhoven are predominantly clayey and, hence, are characterized by relatively slow infiltration rates that contribute to ponding and, on sloping terrain, runoff generation. Furthermore, several streams run through Eindhoven, so groundwater levels are near the soil surface throughout the year in several parts of the city. Therefore, pluvial flood events have been reported in Eindhoven [
36].
3. Methodology
3.1. Scenarios
Stakeholders from Eindhoven municipality have proposed several large-scale climate change adaptation measures that include the implementation of various NBS to reduce pluvial flooding hazard. These NBS include: (i) “greening” of regular car parking spaces through the application of vegetated grid pavement; (ii) implementation of green roofs; (iii) incorporation of street water storage in traffic islands, through the implementation of swales and bio-swales, depending on location and available space. These three NBS are illustrated in
Figure 4, while
Table 1 gives an overview of these NBS scenarios.
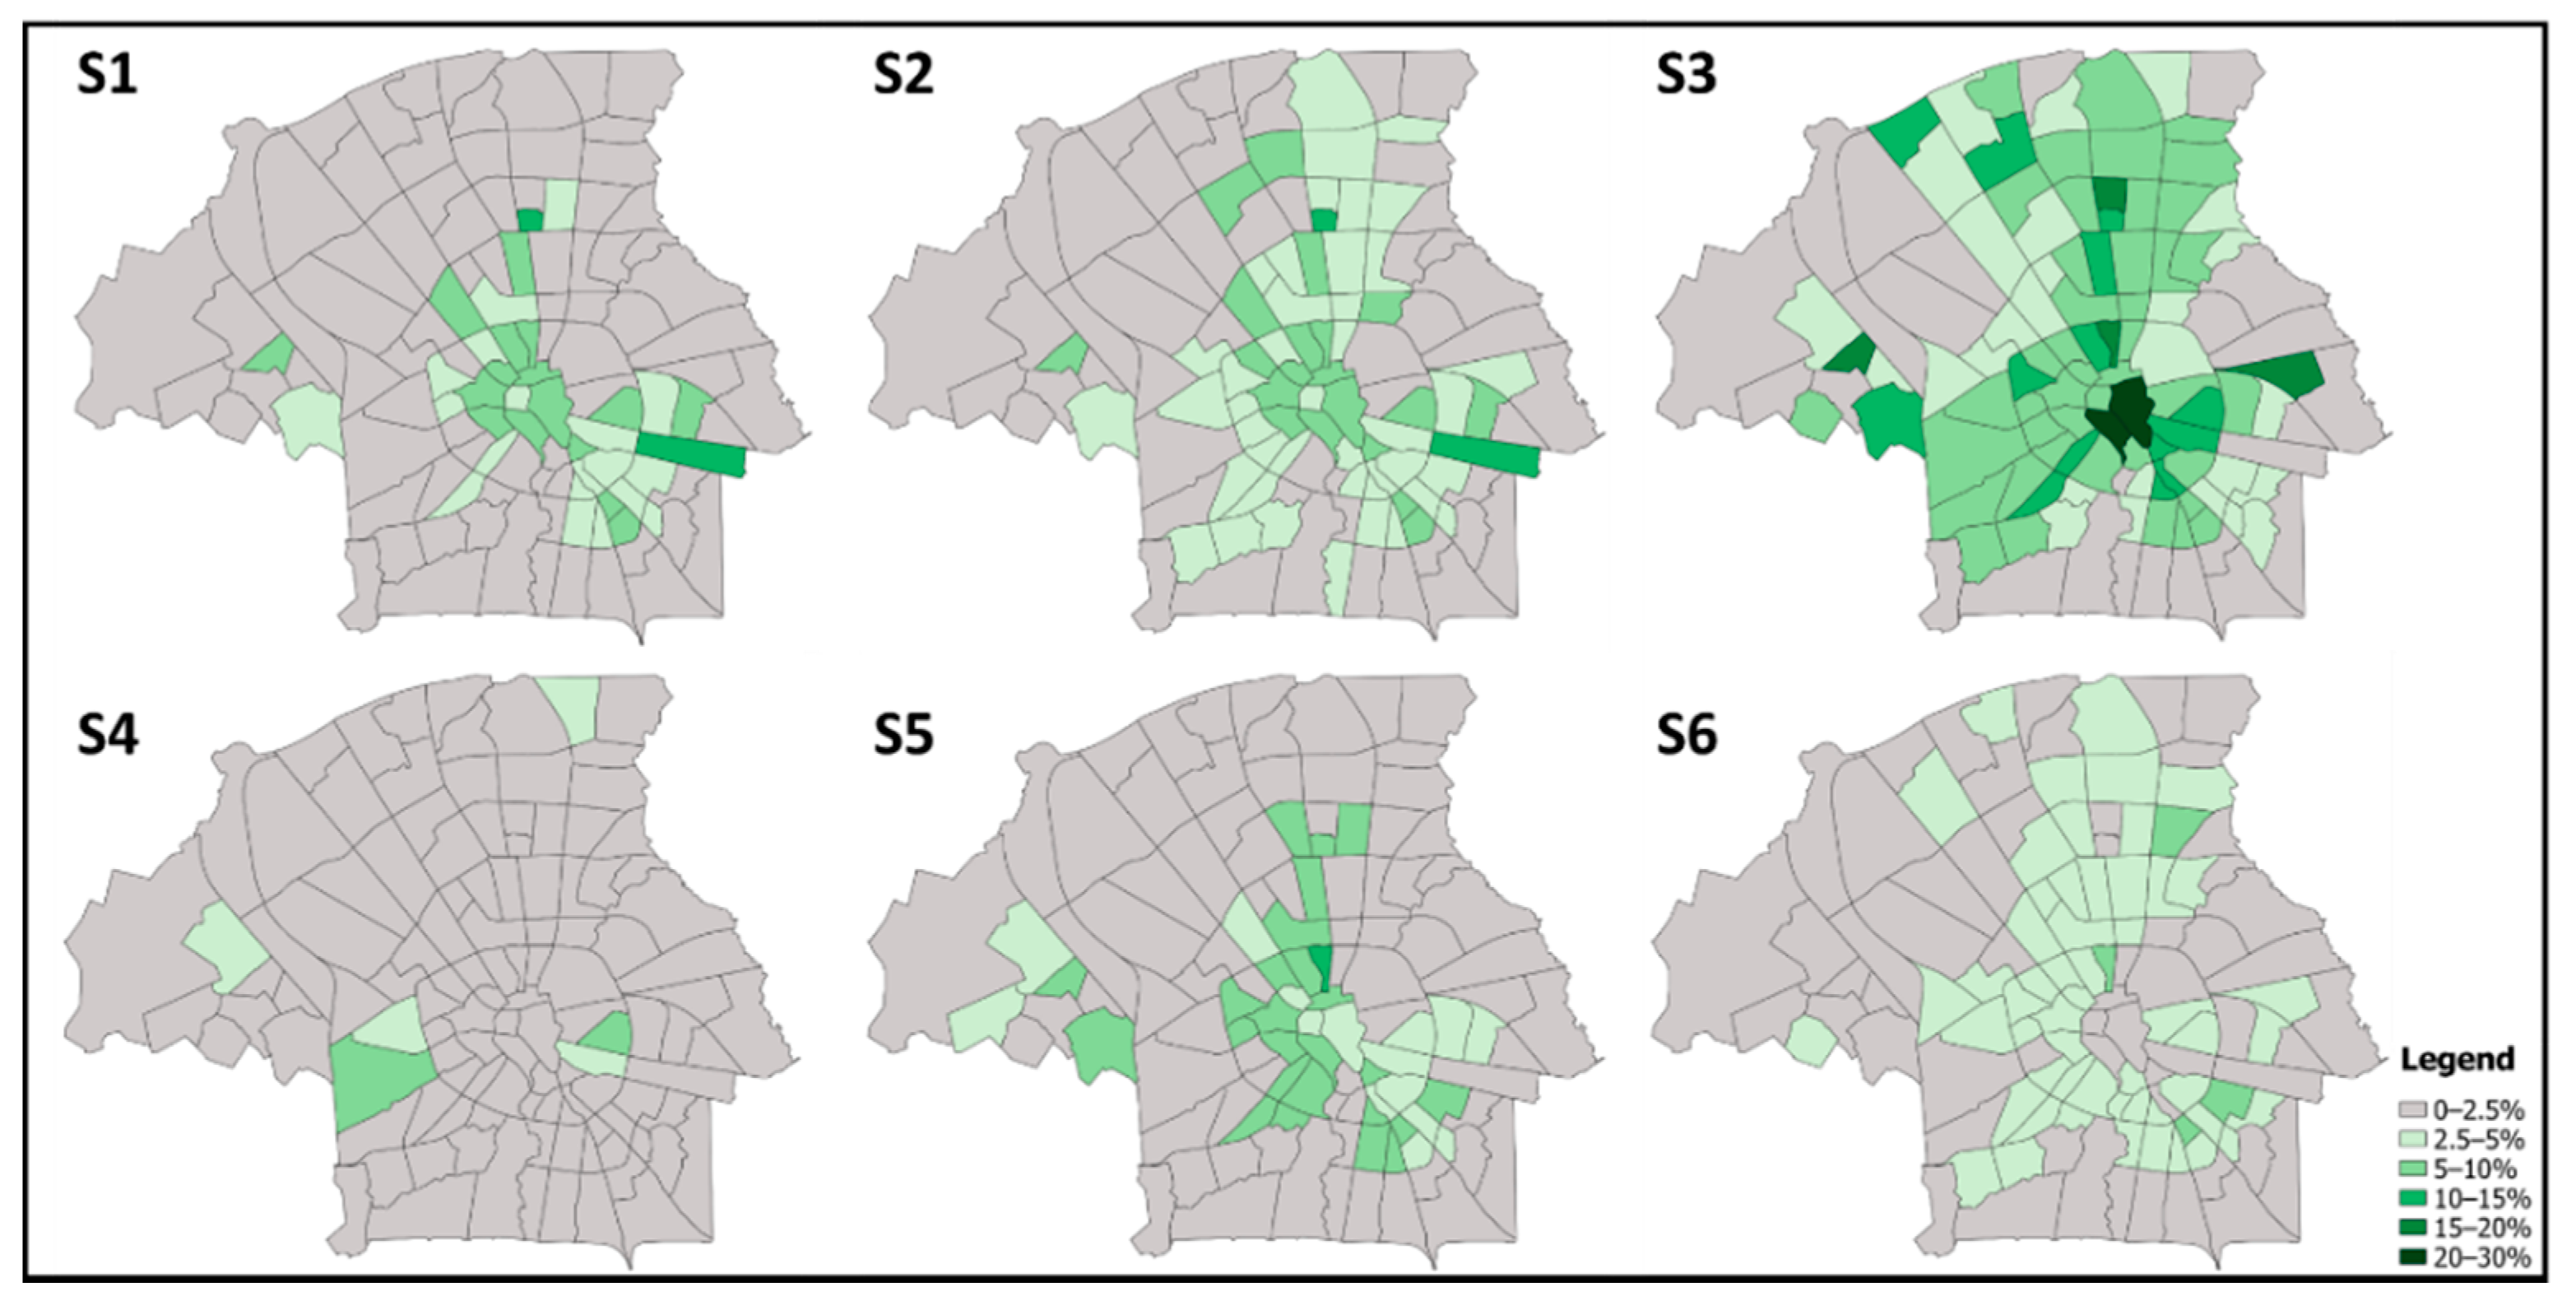
Figure 5 shows the distribution of these NBS over the various neighborhoods, with the area where the NBS are to be implemented being expressed as a percentage of the total area of the neighborhood.
3.2. Numerical Model
Simulations were performed with a 1D/2D coupled model that was created using the software Infoworks ICM by Innovyze [
37] and was already applied in earlier studies of urban floods [
38,
39] The model combines a 1D model of the sub-surface network with a 2D model of the overland surface network and also simulates the interaction between both networks (1D/2D linkage).
Here, the model was applied to the “baseline” conditions in 2018 as well as for the six NBS scenarios listed in
Table 1. The runoff was computed for each sub-catchment using the Desbordes flow model, while the infiltration was calculated using the Horton infiltration model [
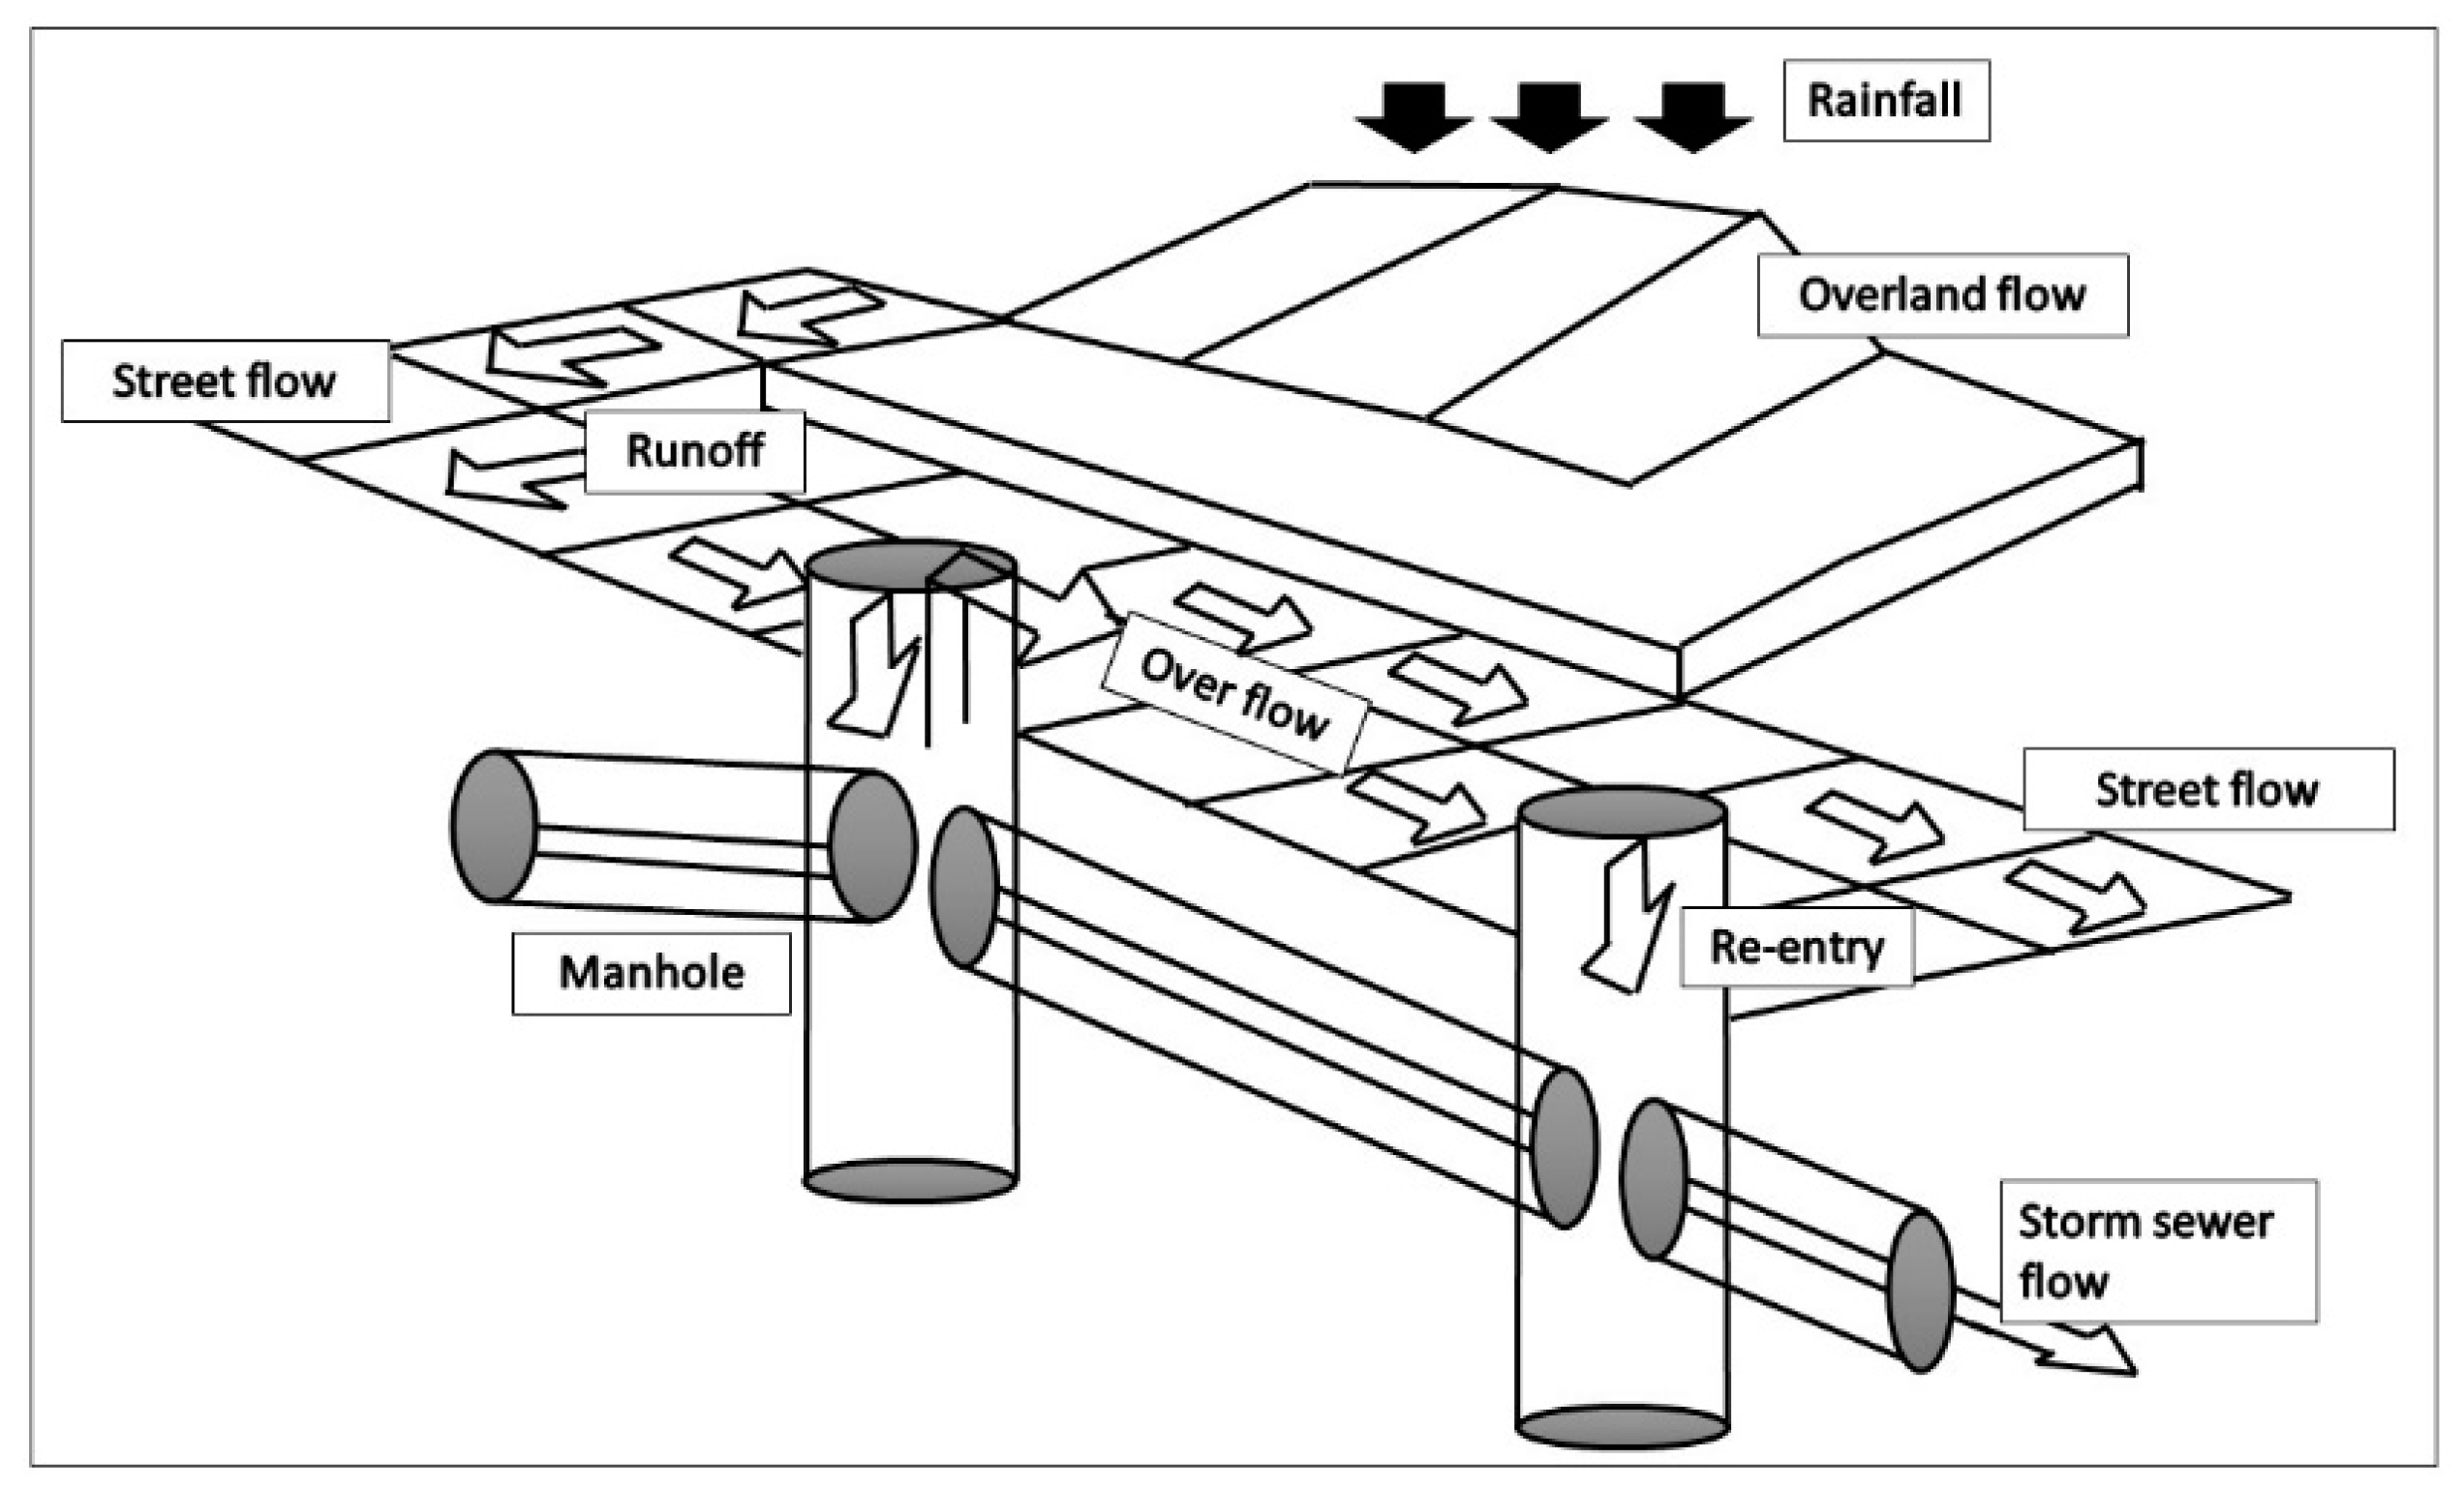
37]. The runoff of rainwater towards the sewer system was determined on basis of the surface properties of each sub-catchment, in particular infiltration, surface storage, and discharge delay. These properties depend on the type of surface and the slope of the terrain. The runoff of a sub-catchment is then routed towards inlet points into the sewer system, using a coupling map indicating the inlet points. In case the runoff in the sewer system (1D) exceeds its transport capacity, the sewer system can become surcharged/pressurized and the pipes completely filled. Under such circumstances, water might flow out to the surface network (2D) at the linking elements such as manholes or inlets and, ultimately, cause street flooding. Weir/orifice flow equations were used to simulate the flow exchange between the surface and subsurface networks (
Figure 6).
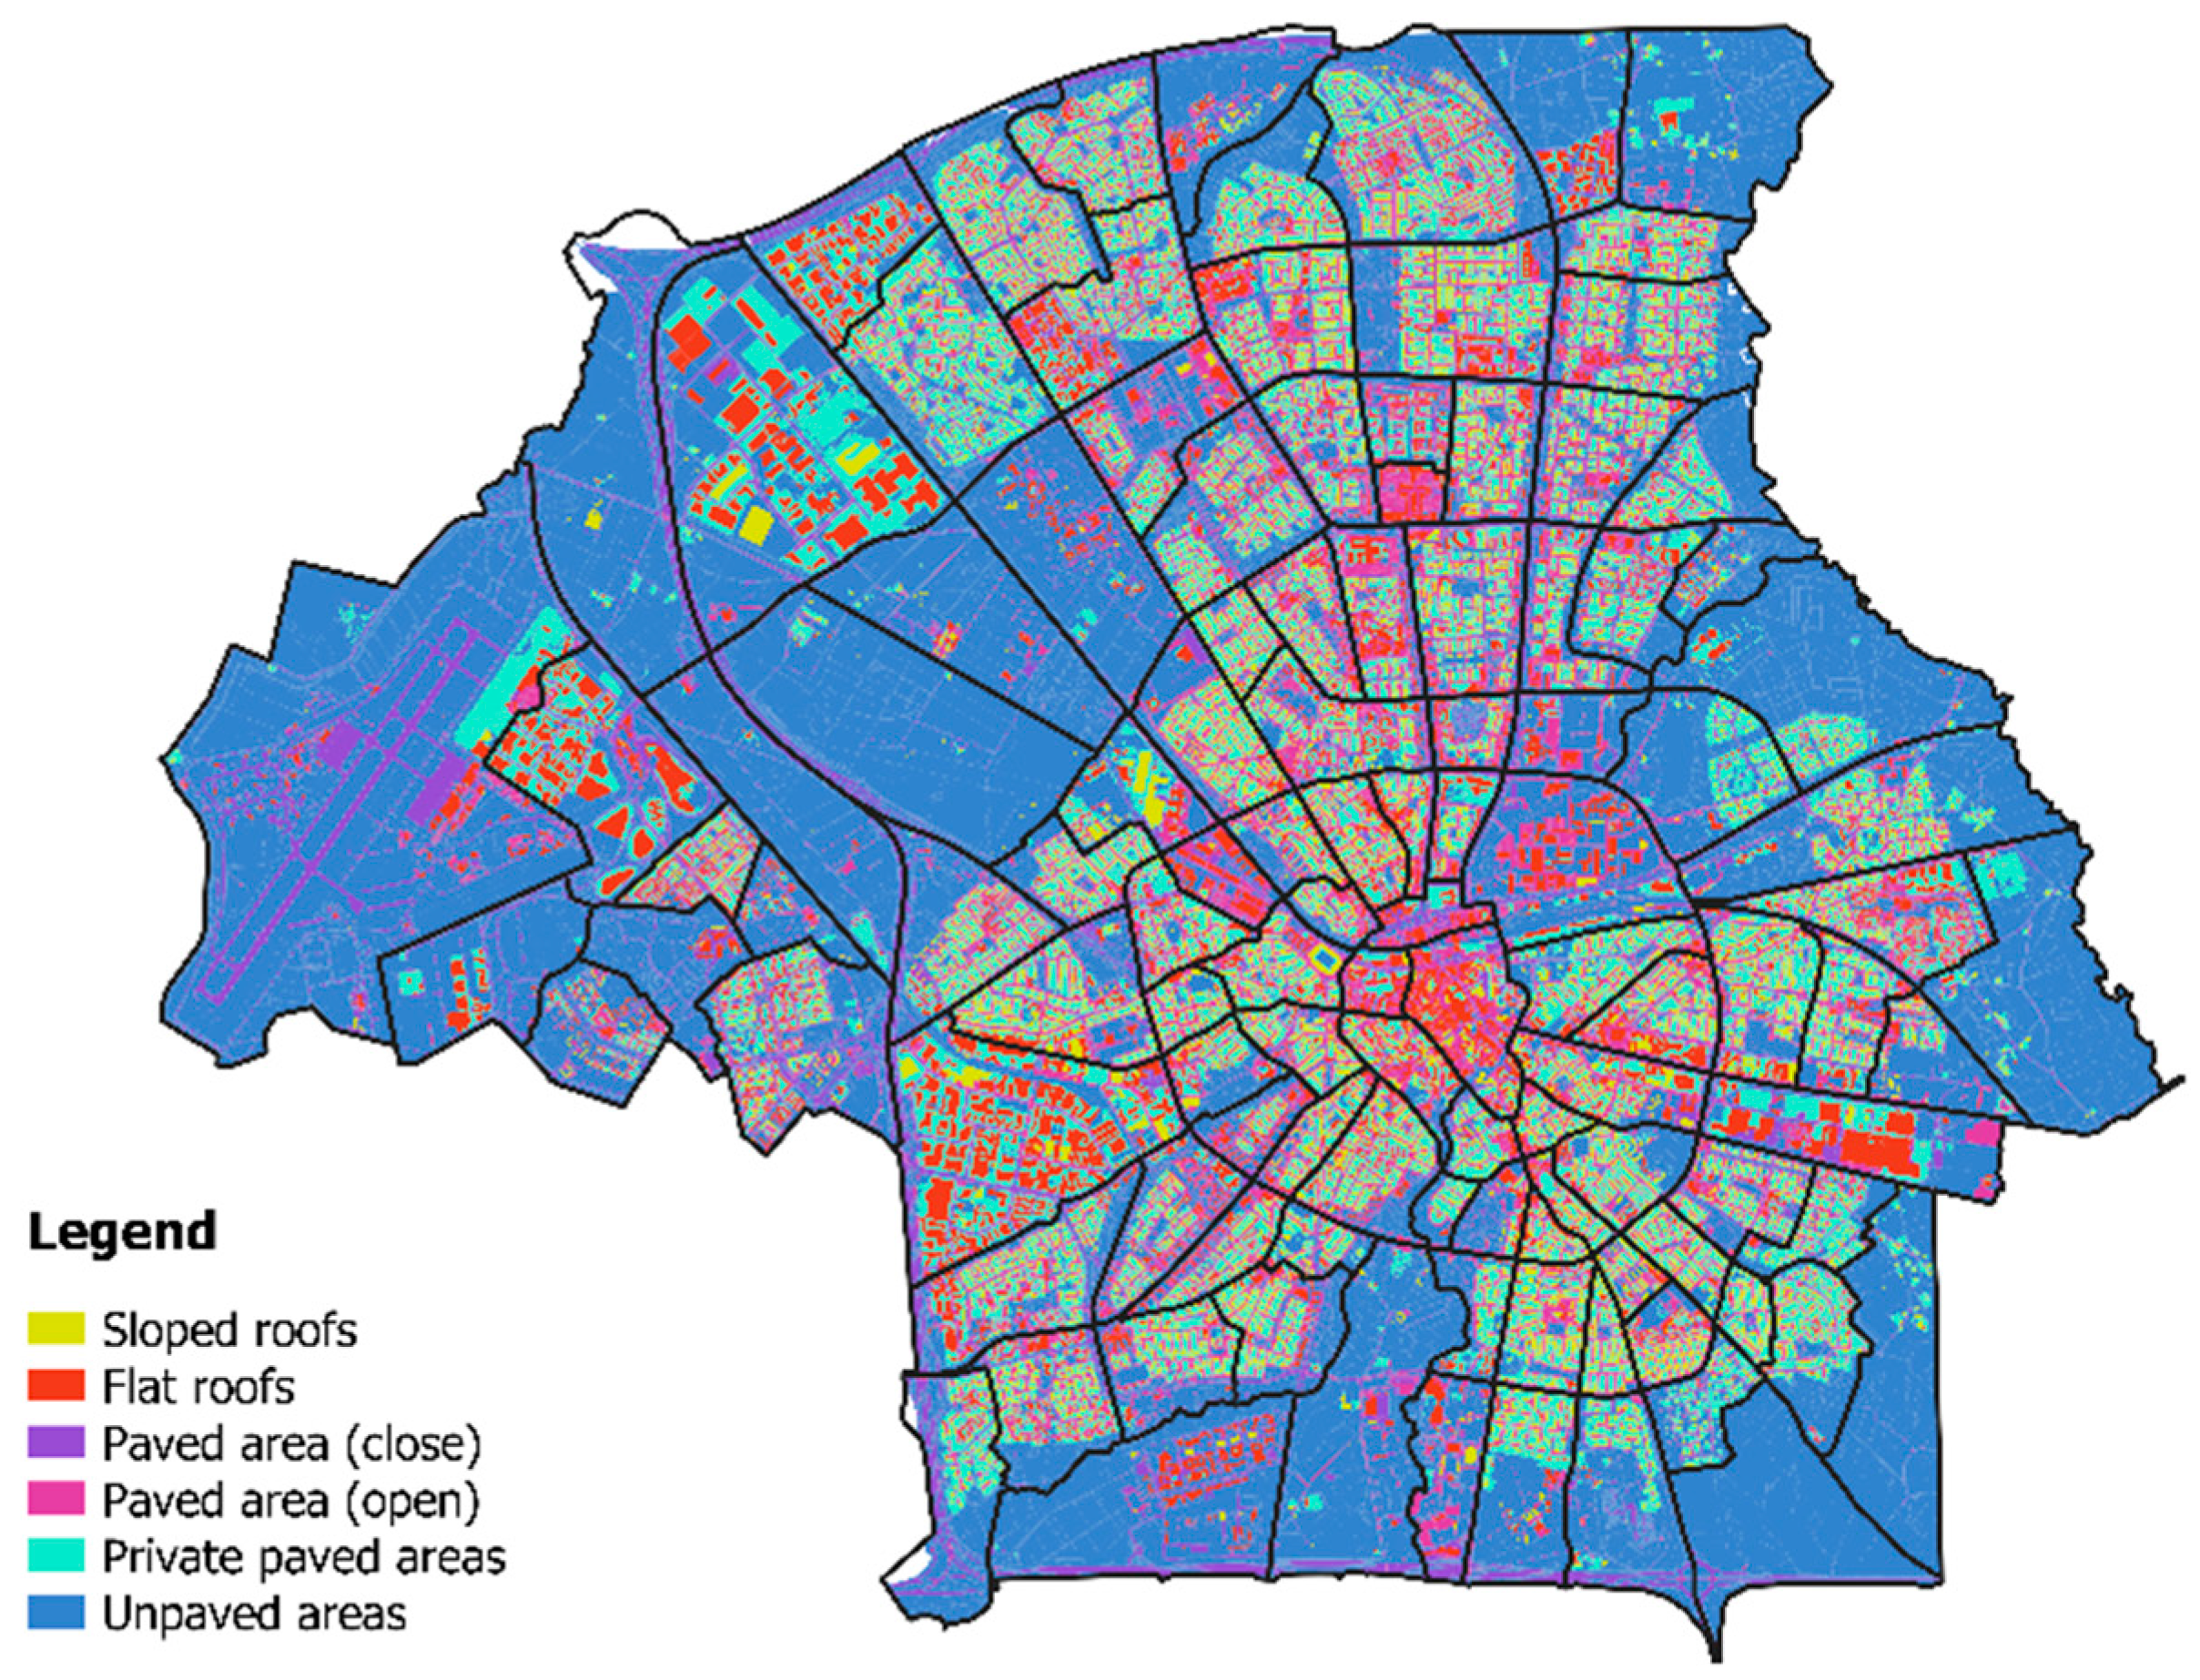
The 2D surface model was implemented for the city of Eindhoven by dividing the surface area into four classes, i.e., unpaved areas; open and closed paved areas, and roofs.
Figure 7 shows the distribution of these four surface classes for Eindhoven, while
Table 2 lists the model parameter values for runoff delay, surface storage and infiltration capacity that were used in this study for each of the surface classes.
The sewer system and surface networks in 2018 were defined as baseline conditions, while NBS scenarios were simulated through changes to the surface network. More specifically, the scenarios of green car parking (S1 and S2) and green roofs (S3 and S4) were simulated by disconnecting these areas from the model, assuming that they retain all rainfall and did not contribute to runoff. The street water storage scenarios (S5 and S6) were simulated by adding a storage capacity of 0.25 m3, as would be provided by deposits of 1 m high by 2.5 m wide per 1 m of street length. A more realistic simulation of the various NBS scenarios, and especially S3 and S4, was not possible at the time of this study, as the Infoworks module for representing NBS was still in an initial phase of development.
In this study, the modeling results for the baseline conditions were not validated against measurements, as that had been done previously [
34,
35]. This prior validation involved a comparison of simulated and observed flood extensions in Eindhoven, as well as of simulated and observed water volumes at the sewage plant and water levels at sewage systems.
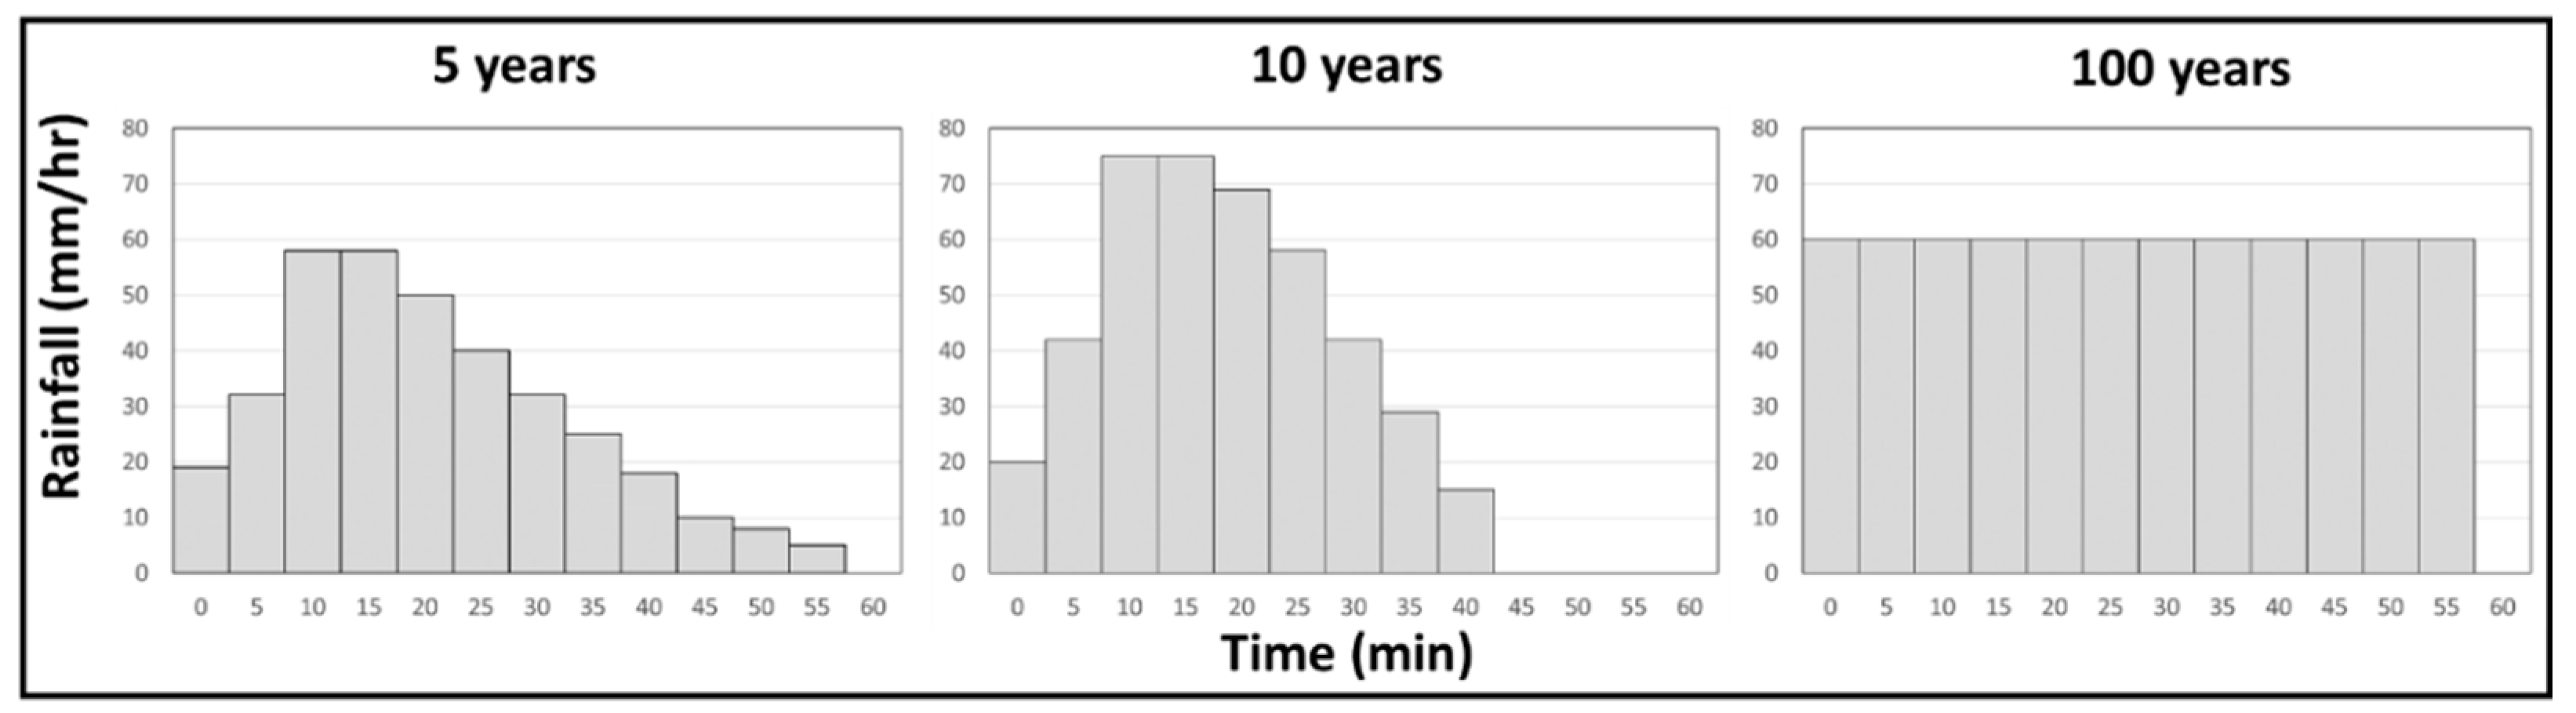
The simulations for baseline conditions and the six NBS scenarios were carried out for three design rainfall events with return periods of 5, 10, and 100 years, following the national Dutch guidelines for sewage design [
41,
42]. These synthetic design hyetographs are presented in
Figure 8. They assumed homogeneous rainfall fall over the entire area of Eindhoven, which is hardly realistic and possibly resulted in an overestimation of possible flooding.
3.3. GIS Analysis
Infoworks results for street flooding were exported to ERSI shapefile format, and then the attribute table was analyzed for a range of flooding statistics. The attribute table presents maximum pluvial flooding depth and velocity at each cell of the overland flow mesh. For each scenario, return period and neighborhood, the following statistics were determined: flooded area (total area and corresponding percentage of neighborhood), and average maximum flood depth and velocity. Flooded area percentage, for each neighborhood, was determined as the percentage of flooded area relative to the total neighborhood area. Average values for maximum flood depth and velocity are weighted-average values considering the computational cell area.
4. Results and Discussion
4.1. Flooded Area
Flooded area and the total water volume of different scenarios are presented in
Table 3. Results show that in all NBS scenarios a decrease in flooded area and water volume is expected, relative to the baseline. For scenarios S1 to S4, results show that flooded area decreases with the increase in NBS implementation area. Therefore, scenario S3, which presents the larger NBS surface area, a higher flooded area and water volume reduction is expected. On the other hand, for scenarios of water storage on the street, the same trend is not observed. Despite S5 presenting a larger implementation area, a higher decrease in the flooded area is expected for S6.
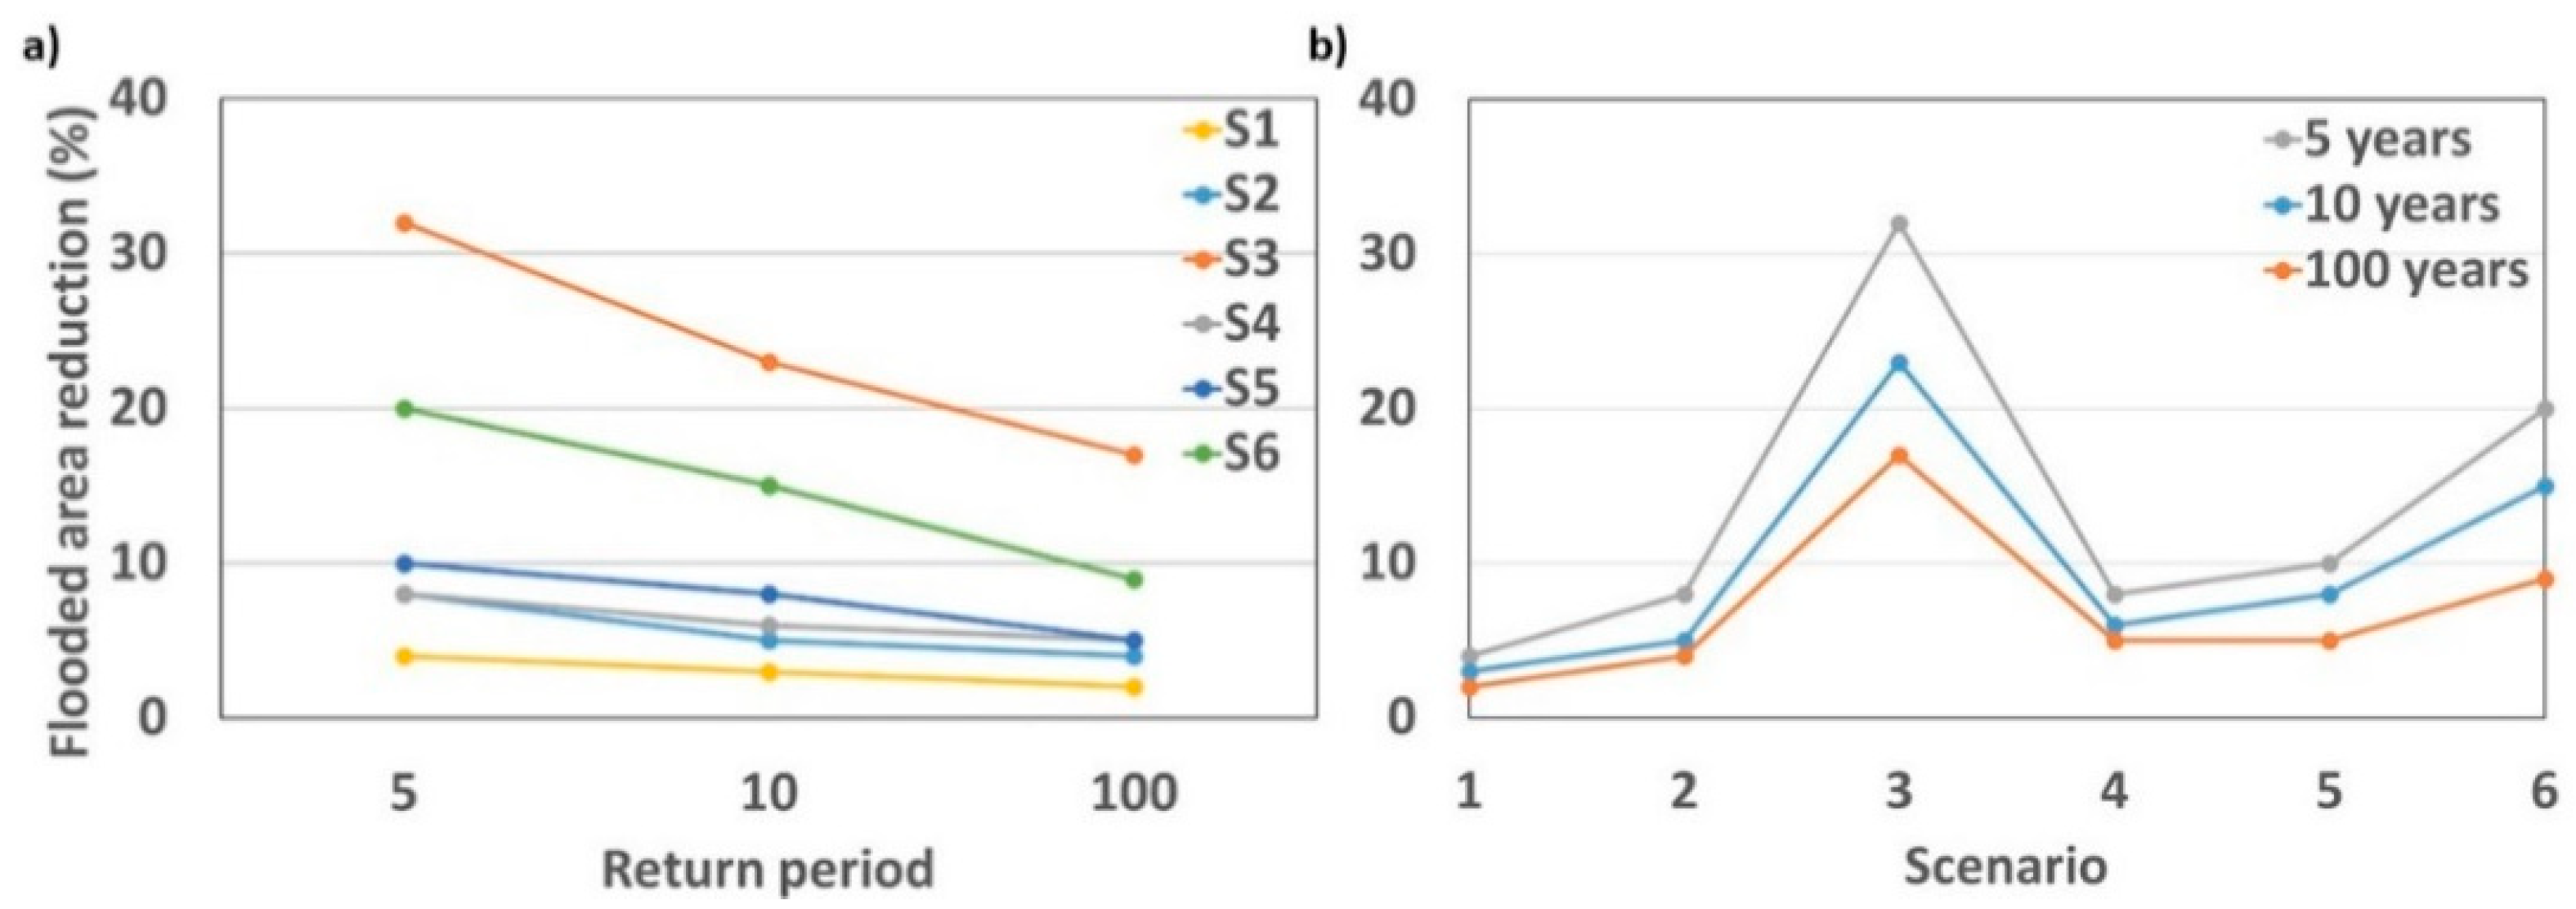
Figure 9 presents the variation in the percentage of flooded area reduction as a function of the rainfall return period and different NBS scenarios. For all scenarios, the reduction in flooded area is decreasing in the rainfall return period. This reduction is larger for scenarios S3 and S6 between 5 and 10 years, than 10 and 100 years (
Figure 9a).
The analysis of the change in flooded area in relation to the NBS surface area shows that the reduction is higher for the larger NBS surface area of S3 (
Figure 9b). Furthermore, for green car parking, the flooded area reduction is proportionally associated with the NBS surface area. S2 has twice as much NBS surface area as S1, and the flooded area reduction for S2 is twice the value expected for S1 in all return periods. However, the same trend is not observed for the green roof scenarios (S3 and S4). These differences can be related to the NBS location in scenarios S1, S2, S3 and S4. In contrast, for water storage scenarios, a higher increase is expected for a lower NBS surface area. This can also be related to NBS location, as in S6, the water storage areas are distributed across more neighborhoods (see
Figure 3 and
Figure 5). Moreover, analysis of the different NBS and their surface area shows that for scenario S5, despite its larger area comparative to S2 and S4, the differences in the flooded area are low, especially for 100 years return period, with S4 and S5 scenarios presenting the same value (see
Figure 9b).
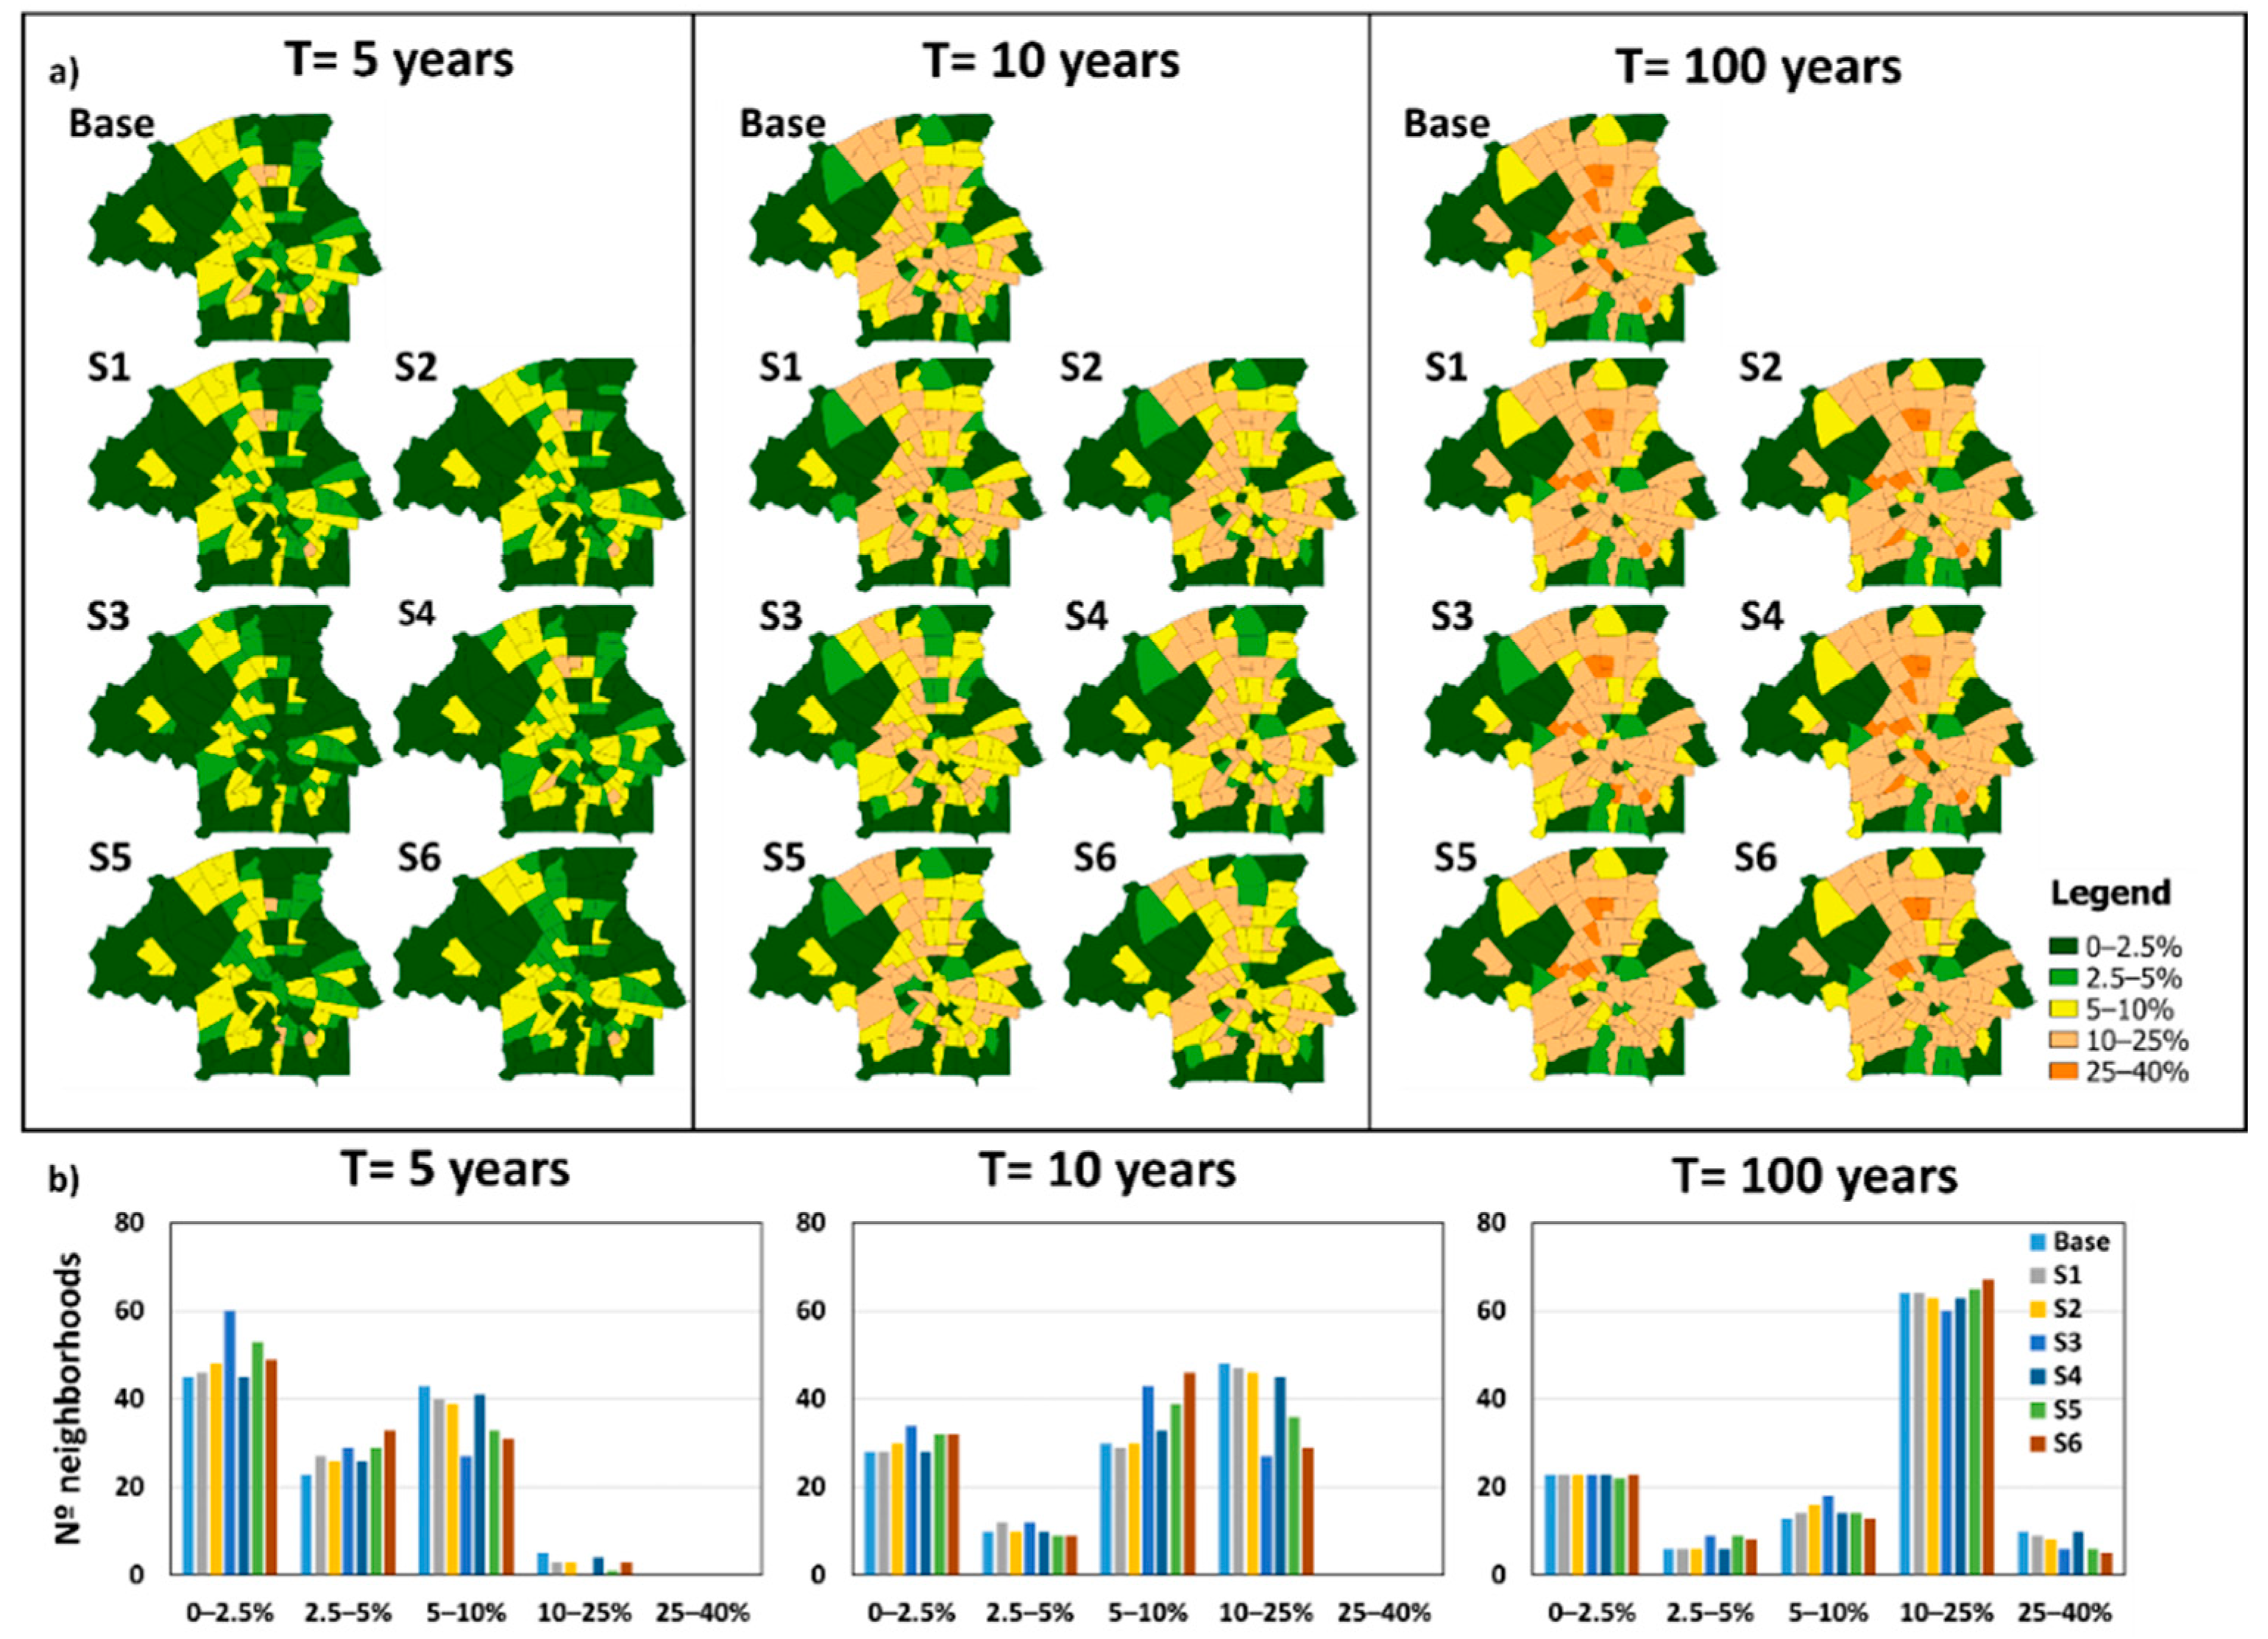
The spatial distribution of flooded area percentages for the baseline and NBS scenarios shows that higher percentages correspond mainly to areas that have mostly impervious surfaces (
Figure 6 and
Figure 10a). Flooded area distribution of scenarios S1, S2 and S4 are similar to the baseline; Scenarios S3, S5 and S6 present larger differences, with lower flooded area percentages in a larger number of neighborhoods as compared to the baseline (
Figure 10). For the 5 years return period under the baseline and NBS scenarios, a flooded area percentage of less than 10% is expected in the city center (
Figure 10a). Furthermore, as compared to the baseline, under scenarios S3, S5 and S6 there are significantly more neighborhoods with a smaller flooded area than there are neighborhoods with a larger flooded area (see
Figure 10b).
Table 4 presents flooded area values at selected neighborhoods for the baseline and NBS scenarios. Results show that in some neighborhoods the changes in the flooded area are negligible. This is justifiable as these neighborhoods present no flooding (e.g., 239), have a low percentage of flooded area in the baseline (e.g., 626 and 636), or are distant from where the NBS are implemented.
On the other hand, in the neighborhoods where NBS are implemented, there is a reduction in flooded area. Generally, this reduction is positively related to the NBS surface area, which corresponds in most of the neighborhoods to S3 (e.g., 112 and 615). However, for neighborhoods with similar NBS surface areas for different NBS types, as for example neighborhoods 112, 221, 233 and 236 for scenarios S1, S2, S3, S5 and S6, the water storage scenarios (S5 and S6) present higher flooded area reduction. For example, in neighborhood 112, scenarios S1, S2 and S5 present the same percentage of NBS surface area, but higher reductions are expected for S5 (
Table 4). Furthermore, the differences in flooded area for water storage scenarios, relative to the baseline, increase with the rainfall return period (e.g., 233 and 236), which is not observed for green roofs and green car parking scenarios. Regarding green car parking and green roofs, when applied with the same surface area (e.g., 322), a higher reduction in flooded area is expected for scenario S3.
4.2. Flood Depth and Velocity
Table 5 presents the flood depth values at selected neighborhoods. Results show that for most of the neighborhoods, the average flood depth is less than 15 cm below baseline conditions. Only in six neighborhoods the expected flood depth is more than 15 cm below that of the baseline, given a 100 years return period. Studies have shown that the height of an average doorstep was 10 cm in Rotterdam and up to 20 cm in other European locations [
35,
42]. Hence, it is not expected that flooding will occur in the interior of most buildings in Eindhoven city.
Analysis of the flood depth differences relative to baseline shows that the scenario with the larger NBS surface area, scenario S3, presents larger reductions in flood depth (e.g., 112 and 615). Furthermore, in some neighborhoods no flood is expected under S3 (e.g., 212). However, for water storage scenarios, an increase in flood depth is expected in some neighborhoods (e.g., 112 and 621). This can be explained by the extra storage areas with 1 m height, which may increase the average flood depth of the neighborhood. Results also show that neighborhoods where different NBS types present similar surface areas for scenarios S1, S2, S3, S5 and S6 (e.g., 221 and 233), larger flood depth reductions are expected for S5, but only for 10 and 100 years return periods. Regarding scenarios S1, S2 and S3, neighborhoods with the same percentage of NBS implementation surface area (e.g., 322), larger flood depth reductions are expected under S3 for the 5 years return period.
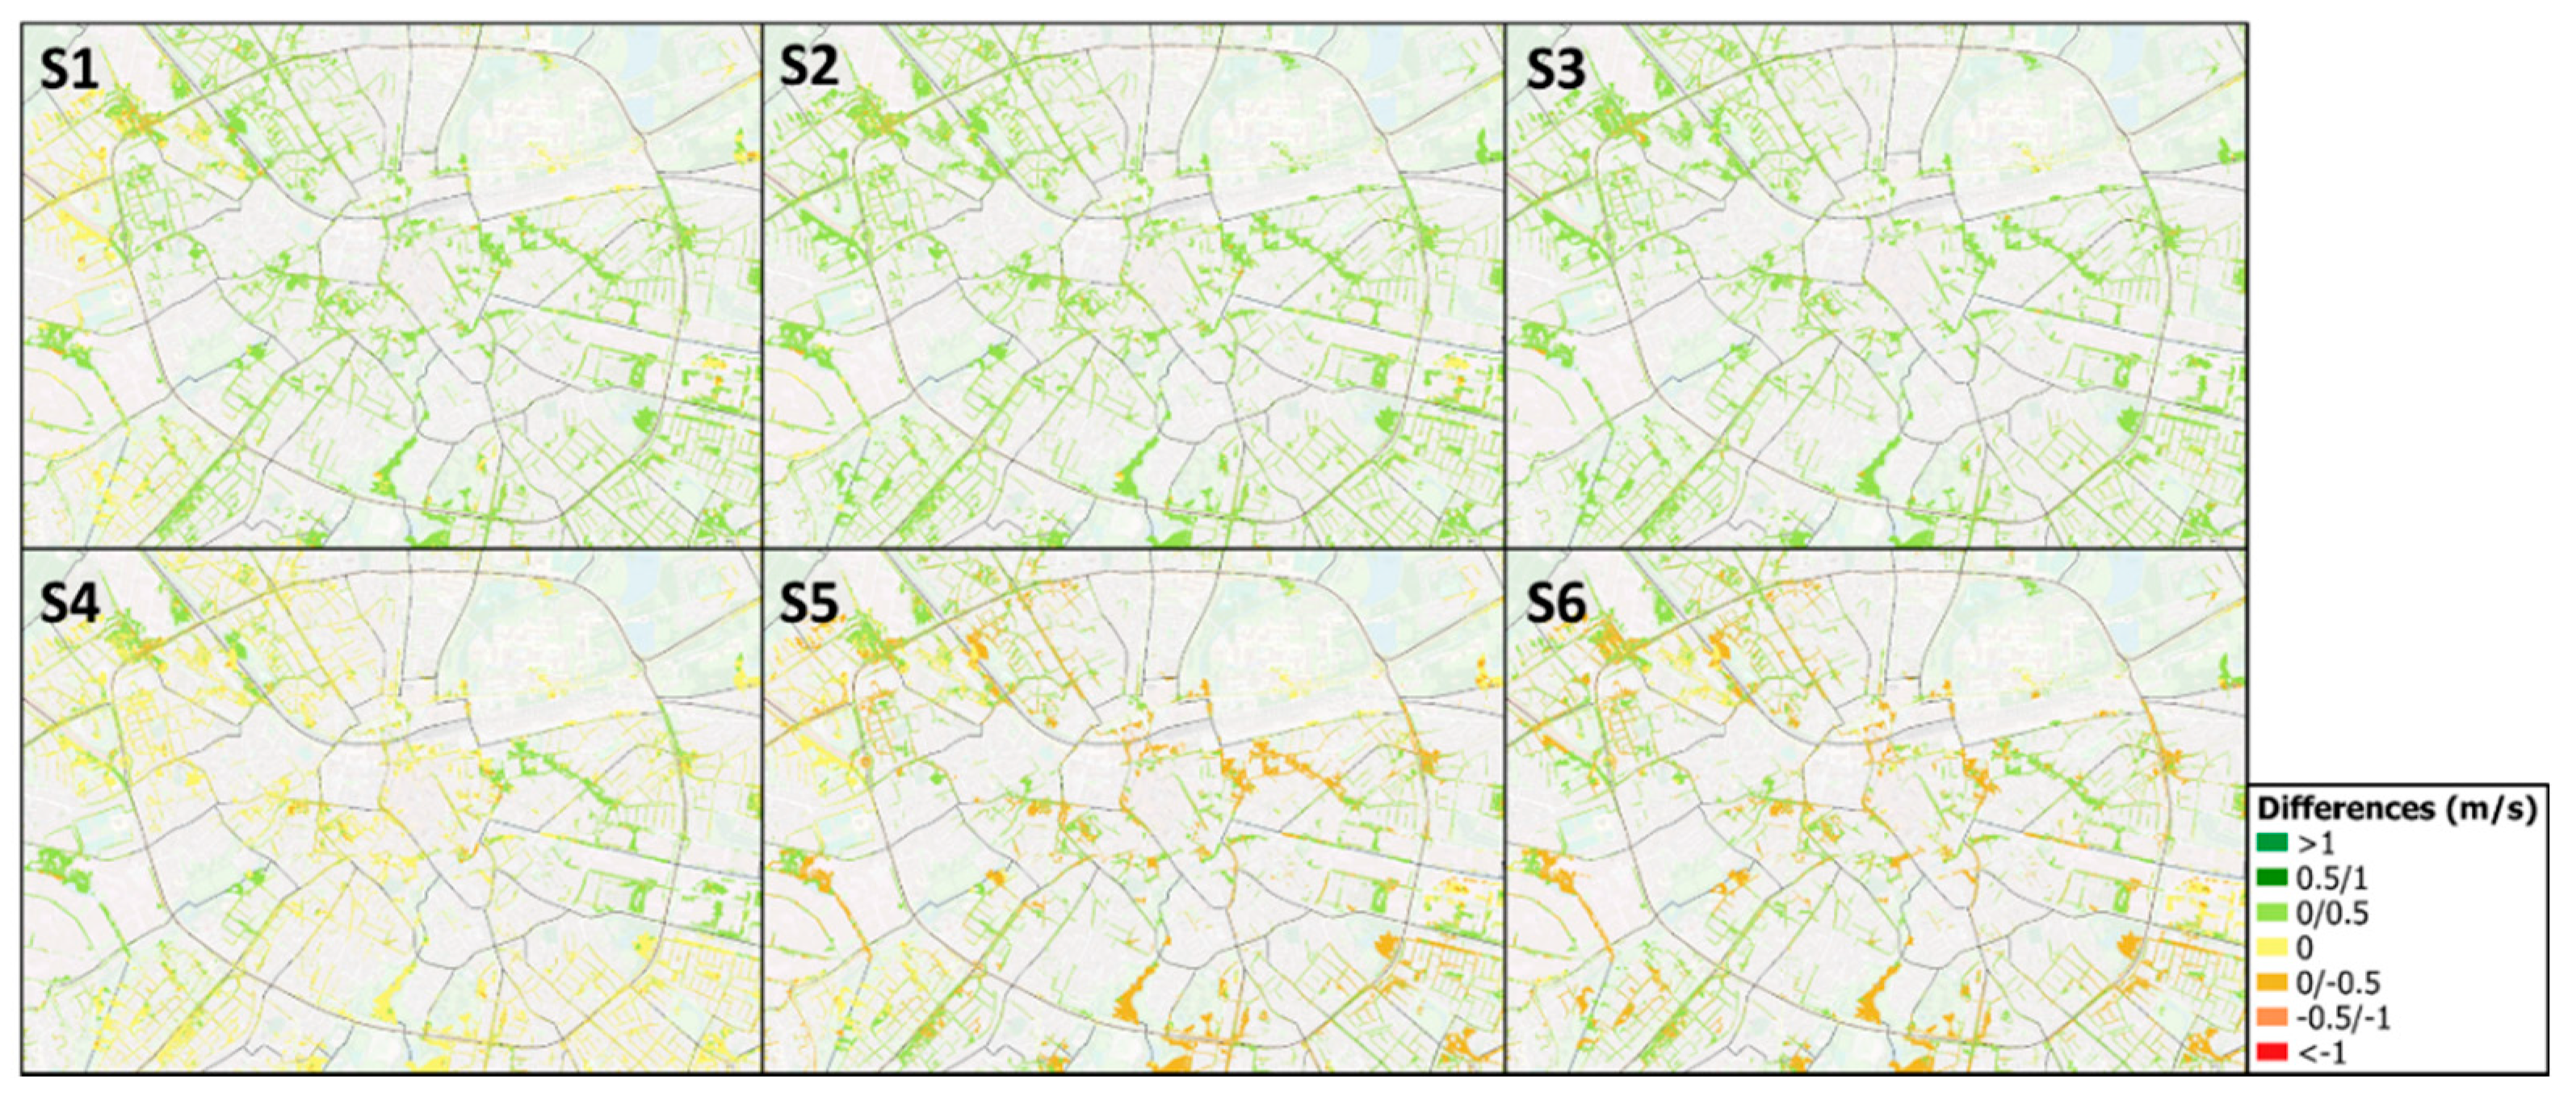
Table 6 presents the flood velocities in selected neighborhoods. Results show that changes in flood velocity relative to baseline are negligible for all NBS scenarios. However, analyses of the flood velocity differences at the local scale show that these differences can be significant (
Figure 11). Relative to baseline, significant differences in flood velocity in specific neighborhoods are observed for scenarios S1, S2 and S3. Considering that several studies identified both flood depth and velocity as indicators of the flood intensity [
43], and consequently the flood damage, the observed decrease in flood velocity can be important in flood mitigation.
5. Conclusions
Risks due to natural hazards such as floods cause impacts on different sectors of society. These risks are expected to increase given the projected changes in population growth and urbanization. NBS have emerged as effective means to respond to such challenges. This study presents an assessment of the effectiveness of different NBS solutions, namely green car parking, green roofs and water storage on streets, on flood parameters reduction, such as flooded area, flood depth and flood velocity, applied to the city of Eindhoven in The Netherlands. A numerical model was applied and six NBS scenarios were analyzed for different rainfall events (5, 10 and 100 years return periods), and compared to the baseline scenario.
Overall, the assessed NBS show good effectiveness in reducing the flooded area, flood depth and flood velocity. Though, for flood velocity, the differences relative to baseline are small at the neighborhood scale. Additionally, for water storage scenarios, flood depth and velocity may increase in some neighborhoods.
Differences in NBS efficiency on flood mitigation are dependent on the NBS surface area, location and type. Larger NBS surface areas imply larger reductions in flooded area and water depth. For the green car parking scenarios, the flooded area reduction is proportional to the increase in NBS surface area. Location can also influence NBS efficiency, results show that for water storage scenarios the distribution across larger residential areas leads to a larger decrease in flooded area. Regarding the NBS type, findings indicate that water storage is more efficient than the green car parking and green roof scenarios, as it leads to larger reductions in flood area and depth, especially for medium and long-term rainfall events. Moreover, it presents a smaller surface area as compared to the greening of all flat roofs and, hence, lower implementation costs. Additionally, the greening of all flat roofs may be unrealistic, as in some cases these areas are private while in other cases the buildings are not prepared to bear the additional load.
NBS can be effective both for frequent rainfall events as well as for rainfall events with a low probability of occurrence. However, a decrease in effectiveness is expected with the increase in rainfall return period. The exception is the water storage scenario, where larger flood depth reductions can be observed with an increase in rainfall return period.
This study provided an initial analysis for Eindhoven Municipality of the NBS possibilities, in order to reduce pluvial flooding. Additionally, it represents a contribution in assessing the effectiveness of different NBS types when applied in urban areas. The results could be enhanced by improving the numerical model, namely modeling the green pavement in parking spaces and the green roofs. Results could also be improved by integrating a cost–benefit analysis, considering the financial savings due to a reduction in flood damages and other non-monetary benefits.
Author Contributions
Conceptualization, S.C.; Resources, R.P. and L.P.; Writing—Original Draft Preparation, S.C.; Writing—Review & Editing, S.C., R.P., L.P., R.M., J.J.K. and P.R. All authors have read and agreed to the published version of the manuscript.
Funding
This research was funded by the UNaLab project–Urban Nature Labs financed by the European Union’s Horizon 2020 research and innovation program under grant agreement N°730052: Topic: SCC-2-2016-2017: Smart Cities and Communities Nature based solutions. The authors would also want to thank to FCT/MCTES for the financial support to CESAM (UIDB/50017/2020 and UIDP/50017/2020), through national funds.
Data Availability Statement
Restrictions apply to the availability of these data. Data was obtained from Eindhoven Municipality and may be available from the authors with the permission of Eindhoven Municipality.
Acknowledgments
This work is a collaborative research between researchers of University of Aveiro and the Eindhoven Municipality. Therefore, since the beginning municipal stakeholders were involved, helping define the research direction so the results would be more useful for them. Eindhoven Municipality performed the simulations and adapted their model to accommodate the NBS.
Conflicts of Interest
The authors declare no conflict of interest.
References
- Wheater, H.S. Flood hazard and management: A UK perspective. Philos. Trans. R. Soc. A Math. Phys. Eng. Sci. 2006, 364, 2135–2145. [Google Scholar] [CrossRef] [PubMed]
- Miller, J.M.; Hutchins, M. The impacts of urbanization and climate change on urban flooding and urban water quality: A review of the evidence concerning the United Kingdom. J. Hydrol. Reg. Stud. 2017, 12, 345–362. [Google Scholar] [CrossRef]
- Willems, P.; Olsson, J.; Arnbjerg-Nielsen, K.; Beecham, S.; Pathirana, A.; Gregersen, I.B.; Madsen, H.; Nguyen, V.-T.-V. Impacts of Climate Change on Rainfall Extremes and Urban Drainage; IWA Publishing: London, UK, 2012; Volume 11, ISBN 9781780401256. [Google Scholar]
- Hammond, M.J.; Chen, A.S.; Djordjević, S.; Butler, D.; Marck, O. Urban flood impact assessment: A state-of-the-art review. Urban Water J. 2015, 12, 14–29. [Google Scholar] [CrossRef]
- Merz, B.; Thieken, A.H. Flood risk analysis: Concepts and challenges. Osterr. Wasser-und Abfallwirtsch. 2004, 56, 27–34. [Google Scholar]
- Bruijn, K.M.; Klijn, F.; van de Pas, B.; Slager, C.T.J. Flood fatality hazard and flood damage hazard: Combining multiple hazard characteristics into meaningful maps for spatial planning. Nat. Hazards Earth Sys. 2015, 15, 1297–1309. [Google Scholar] [CrossRef]
- Kreibich, H.; Piroth, K.; Seifert, I.; Maiwald, H.; Kunert, U.; Schwarz, J.; Merz, B.; Thieken, A.H. Is flow velocity a significant parameter in flood damage modelling? Nat. Hazards Earth Sys. 2009, 9, 1679–1692. [Google Scholar] [CrossRef]
- Oubennaceur, K.; Chokmani, K.; Nastev, M.; Lhissou, R.; Alem, A.E. Flood risk mapping for direct damage to residential buildings in Quebec, Canada. Int. J. Disaster Risk Reduct. 2019, 33, 44–54. [Google Scholar] [CrossRef]
- Dutta, D.; Herath, S.; Musiake, K. A mathematical model for flood loss estimation. J. Hydrol. 2003, 277, 24–49. [Google Scholar] [CrossRef]
- Wind, H.G.; Nierop, T.M.; de Blois, C.J.; de Kok, J.L. Analysis of flood damages from the 1993 and 1995 Meuse Floods. Water Resour. Res. 1999, 35, 3459–3465. [Google Scholar] [CrossRef]
- Fletcher, T.D.; Shuster, W.; Hunt, W.F.; Ashley, R.; Butler, D.; Arthur, S.; Trowsdale, T.; Barraud, S.; Semadeni-Davies, A.; Bertrand-Krajewski, J.-L.; et al. SUDS, LID, BMPs, WSUD and more—The evolution and application of terminology surrounding urban drainage. Urban Water J. 2015, 12, 525–542. [Google Scholar] [CrossRef]
- European Commission. Towards an EU Research and Innovation Policy Agenda for Nature-Based Solutions & Re-Naturing Cities; Final Report of the Horizon 2020 Expert Group on ‘Nature-Based Solutions and Re-Naturing Cities Directorate-General for Research and Innovation’; European Union: Luxembourg, 2015. [Google Scholar]
- Maes, J.; Jacobs, S. Nature-based solutions for Europe’s sustainable development. Conserv. Lett. 2015, 10, 121–124. [Google Scholar] [CrossRef]
- Eggermont, H.; Balian, E.; Azevedo, J.M.N.; Beumer, V.; Brodin, T.; Claudet, J.; Le Roux, X. Nature-based solutions: New influence for environmental management and research in Europe. GAIA Ecol. Perspect. Sci. Soc. 2015, 24, 243–248. [Google Scholar] [CrossRef]
- Zölch, T.; Henze, L.; Keilholz, P.; Pauleit, S. Regulating urban surface runoff through nature-based solutions—An assessment at the micro-scale. Environ. Res. 2017, 157, 135–144. [Google Scholar] [CrossRef]
- Fiori, A.; Volpi, E. On the effectiveness of LID infrastructures for the attenuation of urban flooding at the catchment scale. Water Resour. Res. 2020, 56, e2020WR027121. [Google Scholar] [CrossRef]
- Huang, Y.; Tian, Z.; Ke, Q.; Liu, J.; Irannezhad, M.; Fan, D.; Hou, M.; Sun, L. Nature-based solutions for urban pluvial flood risk management. WIREs Water 2020, 7, e1421. [Google Scholar] [CrossRef]
- Kabish, N.; Frantzeskaki, N.; Pauleit, S.; Naumann, S.; Davis, M.; Artmann, M.; Haase, D.; Knapp, S.; Korn, H.; Stadler, H.; et al. Nature-based solutions to climate change mitigation and adaptation in urban areas: Perspectives on indicators, knowledge gaps, barriers, and opportunities for action. Ecol. Soc. 2016, 21, 39. [Google Scholar] [CrossRef]
- Lee, J.M.; Hyun, K.H.; Choi, J.S. Analysis of the impact of low impact development on runoff from a new district in Korea. Water Sci. Technol. 2013, 68, 1315–1321. [Google Scholar] [CrossRef]
- Palanisamy, B.; Chui, T.F.M. Rehabilitation of concrete canals in urban catchments using low impact development techniques. J. Hydrol. 2015, 523, 309–319. [Google Scholar] [CrossRef]
- Jackisch, N.; Weiler, M. The hydrologic outcome of a Low Impact Development (LID) site including superposition with streamflow peaks. Urban Water J. 2017, 14, 143–159. [Google Scholar] [CrossRef]
- Dreelin, E.A.; Fowler, L.; Ronald Carroll, C. A test of porous pavement effectiveness on clay soils during natural storm events. Water Res. 2006, 40, 799–805. [Google Scholar] [CrossRef]
- Ahiablame, L.; Shakya, R. Modeling flood reduction effects of low impact development at a watershed scale. J. Environ. Manag. 2016, 171, 81–91. [Google Scholar] [CrossRef]
- Zhang, X.; Guo, X.; Hu, M. Hydrological effect of typical low impact development approaches in a residential district. Nat. Hazards 2016, 80, 389–400. [Google Scholar] [CrossRef]
- Mei, C.; Liu, J.; Wang, H.; Yang, Z.; Ding, X.; Shao, W. Integrated assessments of green infrastructure for flood mitigation to support robust decision-making for sponge city construction in an urbanized watershed. Sci. Total Environ. 2018, 639, 1394–1407. [Google Scholar] [CrossRef] [PubMed]
- Hu, M.; Zhang, X.; Li, Y.; Yang, H.; Tanaka, K. Flood mitigation performance of low impact development technologies under different storms for retrofitting an urbanized area. J. Clean Prod. 2017, 222, 373–380. [Google Scholar] [CrossRef]
- Bae, C.; Lee, D.K. Effects of low-impact development practices for flood events at the catchment scale in a highly developed urban area. Int. J. Disaster Risk Reduct. 2020, 44, 101412. [Google Scholar] [CrossRef]
- Hu, M.; Sayama, T.; Zhang, X.; Tanaka, K.; Takara, K.; Yang, H. Evaluation of low impact development approach for mitigating flood inundation at a watershed scale in China. J. Environ. Manag. 2017, 193, 430–438. [Google Scholar] [CrossRef] [PubMed]
- Lee, J.-M.; Hyun, K.-H.; Choi, J.-S.; Yoon, Y.-J.; Geronimo, F.K.F. Flood reduction analysis on watershed of LID design demonstration district using SWMM5. Desalin. Water Treat. 2012, 38, 255–261. [Google Scholar] [CrossRef]
- Qin, H.P.; Li, Z.X.; Fu, G.T. The effects of low impact development on urban flooding under different rainfall characteristics. J. Environ. Manag. 2013, 129, 577–585. [Google Scholar] [CrossRef]
- Teng, J.; Jakeman, A.J.; Vaze, J.; Croke, B.F.W.; Dutta, D.; Kim, S. Flood inundation modelling: A review of methods, recent advances and uncertainty analysis. Environ. Model. Softw. 2017, 90, 201–216. [Google Scholar] [CrossRef]
- Fernandez-Maldonado, A.M.; Romein, A. The role of organizational capacity and knowledge-based development: The reinvention of Eindhoven. Int. J. Knowl. Based Dev. 2010, 1, 1–2, 79–96. [Google Scholar] [CrossRef]
- Centraal Bureau of Statistiek. 2017. Available online: https://www.cbs.nl/en-gb (accessed on 10 September 2020).
- Sušnik, J.; Strehl, C.; Postmes, L.A.; Vamvakeridou-Lyroudia, L.S.; Savić, D.A.; Kapelan, Z.; Mälzer, H.-J. Assessment of the effectiveness of risk-reduction measure on pluvial flooding and economic loss in Eindhoven, The Netherlands. Procedia Eng. 2014, 70, 1619–1628. [Google Scholar] [CrossRef][Green Version]
- Sušnik, J.; Strehl, C.; Postmes, L.A.; Vamvakeridou-Lyroudia, L.S.; Mälzer, H.-J.; Savić, D.A.; Kapelan, Z. Assessing financial loss due to pluvial flooding and the efficacy of risk-reduction measures in the residential property sector. Water Resour. Res. 2015, 29, 161–179. [Google Scholar] [CrossRef]
- UNaLab Baseline Maps. Available online: https://sites.google.com/view/unalab/baseline-maps/eindhoven (accessed on 9 September 2020).
- Innovyze. Infoworks ICM. 2018. Available online: http://blog.innovyze.com/tag/tutorial/ (accessed on 12 July 2020).
- Bermúdez, M.; Ntegeka, V.; Wolfs, V.; Willems, P. Development and comparison of two fast surrogate models for urban pluvial flood simulations. Water Resour. Manag. 2018, 32, 2801–2815. [Google Scholar] [CrossRef]
- Cheng, X.; Xu, Z.; Yang, H.; Hong, S.; Leitão, J.P. Analysis of Effect of Rainfall Patterns on Urban Flood Process by Coupled Hydrological and Hydrodynamic Modeling. J. Hydrol. Eng. 2020, 25, 04019061. [Google Scholar] [CrossRef]
- Kennisbank Stedelijk Water. Available online: https://www.riool.net/hoe-werkt-de-kennisbank (accessed on 10 June 2017). (In Dutch).
- Van den Hurk, B.; Siegmund, P.; Tank, A.K.; Attema, J.; Bakker, A.; Beersma, J.; Bessembinder, J.; Boers, R.; Brandsma, T.; van den Brink, H.; et al. Climate Change Scenarios for the 21st Century–A Netherlands perspective. Scientific Report WR2014-01; Royal Netherlands Meteoroligal Institute (KNMI): De Bilt, The Netherlands, 2014. [Google Scholar]
- Zhou, Q.; Mikkelsen, P.S.; Halsnaes, K.; Arnbjerg-Nielsen, K. Framework for economic pluvial flooding risk assessment considering climate change effects and adaptation benefits. J. Hydrol. 2012, 414–415, 539–549. [Google Scholar] [CrossRef]
- Aronica, G.T.; Franza, F.; Bates, P.D.; Neals, J.C. Probabilistic evaluation of flood hazard in urban areas using Monte Carlo simulation. Hydrol. Process. 2012, 26, 3962–3972. [Google Scholar] [CrossRef]
Figure 1.
Eindhoven city with its 116 neighborhoods, the 29 in grey constituting the city center.
Figure 1.
Eindhoven city with its 116 neighborhoods, the 29 in grey constituting the city center.
Figure 2.
Layout of the combined sewer–storm network (in orange) and stormwater network (in blue) in Eindhoven.
Figure 2.
Layout of the combined sewer–storm network (in orange) and stormwater network (in blue) in Eindhoven.
Figure 3.
Land use distribution of Eindhoven city.
Figure 3.
Land use distribution of Eindhoven city.
Figure 4.
Examples of NBS that are planned in Eindhoven: (a) Vegetated grid pavement; (b) Green roof; (c) Water storage on the streets (Photos from Luuk Postmes).
Figure 4.
Examples of NBS that are planned in Eindhoven: (a) Vegetated grid pavement; (b) Green roof; (c) Water storage on the streets (Photos from Luuk Postmes).
Figure 5.
NBS percentage distribution for scenarios S1 to S6, in the various neighborhoods of Eindhoven.
Figure 5.
NBS percentage distribution for scenarios S1 to S6, in the various neighborhoods of Eindhoven.
Figure 6.
Schematic model of 1D/2D couple model.
Figure 6.
Schematic model of 1D/2D couple model.
Figure 7.
Distribution of the surface classes used in this study.
Figure 7.
Distribution of the surface classes used in this study.
Figure 8.
Hyetographs for 5, 10 and 100-year return periods.
Figure 8.
Hyetographs for 5, 10 and 100-year return periods.
Figure 9.
Flooded area reduction (%) for NBS scenarios as function of: (a) Return period; (b) Scenario.
Figure 9.
Flooded area reduction (%) for NBS scenarios as function of: (a) Return period; (b) Scenario.
Figure 10.
Flooded area percentage for baseline and NBS scenarios (S1 to S6), under 5, 10 and 100-year return periods: (a) Spatial distribution of flooded area percentage for neighborhoods; (b) Number of neighborhoods by flooded area percentage.
Figure 10.
Flooded area percentage for baseline and NBS scenarios (S1 to S6), under 5, 10 and 100-year return periods: (a) Spatial distribution of flooded area percentage for neighborhoods; (b) Number of neighborhoods by flooded area percentage.
Figure 11.
Differences in flood velocity under NBS scenarios (S1 to S6) relative to baseline for 100-year return period.
Figure 11.
Differences in flood velocity under NBS scenarios (S1 to S6) relative to baseline for 100-year return period.
Table 1.
Overview of the considered nature-based solution (NBS) scenarios.
Table 1.
Overview of the considered nature-based solution (NBS) scenarios.
| Description | Implementation Area (ha) | Scenario |
|---|
| Green parking | Vegetated grid pavement in 50% of open parking spaces | 41 | 1 |
| Vegetated grid pavement in all open parking spaces | 85 | 2 |
| Green roofs | Flat roofs with an area less than 2000 m2 are transformed into green roofs | 393 | 3 |
| 50% of flat roofs in industrial areas are transformed into green roofs | 105 | 4 |
| Water storage on the street | 0.25 m³ water storage per meter of street in green areas | 360 | 5 |
| 0.25 m³ of water storage per meter of street in residential areas | 210 | 6 |
Table 2.
Parameter values used in the 2D surface model, based on the Dutch sewerage guideline [
40].
Table 2.
Parameter values used in the 2D surface model, based on the Dutch sewerage guideline [
40].
| Surface Type | Surface Slope | Runoff Delay
(min−1) | Surface Storage
(mm) | Infiltration Capacity
(mm h−1) |
|---|
| Max | Min |
|---|
| Closed pavement | Sloping | 0.5 | 0.0 | - | - |
| Flat | 0.2 | 0.5 | - | - |
| Open pavement | Sloping | 0.5 | 0.0 | 2.0 | 0.5 |
| Flat | 0.2 | 0.5 | 2.0 | 0.5 |
| Roof | Sloping | 0.5 | 0.0 | - | - |
| Flat | 0.2 | 2.0 | - | - |
| Unpaved pavement | Sloping | 0.5 | 2.0 | 5.0 | 1.0 |
| Flat | 0.2 | 4.0 | 5.0 | 1.0 |
Table 3.
Flooded area (km2) and volume (×105 m3) for baseline and NBS scenarios under 5, 10 and 100-year return periods.
Table 3.
Flooded area (km2) and volume (×105 m3) for baseline and NBS scenarios under 5, 10 and 100-year return periods.
| Scenario | Flooded Area (km2) | Volume (×105 m3) |
|---|
| T = 5 Years | T = 10 Years | T = 100 Years | T = 5 Years | T = 10 Years | T = 100 Years |
|---|
| Base | 2.83 | 5.28 | 8.74 | 1.57 | 3.34 | 7.52 |
| S1 | 2.71 | 5.13 | 8.57 | 1.49 | 3.22 | 7.32 |
| S2 | 2.60 | 5.00 | 8.40 | 1.42 | 3.11 | 7.12 |
| S3 | 1.92 | 4.09 | 7.23 | 0.99 | 2.42 | 5.86 |
| S4 | 2.61 | 4.97 | 8.29 | 1.43 | 3.10 | 7.09 |
| S5 | 2.54 | 4.85 | 8.34 | 1.43 | 3.09 | 7.18 |
| S6 | 2.27 | 4.49 | 7.96 | 1.29 | 2.87 | 6.86 |
Table 4.
Flooded area (%) for baseline and NBS scenarios in selected neighborhoods.
Table 4.
Flooded area (%) for baseline and NBS scenarios in selected neighborhoods.
Return Period
(Years) | Neigh. | Imp.
(%) | Flooded Area (%) | NBS Surface Area (%) |
|---|
| Base | S1 | S2 | S3 | S4 | S5 | S6 | S1 | S2 | S3 | S4 | S5 | S6 |
|---|
| 5 | 112 | 60 | 9.0 | 7.9 | 8.0 | 4.1 | 9.0 | 6.4 | 7.5 | 6 | 6 | 21 | 0 | 6 | 2 |
| 221 | 67 | 3.3 | 2.8 | 2.8 | 2.2 | 3.3 | 1.4 | 1.6 | 5 | 5 | 6 | 0 | 5 | 3 |
| 233 | 56 | 6.7 | 5.8 | 5.9 | 4.8 | 6.6 | 2.3 | 3.0 | 3 | 3 | 4 | 0 | 4 | 4 |
| 236 | 53 | 5.5 | 4.1 | 4.2 | 3.2 | 5.5 | 3.0 | 3.5 | 6 | 6 | 8 | 0 | 7 | 5 |
| 239 | 5 | 0.0 | 0.0 | 0.0 | 0.0 | 0.0 | 0.0 | 0.0 | 0 | 0 | 0 | 0 | 0 | 0 |
| 322 | 51 | 5.6 | 4.9 | 4.9 | 3.7 | 5.4 | 3.8 | 3.7 | 5 | 5 | 5 | 2 | 4 | 3 |
| 615 | 65 | 9.8 | 9.2 | 9.2 | 7.2 | 9.8 | 7.3 | 8.0 | 4 | 4 | 11 | 0 | 7 | 4 |
| 621 | 71 | 7.4 | 7.3 | 7.3 | 3.8 | 4.6 | 6.4 | 6.4 | 1 | 1 | 8 | 7 | 2 | 0 |
| 10 | 112 | 60 | 17.4 | 16.2 | 16.4 | 11.3 | 17.4 | 13.5 | 14.5 | 6 | 6 | 21 | 0 | 6 | 2 |
| 221 | 67 | 9.4 | 8.7 | 8.7 | 8.0 | 9.4 | 6.2 | 6.8 | 5 | 5 | 6 | 0 | 5 | 3 |
| 233 | 56 | 13.4 | 12.5 | 12.6 | 11.9 | 13.4 | 7.8 | 8.8 | 3 | 3 | 4 | 0 | 4 | 4 |
| 236 | 53 | 12.7 | 11.6 | 11.8 | 10.0 | 12.7 | 7.3 | 8.2 | 6 | 6 | 8 | 0 | 7 | 5 |
| 322 | 51 | 10.5 | 10.1 | 10.1 | 8.8 | 10.4 | 8.9 | 9.1 | 5 | 5 | 5 | 2 | 4 | 3 |
| 615 | 65 | 16.0 | 15.5 | 15.5 | 13.1 | 16.1 | 12.8 | 13.6 | 4 | 4 | 11 | 0 | 7 | 4 |
| 621 | 71 | 11.8 | 11.6 | 11.6 | 6.9 | 8.0 | 10.8 | 10.9 | 1 | 1 | 8 | 7 | 2 | 0 |
| 636 | 21 | 0.01 | 0.01 | 0.01 | 0.00 | 0.00 | 0.01 | 0.01 | 0 | 0 | 2 | 2 | 3 | 0 |
| 100 | 112 | 60 | 25.5 | 24.8 | 24.9 | 19.8 | 25.5 | 22.2 | 22.6 | 6 | 6 | 21 | 0 | 6 | 2 |
| 221 | 67 | 16.4 | 15.8 | 15.9 | 15.0 | 16.4 | 13.6 | 14.0 | 5 | 5 | 6 | 0 | 5 | 3 |
| 233 | 56 | 20.6 | 19.9 | 20.0 | 19.6 | 20.6 | 15.7 | 16.8 | 3 | 3 | 4 | 0 | 4 | 4 |
| 236 | 53 | 20.4 | 18.8 | 19.2 | 17.7 | 20.4 | 12.7 | 14.4 | 6 | 6 | 8 | 0 | 7 | 5 |
| 322 | 51 | 15.6 | 14.9 | 15.0 | 13.7 | 15.5 | 13.8 | 14.1 | 5 | 5 | 5 | 2 | 4 | 3 |
| 615 | 65 | 24.3 | 23.6 | 23.7 | 21.2 | 24.3 | 21.5 | 21.9 | 4 | 4 | 11 | 0 | 7 | 4 |
| 621 | 71 | 15.0 | 14.8 | 14.8 | 10.4 | 11.5 | 14.4 | 14.5 | 1 | 1 | 8 | 7 | 2 | 0 |
| 626 | 6 | 0.01 | 0.01 | 0.01 | 0.01 | 0.01 | 0.01 | 0.01 | 0 | 0 | 0 | 0 | 0 | 0 |
Table 5.
Flood depth (cm) for baseline and NBS scenarios in selected neighborhoods.
Table 5.
Flood depth (cm) for baseline and NBS scenarios in selected neighborhoods.
Return Period
(Years) | Neigh. | Flood Depth (cm) | NBS Surface Area (%) |
|---|
| Base | S1 | S2 | S3 | S4 | S5 | S6 | S1 | S2 | S3 | S4 | S5 | S6 |
|---|
| 5 | 112 | 6.8 | 6.8 | 6.8 | 6.4 | 6.8 | 7.3 | 7.1 | 6 | 6 | 21 | 0 | 6 | 2 |
| 212 | 5.4 | 4.3 | 4.4 | 0.0 | 5.2 | 4.7 | 5.4 | 8 | 8 | 13 | 0 | 5 | 2 |
| 221 | 4.5 | 4.3 | 4.4 | 3.9 | 4.5 | 3.8 | 4.1 | 5 | 5 | 5 | 0 | 5 | 3 |
| 233 | 4.2 | 3.9 | 4.0 | 3.9 | 4.2 | 4.0 | 4.0 | 3 | 3 | 4 | 0 | 4 | 4 |
| 236 | 3.7 | 3.9 | 4.0 | 3.7 | 3.7 | 3.6 | 3.8 | 6 | 6 | 8 | 0 | 7 | 5 |
| 322 | 4.4 | 4.3 | 4.4 | 4.1 | 4.4 | 3.9 | 4.2 | 5 | 5 | 5 | 2 | 4 | 3 |
| 615 | 6.5 | 6.3 | 6.3 | 6.0 | 6.4 | 6.3 | 6.2 | 4 | 4 | 11 | 0 | 7 | 4 |
| 621 | 5.2 | 5.1 | 5.2 | 4.9 | 5.0 | 5.3 | 5.4 | 1 | 1 | 8 | 7 | 2 | 0 |
| 10 | 112 | 7.8 | 7.7 | 7.7 | 7.1 | 7.8 | 8.4 | 8.4 | 6 | 6 | 21 | 0 | 6 | 2 |
| 221 | 5.7 | 5.6 | 5.6 | 5.4 | 5.8 | 5.3 | 5.4 | 5 | 5 | 5 | 0 | 5 | 3 |
| 233 | 5.5 | 5.3 | 5.3 | 5.2 | 5.5 | 4.9 | 5.1 | 3 | 3 | 4 | 0 | 4 | 4 |
| 236 | 4.8 | 4.7 | 4.6 | 4.7 | 4.8 | 4.6 | 4.6 | 6 | 6 | 8 | 0 | 7 | 5 |
| 322 | 6.0 | 5.8 | 5.8 | 5.7 | 6.0 | 5.5 | 5.5 | 5 | 5 | 5 | 2 | 4 | 3 |
| 615 | 7.2 | 7.0 | 7.0 | 6.8 | 7.2 | 7.2 | 7.2 | 4 | 4 | 11 | 0 | 7 | 4 |
| 621 | 6.0 | 6.0 | 5.9 | 5.2 | 5.3 | 6.0 | 6.0 | 1 | 1 | 8 | 7 | 2 | 0 |
| 100 | 112 | 10.8 | 10.5 | 10.5 | 9.7 | 10.8 | 11.4 | 11.5 | 6 | 6 | 21 | 0 | 6 | 2 |
| 221 | 7.5 | 7.2 | 7.3 | 7.0 | 7.5 | 7.0 | 7.3 | 5 | 5 | 5 | 0 | 5 | 3 |
| 233 | 7.7 | 7.5 | 7.5 | 7.3 | 7.7 | 6.8 | 7.7 | 3 | 3 | 4 | 0 | 4 | 4 |
| 236 | 6.4 | 6.4 | 6.4 | 6.2 | 6.4 | 6.4 | 6.3 | 6 | 6 | 8 | 0 | 7 | 5 |
| 322 | 8.5 | 8.4 | 8.3 | 8.3 | 8.5 | 8.5 | 8.3 | 5 | 5 | 5 | 2 | 4 | 3 |
| 615 | 9.9 | 9.7 | 9.7 | 9.1 | 9.9 | 10.0 | 9.9 | 4 | 4 | 11 | 0 | 7 | 4 |
| 621 | 8.9 | 8.8 | 8.8 | 6.9 | 7.4 | 8.8 | 8.7 | 1 | 1 | 8 | 7 | 2 | 0 |
Table 6.
Flood velocity (m/s) for baseline and NBS scenarios in selected neighborhoods.
Table 6.
Flood velocity (m/s) for baseline and NBS scenarios in selected neighborhoods.
| Return Period (Years) | Neigh. | Flood Velocity (m/s) | NBS Surface Area (%) |
|---|
| Base | S1 | S2 | S3 | S4 | S5 | S6 | S1 | S2 | S3 | S4 | S5 | S6 |
|---|
| 5 | 112 | 0.15 | 0.15 | 0.15 | 0.16 | 0.15 | 0.16 | 0.15 | 6 | 6 | 21 | 0 | 6 | 2 |
| 233 | 0.12 | 0.12 | 0.12 | 0.12 | 0.12 | 0.12 | 0.12 | 3 | 3 | 4 | 0 | 4 | 4 |
| 236 | 0.11 | 0.12 | 0.12 | 0.11 | 0.11 | 0.11 | 0.12 | 6 | 6 | 8 | 0 | 7 | 5 |
| 615 | 0.14 | 0.14 | 0.14 | 0.14 | 0.14 | 0.14 | 0.14 | 4 | 4 | 11 | 0 | 7 | 4 |
| 621 | 0.13 | 0.13 | 0.13 | 0.12 | 0.12 | 0.13 | 0.13 | 1 | 1 | 8 | 7 | 2 | 0 |
| 10 | 112 | 0.15 | 0.15 | 0.15 | 0.15 | 0.15 | 0.16 | 0.16 | 6 | 6 | 21 | 0 | 6 | 2 |
| 233 | 0.14 | 0.14 | 0.14 | 0.13 | 0.14 | 0.14 | 0.14 | 3 | 3 | 4 | 0 | 4 | 4 |
| 236 | 0.14 | 0.14 | 0.13 | 0.14 | 0.14 | 0.13 | 0.13 | 6 | 6 | 8 | 0 | 7 | 5 |
| 615 | 0.14 | 0.14 | 0.14 | 0.14 | 0.14 | 0.15 | 0.15 | 4 | 4 | 11 | 0 | 7 | 4 |
| 621 | 0.15 | 0.15 | 0.15 | 0.13 | 0.14 | 0.15 | 0.14 | 1 | 1 | 8 | 7 | 2 | 0 |
| 100 | 112 | 0.16 | 0.15 | 0.16 | 0.15 | 0.16 | 0.16 | 0.16 | 6 | 6 | 21 | 0 | 6 | 2 |
| 233 | 0.17 | 0.16 | 0.16 | 0.16 | 0.17 | 0.15 | 0.17 | 3 | 3 | 4 | 0 | 4 | 4 |
| 236 | 0.14 | 0.14 | 0.14 | 0.14 | 0.14 | 0.16 | 0.15 | 6 | 6 | 8 | 0 | 7 | 5 |
| 615 | 0.15 | 0.15 | 0.15 | 0.14 | 0.15 | 0.15 | 0.15 | 4 | 4 | 11 | 0 | 7 | 4 |
| 621 | 0.16 | 0.16 | 0.16 | 0.14 | 0.14 | 0.16 | 0.16 | 1 | 1 | 8 | 7 | 2 | 0 |
| Publisher’s Note: MDPI stays neutral with regard to jurisdictional claims in published maps and institutional affiliations. |
© 2021 by the authors. Licensee MDPI, Basel, Switzerland. This article is an open access article distributed under the terms and conditions of the Creative Commons Attribution (CC BY) license (http://creativecommons.org/licenses/by/4.0/).


 ,
, 


