Article

Design of Ultra-Low-Power Rail-to-Rail Input Common Mode Range Standard-Cell-Based Comparators

1
Dipartimento di Ingegneria Elettrica, Elettronica e Informatica (DIEEI), Università degli Studi di Catania, 95123 Catania, Italy
2
Dipartimento di Ingegneria dell’Informazione, Elettronica e Telecomunicazioni (DIET), Università degli Studi di Roma “La Sapienza”, 00184 Rome, Italy
*
Author to whom correspondence should be addressed.
J. Low Power Electron. Appl. 2025, 15(1), 14; https://doi.org/10.3390/jlpea15010014
Submission received: 20 January 2025 / Revised: 4 March 2025 / Accepted: 5 March 2025 / Published: 8 March 2025

Abstract

:
In this paper, a NOR2 standard-cell-based dynamic comparator providing rail-to-rail input common mode range (ICMR) is presented, together with a novel standard-cell oriented design methodology. The proposed topology provides better speed performance and lower power-delay-product than the previously presented standard-cell-based dynamic comparators with rail-to-rail ICMR features. The NOR2 topology, which is also better than the complementary NAND2-based topology previously presented by the authors, is even able to guarantee improvements in the order of 8× –16× higher speed and 7× lower PDP, with respect to the other rail-to-rail ICMR standard-cell-based topologies in the literature. Concerning the standard-cell oriented design methodology, it is focused on the impact of the cell’s strength, which is the only free parameter, on delay, power consumption, ICMR and offset. The circuit performances are demonstrated for supply voltages equal to 600 mV, 300 mV and 150 mV, considering a 45 nm CMOS technology.

1. Introduction

Together with the introduction of smart devices, from industrial to health purposes, exploiting the Internet of Things (IoT) [1,2,3,4,5], the development of ultra-low-power consumption (ULP) integrated systems [6,7] has become increasingly critical to the realization of such devices.
Almost every kind of smart system relies on electronic circuits like ADCs or LDOs [8,9,10,11], for example, to interface with the environment, exploit sensors, or simply to manage the power. In all these fundamental circuits, the comparator plays a crucial role for their functionalities, speed performances and power consumption.
Since the comparator is an analog building block, its design typically requires a full-custom approach. This means that the schematic and the layout design phases have to be carried out manually, tuning the design parameters iteratively until specifications are satisfied, taking into account not only mismatch variations but also process, supply voltage and temperature (PVT) variations. Comparing the required design time and effort of the full-custom approach to the typical semi-automatic digital design flow, it becomes evident that the digital one offers lower design time and effort, even with high-complexity designs.
Recently, the possibility to exploit the standard-cell approach, and thus the semi-automatic digital design flow, to dramatically reduce the overall analog circuit design effort has been explored in [12,13,14,15,16,17]. Moreover, together with the use of standard-cells, investigation is ongoing regarding the hard scaling of supply voltage down to the deep sub-threshold region (150–300 mV) and power consumption down to the pW-range. The same trend has been exploited not only for comparators but also to realize operational transconductance amplifiers, based on standard-cells, with minimum design effort and reduced power consumption.
Actually, the state-of-the-art offers several standard cell-based dynamic voltage comparator (SCB-DVC) topologies [18,19,20,21,22]. It is possible to classify the topologies depending on the offered input common mode range (ICMR): rail-to-rail ICMR and non-rail-to-rail ICMR topologies [23].
Historically, the first SCB-DVC was the non-rail-to-rail ICMR topology proposed in [18] in 2014, whose ICMR spans from V D D / 2 to V D D . In 2018, a topology with complementary ICMR with respect to [18], ranging from 0 to V D D / 2 , exploiting 3-input NOR gates, has been proposed in [19], and combining it with the one in [18], the first rail-to-rail topology was also presented in [19].
The solutions in [18,19] exploit only NAND, NOR and NOT standard-cells. Following the same idea in [19], a topology based on OAI (Or–And invert) and AOI (And–Or invert) standard-cells has been proposed, in 2020, in [20].
It is worth noting that the mentioned topologies need almost two or three different types of gate for each comparator, and, in 2024, a rail-to-rail topology, based on 2-input NAND gates only (subsequently referred to as NAND2), was proposed in [22]. Actually, this is the best rail-to-rail ICMR topology in the state-of-the-art, in terms of power consumption and delay.
In this work, starting from the NAND2 topology, we introduce a novel topology made up of only 2-input NOR gates and referred to as NOR2 topology in the following. Despite being complementary to the NAND2 topology proposed by the authors in [22], the NOR2 topology has neither been discussed nor presented previously. This paper presents, for the first time, an analysis and the derived design rules in term of cell strength for both the NOR2 and the NAND2 topologies. An optimized design for minimum offset and another one for minimum power consumption are also presented for the first time in the manuscript, referring to both the NOR2 and the NAND2 topologies. The proposed NOR2 topology exhibits better performance in terms of both speed and power-delay product with respect to the previously presented NAND2 topology. The following considerations are supported by simulations regarding clock-to-output delay, power consumption, ICMR and offset by means of Monte Carlo analysis, referring to a 45 nm CMOS technology. All the simulations are carried out at three different supply voltages, respectively—600 mV, 300 mV and 150 mV—to demonstrate the independence with respect to supply voltage scaling.
The paper is structured as follows. The NAND2 SCB-DVC and the proposed NOR2 working principles are first described in Section 2. In Section 3, the dependency of delay, power consumption, ICMR and offset with respect to the only editable cell design parameter will be highlighted by means of simulations. In Section 4, the NAND2 and the NOR2 topologies are compared in terms of overall performance through suitable figures-of-merit (FoMs). Concluding remarks are finally drawn in Section 5.

2. Rail-to-Rail ICMR Standard Cell-Based DVCs

In the following subsection, a simple explanation of the working principle of the NAND2 topology and of the proposed NOR2 one is provided, exploiting a simple gate-level approach.

2.1. NAND2 SCB-DVC

The gate-level structure of the NAND2 is reported in Figure 1 [22]. The architecture is multistage and is made up by 2-input NAND gates only. It is possible to recognize the first stage, also referred to as the pre-amplifier stage, with the analog input signals V I N P and V I N M , connected to the A inputs of the gates S 1 , 2 , and the clock signal, C L K , connected to their B inputs. The pre-amplifier cell’s strength is referred to as X p r e .
The pre-amplifier outputs, V X and V Y , also named intermediate nodes, are connected to the intermediate stage, consisting of two back-to-back NAND gates, S 3 , 4 . The output of S 3 is fed back to the A input of S 4 , and vice-versa, to realize a positive, or regenerative, feedback loop. The remaining B inputs of each gate are connected to the clock signal. The intermediate stage cell’s strength is reported as X i n t .
The intermediate nodes directly drive the well-known RS bi-stable stage, whose function is to sample and retain, at the output nodes, V O P and V O N , the information extracted from the analog input differential signal, V I D = V I N P V I N M , amplified by the first stage and regenerated by the intermediate stage. The output bi-stable cell’s strength is reported as X b i .
The working principle can be explained considering that, in general, a DVC is a clocked circuit and thus its operations are related to the clock signal. In particular, during the clock period it is possible to recognize two working phases: pre-charge, or reset phase, during the first half clock period, and the evaluation phase, during the second half clock period. In the reset phase ( C L K = 0 ), the parasitic capacitances at the inner nodes, V X and V Y , are tied to V D D by gates S 1 4 , forcing the output RS bi-stable stage into storage condition (the RS bi-stable stage is in storage condition when its inputs are both tied to V D D ). During this phase, as the name suggests, the charge at the inner node capacitances is restored from the previous comparison in which one of the two nodes has been tied to V D D and the other to 0.
When a rising edge on the clock signal occurs, the circuit enters in evaluation phase ( C L K = V D D ). In this phase, the gates S 1 4 can be seen as simple inverters where the threshold voltage is slightly higher than V D D / 2 (i.e., the threshold voltage of a symmetrical inverter). Indeed, the Pull-Down-Network of the NAND has two series transistors, which makes it weaker than the Pull-Up-Network.
In an analog context, the two inverters can be assumed as a class AB differential amplifier. Thus, it is straightforward to observe that S 1 , 2 implement a differential amplification stage, biased by the input common mode voltage, V I C M .
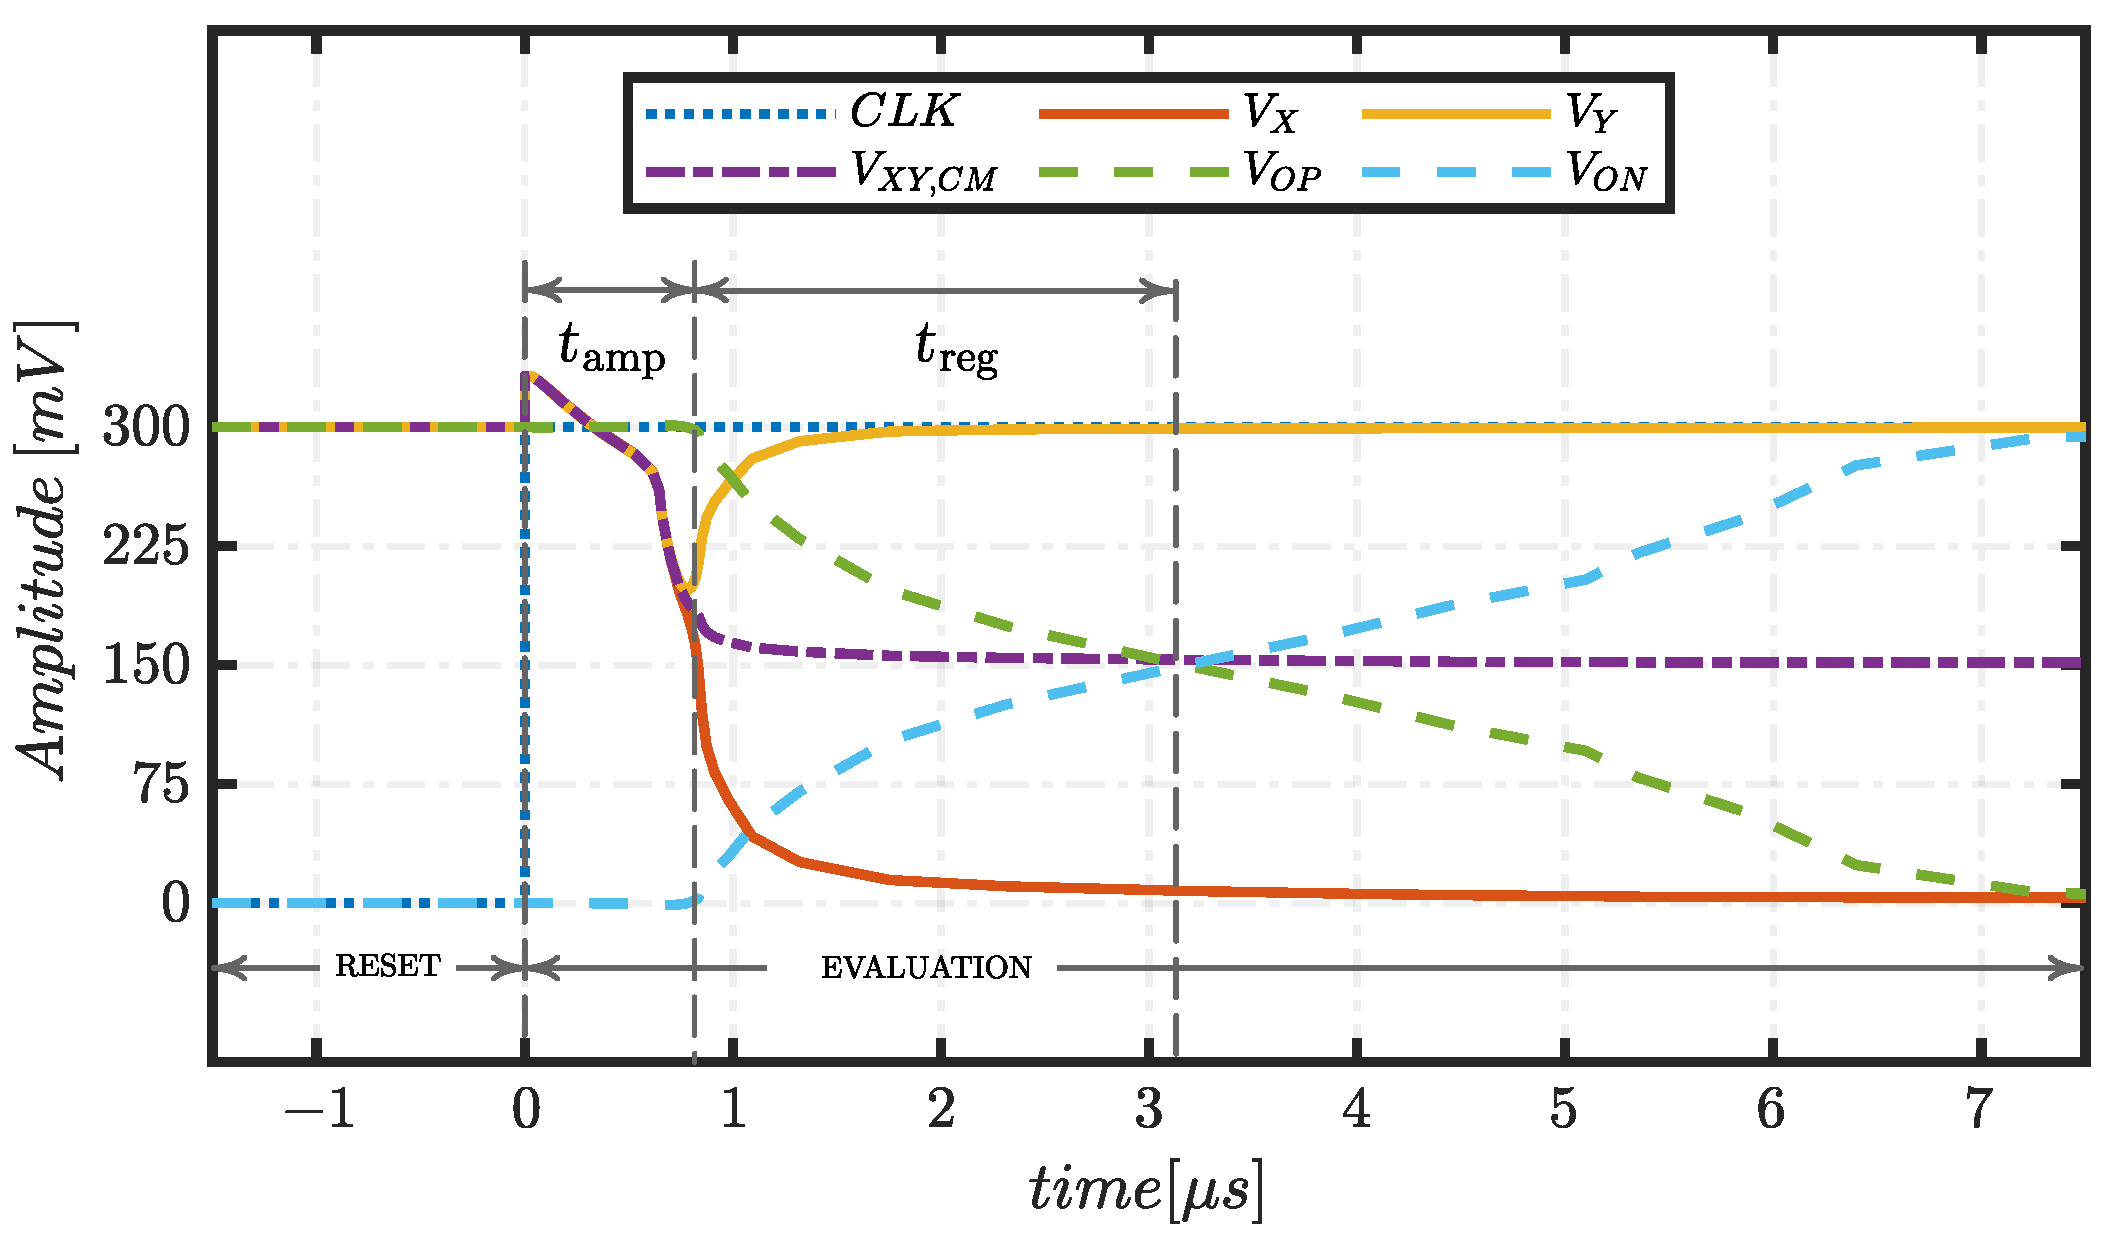
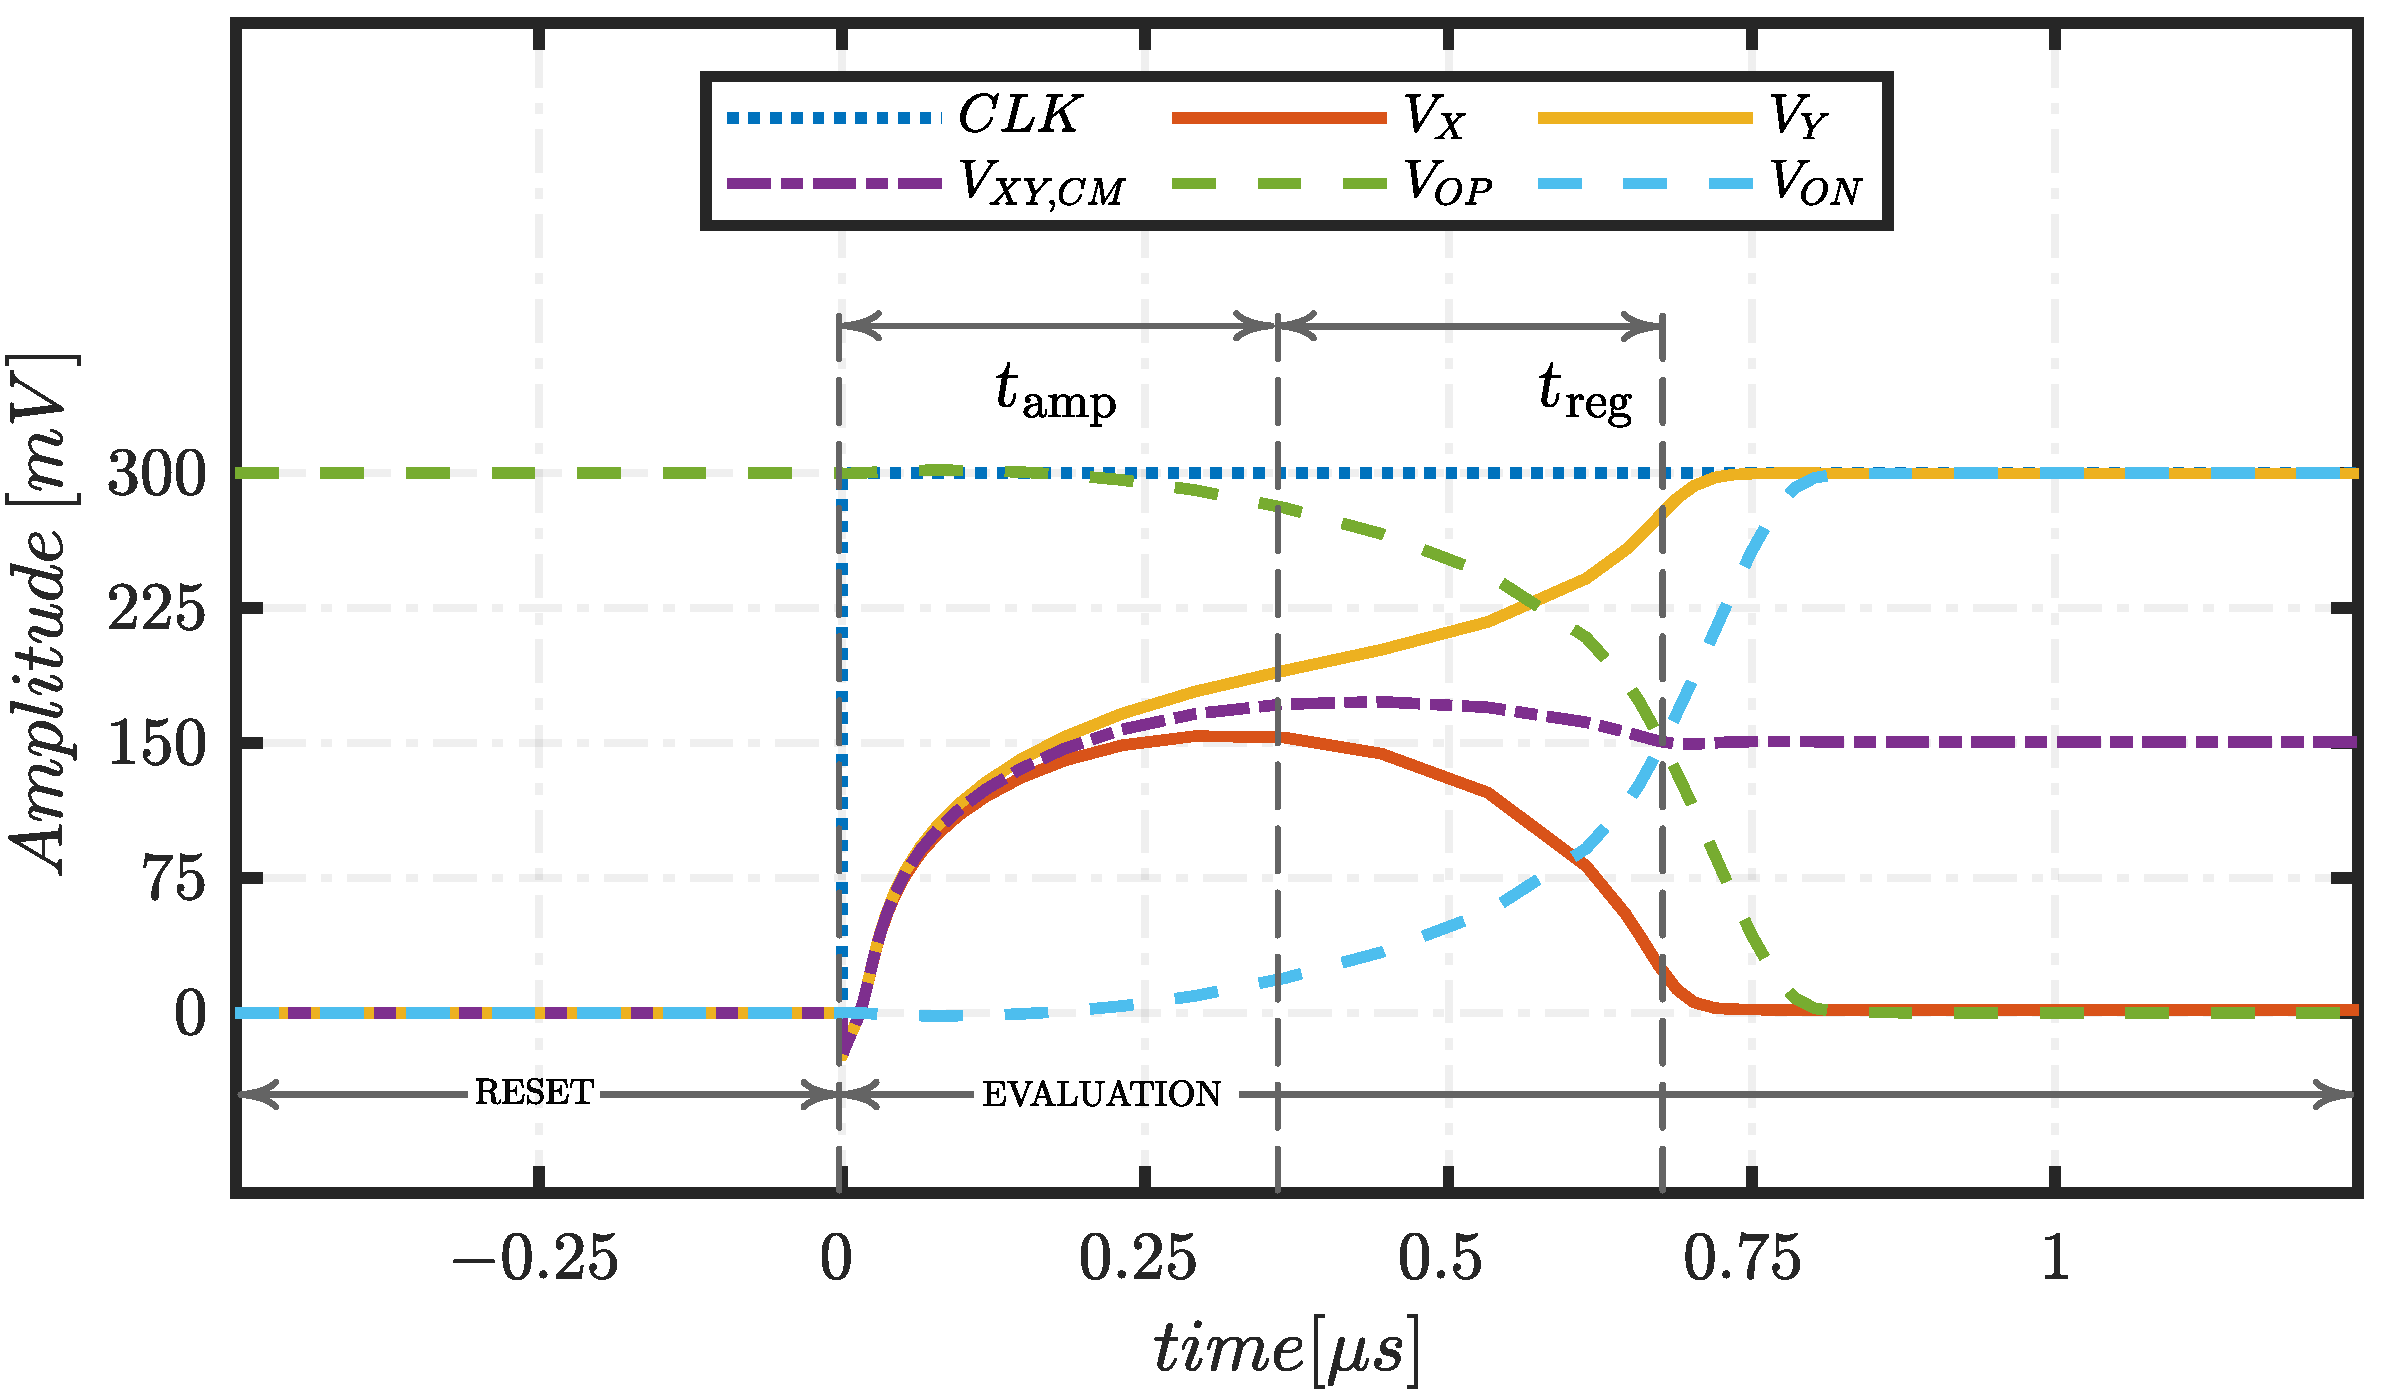
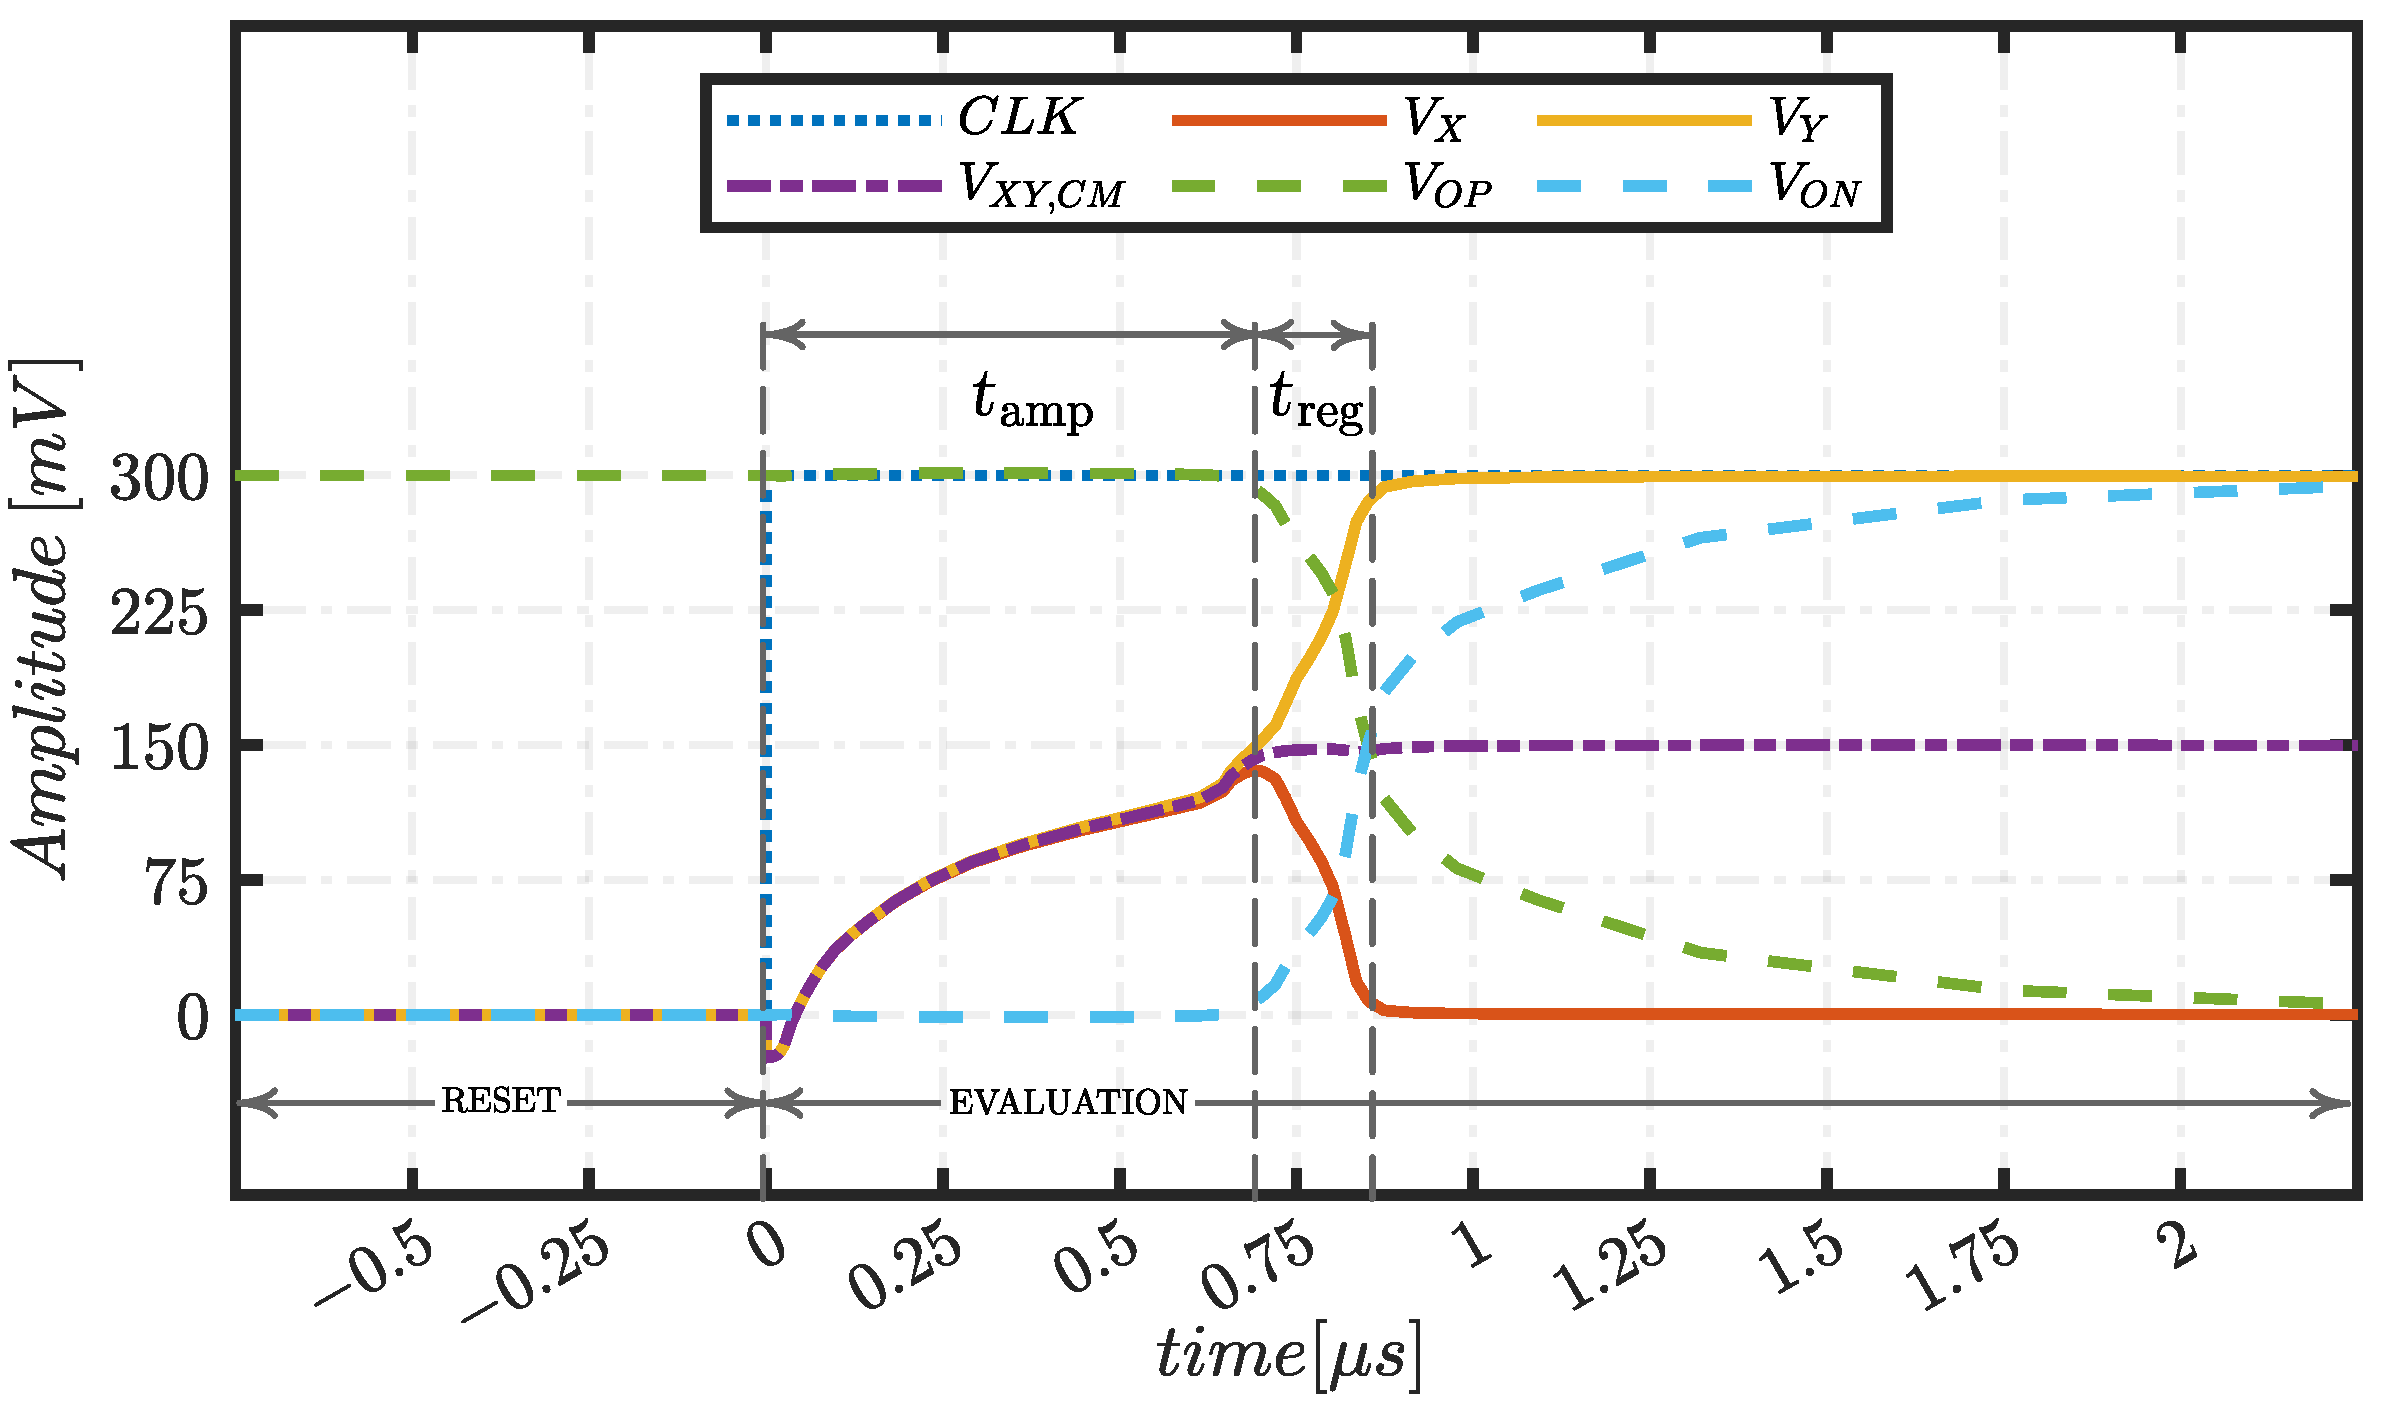
The pre-amplifier stage amplifies the input differential signal, V I D , developing a differential voltage, V X Y , at the inner nodes. At the same time, it is responsible for the inner common mode voltage, V X Y , C M , falling from V D D to an inverted version of the V I C M , after a certain amount of time, t a m p . After t a m p , the intermediate stage starts regenerating V X Y in a period named t r e g , to correctly drive the output stage. Finally, the RS bi-stable allows one to achieve the rail-to-rail output and the retention of the comparator decision during the successive reset phase.
In Figure 2, Figure 3 and Figure 4, examples of the described voltage waveforms on each node are plotted. The examples consider V D D equal to 300 mV, the input differential signal, V I D , equal to 10 mV and the input common mode voltage, V I C M , equal to V D D / 4 , V D D / 2 and 3 V D D / 4 , respectively. The three different values for V I C M are considered in order to show the different behavior of V X Y , C M with respect to V I C M , according to the above description.

2.2. NOR2 Proposed SCB-DVC

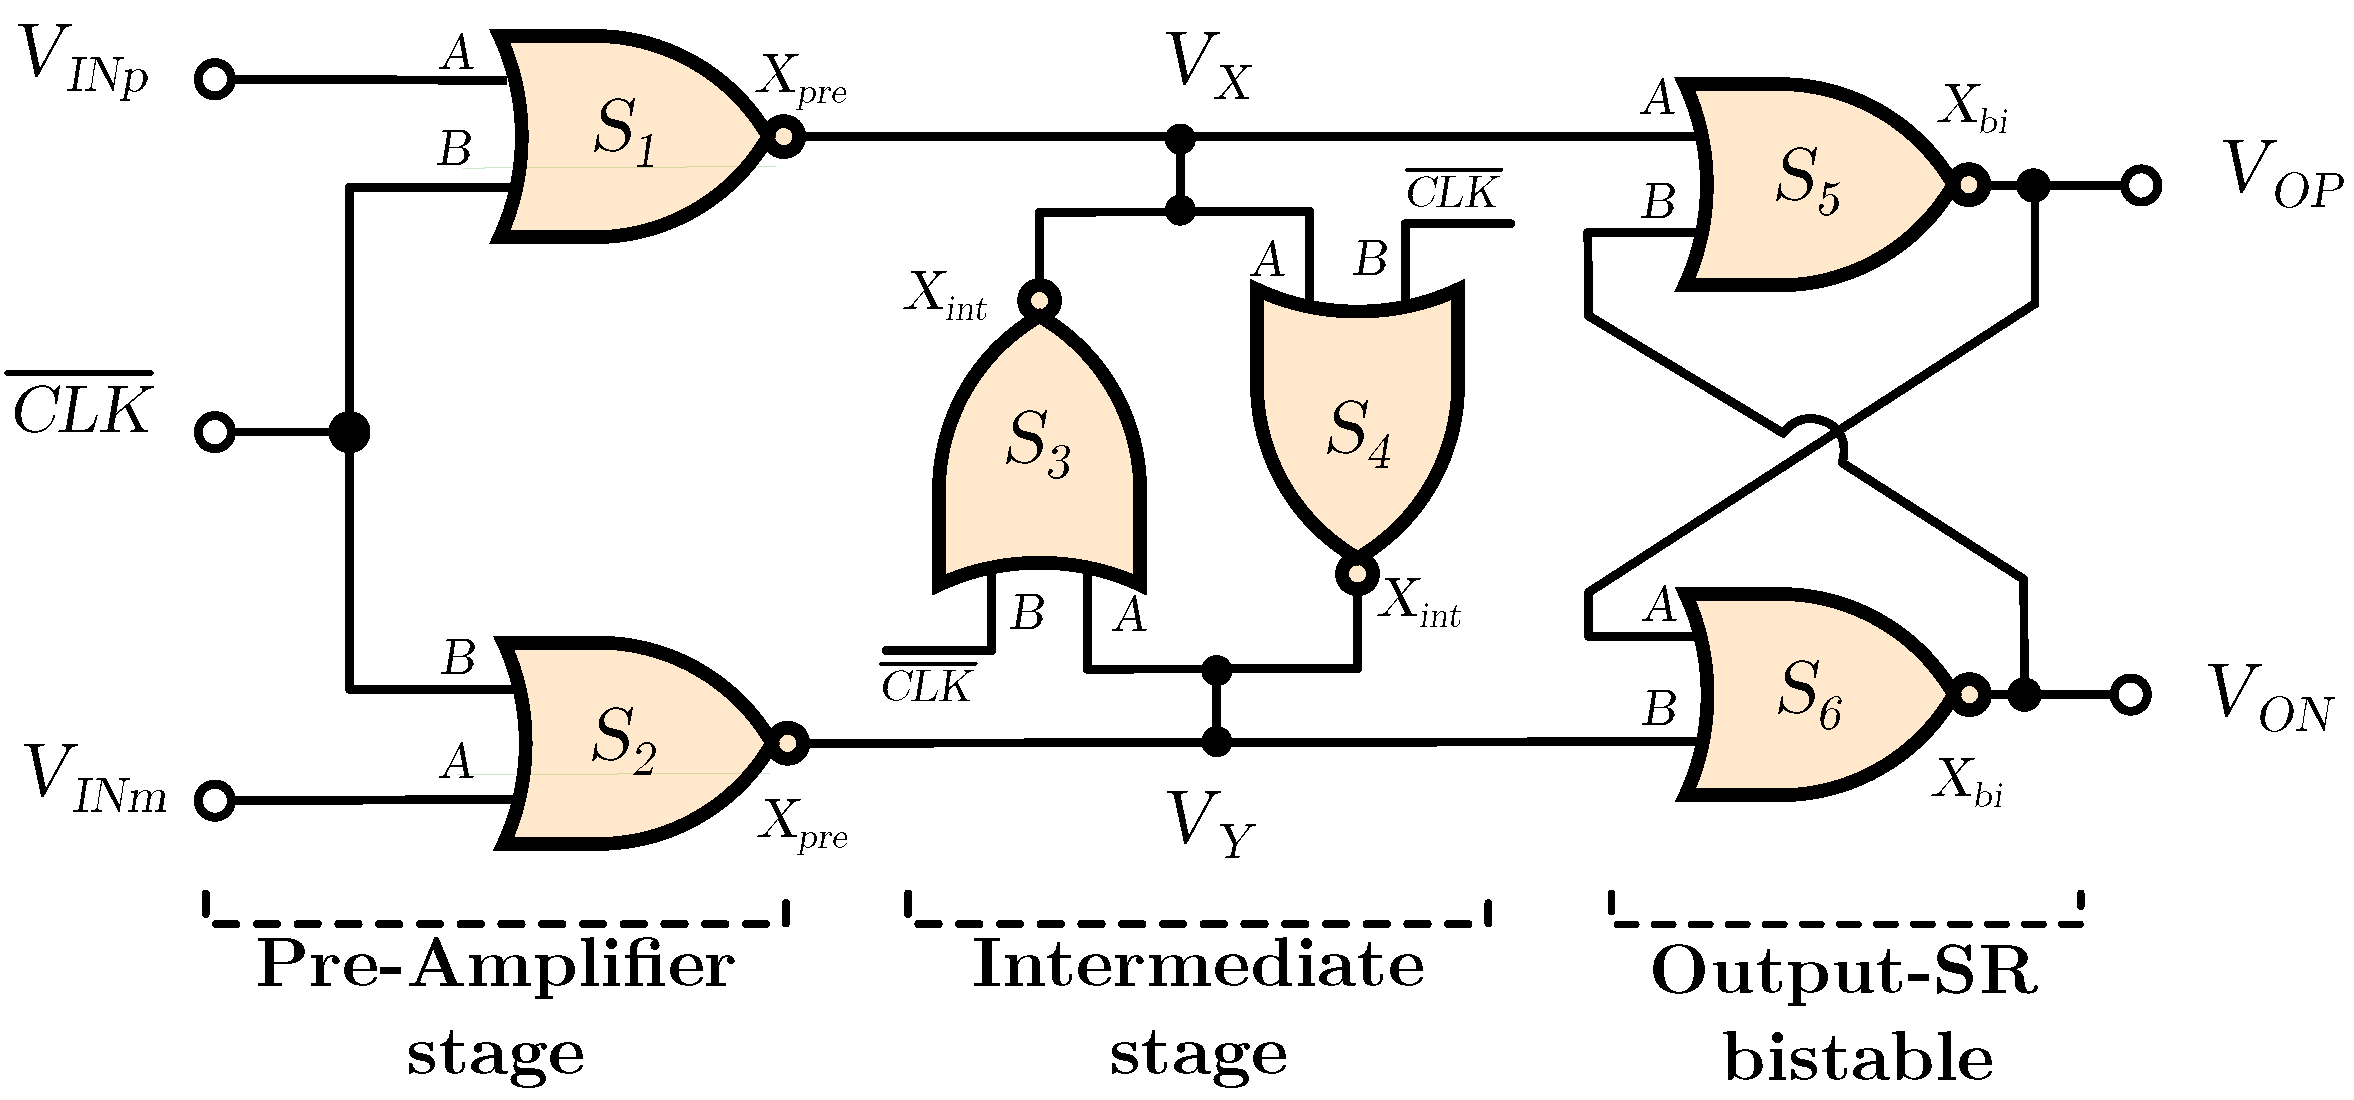
The gate-level structure of the proposed NOR2 topology is reported in Figure 5. It exhibits a multistage architecture and is made up of 2-input NOR gates only. It is again possible to recognize the first pre-amplifier stage, with the analog input signals V I N P and V I N M , connected to the A inputs of the gates S 1 , 2 , and the inverted clock signal, C L K ¯ , connected to their B inputs. The pre-amplifier outputs, V X and V Y , are connected to the intermediate stage, consisting of two back-to-back NOR gates, S 3 , 4 . The output of S 3 is fed back to the A input of S 4 , and vice-versa, to realize a positive, or regenerative, feedback loop. The remaining B inputs of each gate are connected to the inverted clock signal. The intermediate nodes directly drive the well-known “SR bi-stable” stage, whose function is to sample and retain, at the output nodes, V O P and V O N , the information extracted from the analog input differential signal, V I D , amplified by the first stage and regenerated by the intermediate stage, as in the NAND2. The strength of the pre-amplifier stage, intermediate stage and the output bi-stable stage cells are indicated as X p r e , X i n t and X b i , respectively.
The working principle can be explained using the same considerations previously done for the NAND2 topology. During the reset phase ( C L K ¯ = V D D ), the parasitic capacitances at the inner nodes, V X and V Y , are tied to 0 by gates S 1 4 , forcing the output SR bi-stable into storage condition (the SR bi-stable is in storage condition when its inputs are both 0). During this phase, the charge at the inner nodes capacitances is restored from the previous comparison in which one of the two nodes has been tied to V D D and the other to 0. When a falling edge on the clock signal occurs, the circuit enters an evaluation phase ( C L K ¯ = 0 ). In this phase, the gates S 1 4 can be seen as simple inverters where the threshold voltage is slightly lower than V D D / 2 (i.e., the threshold voltage of a symmetrical inverter). Indeed, the Pull-Up-Network of the NOR has two series transistors, which makes it weaker than the Pull-Down-Network.
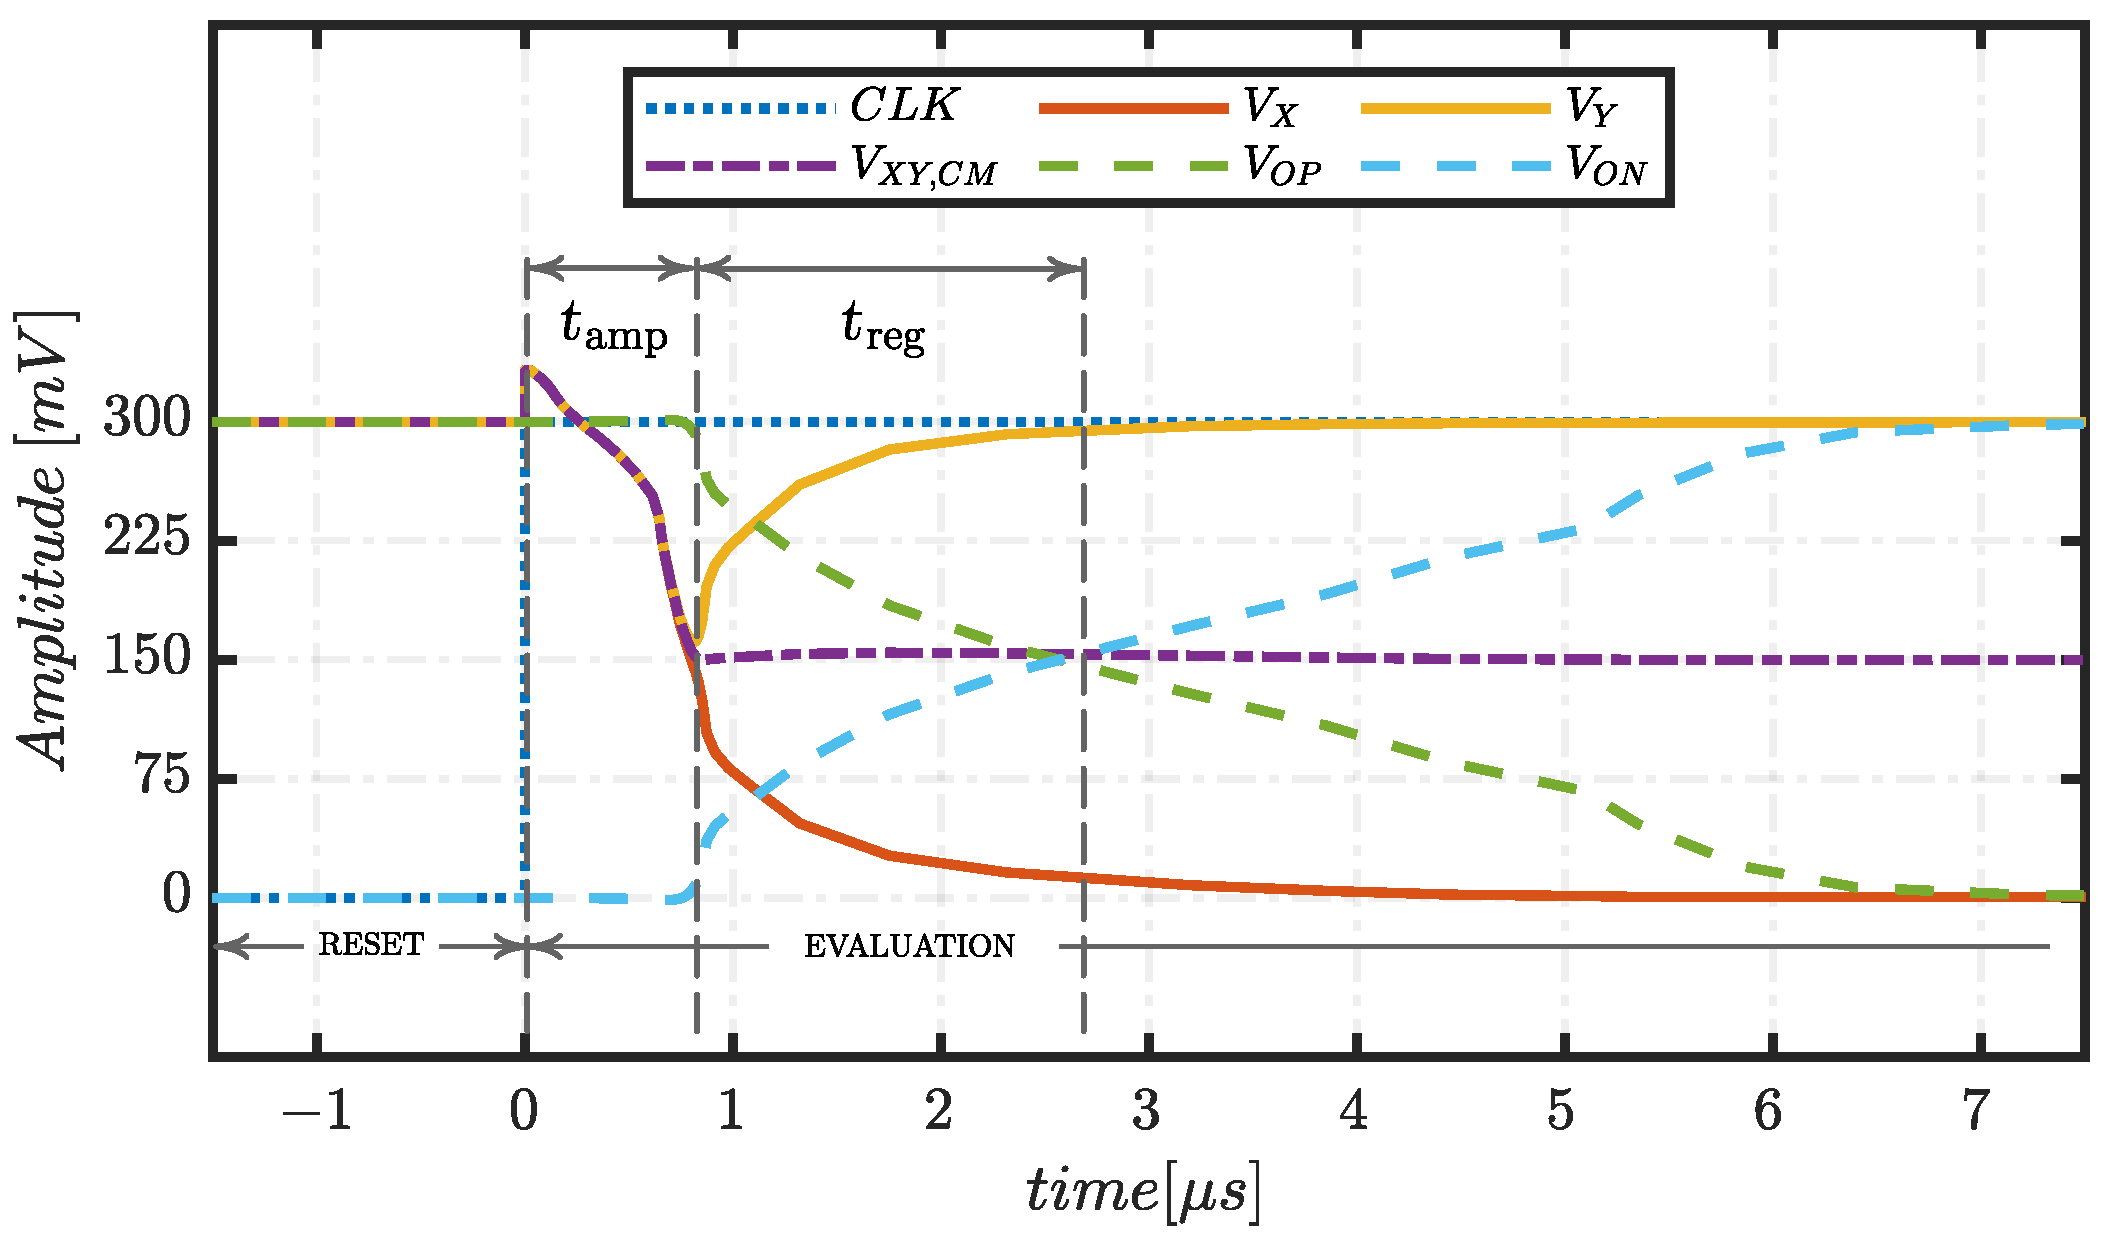
As in the NAND2, S 1 , 2 act as a differential amplification stage, biased by the input common mode voltage, V I C M . The first stage amplifies the input differential signal, V I D , developing a differential voltage, V X Y , at the inner nodes. At the same time, it is responsible for the inner common mode voltage, V X Y , C M , rising from 0 to an inverted version of the V I C M , with respect to the threshold V D D / 2 , after a time, t a m p . After t a m p , the intermediate stage starts regenerating V X Y in a time named t r e g to properly drive the output stage. Finally, the SR bi-stable allows one to achieve the rail-to-rail output and the retention of the comparator decision during the successive reset phase, as for the NAND2.
Examples of the described voltage waveforms are plotted in Figure 6, Figure 7 and Figure 8. The examples consider V D D equal to 300 mV, the input differential signal, V I D , equal to 10 mV and the input common mode voltage, V I C M , equal to V D D / 4 , V D D / 2 and 3 V D D / 4 , respectively. The different V I C M values for V I C M are considered in order to show the different behavior of V X Y , C M with respect to V I C M , according to the previous description.

3. Standard-Cell Oriented Design

When designing a comparator, the typical requirements of the application are delay (or speed), power consumption, offset, ICMR and area occupation. In general, if the design approach is full-custom, it is possible to size each transistor to meet the requirements. On the other hand, if a standard-cell approach is used, it is not possible to access the transistor level, and thus the degrees of freedom are strongly reduced. In fact, referring to a standard-cell approach, the only parameter that can be set by the designer is the strength of the cell, which represents the multiplicity of the cell’s transistors width with respect to the minimum-sized cell (referred to as strength 1, or X 1 ). Thus, the cell’s area occupation is directly proportional to its strength.
In this section, the dependence of delay, power consumption, ICMR and offset from the cell’s strength is derived and confirmed by means of simulations using a 45 nm CMOS technology. The analysis has been carried out, with 600 mV, 300 mV and 150 mV supply voltage and common mode input voltage, V I C M , equal to V D D / 2 . For both the NAND2 and NOR2 topologies, a minimum-sized output bi-stable stage ( X b i = X 1 ), loaded by minimum-sized NOR gates (i.e., about 0.6 fF load capacitance at each output node) is always considered. Using minimum-sized gates for the output stage always represents the optimum design condition. The pre-amplifier and intermediate stage cell’s strength, named X p r e and X i n t , respectively, have been varied in the set of values X 1 , X 2 , X 4 , X 6 and X 8 .
Since the same trends were found for each supply voltage, in the following we will consider only the results with 300 mV V D D .

3.1. Delay

Increasing the strength of a gate means enlarging the width of all the transistors of the same quantity. In particular, depending on the X i n t value, two kinds of behavior arise. In Figure 9a and Figure 9b are reported the simulation results for the NAND2 and NOR2, respectively, varying X p r e with fixed X i n t . The same analysis has been carried out by varying X i n t with fixed X p r e , and the results are given in Figure 9c,d. By inspection of the figures, it is apparent that, for X i n t lower than 4, an increase in X p r e determines a proportional increase in the delay, while for X i n t ≥ 4 the delay is almost independent from X p r e . Moreover, the relation between delay and the cell’s strength implies that the speed of the comparator is mainly a topological aspect. This fundamental result, depending on the other application requirements, could allow one to minimize the area, and hence also power consumption, ensuring almost the same speed performances.

3.2. Power Consumption

Since the strength is linearly related to the current capability and the total capacitance introduced by a gate, it is expected that both the static and dynamic power consumption of each gate increases with its strength. Considering that these comparators are composed by a pre-amplifier stage, an intermediate stage and an output stage, each of them may contribute differently to the overall power consumption. However, since the output stage is considered always minimum, only the impact of the pre-amplifier stage and the intermediate stage are investigated.
In particular, the main power consumption contribution is given by the pre-amplifier stage. In fact, when the evaluation phase starts, a fast peak current is driven to the parasitic capacitances at the inner nodes whose charge has been restored in the reset phase, contributing to the dynamic power consumption. During the evaluation phase, in particular, after V X Y is regenerated (see Section 2), one of the two intermediate node voltages, V X or V Y , is tied to 0 and the other one is tied to V D D by the positive feedback given by the intermediate stage. At the same time, since the input voltage is maintained at the pre-amplifier inputs, a static current is always driven to the node that is tied to 0 (i.e., to ground) by the pre-amplifier. Moreover, on the node that has been tied to V D D , another static current, which can be seen as a leakage current, is sunk by the pre-amplifier. In particular, this leakage current contribution is dependent on the input common mode voltage, V I C M , as will be investigated in the subsequent sections.
Hence, a variation in the strength of the pre-amplifier is expected to have a stronger impact on power consumption with respect to a variation in the intermediate stage strength, because the pre-amplifier is responsible for the main dynamic and static current contribution.
Simulation results are shown in Figure 10a and Figure 10b for the NAND2 and NOR2, respectively. Figure 10a, where X p r e is varied for a fixed X i n t , confirms the above discussed increase in power consumption versus X p r e . On the other hand, when X i n t is varied for a fixed X p r e , the increase in power consumption is negligible, as shown in Figure 10c and Figure 10d for the NAND2 and NOR2, respectively, thus confirming the expected impact on power consumption of the pre-amplifier strength versus the intermediate stage strength.

3.3. Input Common Mode Range (ICMR)

The topologies under analysis are capable of offering rail-to-rail ICMR if properly sized, and in this subsection we show how the ICMR varies if different combinations of X p r e and X i n t are considered at 300 mV supply voltage with a minimum differential input signal of 10 mV and 1 kHz clock signal. The ICMR is evaluated as the difference between the maximum and minimum input common mode voltage, V I C M , for which the output of the comparator is still valid (i.e., V O P and V O N are complementary to each other). In Table 1 and Table 2 are reported the input common mode ranges for the NAND2 and NOR2 topologies, respectively, and the combinations of X p r e and X i n t that allow one to obtain rail-to-rail ICMR are highlighted in bold.
It is evident that, for both the topologies, the ICMR is rail-to-rail only if X i n t is greater than 4 and X p r e is smaller than X i n t / 2 ; in the following, this condition will be referred to as the rail-to-rail ICMR condition. If this condition is not guaranteed, when V I C M approaches V D D , or 0, the intermediate stage is not able to regenerate V X Y and then the output bi-stable is forced into storage condition or into the undefined one (i.e., the condition in which the outputs are not complementary at all). In both cases, the output cannot be considered valid. It is worth noting that, under the rail-to-rail ICMR condition, as discussed in Section 3.1, the delay of the comparator is almost independent of the cell’s strength.
In the following, the behavior of the two topologies is analyzed in the evaluation phase referring to both the case in which the rail-to-rail condition is satisfied and the one in which it is not satisfied. The starting point of the evaluation phase has been assumed at time 0 for convenience.
Regarding the NOR2, if the rail-to-rail ICMR condition is not satisfied, the intermediate stage is not able to regenerate the differential voltage, V X Y ; thus, after a short transient, both V X and V Y tend to V D D , if V I C M is 0 (Figure 11a), or to 0 if V I C M is V D D (Figure 11b). This behavior can be easily understood if we observe that the pre-amplifier is composed of two gates working as inverters; thus, V X Y , C M is simply an inverted version of V I C M . In the case when V X Y , C M is V D D , the SR bi-stable is in the undefined condition and its outputs are both tied to 0, and therefore are not complementary at all. When V X Y , C M is 0, the SR bi-stable is in storage mode and its outputs are unvaried with respect to the previous evaluation phase. In both cases, the result of the comparison at the output of the comparator cannot be considered valid.
In Figure 12a and Figure 12b are reported the waveforms of V X and V Y , with V I C M equal to 0 and V D D , respectively, in the case when the rail-to-rail ICMR condition is satisfied. As can be seen, after the evaluation phase starts, there is a time, t a m p , in which both V X and V Y rise together with a small difference, V X Y , and then a time interval, t r e g , in which this small difference is regenerated by the intermediate stage, as introduced in Section 2.
Considering the NAND2, when the rail-to-rail ICMR condition is not satisfied, the intermediate stage does not regenerate V X Y , and, after a short transient, both V X and V Y tend to V D D , if V I C M is 0 (Figure 13a), or to 0 if V I C M is V D D (Figure 13b). The same observation performed for the NOR2 pre-amplifier holds for the NAND2; thus, V X Y , C M is simply the inverted V I C M . In the case when V X Y , C M tends to V D D , the RS bi-stable is in storage mode and its outputs are unvaried with respect to the previous evaluation phase. When V X Y , C M is 0, the RS bi-stable is in the undefined condition and its outputs are both tied to V D D , and are therefore not complementary at all. As for the NOR2, in both cases, the output of the comparator is not valid.
In Figure 14a and Figure 14b, the waveforms of V X and V Y , with V I C M equal to 0 and V D D , respectively, are reported in the case where the rail-to-rail ICMR condition is satisfied. As can be seen, after the evaluation phase starts, there is a time, t a m p , in which both V X and V Y fall together with a small difference, V X Y , and then a time, t r e g , in which this small difference is regenerated by the intermediate stage, as explained in Section 2.
It is worth noting that t a m p and t r e g are dependent on the common mode voltage. In fact, for V I C M equal to V D D the NOR2 shows a low t a m p and, vice versa, t a m p is higher with V I C M equal to 0. Complementary, the NAND2 exhibits a high t a m p when V I C M is equal to V D D and, vice versa, a low t a m p when V I C M is equal to 0.
The complementarity of the topologies is simply explainable, observing that a 2-input NOR differs from a 2-input NAND since there are two series transistors in the Pull-Up-Network and only one in the Pull-Down-Network, making its low-to-high propagation delay higher with respect to the NAND. Vice versa, a 2-input NAND has two series transistors in the Pull-Down-Network and only one in the Pull-Up-Network, making its high-to-low propagation delay higher with respect to the NOR.

3.4. Offset

The offset of a comparator is related to the matching properties between transistors [24,25,26,27,28,29,30]. According to Pelgrom’s model [24], at the transistor level, it is known that the standard deviation of the offset, σ o f f , is inversely proportional to the area of the transistors that have to be matched. Since standard cell comparators are multi-stage topologies, the main input referred offset contribution comes from the pre-amplifier, because the offset of the subsequent stages is reduced by the gain of the preceding blocks. This statement has been verified by simulations; thus, we will focus only on the offset dependence on the pre-amplifier strength.
In the case of a standard-cell comparator, the matching has to be guaranteed between standard cells of the pre-amplifier, which are made up of two different types of transistor, NMOS and PMOS. It is possible to demonstrate (see Appendix A) that the offset standard deviation is related to the area of the minimum-sized cell and the cell’s strength, as in (1).
σ o f f 2 X p r e · A m i n
Despite the fact that the relationship does not take into account X i n t , since it is fundamental to guarantee the ICMR requirement, an increase in X p r e implies at least an equal increase on the X i n t value to guarantee the rail-to-rail ICMR.

4. Comparison

In a typical application that exploits one, or more, comparators, the input offset voltage is one of the key parameters that has to be taken into account. Given a topology, if there is the need to decrease the offset, the only way is to increase the area of the cells. However, when increasing the area of the cells, the decrease in the offset is payed with an increase in power consumption, as discussed in Section 3. This behavior implies that a trade-off, between the offset and power consumption exists. To quantify this trade-off, F O M 1 is introduced in Equation (2) to take into account the offset, in terms of standard deviation, σ o f f , and mean value, μ o f f , and the power consumption:
F O M 1 = σ o f f 2 + μ o f f 2 · P o w e r
Another important aspect for comparators is the delay, which, in the case of standard cell-based comparators, is mainly related to the topology rather than to the design. Nevertheless, to compare the topologies, it can be useful to introduce F O M 2 , as in [23], in which the offset and power consumption are considered together with the delay:
F O M 2 = σ o f f 2 + μ o f f 2 · P o w e r · D e l a y = σ o f f 2 + μ o f f 2 · P D P
This second figure of merit can also be expressed in terms of power-delay-product (PDP), thus providing information about how good the trade off is between offset and energy per comparison.
In this section, we compare the NAND2 and the proposed NOR2 by means of pre-layout simulations referring to a 45 nm CMOS process. Simulation results regarding delay, power consumption and power-delay-product (PDP) of the different topologies are presented, focusing on their performances with respect to V I C M variation at three different supply voltage conditions: 600 mV, 300 mV, 150 mV. The offset related to mismatch variations has been evaluated through Monte Carlo simulations referring to the statistical models for technology mismatch provided by the manufacturer on 1000 samples. A linear ramp differential input signal in a transient simulation, with amplitude ranging from V D D to V D D and common mode voltage equal to V D D / 2 , is considered, and the input-referred offset voltage is evaluated by taking the value of V I D , which corresponds the output commutation. Moreover, the relation between offset and power consumption introduces the possibility to design the comparator in order to minimize one of them. Thus, in the following the topologies will be designed in both ways, also guaranteeing rail-to-rail ICMR.

4.1. Rail-to-Rail ICMR with Minimum Offset Design

The first requirement to guarantee is the ICMR; thus, the values of X p r e and X i n t must be chosen according to the rail-to-rail ICMR condition highlighted previously in Table 1 and Table 2 for the NAND2 and NOR2, respectively. In Table 3, the chosen strengths are reported together with the performance parameters evaluated with V I C M equal to V D D / 2 at three different supply voltages.
As can be seen, with a hardly scaled supply voltage of 150 mV and 300 mV, the NOR2 exhibits a σ o f f equal to 14.6 mV and 45.3 mV, respectively. These values are about 5 mV less than the σ o f f of the NAND2. However, this difference is payed with an increased power consumption. The same holds at 600 mV, where the NOR2 offers a 10 mV smaller σ o f f . It is worth noting that the σ o f f of each topology increases with the supply voltage, but the ratio σ o f f / V D D is always lower than 20 % .
Concerning the effects of V I C M on delay and power consumption, in Figure 15 and Figure 16 the results for both topologies are shown. As can be seen, at 150 mV the NOR2 is much faster than the NAND2 if V I C M is below 70 % of V D D . This percentage increases at 300 and 600 mV, where the NOR2 is faster with V I C M below 90 % of V D D . It is worth noting that the trends are complementary to each other with respect to V D D / 2 , given that the topologies are complementary to each other. The increased speed of the NOR2 is payed in terms of power consumption that is higher with respect to the NAND2, at 150 mV, for every V I C M . At 300 and 600 mV the NOR2 power consumption is almost the same as the NAND2, at least for V I C M below 80–90% of V D D , above which the NOR2 shows a higher consumption. However, for each topology it is possible to find a minimum for the power consumption when V I C M is equal to V D D / 2 .

4.2. Rail-to-Rail ICMR with Minimum Power Consumption Design

As for the minimum offset approach, the rail-to-rail ICMR has to be guaranteed; thus, the values of X p r e and X i n t must be chosen according to the rail-to-rail ICMR condition, considering the values in Table 1 and Table 2 for the NAND2 and NOR2, respectively. In Table 4, the chosen strengths are reported, together with the performance parameters evaluated with V I C M equal to V D D / 2 at three different supply voltages.
In this case, both the topologies exhibit almost the same power consumption for each supply voltage that is consistently lower with respect to the minimum offset case. Concerning the delay, the NOR2 shows a slightly lower delay with respect to the NAND2 when the PDP is lower. Regarding the offset, the NAND2 offers a lower σ o f f than the NOR2, with increased σ o f f / V D D ratio with respect to the minimum offset design. It is worth noting that, in this case, the topologies exploit smaller cells with respect to the minimum offset case; thus, the offset standard deviation is higher, as expected.
The same considerations about the effects of V I C M on delay and power consumption, done for the minimum offset case, hold for the minimum power one. In Figure 17 and Figure 18, the results for both topologies are shown. Again, at 150 mV the NOR2 is much faster than the NAND2 if V I C M is below 70 % of V D D . For V D D equal to 300 and 600 mV, the NOR2 is slightly faster. Also in this case, the trends are complementary to each other with respect to V D D / 2 , given the complementarity of the topologies.
It is worth noting that, regardless of the design strategy, both of the topologies show a complementary parabolic-like power consumption trend with respect to V I C M (see Figure 16 and Figure 18). It is possible to find a minimum for V I C M equal to V D D / 2 , at which the topologies are perfectly equivalent. In this condition, after V X Y is regenerated, V I C M drives the pre-amplifier’s transistors in the saturation region and the static current is limited. On the other hand, if V I C M tends to 0 or V D D , the pre-amplifier’s transistors are driven in the triode region; thus, a low-resistance path from V D D to ground is realized. In these cases, the power consumption is higher than the case in which V I C M is equal to V D D / 2 .
The complementarity of the topologies is also evident in terms of power consumption. In fact, if V I C M tends to 0, the NOR2 offers a lower power consumption with respect to the NAND2. Vice versa, if V I C M tends to V D D , the power consumption of the NOR2 is higher with respect to the one of the NAND2. This duality comes from the duality between the Pull-Up-Network of the NOR2 and the Pull-Down-Network of the NAND2, as described in Section 3.3. In fact, the path from V D D to ground offered by the NOR2, when V I C M is equal to 0, is made up of two series transistors with respect to the NAND2, in which the path is given by only one transistor. Thus, the NOR2 static current is lower. Conversely, the path from V D D to ground offered by the NOR2, when V I C M is equal to V D D , is made up of only one transistor with respect to the NAND2, in which the path is given by two series transistors. In this case, the NOR2 static current will be higher.

4.3. Comparison with the State-of-the-Art of Rail-to-Rail Topologies

In this subsection, we compare the proposed topology, designed with both minimum offset and minimum power methods, with the rail-to-rail ICMR topologies in [19,20,22]. The results are given considering V I C M equal to V D D / 2 and V I D equal to 10 mV and are reported in Table 5, where the NOR2 is designed for minimum offset, and Table 6, where the NOR2 is designed for minimum power. It is worth noting that the NOR2 is faster than the NAND2, with V I C M equal to V D D / 2 .
As can be seen from Table 5, the NOR2 designed for minimum offset shows a much lower delay, with higher power consumption; nevertheless, the PDP is greatly reduced with respect to [19,20]. From the offset point of view, the NOR2 exhibits a slightly higher σ o f f and a much lower μ o f f , at 150 mV. The σ o f f becomes higher as the supply increases, with respect to the values of [19,20], which are almost constant. In fact, the F O M 1 of the NOR2 is higher than [19,20], unless at 150 mV supply, and increases with supply voltage. However, if the F O M 2 is considered, the NOR2 offers the best trade-off between offset, power consumption and delay, at 150 mV.
The results when minimum power design is considered for the NOR2 are reported in Table 6. It is possible to see that the topology is able to offer a 8× higher speed with respect to the [19], with V D D equal to 150 and 300 mV, and almost 16× higher with V D D equal to 600 mV. With respect to [20], the increase is 4×, with V D D equal to 150 and 300 mV, and 8×, with V D D equal to 600 mV. Moreover, the great increase in speed is obtained with a lower power consumption, with respect to [19,20], at 150 mV. This does not hold with V D D equal to 300 mV, where the power consumption is 2× higher with respect to [19], but is 0.6× lower than [20]. Considering V D D equal to 600 mV, the increase in power consumption is very small, making the case with V D D equal to 300 mV the worst case in terms of power consumption. However, the NOR2 exhibits meanly a 7× lower PDP, at various supply voltages. From the offset point of view, at 150 mV the NOR2 has a higher σ o f f , with a much lower μ o f f , with respect to [19,20]; thus, comparing the three topologies through F O M 1 , the trade-off between power and offset is better than [20] and slightly worse than [19]. This trade-off is worsened with higher supply voltages. Finally, if the F O M 2 is considered, it is possible to state that the best trade-off between offset, power consumption and delay is obtained by the NOR2. If the supply is increased, the topology is able to stay at least in between [19,20].

5. Conclusions

In this paper, a NOR2-based rail-to-rail ICMR DVC has been presented, as a complementary version of the NAND2-based one in [22]. The topology provides better speed performance and lower PDP with respect to the NAND2 topology. Moreover, in the paper is also proposed and discussed a standard-cell oriented design approach that makes use of the cell’s strength (unique free parameter) and overcomes the difficulties of the transistor level design. In particular, the impact of the cell’s strength on delay, power consumption, ICMR and offset has been investigated through gate-level modeling and simulations for supply voltages equal to 600 mV, 300 mV and 150 mV, considering a 45 nm CMOS technology. After a first analysis, having the aim of finding the cell’s strength conditions that guarantee a rail-to-rail ICMR, it was also found that the delay of the NAND2 and NOR2 is almost independent from the cell’s strength. Hence, as expected, it can be assumed that the speed of the comparator is mainly a topological feature. Regarding the power consumption, the impact of each stage has been investigated, and it was found that its variation is mainly due to the cell’s strength variation of the pre-amplifier stage. As expected, the same also holds for the offset variation. On the other hand, the cell’s strength variation of the intermediate stage plays a crucial role in guaranteeing the rail-to-rail ICMR. The highlighted behaviors allow the designer to design for minimum power target, or minimum offset target. For both of the two design targets, the performance of the NOR2 has been compared with the NAND2, and a higher speed with lower PDP was found. Moreover, the proposed topology, which is able to guarantee high speed performance with reduced power-delay product, allows improvements in the order of 8×–16× higher speed and 7× lower PDP, with respect to the other state-of-the-art rail-to-rail standard-cell-based comparators [19,20]. In conclusion, the results demonstrate that the proposed NOR2 topology offers a high performance option for ultra-low voltage, ultra-low power circuits where rail-to-rail ICMR is required. Moreover, the introduced standard-cell oriented approach allows a simple and fast design methodology, which further justifies the use of the standard-cell approach.

Author Contributions

Conceptualization, A.M., G.P. and G.S.; data curation, A.M.; investigation, A.M. and G.P.; software, A.M. and G.S.; validation, A.M., G.P. and G.S.; supervision, G.P. and G.S.; writing—original draft preparation, A.M. and G.P.; writing—review and editing, G.P. and G.S. All authors have read and agreed to the published version of the manuscript.

Funding

This work was supported in part by the Italian Minister of Reasearch PON Ricerca e innovazione 2014-2020, Azione n. IV.6 and in part by the European Union (NextGeneration EU) through the MUR-PNRR Project SAMOTHRACE under Grant ECS00000022.

Data Availability Statement

The original contributions presented in this study are included in the article. Further inquiries can be directed to the corresponding authors.

Conflicts of Interest

The authors declare no conflict of interest.

Appendix A

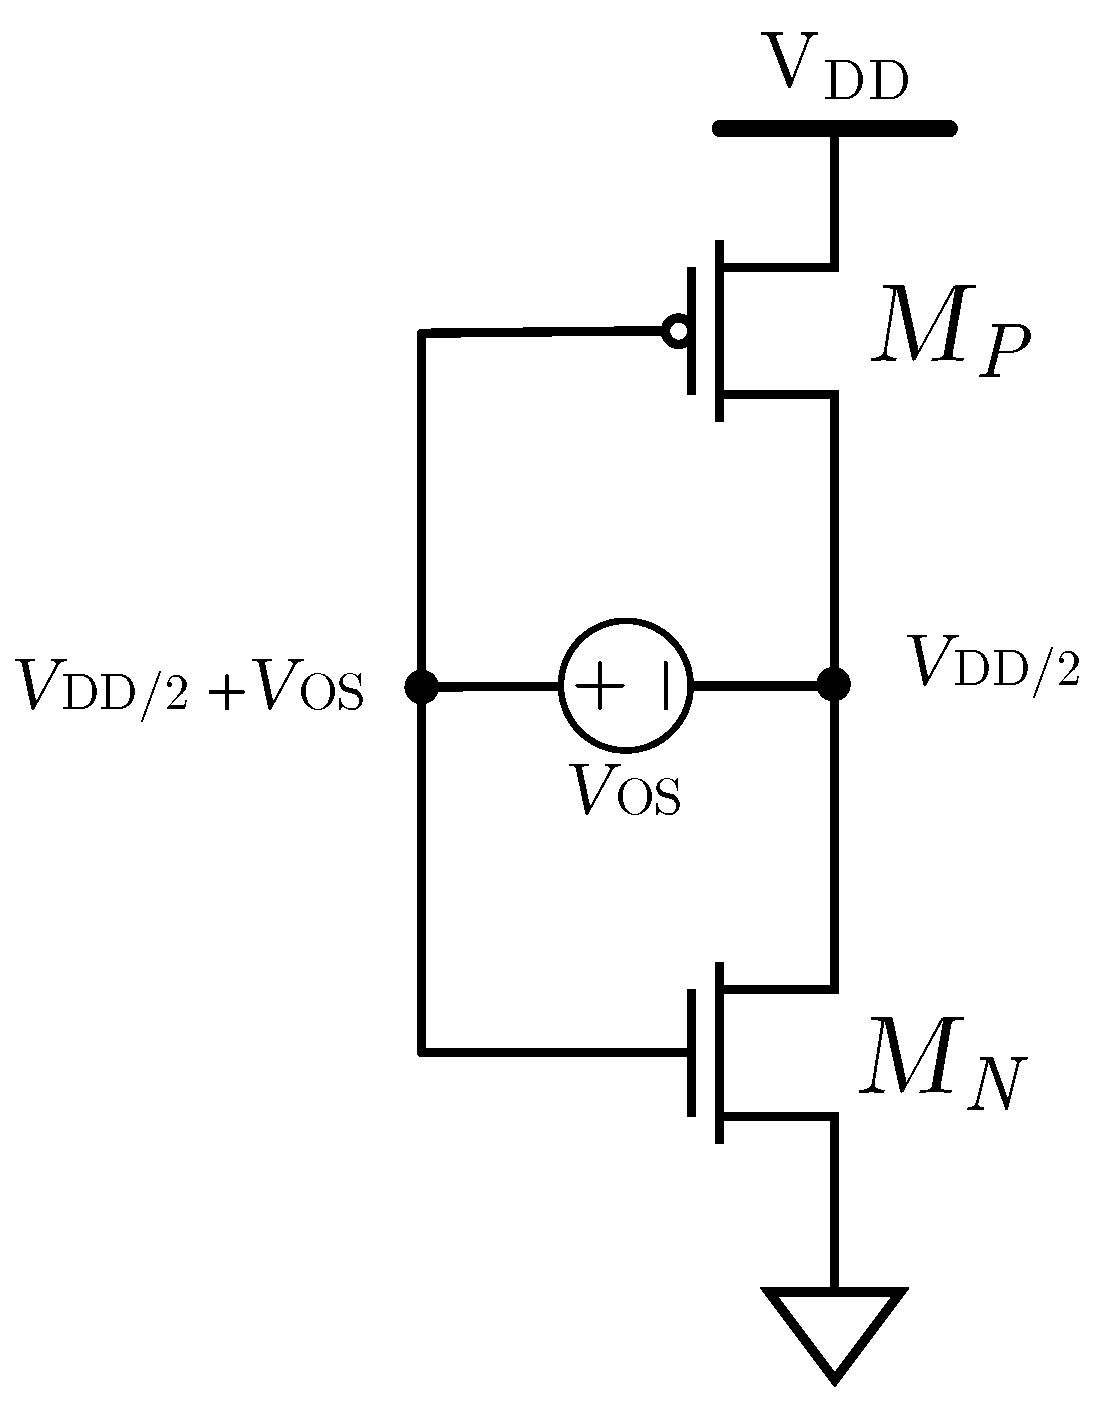
Since the offset introduced by the pre-amplifier’s cells is of concern during the evaluation period, and in this condition the gates can be seen as simple inverters, the analysis will start from the offset of a simple inverter. In the ideal case of a symmetric inverter, the threshold voltage is equal to V D D / 2 . However, in a real case, due to process variation, the threshold voltage slightly differs from V D D / 2 , since the mismatch between transistors introduces an offset effect that can be modeled with a generator, as in Figure A1.
Figure A1. Inverter offset voltage modeling.
Jlpea 15 00014 g0a1
Considering the transistors working in sub-threshold, as it is the common case for ULV topologies, the drain current is given by
I D = I D 0 W L exp ( | V G S | V T H n V T )
Therefore, taking into account the offset voltage, from the current balance we get
I N 0 ( W N L N ) exp ( V D D / 2 + V O S V T N n V T ) = I P 0 ( W P L P ) exp ( V D D / 2 V O S | V T P | n V T )
and solving for V O S we obtain
V O S = n V T 2 [ ln ( μ P μ N ) + ln ( W P W N ) + ln ( L N L P ) ] + 1 2 ( V T N | V T P | )
The offset variance, σ o f f 2 , with respect to process variation, is calculated as
σ o f f 2 = ( V O S μ P μ N ) 2 σ μ P μ N 2 + ( V O S W P W N ) 2 σ W P W N 2 + ( V O S L N L P ) 2 σ L N L P 2 + ( V O S V T N ) 2 σ V T N 2 + ( V O S V T P ) 2 σ V T P 2
which can be rewritten as
σ o f f 2 = ( n V T 2 ) 2 [ σ μ P 2 μ P 2 + σ μ N 2 μ N 2 + σ W P 2 W P 2 + σ W N 2 W N 2 + σ L P 2 L P 2 + σ L N 2 L N 2 ] + 1 4 ( σ V T N 2 + σ V T P 2 )
From Pelgrom’s model in [24], the variance of mobility and threshold voltage are inversely proportional to the area occupied by the transistor, while the variance of the length and the width are inversely proportional to the width and the length of the transistor, respectively. Moreover, in the case of an inverter, the area of the PMOS transistor, A r e a P , is equal to β A r e a N , where A r e a N is the area of the NMOS transistor and β is a multiplying factor. Hence, considering that the area of the inverter, A r e a I N V , is equal to A r e a P + A r e a N , each transistor area can be expressed as
A r e a N = 1 ( 1 + β ) A r e a I N V
A r e a P = β ( 1 + β ) A r e a I N V
Substituting (A7) and (A6) into (A5), it is straightforward to relate σ o f f 2 with the area of the inverter, A r e a I N V , through Pelgrom’s model [24]. Highlighting the strength of the inverter, X I N V , with respect to the minimum one, we get
σ o f f 2 1 A r e a I N V = 1 X I N V · A r e a I N V , m i n
Finally, in the case of two matched inverters, as in the case of the pre-amplifier of the discussed comparators, the overall offset variance is the sum of each single inverter contribution:
σ o f f , t o t 2 = σ o f f , 1 2 + σ o f f , 2 2 2 X I N V · A r e a I N V , m i n
Then, the offset standard deviation is given by the square root of the variance
σ o f f 2 X I N V · A r e a I N V , m i n

References

  1. Volkmann, J. Deep Brain Stimulation for the Treatment of Parkinson’s Disease. J. Clin. Neurophysiol. 2004, 21, 6. [Google Scholar] [CrossRef] [PubMed]
  2. Hannan, M.A.; Mutashar, S.; Samad, S.A.; Hussain, A. Energy harvesting for the implantable biomedical devices: Issues and challenges. BioMed Eng. Online 2014, 13, 79. [Google Scholar] [CrossRef] [PubMed]
  3. Hong, Y.J.; Jeong, H.; Cho, K.W.; Lu, N.; Kim, D.H. Wearable and Implantable Devices for Cardiovascular Healthcare: From Monitoring to Therapy Based on Flexible and Stretchable Electronics. Adv. Funct. Mater. 2019, 29, 1808247. [Google Scholar] [CrossRef]
  4. Karthick, R.; Ramkumar, R.; Akram, M.; Vinoth Kumar, M. Overcome the challenges in bio-medical instruments using IOT–A review. Mater. Today Proc. 2021, 45, 1614–1619. [Google Scholar] [CrossRef]
  5. Aledhari, M.; Razzak, R.; Qolomany, B.; Al-Fuqaha, A.; Saeed, F. Biomedical IoT: Enabling Technologies, Architectural Elements, Challenges, and Future Directions. IEEE Access 2022, 10, 31306–31339. [Google Scholar] [CrossRef]
  6. Privitera, M.; Ballo, A.; Ali, K.; Grasso, A.D.; Alioto, M. Sub-μW Battery-Less and Oscillator-Less Wi-Fi Backscattering Transmitter Reusing RF Signal for Harvesting, Communications, and Motion Detection. IEEE J. Solid-State Circuits 2024, 1–12. [Google Scholar] [CrossRef]
  7. Catania, A.; Gagliardi, F.; Piotto, M.; Bruschi, P.; Dei, M. Ultralow-Power Inverter-Based Delta-Sigma Modulator for Wearable Applications. IEEE Access 2024, 12, 80009–80019. [Google Scholar] [CrossRef]
  8. Van Elzakker, M.; Van Tuijl, E.; Geraedts, P.; Schinkel, D.; Klumperink, E.A.M.; Nauta, B. A 10-bit Charge-Redistribution ADC Consuming 1.9 μW at 1 MS/s. IEEE J. Solid-State Circuits 2010, 45, 1007–1015. [Google Scholar] [CrossRef]
  9. Majidzadeh, V.; Silay, K.M.; Schmid, A.; Dehollain, C.; Leblebici, Y. A fully on-chip LDO voltage regulator with 37 dB PSRR at 1 MHz for remotely powered biomedical implants. Analog Integr. Circ. Signal Process. 2011, 67, 157–168. [Google Scholar] [CrossRef]
  10. Wang, S.H.; Hung, C.C. A 0.3V 10b 3MS/s SAR ADC with Comparator Calibration and Kickback Noise Reduction for Biomedical Applications. IEEE Trans. Biomed. Circuits Syst. 2020, 14, 558–569. [Google Scholar] [CrossRef]
  11. Di Patrizio Stanchieri, G.; Aiello, O.; De Marcellis, A. A 0.4 V 180 nm CMOS Sub-μW Ultra-Compact and Low-Effort Design PWM-Based ADC. In Proceedings of the 2024 IEEE International Symposium on Circuits and Systems (ISCAS), Singapore, 19–22 May 2024; pp. 1–5, ISSN 2158-1525. [Google Scholar] [CrossRef]
  12. Toledo, P.; Rubino, R.; Musolino, F.; Crovetti, P. Re-Thinking Analog Integrated Circuits in Digital Terms: A New Design Concept for the IoT Era. IEEE Trans. Circuits Syst. II Express Briefs 2021, 68, 816–822. [Google Scholar] [CrossRef]
  13. Toledo, P.; Crovetti, P.; Klimach, H.; Bampi, S. A 300mV-Supply, 2nW-Power, 80pF-Load CMOS Digital-Based OTA for IoT Interfaces. In Proceedings of the 2019 26th IEEE International Conference on Electronics, Circuits and Systems (ICECS), Genoa, Italy, 27–29 November 2019; pp. 170–173. [Google Scholar] [CrossRef]
  14. Toledo, P.; Crovetti, P.; Aiello, O.; Alioto, M. Fully Digital Rail-to-Rail OTA with Sub-1000- μm² Area, 250-mV Minimum Supply, and nW Power at 150-pF Load in 180 nm. IEEE Solid-State Circuits Lett. 2020, 3, 474–477. [Google Scholar] [CrossRef]
  15. Palumbo, G.; Scotti, G. A Novel Standard-Cell-Based Implementation of the Digital OTA Suitable for Automatic Place and Route. J. Low Power Electron. Appl. 2021, 11, 42. [Google Scholar] [CrossRef]
  16. Centurelli, F.; Giustolisi, G.; Pennisi, S.; Scotti, G. A Biasing Approach to Design Ultra-Low-Power Standard-Cell-Based Analog Building Blocks for Nanometer SoCs. IEEE Access 2022, 10, 25892–25900. [Google Scholar] [CrossRef]
  17. Privitera, M.; Crovetti, P.; Grasso, A.D. A Novel Digital OTA Topology With 66-dB DC Gain and 12.3-kHz Bandwidth. IEEE Trans. Circuits Syst. II 2023, 70, 3988–3992. [Google Scholar] [CrossRef]
  18. Weaver, S.; Hershberg, B.; Moon, U.K. Digitally Synthesized Stochastic Flash ADC Using Only Standard Digital Cells. IEEE Trans. Circuits Syst. I Regul. Pap. 2014, 61, 84–91. [Google Scholar] [CrossRef]
  19. Aiello, O.; Crovetti, P.; Alioto, M. Fully Synthesizable, Rail-to-Rail Dynamic Voltage Comparator for Operation down to 0.3 V. In Proceedings of the 2018 IEEE International Symposium on Circuits and Systems (ISCAS), Florence, Italy, 27–30 May 2018; pp. 1–5, ISSN 2379-447X. [Google Scholar] [CrossRef]
  20. Li, X.; Zhou, T.; Ji, Y.; Li, Y. A 0.35 V-to-1.0 V synthesizable rail-to-rail dynamic voltage comparator based OAI&AOI logic. Analog Integr. Circ. Signal Process. 2020, 104, 351–357. [Google Scholar] [CrossRef]
  21. Aiello, O.; Crovetti, P.; Toledo, P.; Alioto, M. Rail-to-Rail Dynamic Voltage Comparator Scalable Down to pW-Range Power and 0.15-V Supply. IEEE Trans. Circuits Syst. II Express Briefs 2021, 68, 2675–2679. [Google Scholar] [CrossRef]
  22. Della Sala, R.; Centurelli, F.; Scotti, G.; Palumbo, G. Rail to Rail ICMR and High Performance ULV Standard-Cell-Based Comparator for Biomedical and IoT Applications. IEEE Access 2024, 12, 4642–4659. [Google Scholar] [CrossRef]
  23. Della Sala, R.; Centurelli, F.; Scotti, G.; Palumbo, G. Standard-Cell-Based Comparators for Ultra-Low Voltage Applications: Analysis and Comparisons. Chips 2023, 2, 173–194. [Google Scholar] [CrossRef]
  24. Pelgrom, M.; Duinmaijer, A.; Welbers, A. Matching properties of MOS transistors. IEEE J. Solid-State Circuits 1989, 24, 1433–1439. [Google Scholar] [CrossRef]
  25. Croon, J.; Rosmeulen, M.; Decoutere, S.; Sansen, W.; Maes, H. An easy-to-use mismatch model for the MOS transistor. IEEE J. Solid-State Circuits 2002, 37, 1056–1064. [Google Scholar] [CrossRef]
  26. Yuan, X.; Shimizu, T.; Mahalingam, U.; Brown, J.S.; Habib, K.Z.; Tekleab, D.G.; Su, T.C.; Satadru, S.; Olsen, C.M.; Lee, H.; et al. Transistor Mismatch Properties in Deep-Submicrometer CMOS Technologies. IEEE Trans. Electron Devices 2011, 58, 335–342. [Google Scholar] [CrossRef]
  27. Sheikholeslami, A. Process Variation and Pelgrom’s Law [Circuit Intuitions]. IEEE Solid-State Circuits Mag. 2015, 7, 8–9. [Google Scholar] [CrossRef]
  28. T Hart, P.A.; Babaie, M.; Charbon, E.; Vladimirescu, A.; Sebastiano, F. Subthreshold Mismatch in Nanometer CMOS at Cryogenic Temperatures. IEEE J. Electron Devices Soc. 2020, 8, 797–806. [Google Scholar] [CrossRef]
  29. ’T Hart, P.A.; Babaie, M.; Charbon, E.; Vladimirescu, A.; Sebastiano, F. Characterization and Modeling of Mismatch in Cryo-CMOS. IEEE J. Electron Devices Soc. 2020, 8, 263–273. [Google Scholar] [CrossRef]
  30. Borgmans, J.; Rombouts, P. The Mismatch Performance of Pseudo Digital Ring Oscillators Used in VCO ADCs: PSRR and CMRR. IEEE Trans. Circuits Syst. I Regul. Pap. 2023, 70, 579–592. [Google Scholar] [CrossRef]
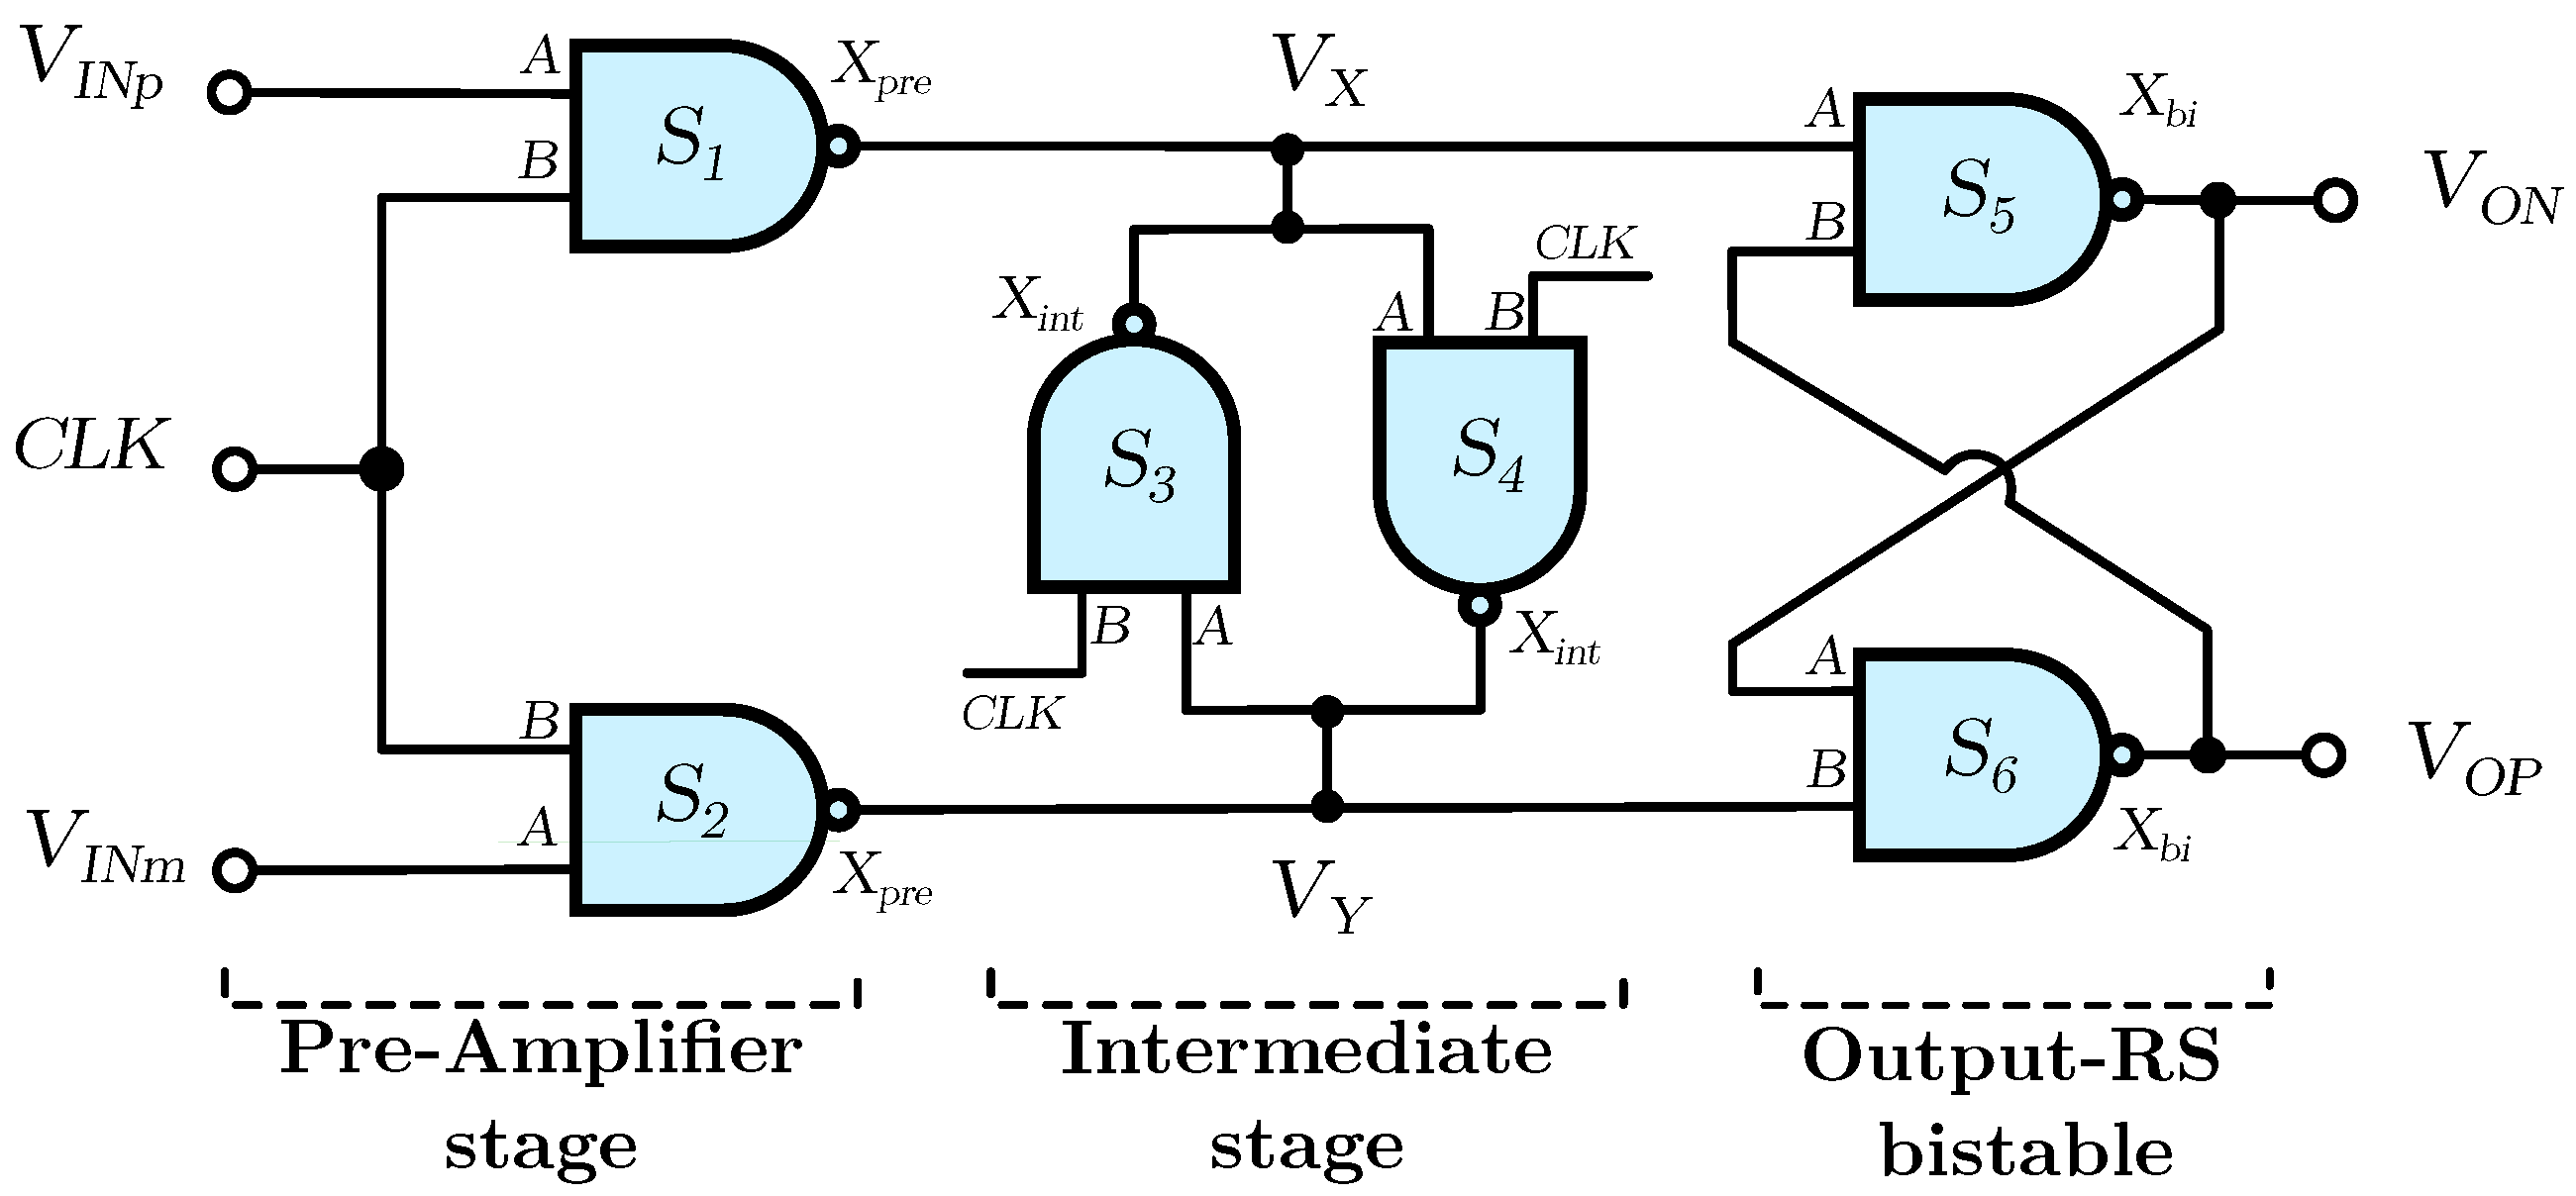
Figure 1. NAND2 SCB-DVC topology.
Jlpea 15 00014 g001
Figure 2. NAND2 node voltages with V D D = 300 mV, V I D = 10 mV and V I C M = V D D / 4 .
Jlpea 15 00014 g002
Figure 3. NAND2 node voltages with V D D = 300 mV, V I D = 10 mV and V I C M = V D D / 2 .
Jlpea 15 00014 g003
Figure 4. NAND2 node voltages with V D D = 300 mV, V I D = 10 mV and V I C M = 3 V D D / 4 .
Jlpea 15 00014 g004
Figure 5. NOR2 SCB-DVC proposed topology.
Jlpea 15 00014 g005
Figure 6. NOR2 node voltages with V D D = 300 mV, V I D = 10 mV and V I C M = V D D / 4 .
Jlpea 15 00014 g006
Figure 7. NOR2 node voltages with V D D = 300 mV, V I D = 10 mV and V I C M = V D D / 2 .
Jlpea 15 00014 g007
Figure 8. NOR2 node voltages with V D D = 300 mV, V I D = 10 mV and V I C M = 3 V D D / 4 .
Jlpea 15 00014 g008
Figure 9. Delay dependence to X p r e and X i n t with V D D equal to 300 mV, V I C M equal to V D D / 2 and V I D equal to 10 mV.
Jlpea 15 00014 g009
Figure 10. Power dependence to X p r e and X i n t with 300 mV V D D , V I C M equal to V D D / 2 and V I D equal to 10 mV.
Jlpea 15 00014 g010
Figure 11. NOR2 intermediate nodes voltages, V X and V Y , when the rail-to-rail condition is not satisfied considering V D D = 300 mV and V I D = 10 mV.
Jlpea 15 00014 g011
Figure 12. NOR2 intermediate nodes voltages, when the rail-to-rail condition is satisfied considering V D D = 300 mV and V I D = 10 mV.
Jlpea 15 00014 g012
Figure 13. NAND2 intermediate nodes voltages, V X and V Y , when the rail-to-rail condition is not satisfied considering V D D = 300 mV and V I D = 10 mV.
Jlpea 15 00014 g013
Figure 14. NAND2 intermediate nodes voltages, V X and V Y , when the rail-to-rail condition is satisfied considering V D D = 300 mV and V I D = 10 mV.
Jlpea 15 00014 g014
Figure 15. Delay vs. V I C M with minimum offset design approach.
Jlpea 15 00014 g015
Figure 16. Power consumption vs. V I C M with minimum offset design approach.
Jlpea 15 00014 g016
Figure 17. Delay vs. V I C M with minimum power design approach.
Jlpea 15 00014 g017
Figure 18. Power consumption vs. V I C M with minimum power design approach.
Jlpea 15 00014 g018
Table 1. NAND2 ICMR [mV] dependence with the cell’s strength, considering V D D = 300 mV.
X 1 int X 2 int X 4 int X 6 int X 8 int
X 1 pre 30–30010–3000–3000–3000–300
X 2 pre 40–30030–30010–3000–3000–300
X 4 pre 70–28050–30030–30020–30010–300
X 6 pre 80–26070–29050–30040–30030–300
X 8 pre 90–25080–27060–30050–30040–300
Table 2. NOR2 ICMR [mV] dependence with the cell’s strength, considering V D D = 300 mV.
X 1 int X 2 int X 4 int X 6 int X 8 int
X 1 pre 0–2700–2800–3000–3000–300
X 2 pre 0–2500–2700–2900–3000–300
X 4 pre 20–2300–2500–2700–2900–300
X 6 pre 40–22020–2300–2600–2700–280
X 8 pre 60–21040–2300–2500–2700–280
Table 3. Rail-to-Rail ICMR with minimum offset design considering V I C M = V D D / 2 .
TopologySupply
[mV]
X p r e , i n t Power
[pW]
Delay
[ns]
PDP
[aJ]
σ off
[mV]
% σ off V DD μ off
[mV]
FOM1
[V·pW]
FOM2
[V·aJ]
NOR2 150 X 4 , 8 12.916,100207.614.69.73%0.4190.1883.03
300 X 4 , 8 156.1102015945.315.1%−0.6747.077.21
600 X 4 , 6 29,2009.36273.395.415.9%−0.727278026.07
NAND2
[22]
150 X 2 , 6 9.3219,07017718.312.2%0.9470.173.25
300 X 2 , 6 90.31150103.850.816.9%0.664.595.29
600 X 2 , 8 14,59011.04161105.217.5%−1.4154016.94
Table 4. Rail-to-Rail ICMR with minimum power consumption design with V I C M = V D D / 2 .
TopologySupply
[mV]
X p r e , i n t Power
[pW]
Delay
[ns]
PDP
[aJ]
σ off
[mV]
% σ off V DD μ off
[mV]
FOM1
[V·pW]
FOM2
[V·aJ]
NOR2 150 X 1 , 4 7.4817,20012829.619.7%0.9420.223.82
300 X 1 , 4 62.7105065.875.425.1%0.1084.724.96
600 X 1 , 2 87709.1880.58145.324.2%4.2127011.7
NAND2
[22]
150 X 1 , 4 7.3718,60013724.616.4%0.9860.183.38
300 X 1 , 4 6211307062.620.8%0.1333.884.39
600 X 1 , 4 876010.188.4119.719.95%−2.7104010.59
Table 5. Rail-to-Rail ICMR and minimum offset design with V I C M = V D D / 2 .
TopologySupply
[mV]
Power
[pW]
Delay
[ns]
PDP
[aJ]
σ off
[mV]
% σ off V DD μ off
[mV]
FOM1
[V·pW]
FOM2
[V·aJ]
NOR2 150 12.916,100207.614.69.73%0.4190.1883.03
300 156.1102015945.315.1%−0.6747.077.21
600 29,2009.36273.395.415.9%−0.727278026.07
NAND2
[22]
150 9.3219,07017718.312.2%0.9470.173.25
300 90.31150103.850.816.9%0.664.595.29
600 14,59011.04161105.217.5%−1.4154016.94
[19] 150 7.9134,000106012.18.06%18.60.17523.5
300 30.38530258.810.33.43%1.20.312.68
600 8290152.1126010.211.7%0.538012.89
[20] 150 15.250,60077013.839.22%6.490.2311.75
300 99.1446044211.93.87%1.981.195.33
600 830070.858711.611.93%2.01976.92
Table 6. Rail-to-Rail ICMR and minimum power consumption design with V I C M = V D D / 2 .
TopologySupply
[mV]
Power
[pW]
Delay
[ns]
PDP
[aJ]
σ off
[mV]
% σ off V DD μ off
[mV]
FOM1
[V·pW]
FOM2
[V·aJ]
NOR2 150 7.4817,20012829.619.7%0.9420.223.82
300 62.7105065.875.425.1%0.1084.724.96
600 87709.1880.58145.324.2%4.2127011.7
NAND2
[22]
150 7.3718,60013724.616.4%0.9860.183.38
300 6211307062.620.8%0.1333.884.39
600 876010.188.4119.719.95%−2.7104010.59
[19] 150 7.9134,000106012.18.06%18.60.17523.5
300 30.38530258.810.33.43%1.20.312.68
600 8290152.1126010.211.7%0.538012.89
[20] 150 15.250,60077013.839.22%6.490.2311.75
300 99.1446044211.93.87%1.981.195.33
600 830070.858711.611.93%2.01976.92
Disclaimer/Publisher’s Note: The statements, opinions and data contained in all publications are solely those of the individual author(s) and contributor(s) and not of MDPI and/or the editor(s). MDPI and/or the editor(s) disclaim responsibility for any injury to people or property resulting from any ideas, methods, instructions or products referred to in the content.