Article

Modeling Excitable Cells with Memristors

1
Department of Electronics and Communication Engineering, Nepal Engineering College, Changunarayan 44801, Nepal
2
TJ Maxx Distribution Center, Evansville, IN 47711, USA
3
Department of Electronics and Telecommunications, Politecnico di Torino, 10129 Turin, Italy
4
Faculty of Electrical and Computer Engineering, Institute of Circuits and Systems, Technische Universität Dresden, 01062 Dresden, Germany
5
School of Electronics Engineering (SENSE), Vellore Institute of Technology, Vellore 632014, India
6
Department of Electrical and Electronics Engineering, Kathmandu University, Dhulikhel 45210, Nepal
*
Authors to whom correspondence should be addressed.
J. Low Power Electron. Appl. 2024, 14(2), 31; https://doi.org/10.3390/jlpea14020031
Submission received: 16 March 2024 / Revised: 18 May 2024 / Accepted: 22 May 2024 / Published: 28 May 2024

Abstract

:
This paper presents an in-depth analysis of an excitable membrane of a biological system by proposing a novel approach that the cells of the excitable membrane can be modeled as the networks of memristors. We provide compelling evidence from the Chay neuron model that the state-independent mixed ion channel is a nonlinear resistor, while the state-dependent voltage-sensitive potassium ion channel and calcium-sensitive potassium ion channel function as generic memristors from the perspective of electrical circuit theory. The mechanisms that give rise to periodic oscillation, aperiodic (chaotic) oscillation, spikes, and bursting in an excitable cell are also analyzed via a small-signal model, a pole-zero diagram of admittance functions, local activity, the edge of chaos, and the Hopf bifurcation theorem. It is also proved that the zeros of the admittance functions are equivalent to the eigen values of the Jacobian matrix, and the presence of the positive real parts of the eigen values between the two bifurcation points lead to the generation of complicated electrical signals in an excitable membrane. The innovative concepts outlined in this paper pave the way for a deeper understanding of the dynamic behavior of excitable cells, offering potent tools for simulating and exploring the fundamental characteristics of biological neurons.

1. Introduction

The electrical activities of neurons are characterized by a diverse array of dynamic phenomena, such as action potential, spike, chaos, and bursting. Understanding these qualitative features are essential for unraveling the principles underlying neuronal excitability. The popular Hodgkin-Huxley (HH) model developed in 1952, which consists of membrane voltage, potassium conductance, sodium conductance, and leakage conductance, provides a framework for understanding the propagation of action potential based on the squid giant axon experiments [1]. Recent analysis revealed that the potassium ion channel and sodium ion channel in the HH model, initially interpreted as time-varying conductances, are in fact generic memristors from the perspective of electrical circuit theory [2,3,4,5]. The HH model has spurred significant interest in designing electrical circuit models and observing the experimental results in the wide variety of complex systems of the membrane potential, nervous system, barnacle giant muscle fibers, Purkinje fibers, solitary hair cells, auditory periphery, mini-review of neuromorphic architectures and implementation, organic synapses for neuromorphic electronics, and photochromic compounds [6,7,8,9,10,11,12,13,14,15,16]. Similarly, extensive research has been conducted to observe the varieties of oscillations in pancreatic β-cells inspired by the HH model [17,18,19,20,21,22,23,24,25,26]. The mathematical model of an excitable membrane in pancreatic β–cells consist of voltage-sensitive channels that allow Na+ and Ca2+ to enter the cell and voltage-sensitive K+ channels and voltage-insensitive K+ channel that allow K+ ions to leave the cell and activate intracellular calcium ions, respectively [27,28,29]. Therefore, the outward current carried by K+ ions pass through the voltage and calcium-sensitive channels, and the inward currents carried by Na+ and Ca2+ ions pass through the voltage-sensitive Na+ and Ca2+ channels. However, the above models consist of complicated nonlinear differential equations associated with membrane voltage. Later, a modified model was presented by Chay [30], assuming the β-cells of the voltage-sensitive Na+ conductance are almost inactive and the inward current is almost exclusively carried by Ca2+ ions through the voltage-sensitive Ca2+ channel. Therefore, the assumption of a mixed effective conductance was formulated without affecting the results by expressing the total inward current in terms of a single mixed conductance gI and the reversal potential EI of the two functionally independent Na+ and Ca2+ channels. The model consists of three nonlinear differential equations, in contrast to the other complicated models of an excitable membrane of a pancreatic β-cell. Our studies in this paper typically focus on the simplified Chay neuron model of an excitable cell [30].
Understanding the intricacies of excitable membranes in biological systems are complicated and the mechanisms governing the generation of periodic, aperiodic (chaotic), bursting, and the spiking signals in the cells are still subject to under investigation. This paper aims to explore a model that the state-independent voltage-sensitive mixed ion channel gI functions as a nonlinear resistor, while the state-dependent voltage-sensitive potassium ion-channel gK,V and calcium-sensitive potassium ion-channel gK,Ca function as time-invariant memristors in Chay neuron model of an excitable cell. Additionally, this study seeks to delve into the memristive model of an excitable cell with the goal of gaining deeper insights into the dynamic behavior of excitable cell through analyses of small signal equivalent circuit models, pole-zero diagrams, local activity principle, edge of chaos and Hopf bifurcation theorem.
The paper is organized as follows: We introduce the Chay neuron model and its comparison analyses with the HH, FitzHugh–Nagumo, and Morris–Lecar (ML) models in Section 2. Section 3 describes the pinched hysteresis fingerprints of ion channel memristors. Section 4 presents the direct current (DC) analysis of the memristive Chay neuron model. Section 5 provides the small-signal analysis. Section 6 explores the application of the local activity principle, the edge of chaos theorem, and Hopf bifurcations in memristive Chay neurons. Finally, Section 7 concludes the paper.

2. Chay Neuron Model of an Excitable Cell

Excitable cells are specialized cells in the body and neurons that are capable of generating electrical signals in response to certain stimuli. These cells are crucial for the functioning of various physiological processes, including nerve signaling, muscle contraction, and hormone release. Excitability in these cells are primarily due to the presence of specialized proteins called ion channels in their cell membranes. These ion channels control the movement of ions such as sodium (Na+), potassium (K+), calcium (Ca2+), and chloride (Cl) across the membrane, leading to changes in the cell’s membrane potential and the generation of electrical signals. The study of excitable cells encompasses a wide array of topics, and our primary aim is to present a unified model for both neuronal and secretory excitable membranes based on the Chay neuron model. The Chay neuron model, which focuses on a simplified representation of neuronal and secretory excitable membranes, aims to provide a unified framework for understanding the complex electrical activity observed in excitable cells. This model typically involves just three ordinary differential equations (ODEs) to capture the essential features of an excitable cell membrane. The model consists of (a) mixed ion channel gI; (b) state-dependent voltage-sensitive potassium ion channel gK,V; (c) calcium-sensitive potassium ion channel gK,Ca; and (d) leakage channels, which are described by the following differential equations:
d V d t = I g I   m 3 h V E I g K , V   n 4 V E K g K , Ca   C a 1 + C a V E K g L   V E L C m
d n d t = n n τ n
d C a d t = ρ   m 3 h V E C a + k C a C a
where
n = α n α n + β n ,   α n = 0.01 V + 20 1 e 0.1 V + 20 ,   β n = 0.125 e V + 30 80
m = α m α m + β m ,   α m = 0.1 V + 25 1 e 0.1 V + 25 ,   β m = 4 e V + 50 18
h = α h α h + β h ,   α h = 0.07 e V + 50 20 ,   β h = 1 1 + e 0.1 V + 20 ,   τ n = 1 λ n α n + β n
Figure 1a shows the typical circuit of the Chay model with external current stimulus, denoted as I (The electrical model is not given in the Chay paper [30]. We have designed a typical electrical circuit model following the differential equations of the membrane potential. The symbolic representation of the conductances and potentials are assumed in different notations compared with the original representation. Figure 1a shows an electrical circuit model following the conventional assumption of the HH model). It consists of membrane potential V of capacitance Cm, potentials EI, EK, and EL for mixed Na+-Ca2+ ions, K+, and leakage ions, respectively. The conductances gI, gK,V, gK,Ca, and gL represent the voltage-sensitive mixed ion channel, voltage-sensitive potassium ion channel, calcium-sensitive potassium ion channel, and leakage channel, respectively. In the upcoming session, we will provide rigorous proofs that the state-independent mixed ion channel functions as a nonlinear resistor. However, the commonly held belief regarding state-dependent ion channels exhibiting time-varying conductances are found to be conceptually incorrect from the perspective of electrical circuit theory. Contrary to this conventional assumption, these ion channels do not adhere to time-varying conductance principles. Instead, they align more accurately with the characteristics of time-invariant generic memristors from a circuit-theoretic standpoint. A rigorous proof will be demonstrated in the subsequent section. The parameters for this model are summarized in Table 1 (The units of conductance for mixed ion channel, voltage-sensitive potassium ion channel, calcium-sensitive potassium ion channel and leakage ion channel in the Chay model [30] are assumed as g * = c o n d u c t a n c e m e m b r a n e   c a p a c i t a n c e = m S / c m 2 m F / c m 2 = 1 s e c o n d ( s ) = s 1 . As, we are assuming the value of membrane capacitance (Cm) = 1 mF/cm2, we use the unit of all the conductances of the ion channels, g = mS/cm2, throughout this study, which is also the equivalent unit g* of the original Chay model) and a list of abbreviations of the model parameters are illustrated in Appendix A. The comparison analyses of the HH model [1], FitzHugh–Nagumo model [31], ML model [8], and Chay model [30] are summarized in Table 2 along with their respective strengths and limitations. It is notable that each model possesses distinct advantages and drawbacks, making them suitable for different research contexts and questions. The choice of the model depends on the level of detail required, the computational resources available, and the specific phenomena under investigation. This study predominantly centers on the Chay neuron model of excitable cells.

3. Pinched Hysteresis Fingerprints of the Ion Channel Memristor

A generic memristor driven by a current source or voltage source is a two-terminal electrical circuit element whose instantaneous current or voltage obeys a state-dependent Ohm’s law. A generic memristor driven by a current source can be expressed as follows in terms of state x ˙ n :
v = R x 1 , x 2 , , x n i
x ˙ n = f 1 ( x 1 , x 2 , , x n ;   i )
where R(x) is the memristance of the memristor and depends on “n” (n ≥ 1) state variables.
Similarly, a voltage-controlled memristor is defined in terms of the memductance G(x) and the state variables x 1 , x 2 , x n , as follows:
i = G x 1 , x 2 , , x n v
x ˙ n = f 1 ( x 1 , x 2 , , x n ;   v )
Equations (7)–(10) play significant roles in distinguishing the memristive and non-memristive systems [32,33]. They provide evidence that the state independent voltage-sensitive mixed ion channel functions as a nonlinear resistor, and state-dependent voltage-sensitive potassium ion channel and calcium-sensitive potassium ion channel behave as time-invariant generic memristors.

3.1. Voltage-Sensitive Mixed Ion channel Nonlinear Resistor

The time-varying voltage-sensitive mixed ion channel with input voltage vI and current iI in the second element (from left) in Figure 1a is given by
V E I = v I
and
i I = G I ( m , h )   v I
and the conductance of the voltage-sensitive mixed ion channel is given by
G I ( m , h ) = g I   m 3 h
where m   and   h are computed using Equations (5) and (6).
m = 0.1 v I + E I + 25 0.1 v I + E I + 25 + 4 1 e 0.1 v I + E I + 25 e v I + E I + 50 18
h = 0.07 1 + e 0.1 v I + E I + 20 e v I + E I + 50 20 0.07 1 + e 0.1 v I + E I + 20 e v I + E I + 50 20 + 1
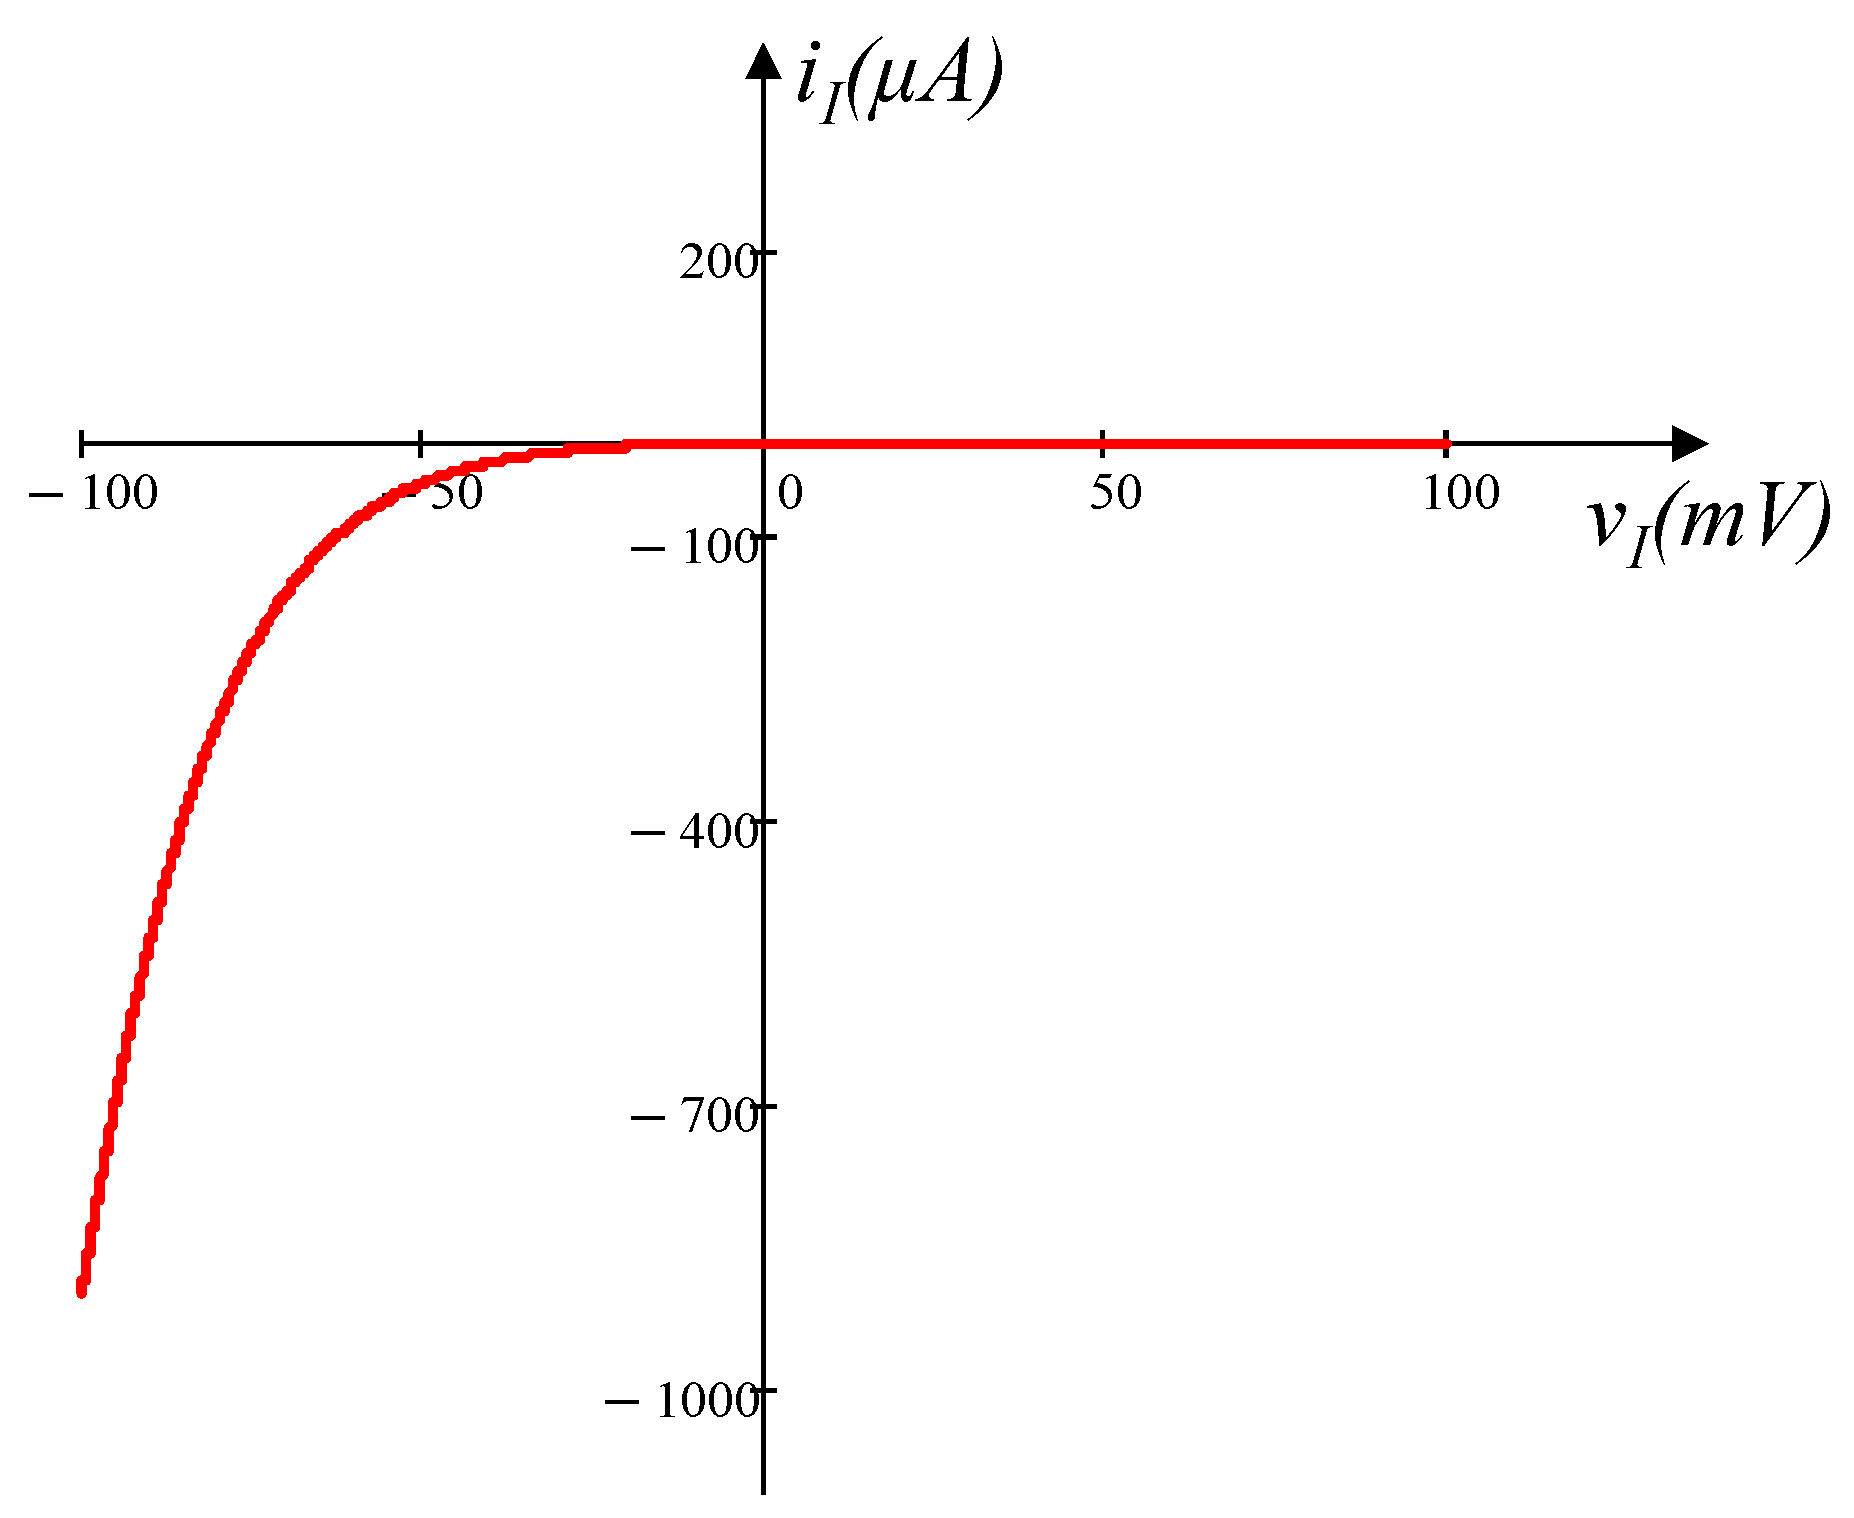
Observe Equations (12)–(15) are not identical to Equations (7) and (8) or Equations (9) and (10) in terms of state dependent Ohm’s law. Consequently, the time-varying voltage-sensitive mixed ion channel can be substituted by a nonlinear resistor (A mixed ion channel is a nonlinear voltage-controlled resistor with conductance GI(m, h), where m and h are the functions of the voltage vI across the two-terminal element.), as depicted in the second element (from the left) in Figure 1b. To verify the voltage-sensitive mixed ion channel is a nonlinear resistor, an extensive numerical simulation for a sinusoidal input voltage source vI = 100sin(2πft) mV is performed for the three different frequencies, namely, f = 100 Hz, 200 Hz, and 1 KHz, respectively. Figure 2 shows the corresponding output nonlinear waveform on the current iI vs. voltage vI plane for these frequencies, confirming that the mixed ion channel exhibits the properties of a nonlinear resistor.

3.2. Voltage-Sensitive Potassium Ion Channel Memristor

Let us define the voltage across the voltage-sensitive potassium ion channel shown in the third (from left) element in Figure 1a as vK,V, and the current is iK,V. Then
V E K = v K , V
and the current entering the channel is
i K , V = G K , v ( n )   v K , V
where the memductance is given by
G K , V ( n ) = g K , V   n 4
and the state equation describing the channel in terms of n can be simplified from Equation (2) as
d n d t = f ( n ; v K , V ) = λ n 0.01 v K , V + E K + 20 1 e 0.1 v K , V + E K + 20 1 n   0.125   e v K , V + E K + 30 80 n
Note that Equations (17)–(19) are identical to the voltage-controlled generic memristor defined in Equations (9)–(10) with a first-order differential equation. Hence, the time-varying conductance shown in Figure 1a of the voltage-sensitive potassium ion channel is replaced with the voltage-sensitive potassium ion channel memristor, as shown in the third element (from left) in Figure 1b.
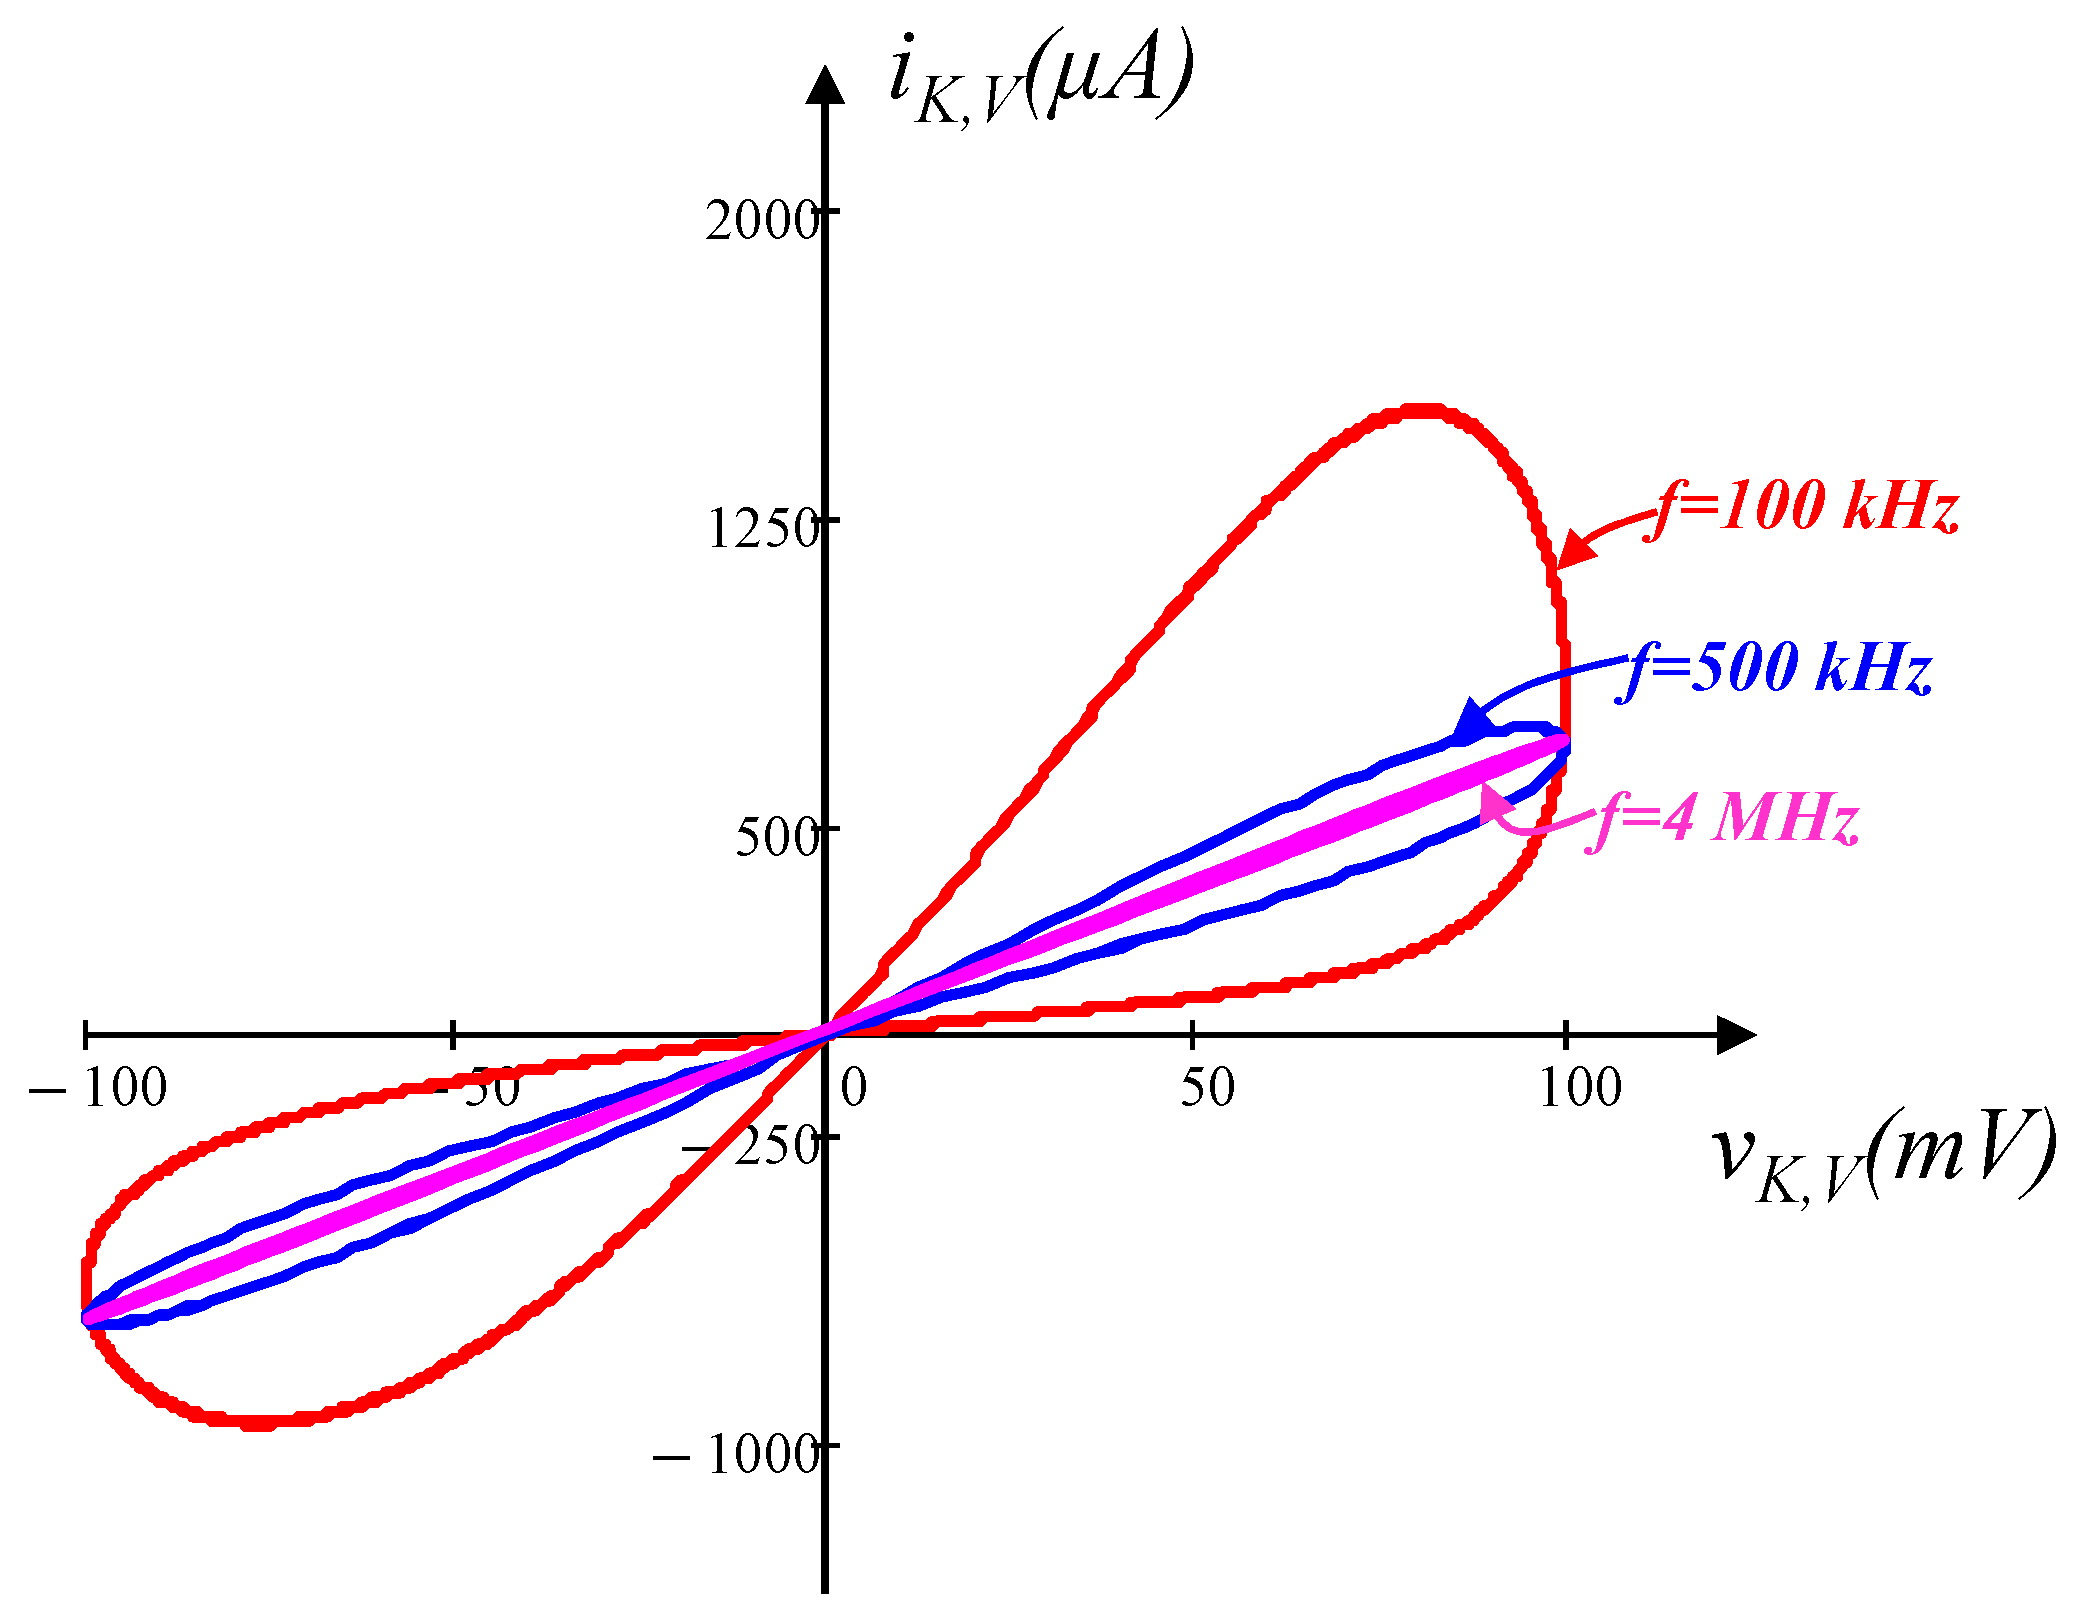
We observed the memristive fingerprint of the voltage-sensitive potassium ion channel memristor by applying a sinusoidal bipolar signal at different frequencies. This property asserts that beyond some frequency f*, the pinched hysteresis loops characterized by a memristor shrink to a single-valued function through the origin as frequency f > f* tends to infinity. To verify this property, a sinusoidal voltage source vK,V(t) = 100sin(2πft) mV is applied to the voltage-sensitive potassium ion channel with frequencies f = 100 KHz, 500 KHz, and 4 MHz, respectively. As shown in Figure 3, the zero-crossing pinched hysteresis loops shrink as the frequencies increase and tend to a straight line at 4 MHz, which confirms that the voltage-sensitive potassium ion channel is a generic memristor. All of these pinched hysteresis loops exhibit the fingerprints of a memristor [33].

3.3. Calcium-Sensitive Potassium Ion Channel Memristor

Let us consider the input voltage of the calcium-sensitive potassium ion channel. The fourth element (from left) in Figure 1a is vK,Ca (Since the same potential EK is shared by the voltage-sensitive potassium ion channel memristor and calcium-sensitive potassium ion channel memristor, the voltage assumed, V − EK = vK,V in Equation (16) and V − EK = vK,Ca in Equation (21), are identical. The voltages vK,V and vK,Ca are assumed to distinguish the input voltage applied to the voltage-sensitive potassium ion channel memristor and the calcium-sensitive potassium ion channel memristor, respectively.) and the current is iK,Ca. The current entering the channel is given by
i K , Ca = G K , Ca ( Ca ) v K , Ca
where
V E K = v K , C a
and the memductance of the calcium-sensitive potassium channel is given by
G K , C a ( C a ) = g K , Ca   C a 1 + C a
The state equation in terms of calcium concentration from Equations (3) and (5) is given by
d C a d t = f C a ; V K , Ca = ρ   m 3 h v K , C a + E K E C a + k C a C a
Observe that Equations (20)–(23) are examples of a voltage-controlled memristor defined in Equations (9)–(10) in terms of the calcium concentration channel Ca. Since only one state equation is defined in terms of Ca, we call this memristor a first-order calcium-sensitive potassium ion channel generic memristor. Therefore, the time-varying calcium-sensitive potassium ion channel is replaced with a calcium-sensitive potassium ion channel memristor, as shown in the fourth element (from left) in Figure 1b.
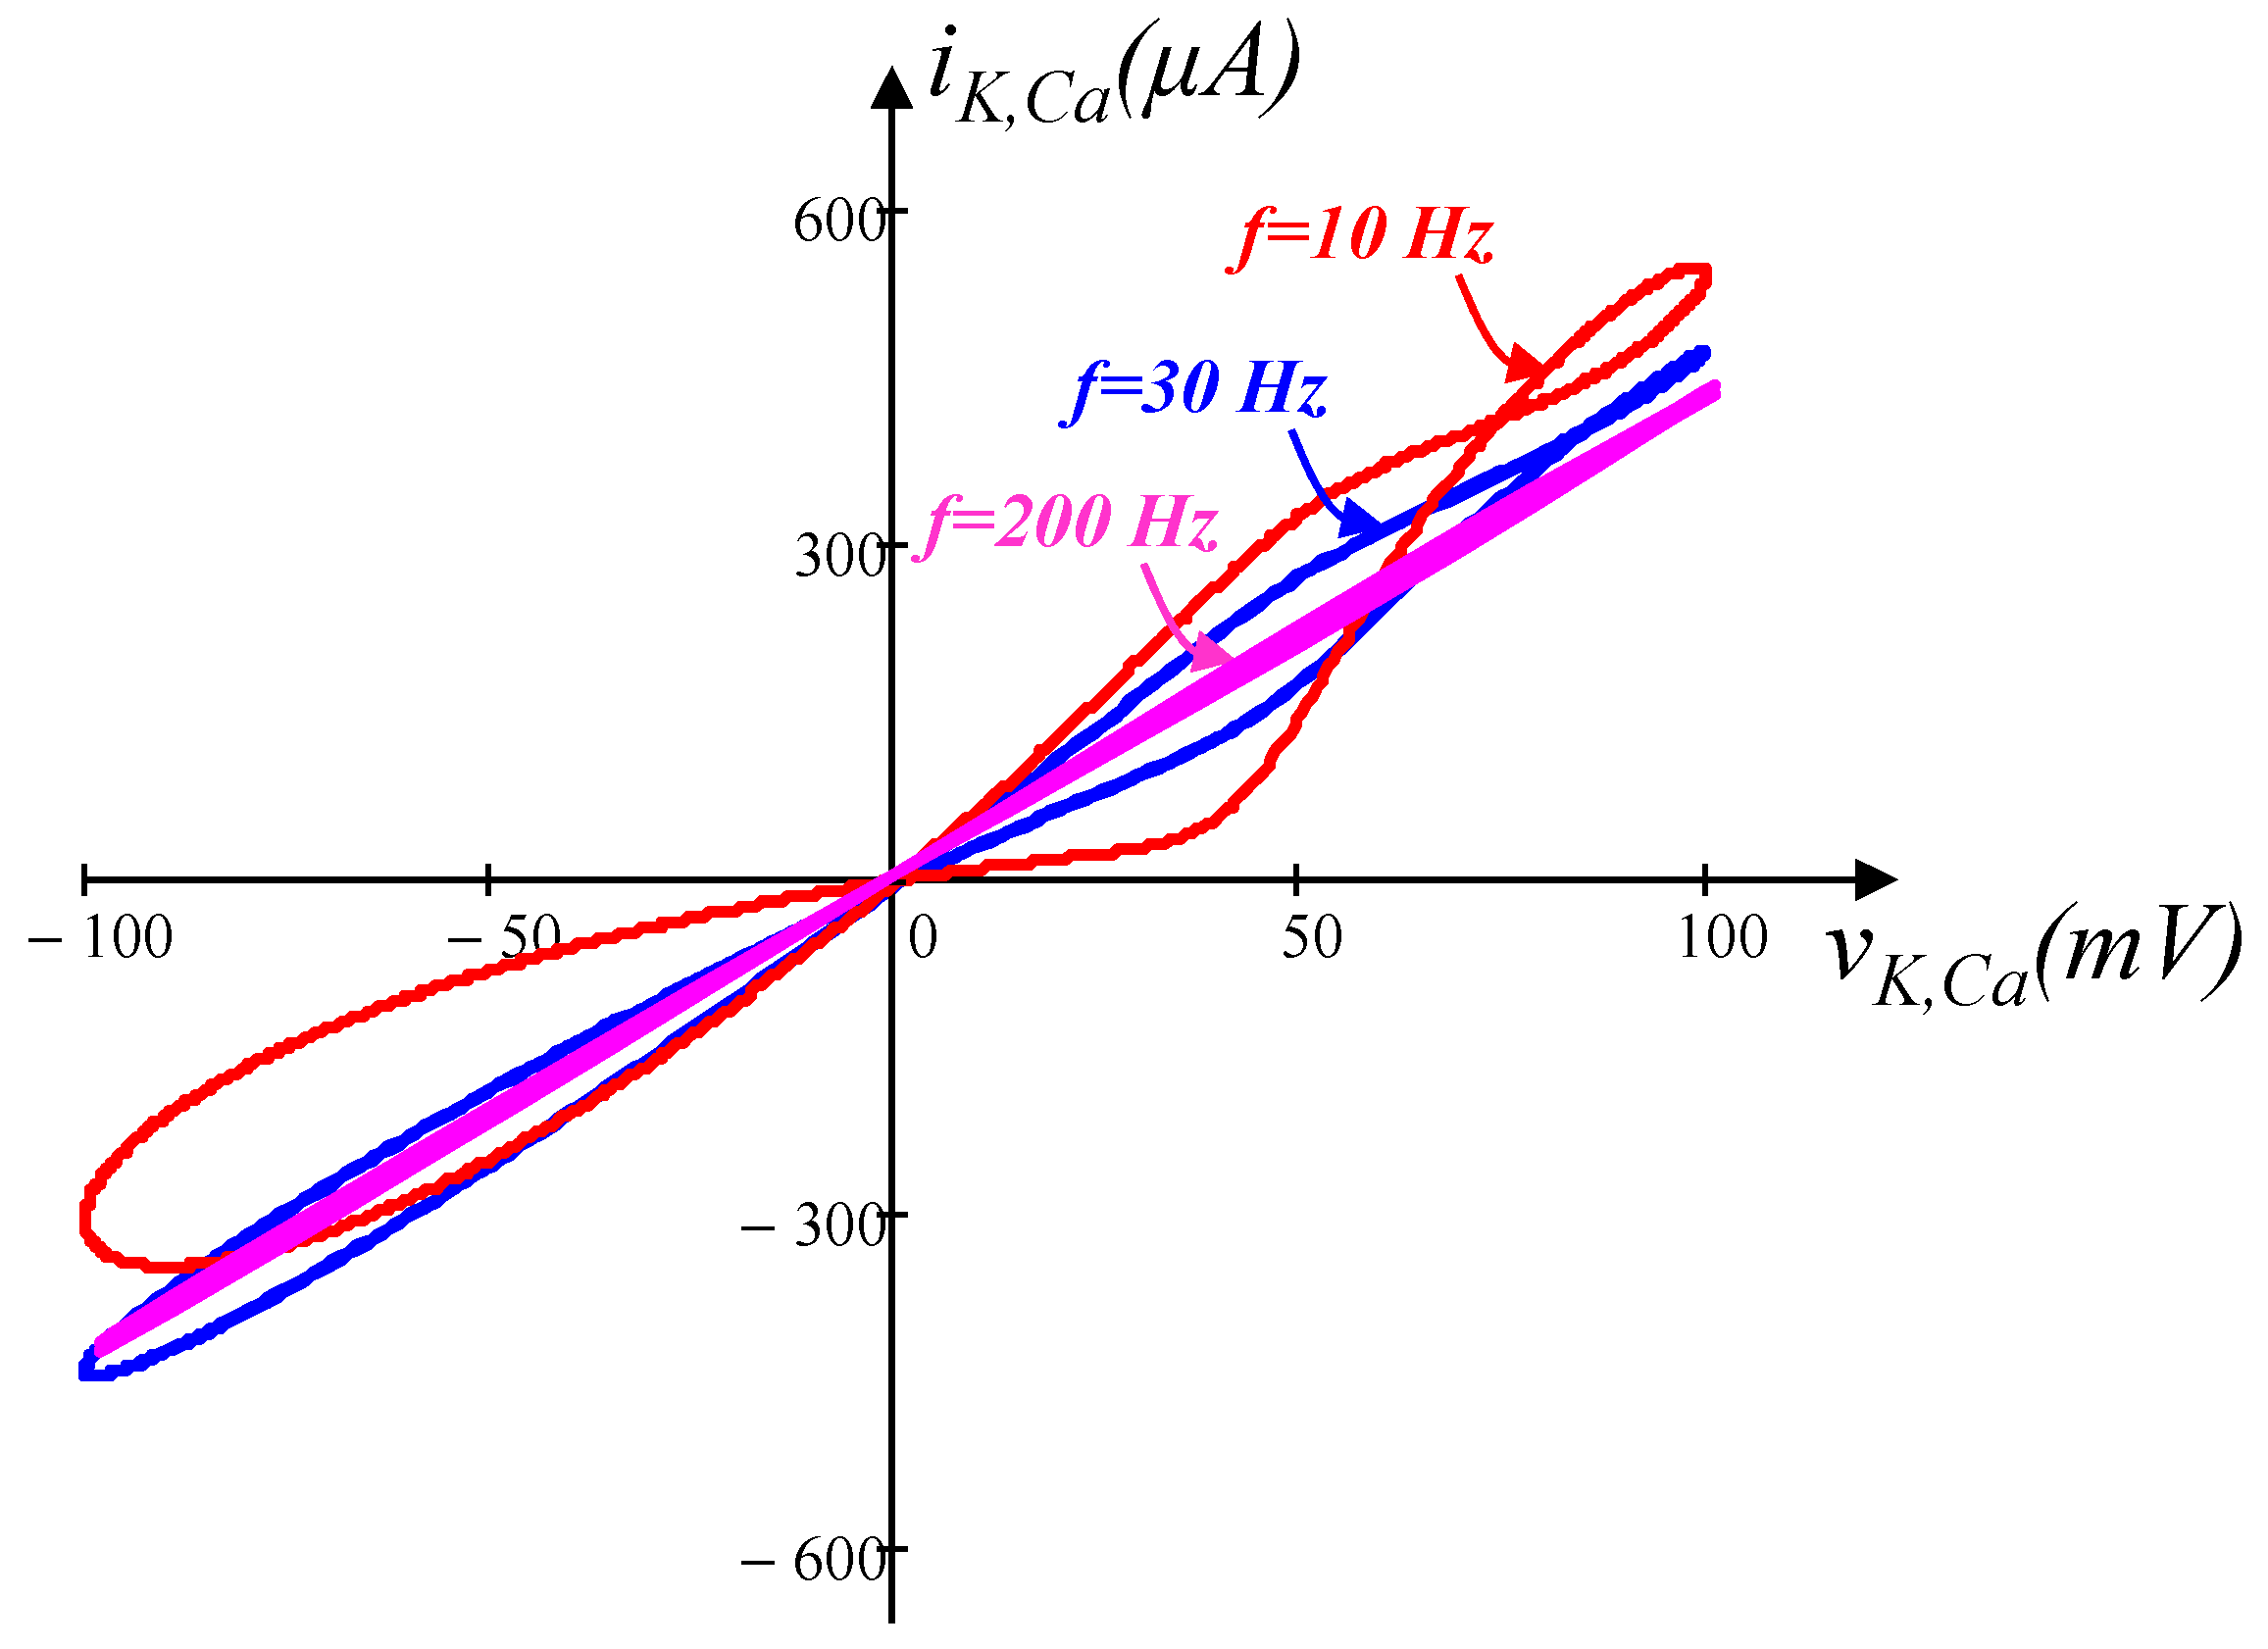
Let us verify the fingerprint of the frequency-dependent pinched hysteresis loops of the calcium-sensitive potassium ion channel by applying the sinusoidal voltage source vKCa(t) = 100sin(2πft) mV with frequencies f = 10 Hz, 30 Hz, and 200 Hz, respectively. Observe from Figure 4 that all the zero-crossing pinched hysteresis loops shrink as the frequencies of the input signal increases and tend to a straight line for the frequency f = 200 Hz. All of the pinched hysteresis fingerprints confirm that the calcium-sensitive potassium ion channel is a generic memristor.

4. DC Analysis of the Memristive Chay Model of an Excitable Cell

The primary objective of analyzing the DC behavior of the memristive Chay model is to identify the equilibrium points of the nonlinear equations. These equilibrium points represent the steady-state solutions obtained by equating the rate of change of equilibrium voltage Vm, gate activation n of the voltage-sensitive potassium ion channel memristor, and concentration of calcium-sensitive Ca of the calcium-sensitive potassium ion channel memristor to zero from Equations (1), (2), and (3), respectively. By determining these equilibrium points, insights can be gained into the behavior of the excitable cell under different conditions, such as varying input stimuli or parameter values, and can be expressed as a function of current I as follows:
n = n   ( V m ) n ^ ( V m )
C a = C a   ( V m ) C a ^ ( V m )
I = g I   m 3 h V m E I + g K , V   n ^ 4 V m E K + g K , C a   C a ^ 1 + C a ^ V m E K + g L   V m E L
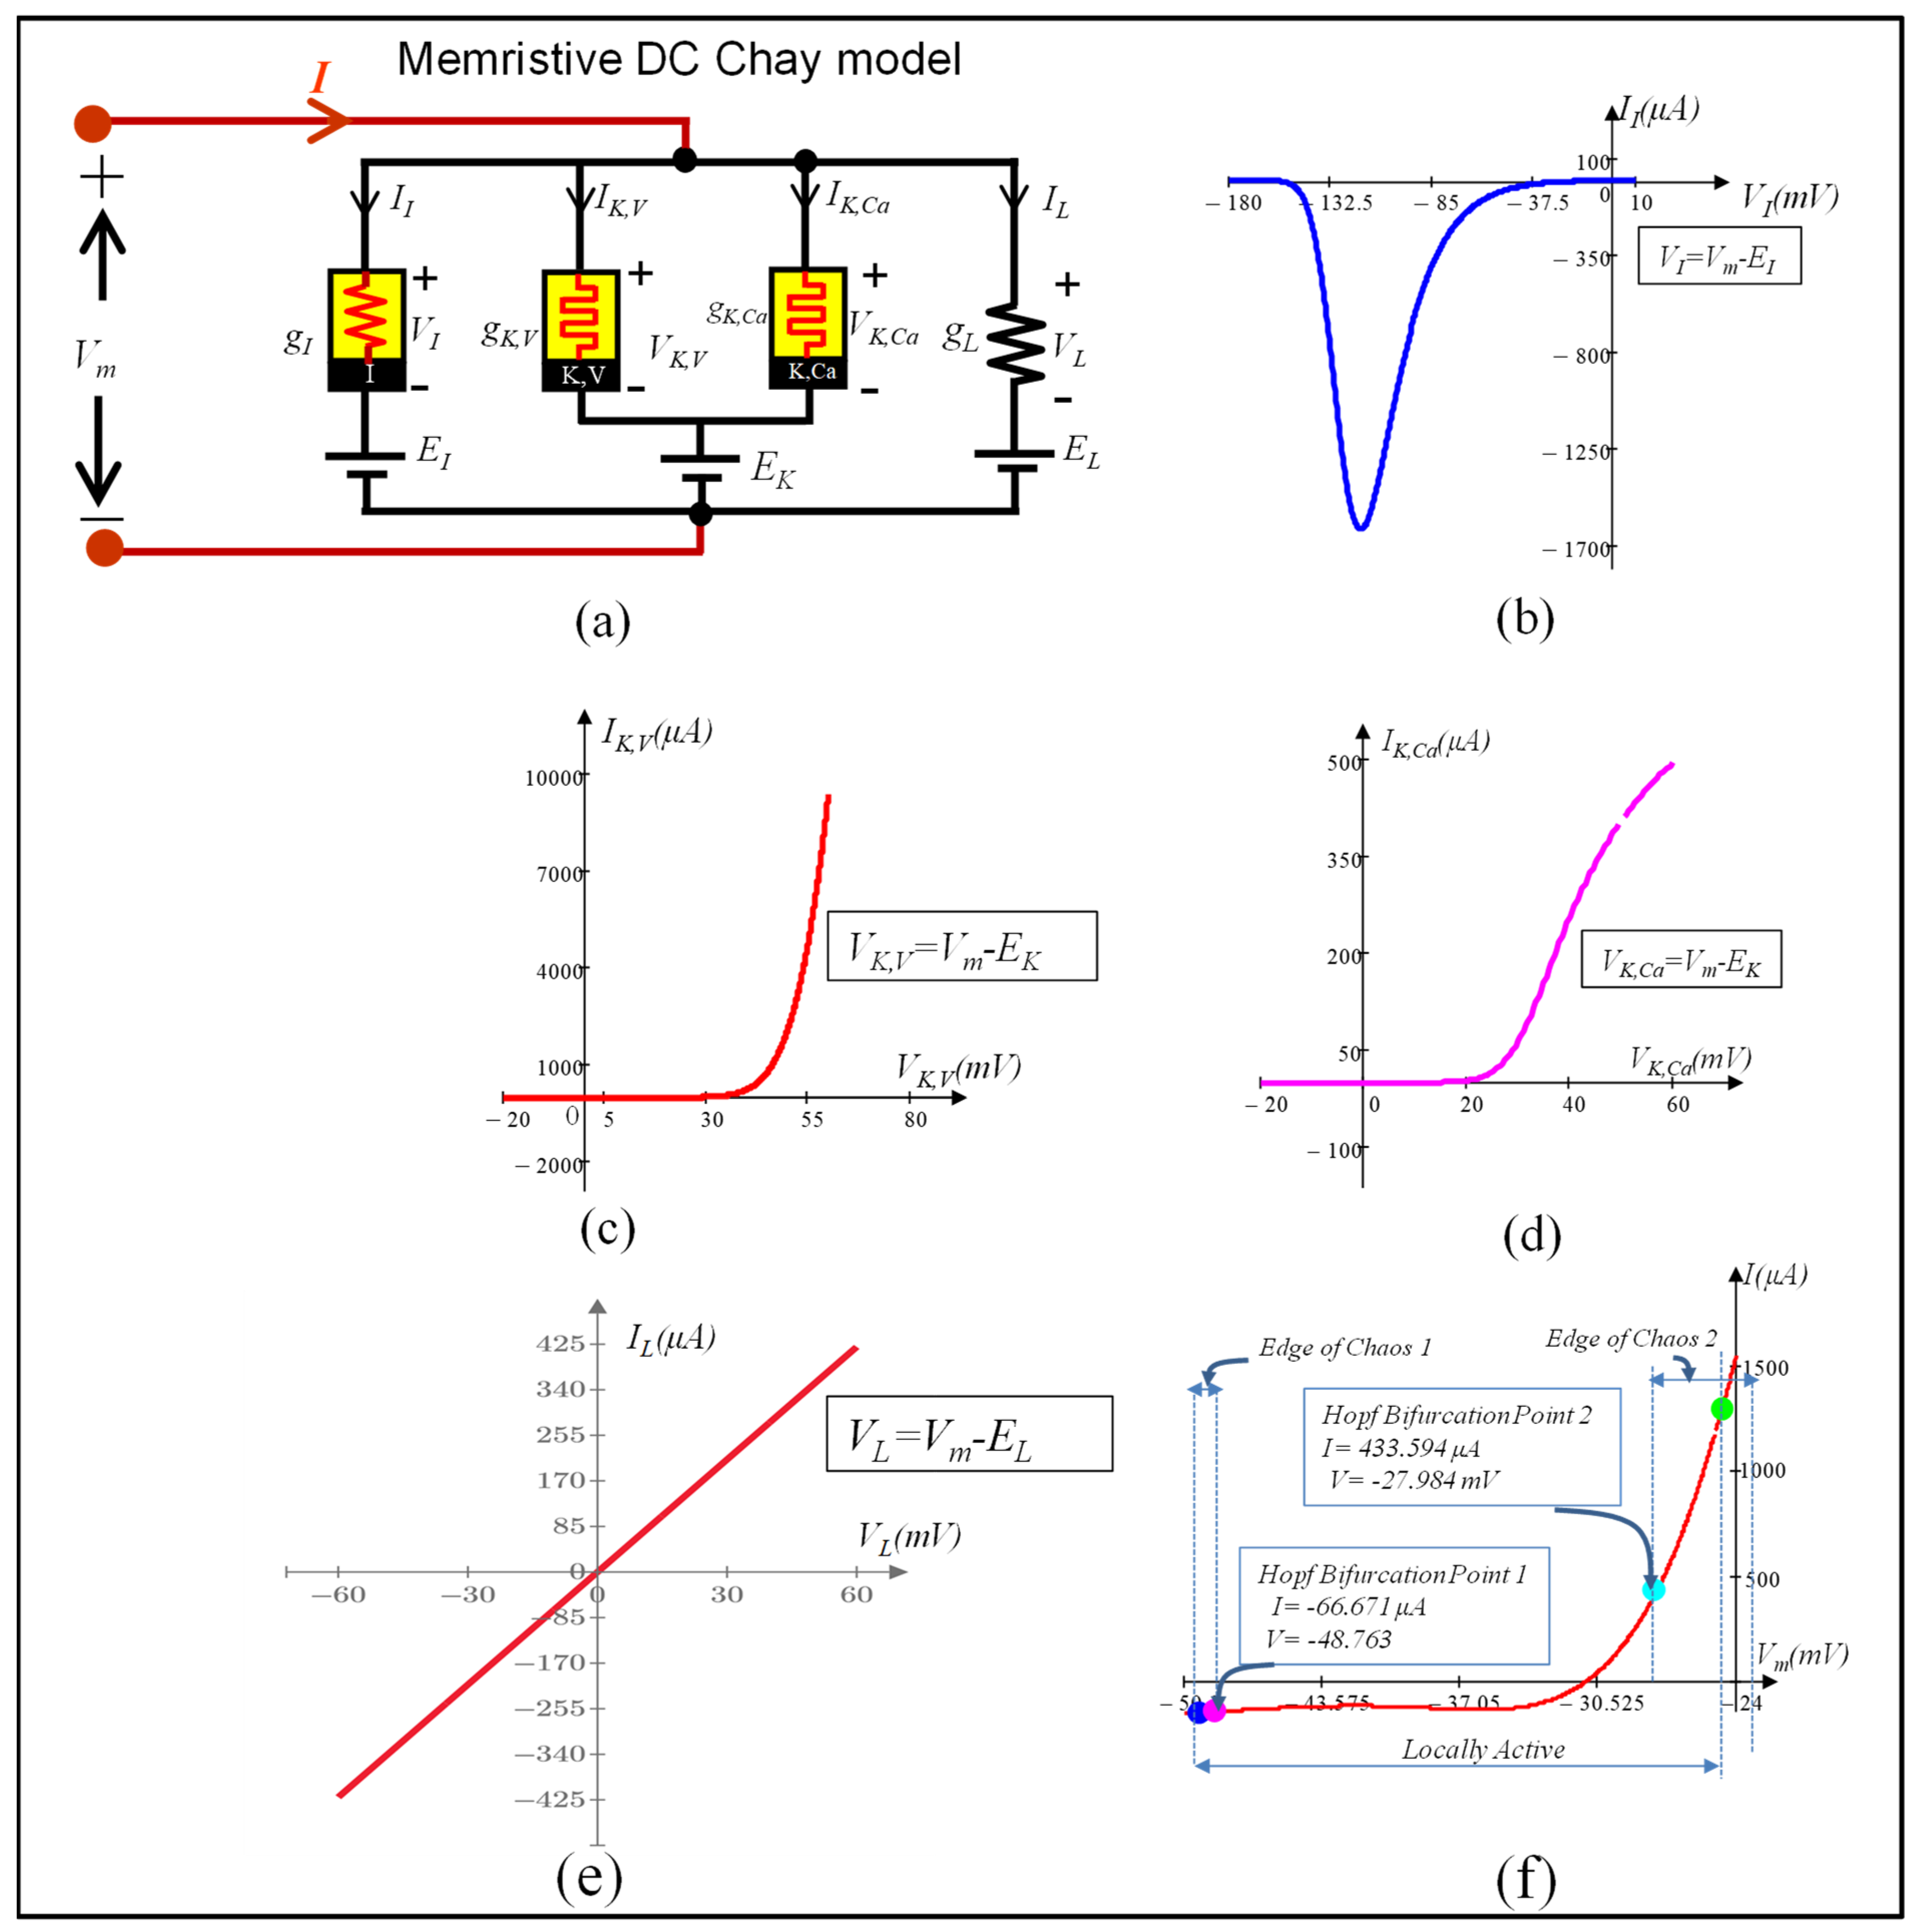
The external current I expressed as the function of membrane voltage Vm in Equation (26) gives the explicit formula of the DC V-I curve of the memristive Chay model. We have plotted the individual DC V-I curves of the voltage-sensitive mixed ion channel non-linear resistor, voltage-sensitive potassium ion channel memristor, calcium-sensitive potassium ion channel memristor, and leakage channel at equilibrium voltages VI, VK,V, VK,Ca and VL, as shown in Figure 5b, Figure 5c, Figure 5d, and Figure 5e, respectively. Figure 5f shows the DC V-I curve of Figure 5a over the range of DC voltage −50 mV < Vm < −24 mV. For any DC value of Vm, we calculated the corresponding value of I as the vertical axis. Our extensive calculations show that the two Hopf bifurcation points occur at Vm = −48.763 mV (resp., I = −66.671 µA) and Vm = −27.984 mV (resp., I = 433.594 µA), respectively. Details of these two bifurcation points will be discussed in upcoming section.

5. Small-Signal Circuit Model

The small-signal equivalent circuit is a linearized method to predict the response of electronic circuits when a small input signal is applied to an equilibrium point Q. The objective of this section is to analyze the small-signal response of a voltage-sensitive mixed ion channel nonlinear resistor, a voltage-sensitive potassium ion channel memristor, and a calcium-sensitive potassium ion channel memristor using Taylor series expansion and Laplace transformation.

5.1. Small-Signal Circuit Model of the Mixed Ion Channel Nonlinear Resistor

The small signal equivalent circuit of the mixed ion channel nonlinear resistor at an equilibrium point QI (The equilibrium point QI at vi = VI is obtained by solving Equation (12)) on the DC VI-II curve is derived as follows:
v I = V I Q I + v I
i I = I I Q I + i I
Applying Taylor series expansion to the voltage-sensitive mixed ion channel nonlinear resistor defined in Equations (27) and (28) at the DC operating point QI, we get
i I = f ( V I + δ v I ) = a 00 ( Q I ) + a 12 ( Q I ) δ v I + h . o . t . = I I ( Q I ) + δ i I
where h.o.t denotes higher-order terms and coefficients can be computed as
a 00 ( Q I ) = G I Q I V I ( Q I ) = I I ( Q I )
a 12   ( Q I ) = f ( v I ) v I
Linearize Equation (29) by neglecting the h.o.t. then
δ i I = a 12 ( Q I ) δ v I
Taking the Laplace transform of Equation (32), we obtain
i ^ I ( s ) = a 12 ( Q I ) v ^ I ( s )
The admittance YI(s; QI) of the small-signal equivalent circuit of the voltage-sensitive mixed ion channel nonlinear resistor at the DC operating point QI is given by
Y I ( s ; Q I ) = i ^ I ( s ) v ^ I ( s ) = a 12 ( Q I ) = 1 1 a 12 ( Q I ) = 1 R 1 I
where
R 1 , I = 1 / a 12 ( Q I )
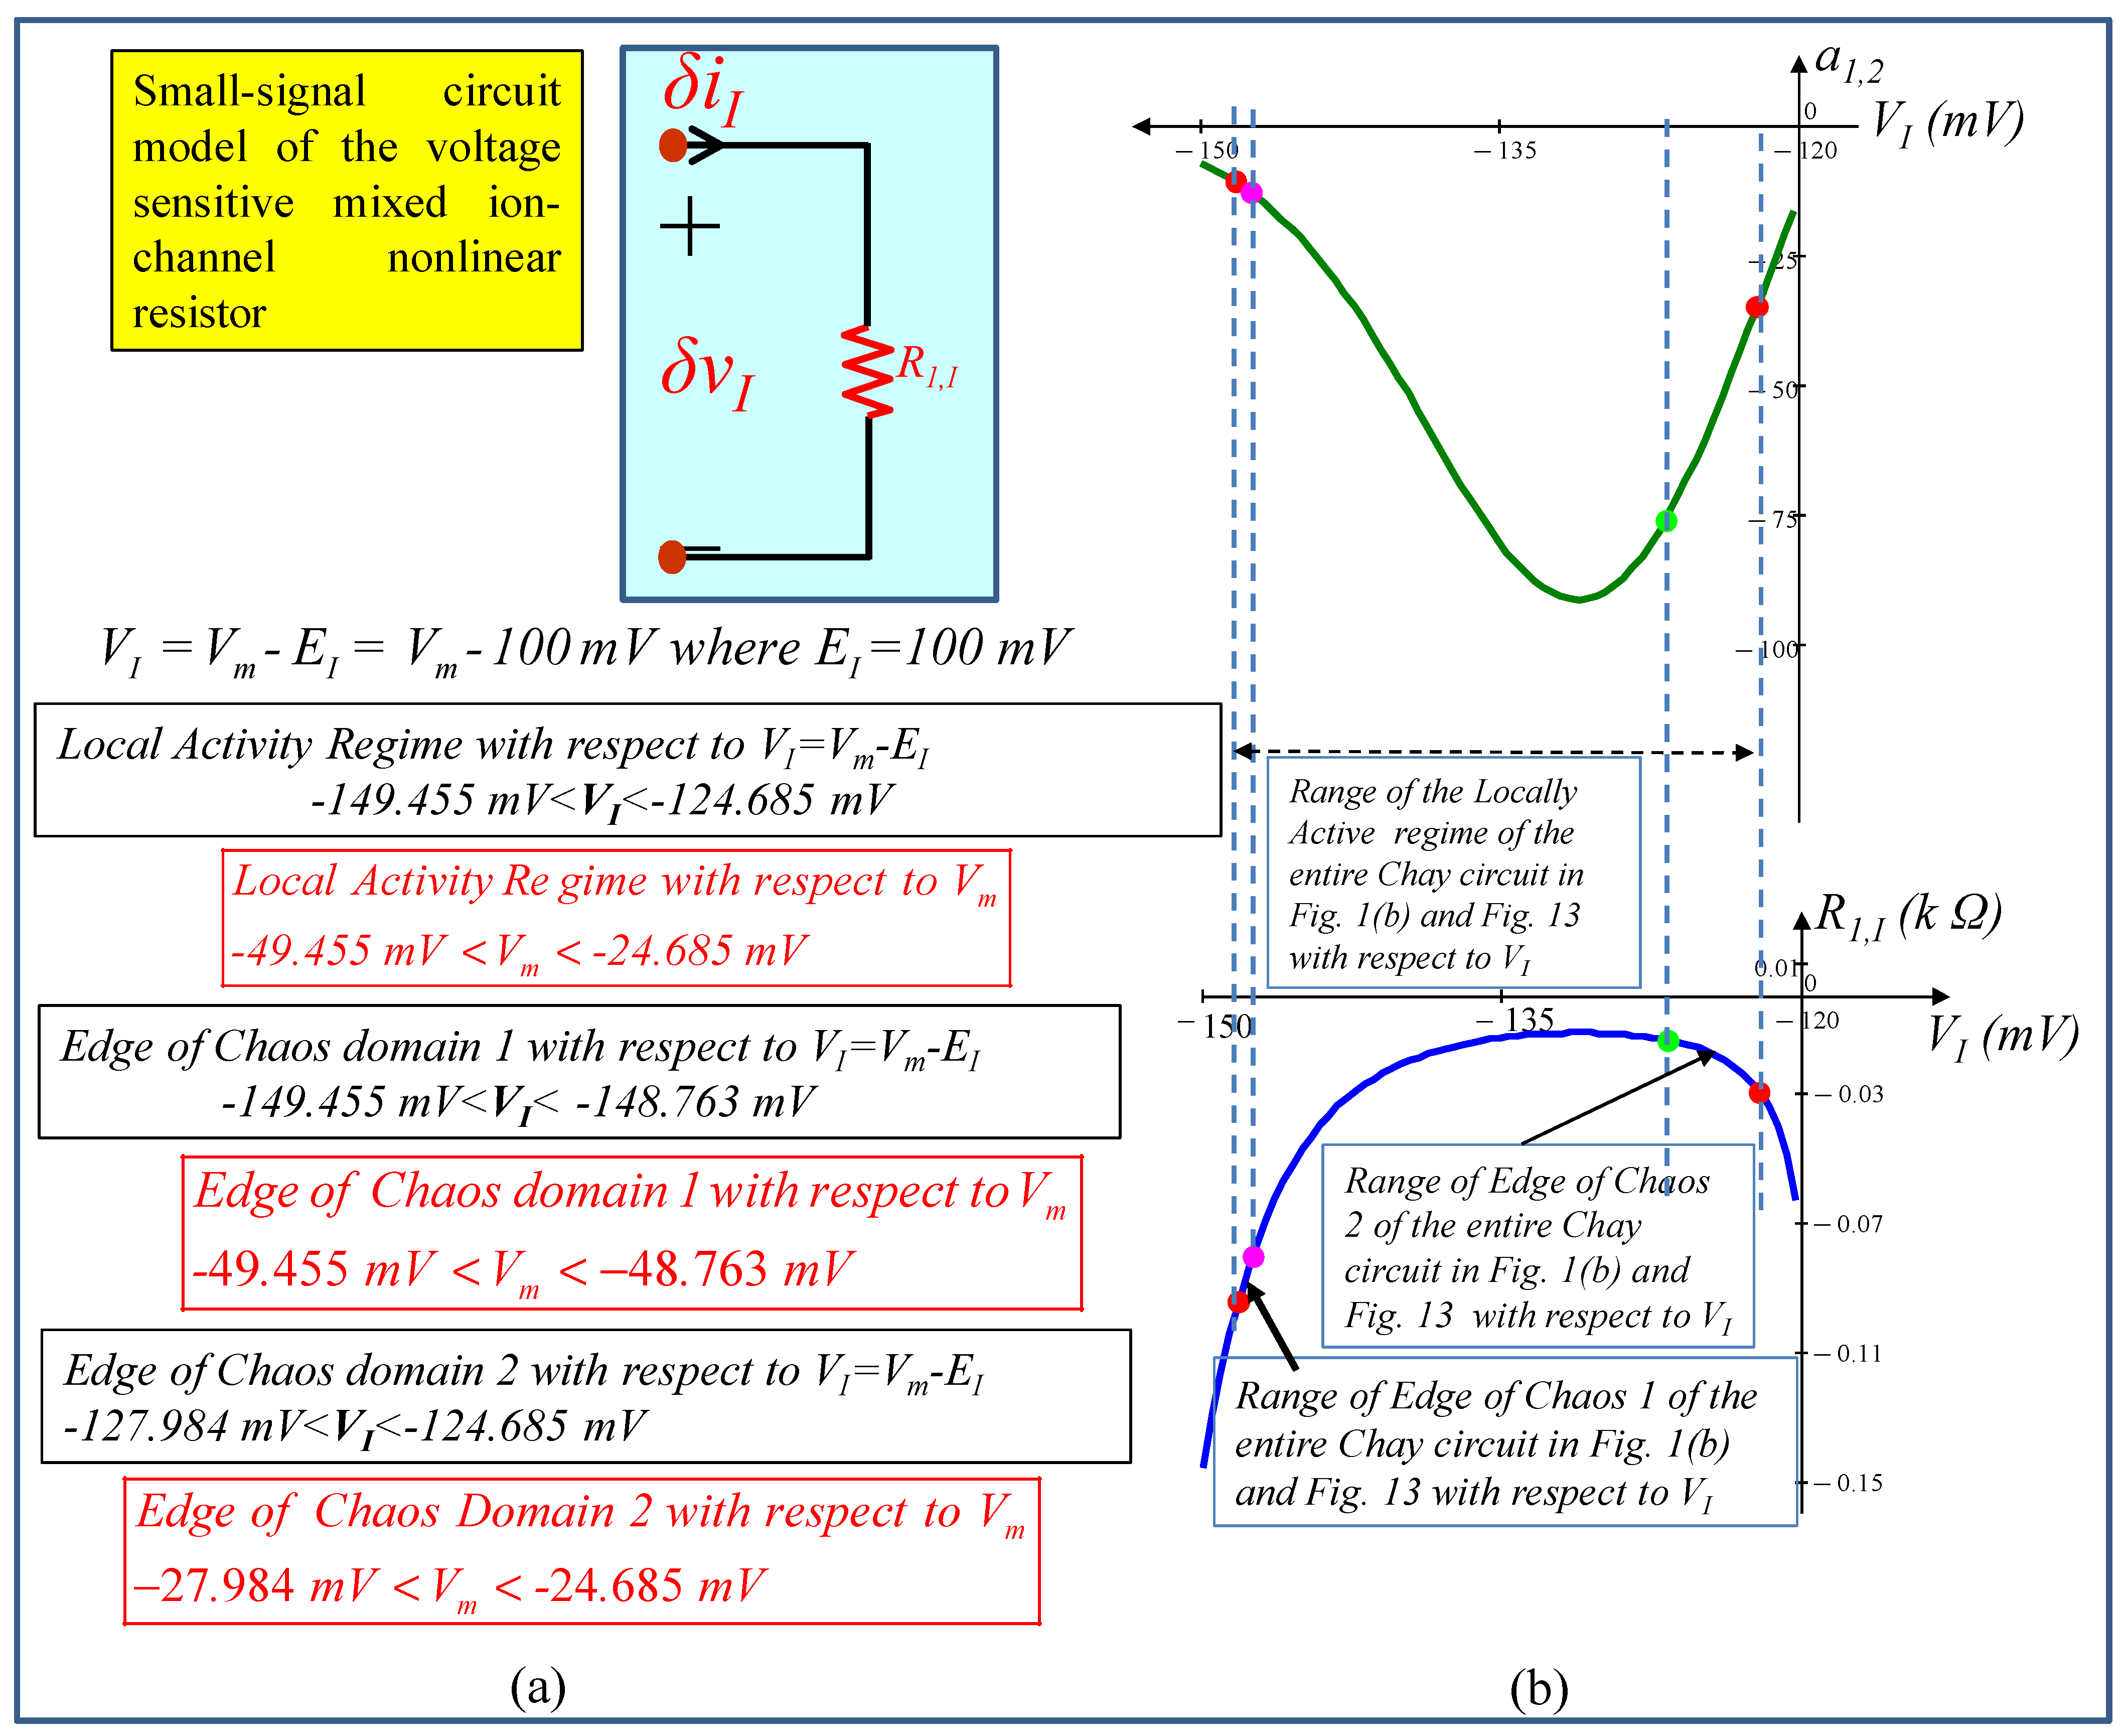
From Equation (34), it is clear that the small-signal admittance function of the mixed ion channel nonlinear resistor is equivalent to that of a linear resistor. The corresponding small-signal equivalent circuit and a plot of the coefficients a12(QI) and resistance R1,I as a function of the DC equilibrium voltage VI = VmEI, where EI = 100 mV, are shown in Figure 6a and Figure 6b, respectively. The explicit formulas for computing coefficient a12(QI) are given in Figure 7 for readers’ convenience.

5.2. Small-Signal Circuit Model of the Voltage-Sensitive Potassium Ion Channel Memristor

The small-signal circuit model of the voltage-sensitive potassium ion channel memristor at an equilibrium point QK,V (The equilibrium point QK,V at vK,V = VK,V is obtained from Equation (19) by solving f(n; VK,V) = 0 for n = nK,V. The explicit formula for n(VK,V) is given in Figure 11) on the DC VK,V-IK,V curve is derived by defining
n = n Q K , V + δ n
v K , V = V K , V ( Q K , V ) + δ v K , V
i K , V = I K , V ( Q K , V ) + δ i K , V
Expanding i K , V = G K , V ( n ) v K , V from Equation (17) in a Taylor series about the equilibrium point (N(QK,V), VK,V(QK,V)), we obtain
i K , V = a 00 ( Q K , V ) + a 11   ( Q K , V )   δ n + a 12 ( Q K , V )   δ v K , V + h . o . t .             = I K , V ( Q K , V ) + δ i K , V
where
δ n = n n Q K , V
  δ v K , V = v K , V V K , V ( Q K , V )
δ i K , V = i K , V I K , V ( Q K , V )
and
a 00 ( Q K , V ) = G K , V Q K , V V K , V ( Q K , V ) = I K , V ( Q K , V )
a 11 ( Q K , V ) = V K , V ( Q K , V ) G K , V n Q K , V
a 12 ( Q K , V ) = G K , V n Q K , V
and h.o.t denotes the higher-order terms. Let us linearize the nonlinear equation by neglecting the h.o.t. in Equation (39), then:
δ i K = a 11 ( Q K , V ) δ n + a 12 ( Q K , V ) δ v K , V
Similarly, expanding the state equation f n K , V , V K , V in Equation (19) using a Taylor series about the equilibrium point (n(QK,V), VK,V(QK,V)), we obtain
f ( n Q K , V + δ n , V K , V ( Q K , V ) + δ v K , V ) = f ( n Q K , V , V K , V ( Q K , V ) ) + b 11 ( Q K , V ) δ n + b 12 ( Q K , V ) δ v K , V + h . o . t .
where
b 11 ( Q K , V ) = f n n , v K , V n Q K , V
b 12 ( Q K , V ) = f N n , v K , V v K , V Q K , V
Linearizing the nonlinear state Equation (47) by neglecting the h.o.t., we get
d n d t = b 11 ( Q K , V ) δ n + b 12 ( Q K , V ) δ v K , V
Taking Laplace transform of Equations (46) and (50), we obtain
i ^ K , V ( s ) = a 11 ( Q K , V ) n ^ ( s ) + a 12 ( Q K , V ) v ^ K , V ( s )
s   n ^ ( s ) = b 11 ( Q K , V ) n ^ ( s ) + b 12 ( Q K , V ) v ^ K , V ( s )
Solving Equation (52) for n ^ ( s ) and substituting the result into Equation (51), we obtain the following admittance YK,V(s; QK,V) for the small-signal equivalent circuit of the voltage-sensitive potassium ion channel memristor at equilibrium point QK,V:
Y K , V ( s ; Q K , V ) = i ^ K , V ( s ) v ^ K , V ( s ) = 1   s a 11   ( Q K , V ) b 12 ( Q K , V )   b 11 ( Q K , V ) a 11   ( Q K , V ) b 12 ( Q K , V ) + 1 1 a 12 ( Q K , V )
Y K , V s ; Q K , V = 1   s L K , V + R 1 K , V   + 1 R 2 K , V
where   L K , V 1 a 11   ( Q K , V   ) b 12   ( Q K , V   )  
R 1 K , V b 11 ( Q K , V ) a 11   Q K , V   b 12   ( Q K , V )
R 2 K , V 1 a 12   ( Q K , V )
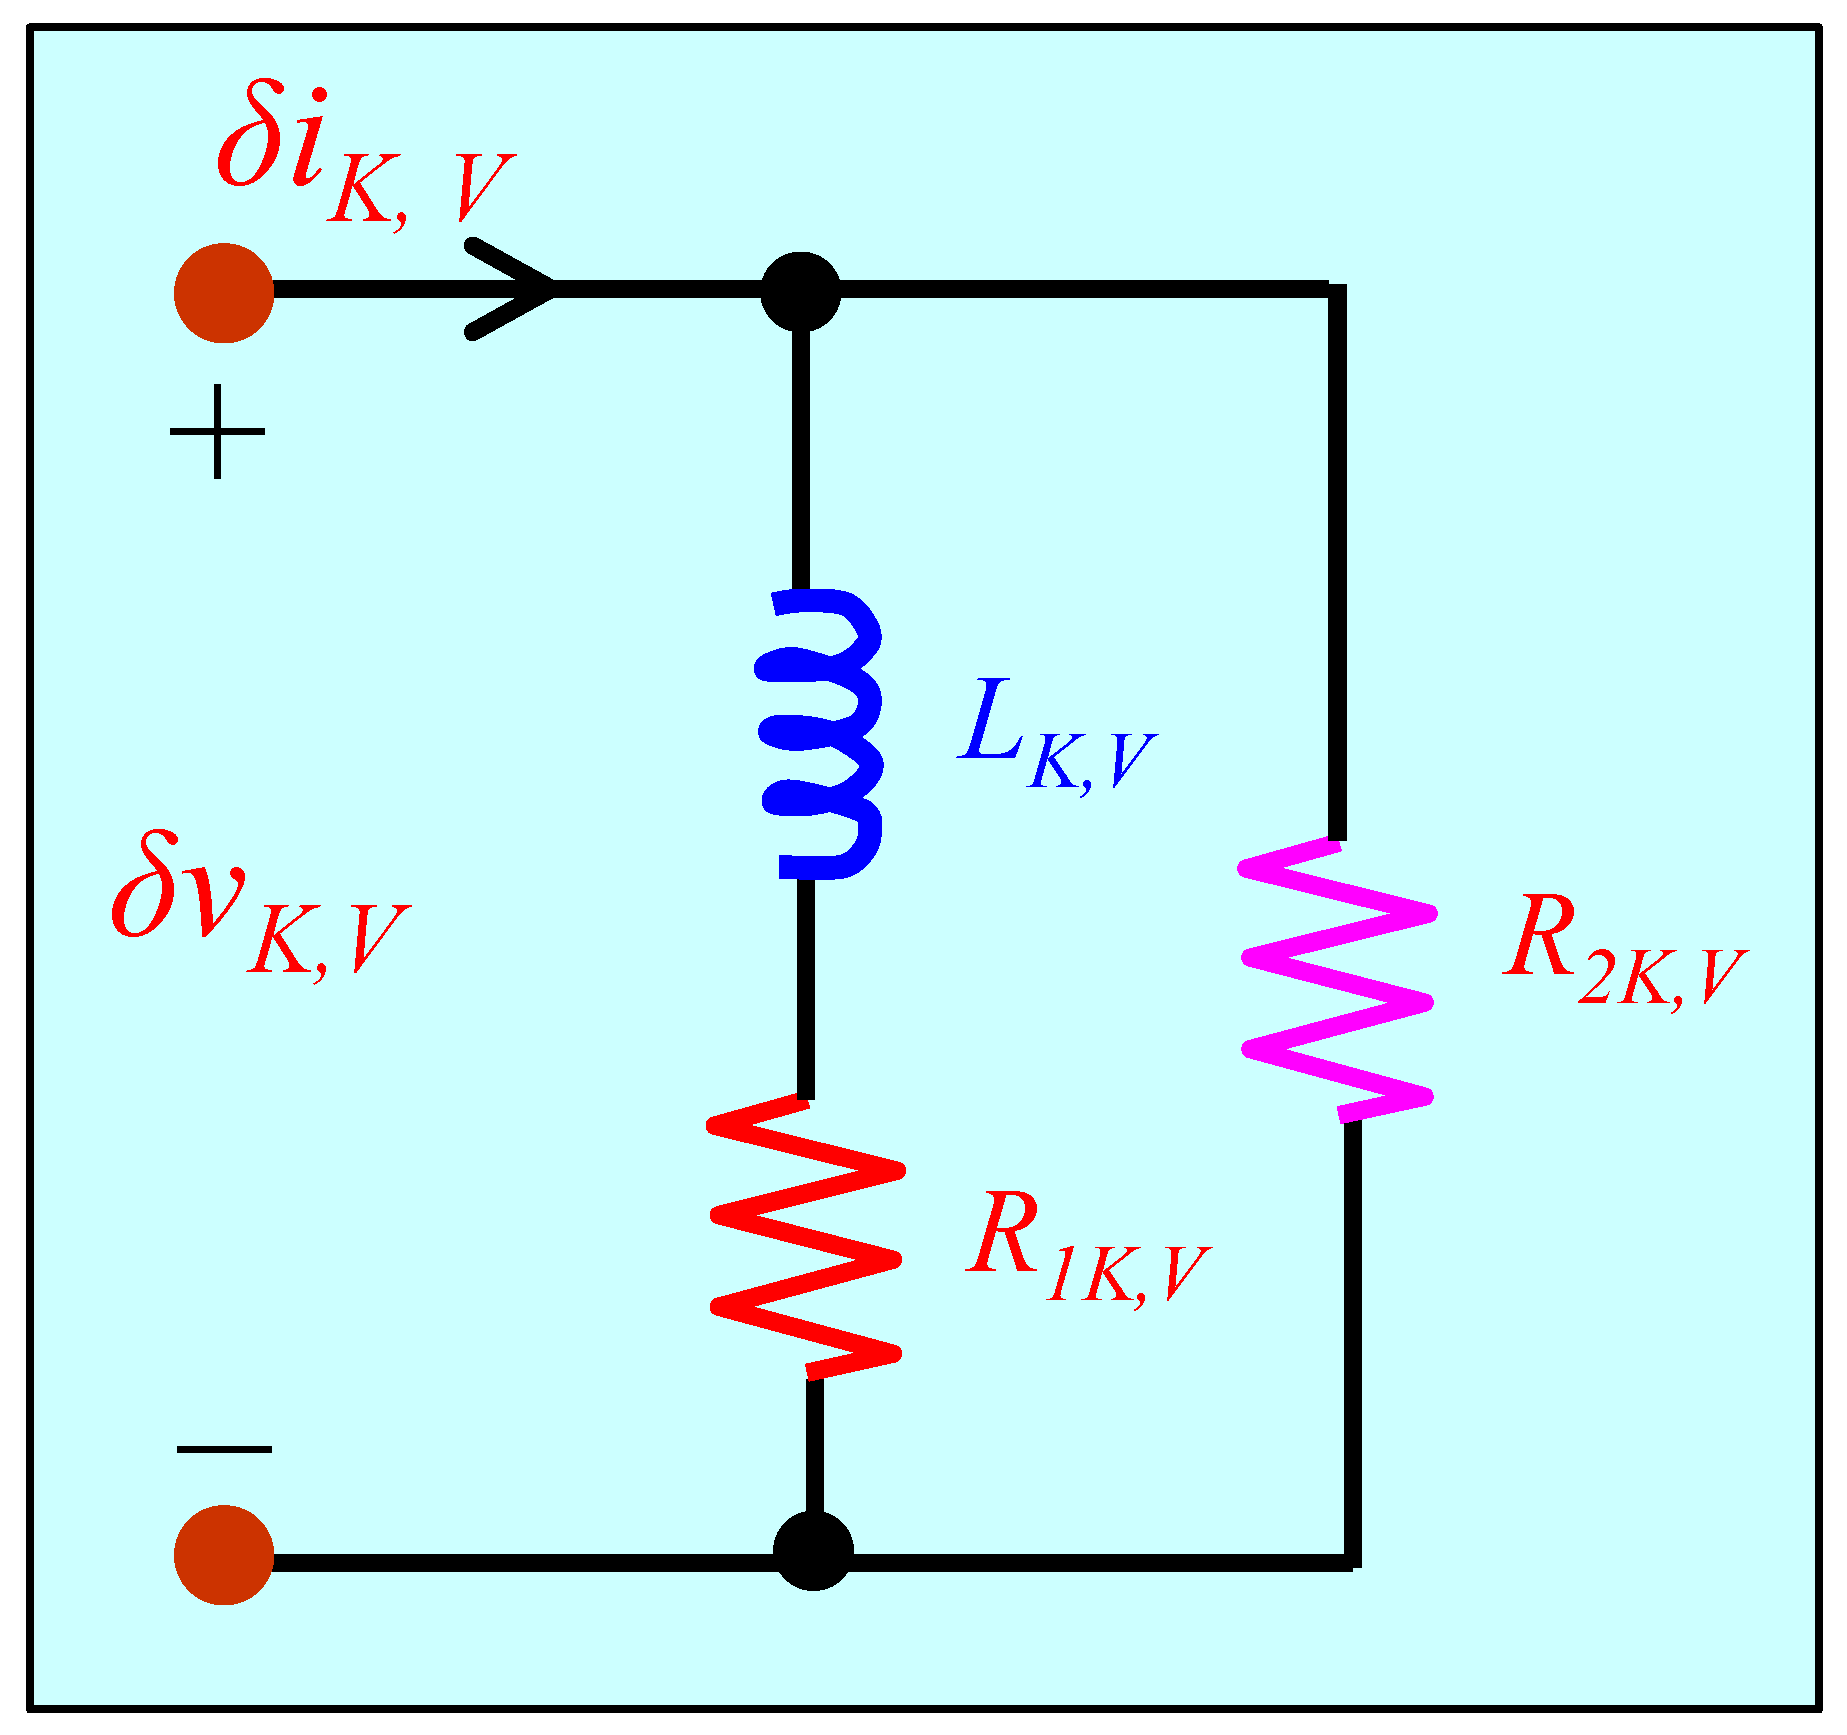
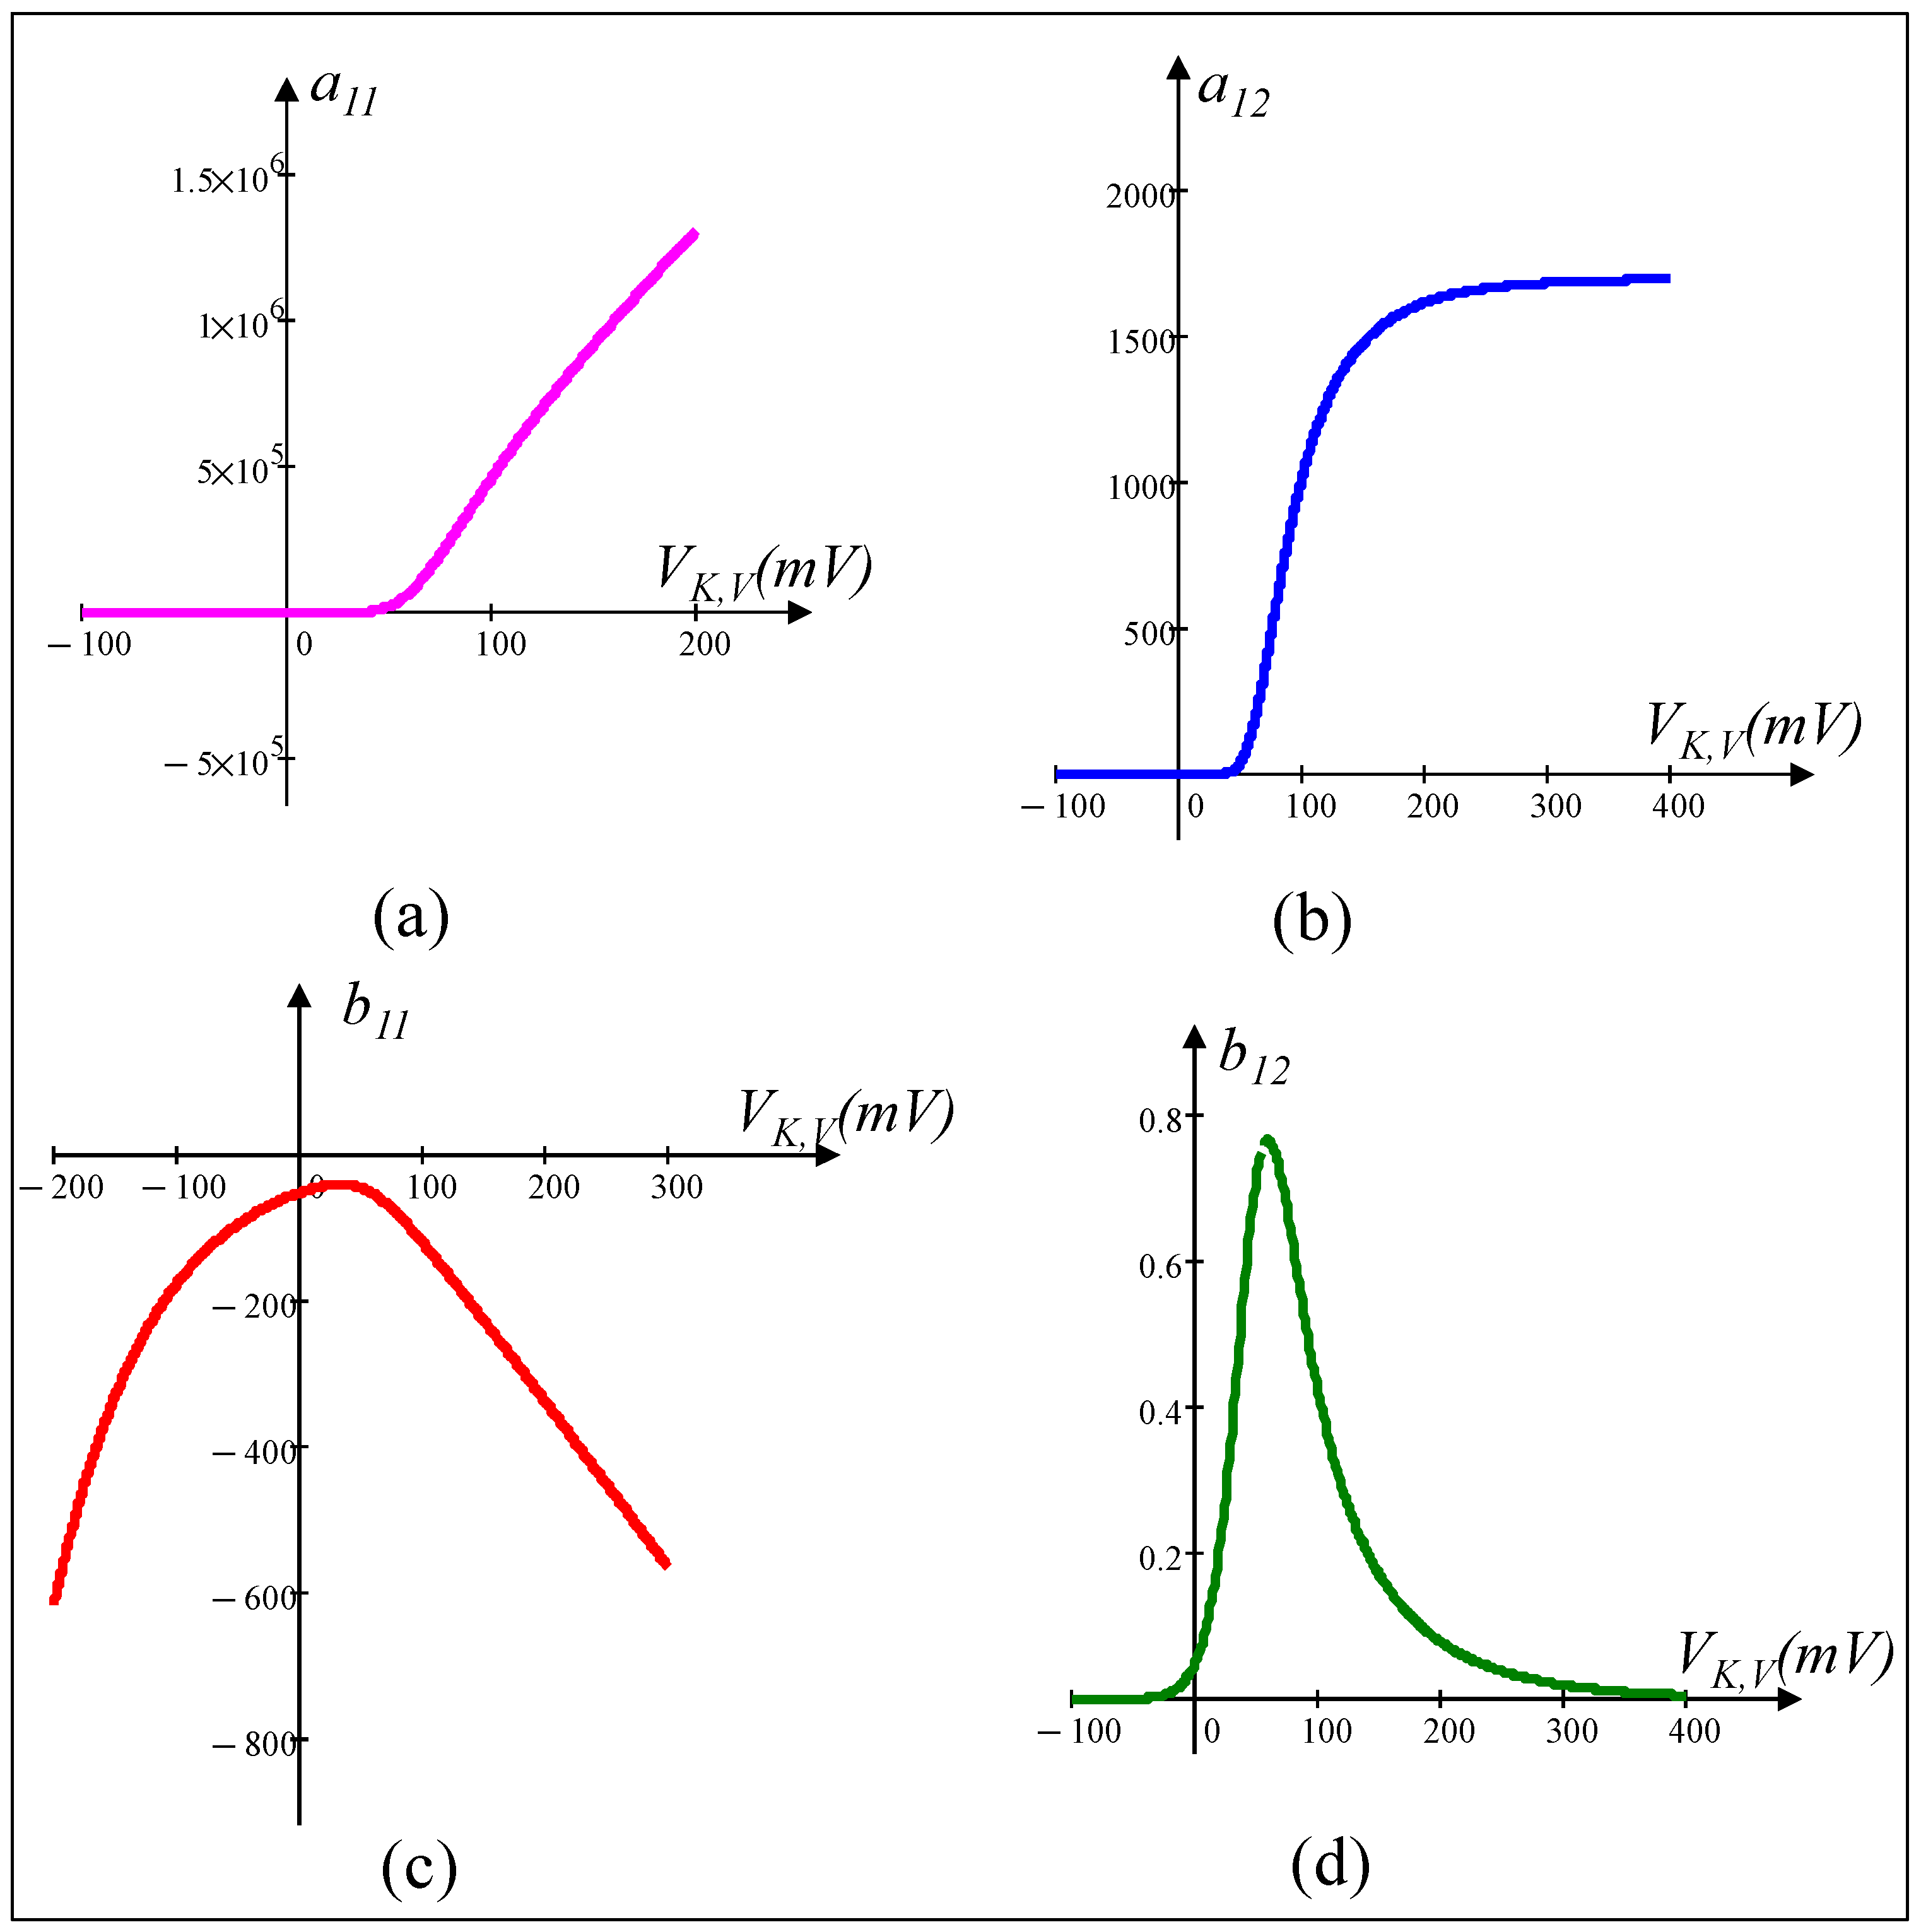
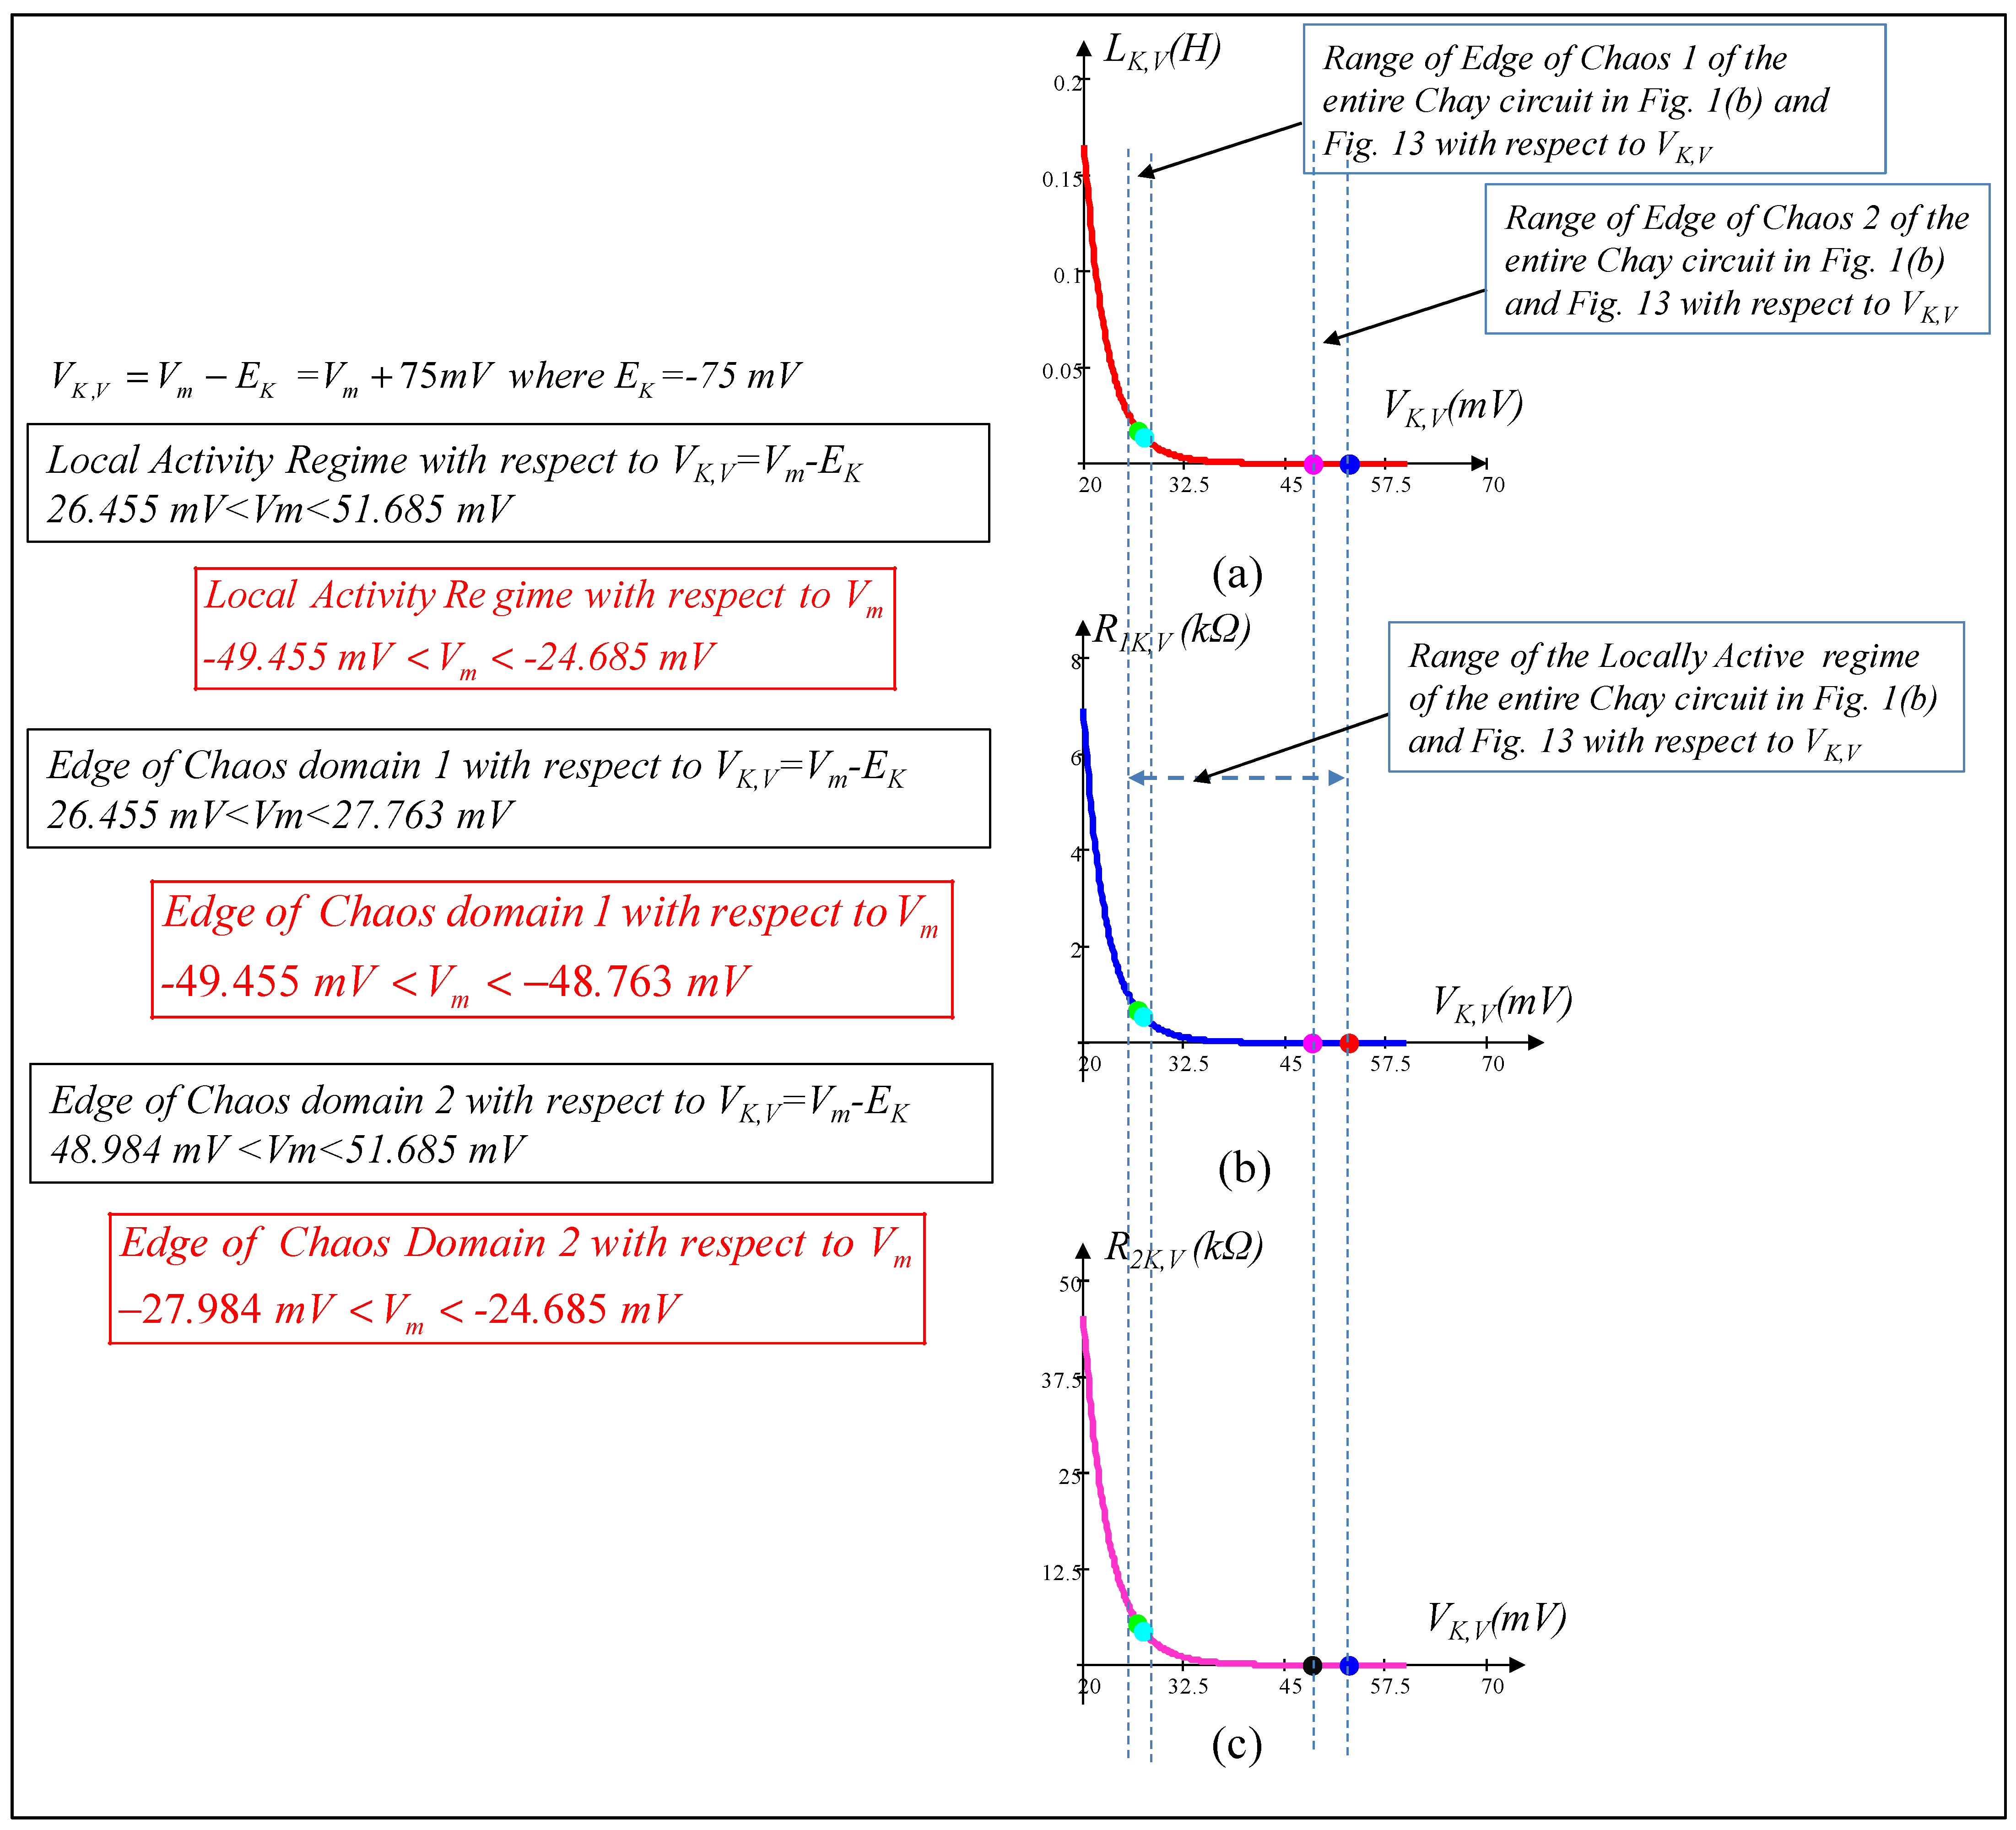
It follows from Equations (55)–(57) that the small-signal admittance function of the first-order voltage-sensitive potassium ion channel memristor is equivalent to the series connection of an inductor and a resistor in parallel with another resistor, as shown in Figure 8. The corresponding coefficients a11, a12, b11, b12, inductance LK,V, resistance R1K,V, and resistance R2K,V as a function of the DC equilibrium voltage VK,V = VmEK, where EK = −75 mV are shown in Figure 9 and Figure 10, respectively. Please note that the local activity, edge of chaos 1, and edge of chaos 2, shown in Figure 10a–c, are not the local activity and edge of chaos domains of the separate two terminals of the voltage-sensitive potassium ion channel memristor. The small signal positive inductance and resistances (i.e., LK,V > 0, R1K,V > 0, and R2K,V > 0) of the potassium ion channel memristor observed over the local activity, edge of chaos 1 and edge of chaos 2 regime are just the corresponding range of the voltage with respect to VK,V of the entire connected Chay small-signal equivalent circuit of Figure 1b and Figure 16. For the readers’ convenience, the explicit formulas for computing the coefficients a11(QK,V), a12(QK,V), b11(QK,V), b12(QK,V), and LK,V, R1K,V, and R2K,V are summarized in Figure 11.

5.3. Small-Signal Circuit Model of the Calcium-Sensitive Potassium Ion Channel Memristor

The small-signal circuit model of the calcium-sensitive potassium-channel memristor at an equilibrium point QK,Ca (The equilibrium point QK,Ca at vK,Ca = VK,Ca is obtained from Equation (23) by solving f(Ca; VK,Ca) = 0 for Ca = CaK,Ca. The explicit formula for Ca(VK,Ca) is given in Figure 15.) in the DC VK,Ca-IK,Ca curve is derived by defining
C a = C a Q K , C a + δ C a
v K , C a = V K , C a ( Q C a ) + δ v K , C a
i K , C a = I K , C a ( Q K , C a ) + δ i K , C a
Expanding i K , C a = G K , C a ( Ca )   v K , C a from Equation (20) in a Taylor series about the equilibrium point (Ca(QK.Ca), VCa(QK,Ca)), we obtain
i K , C a = a 00 ( Q K , C a ) + a 11   ( Q K , C a )   δ C a + a 12 ( Q K , C a )   δ v K , C a + h . o . t .               = I K , C a ( Q C a ) + δ i K , C a
where
δ C a = C a C a Q K , C a
  δ v K , C a = v K , C a V K , C a ( Q K , C a )
δ i K , c a = i K , C a I K , C a ( Q K , C a )
and
a 00 ( Q K , C a ) = G C a Q K , C a V C a ( Q K , C a ) = I K , C a ( Q K , C a )
a 11   ( Q K , C a ) = V K , C a ( Q K , C a ) G K , C a C a Q K , C a
a 12 ( Q K , C a ) = G K , C a C a Q K , C a
and h.o.t denotes the higher-order terms. Let us linearize the nonlinear equation by neglecting the h.o.t. in Equation (61), then:
δ i K , C a = a 11 ( Q K , C a ) δ C a + a 12 ( Q K , C a ) δ v K , C a
Similarly, expanding the state equation f C a K , C a , V K , C a of Equation (23) in a Taylor series about the equilibrium point (Ca(Q,K,Ca), VCa(Q,K,ca)), we obtain
f ( C a Q K , C a + δ C a ,     V K , C a ( Q K , C a ) + δ v K , C a ) = f ( C a Q K , C a , V C a ( Q K , C a ) ) + b 11 ( Q K , C a )   δ C a + b 12 ( Q K , C a )   δ v K , C a + h . o . t .
where
b 11 ( Q K , C a ) = f Ca ,   v K , C a C a Q K , C a
b 12 ( Q K , C a ) = f C a ,   v K , C a v K , C a Q K , C a
Linearizing the nonlinear state Equation (69) by neglecting the h.o.t., we get
d C a d t = b 11 ( Q K , C a )   δ C a + b 12 ( Q K , C a ) δ v K , C a
Taking Laplace transform of Equations (68) and (72), we obtain
i ^   K , C a ( s ) = a 11   ( Q K , C a ) C a ^ ( s ) + a 12 ( Q K , C a ) v ^ C a ( s )
s     C a ^ ( s ) = b 11 ( Q K , C a )   C a ^ ( s ) + b 12 ( Q K , C a )   v ^ K , C a ( s )
Solving Equation (74) for C a ^ ( s ) and substituting the result into Equation (73), we obtain the following admittance YK,Ca(s; QK,Ca) of the small-signal equivalent circuit of the calcium-sensitive potassium ion channel memristor at equilibrium point QK,Ca:
Y K , C a ( s ; Q K , C a ) = i ^ K , C a ( s ) v ^ K , C a ( s ) = 1   s a 11   ( Q K , C a ) b 12 ( Q K , C a )   b 11 ( Q K , C a ) a 11   ( Q K , C a ) b 12 ( Q K , C a ) + 1 1 a 12 ( Q K , C a )
Y C a s ; Q C a = 1   s L K , C a + R 1 K , C a   + 1 R 2 K , C a
where   L K , C a 1 a 11   ( Q K , C a ) b 12   ( Q K , C a )
R 1 K , C a b 11   ( Q K , C a ) a 11   ( Q K , C a ) b 12   ( Q K , C a )
R 2 K , C a 1 a 12   ( Q K , C a )
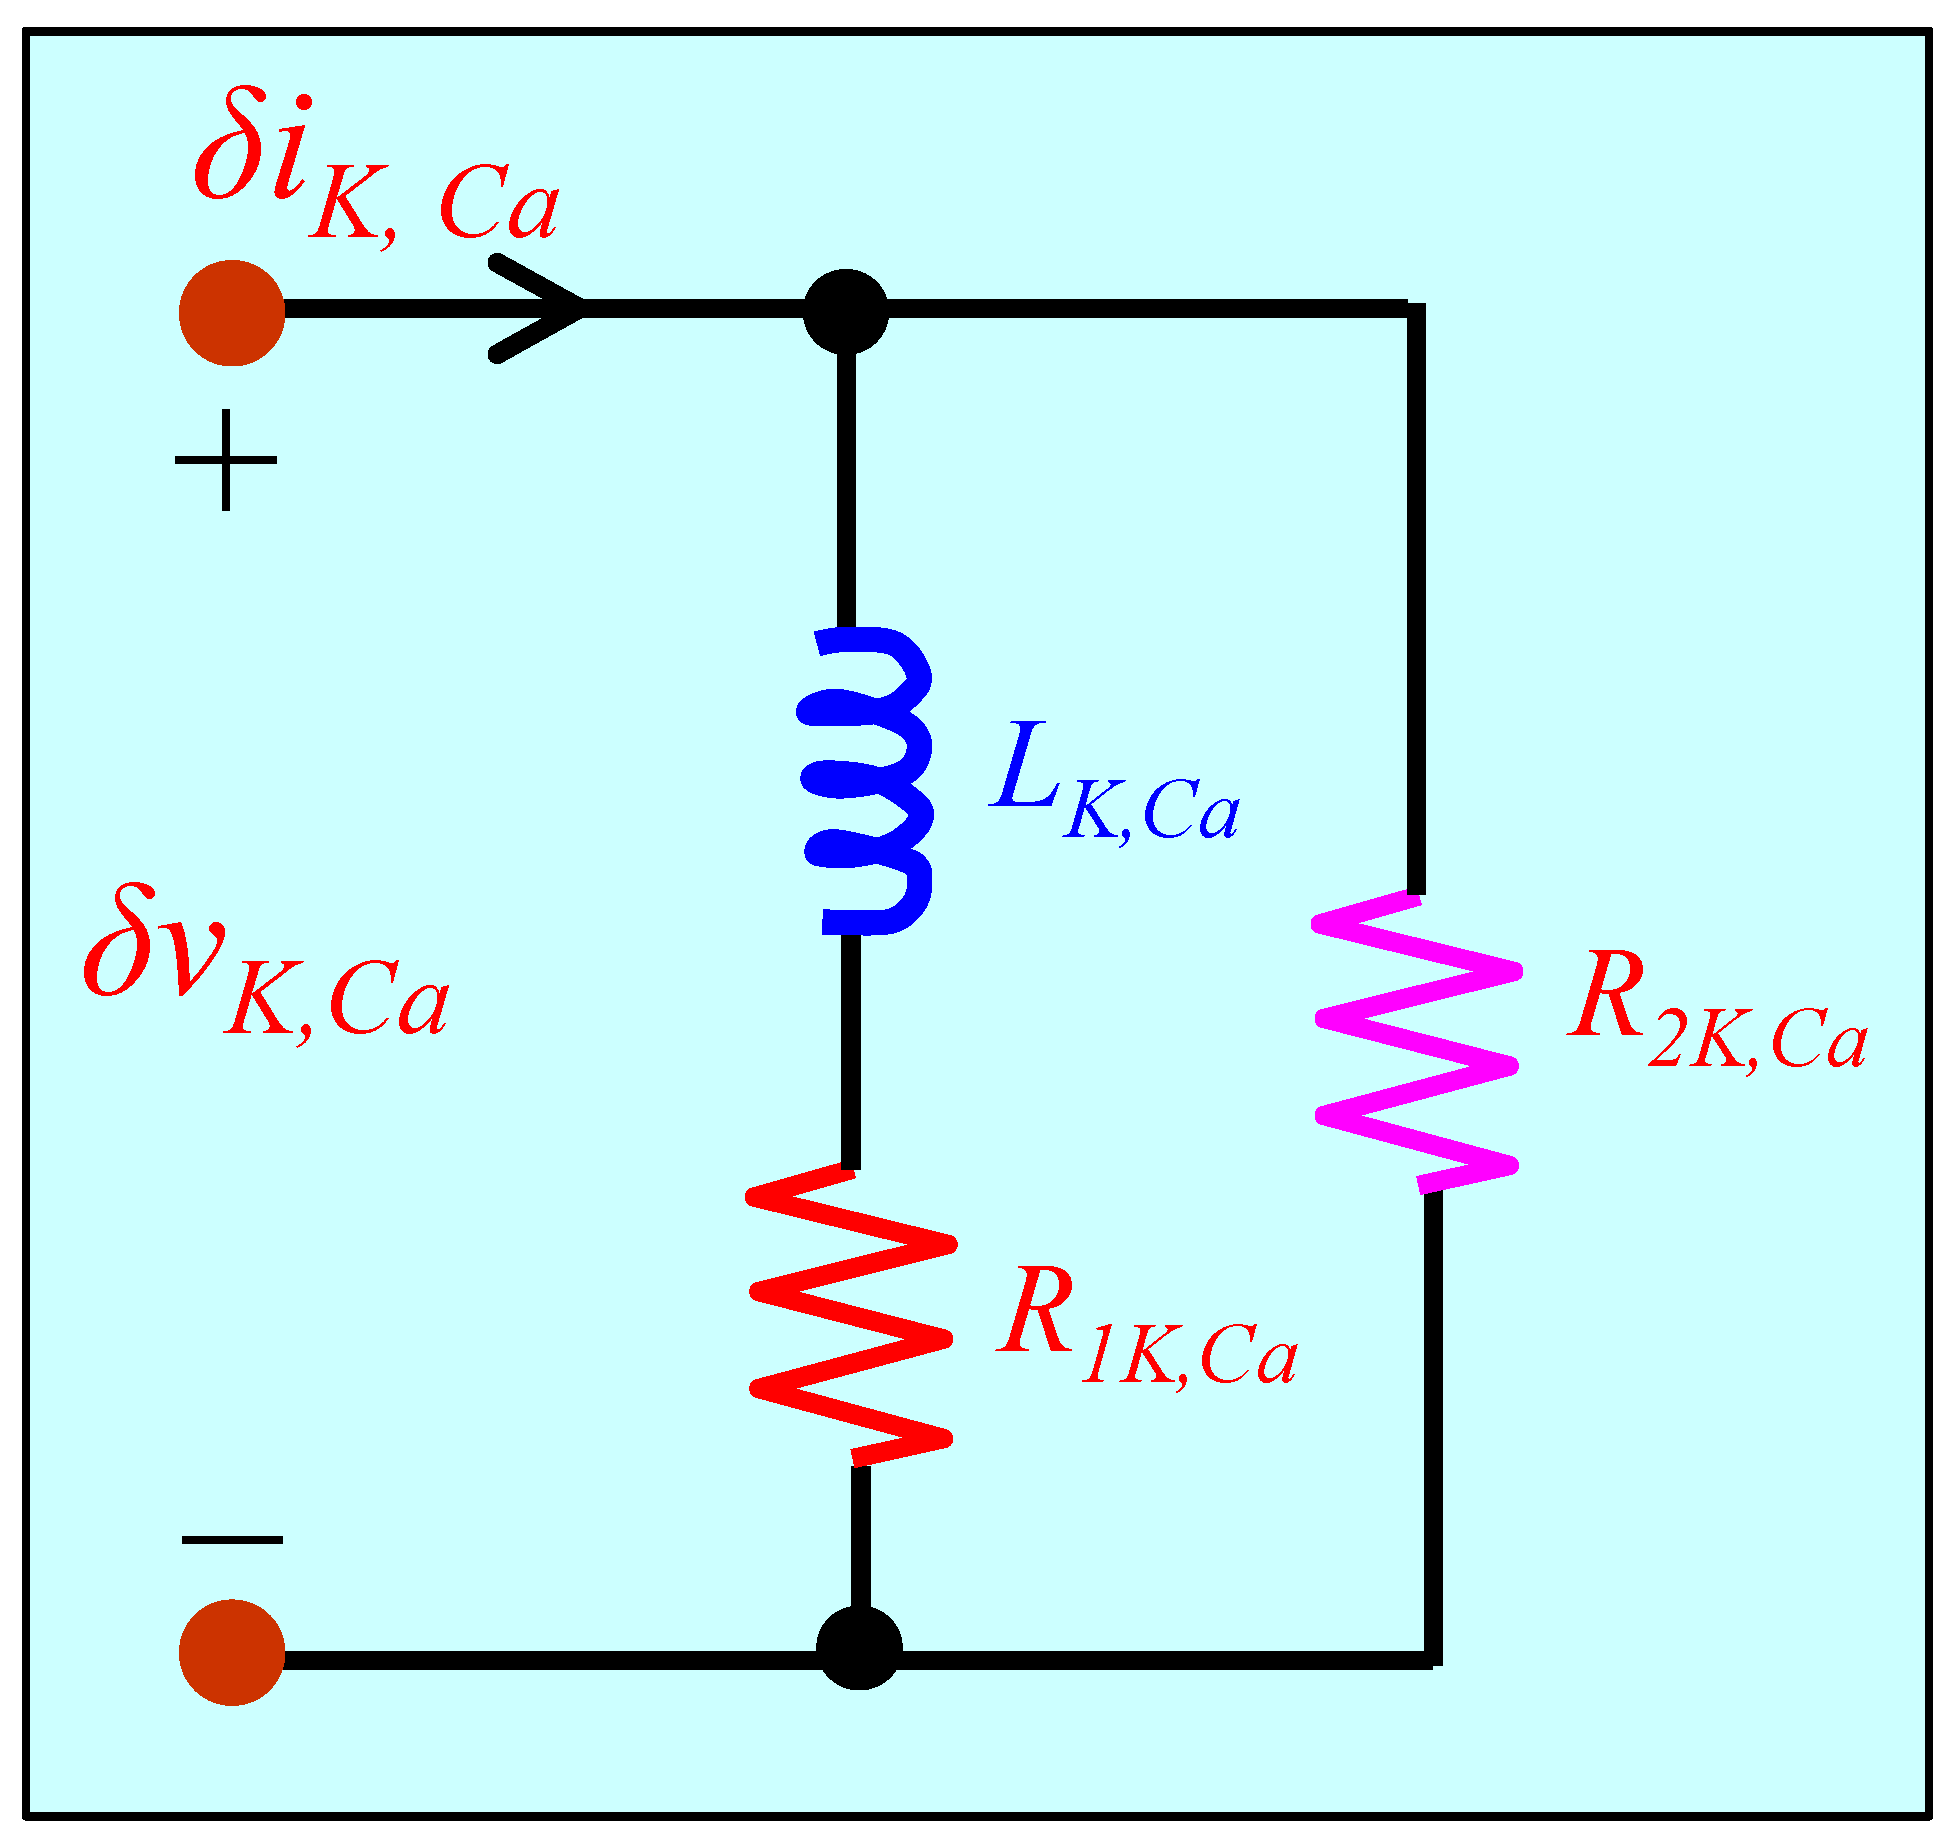
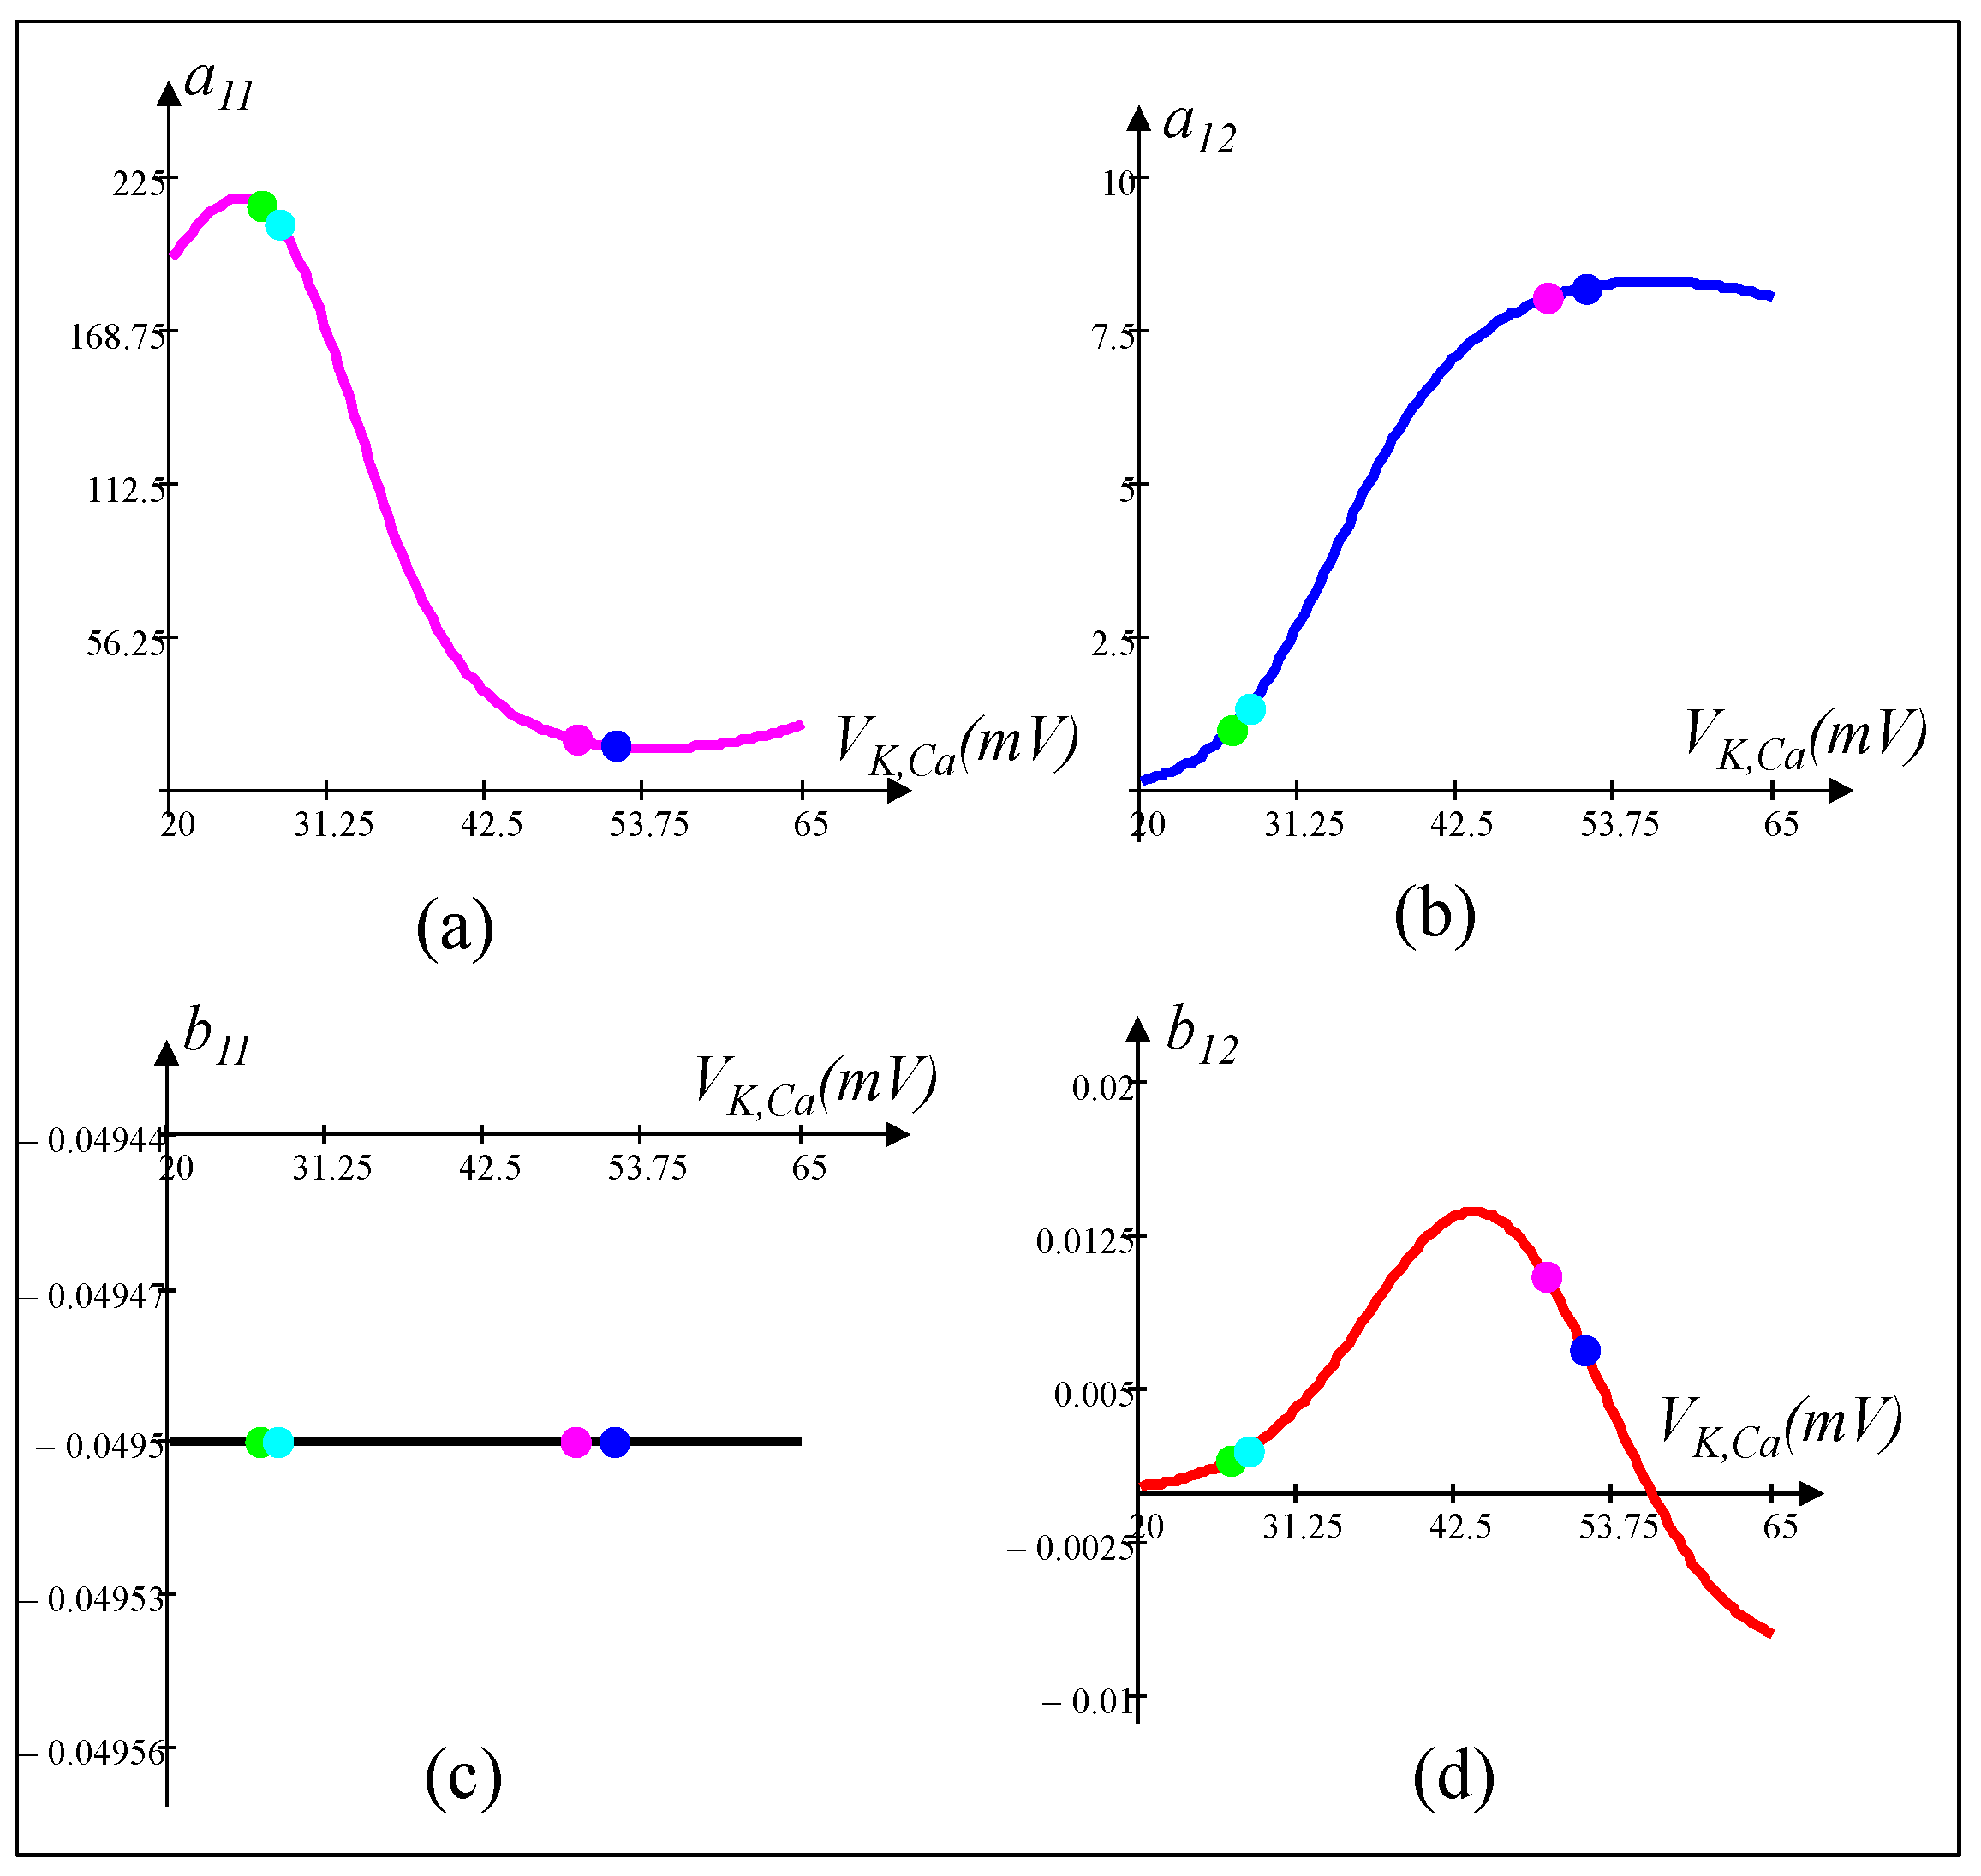
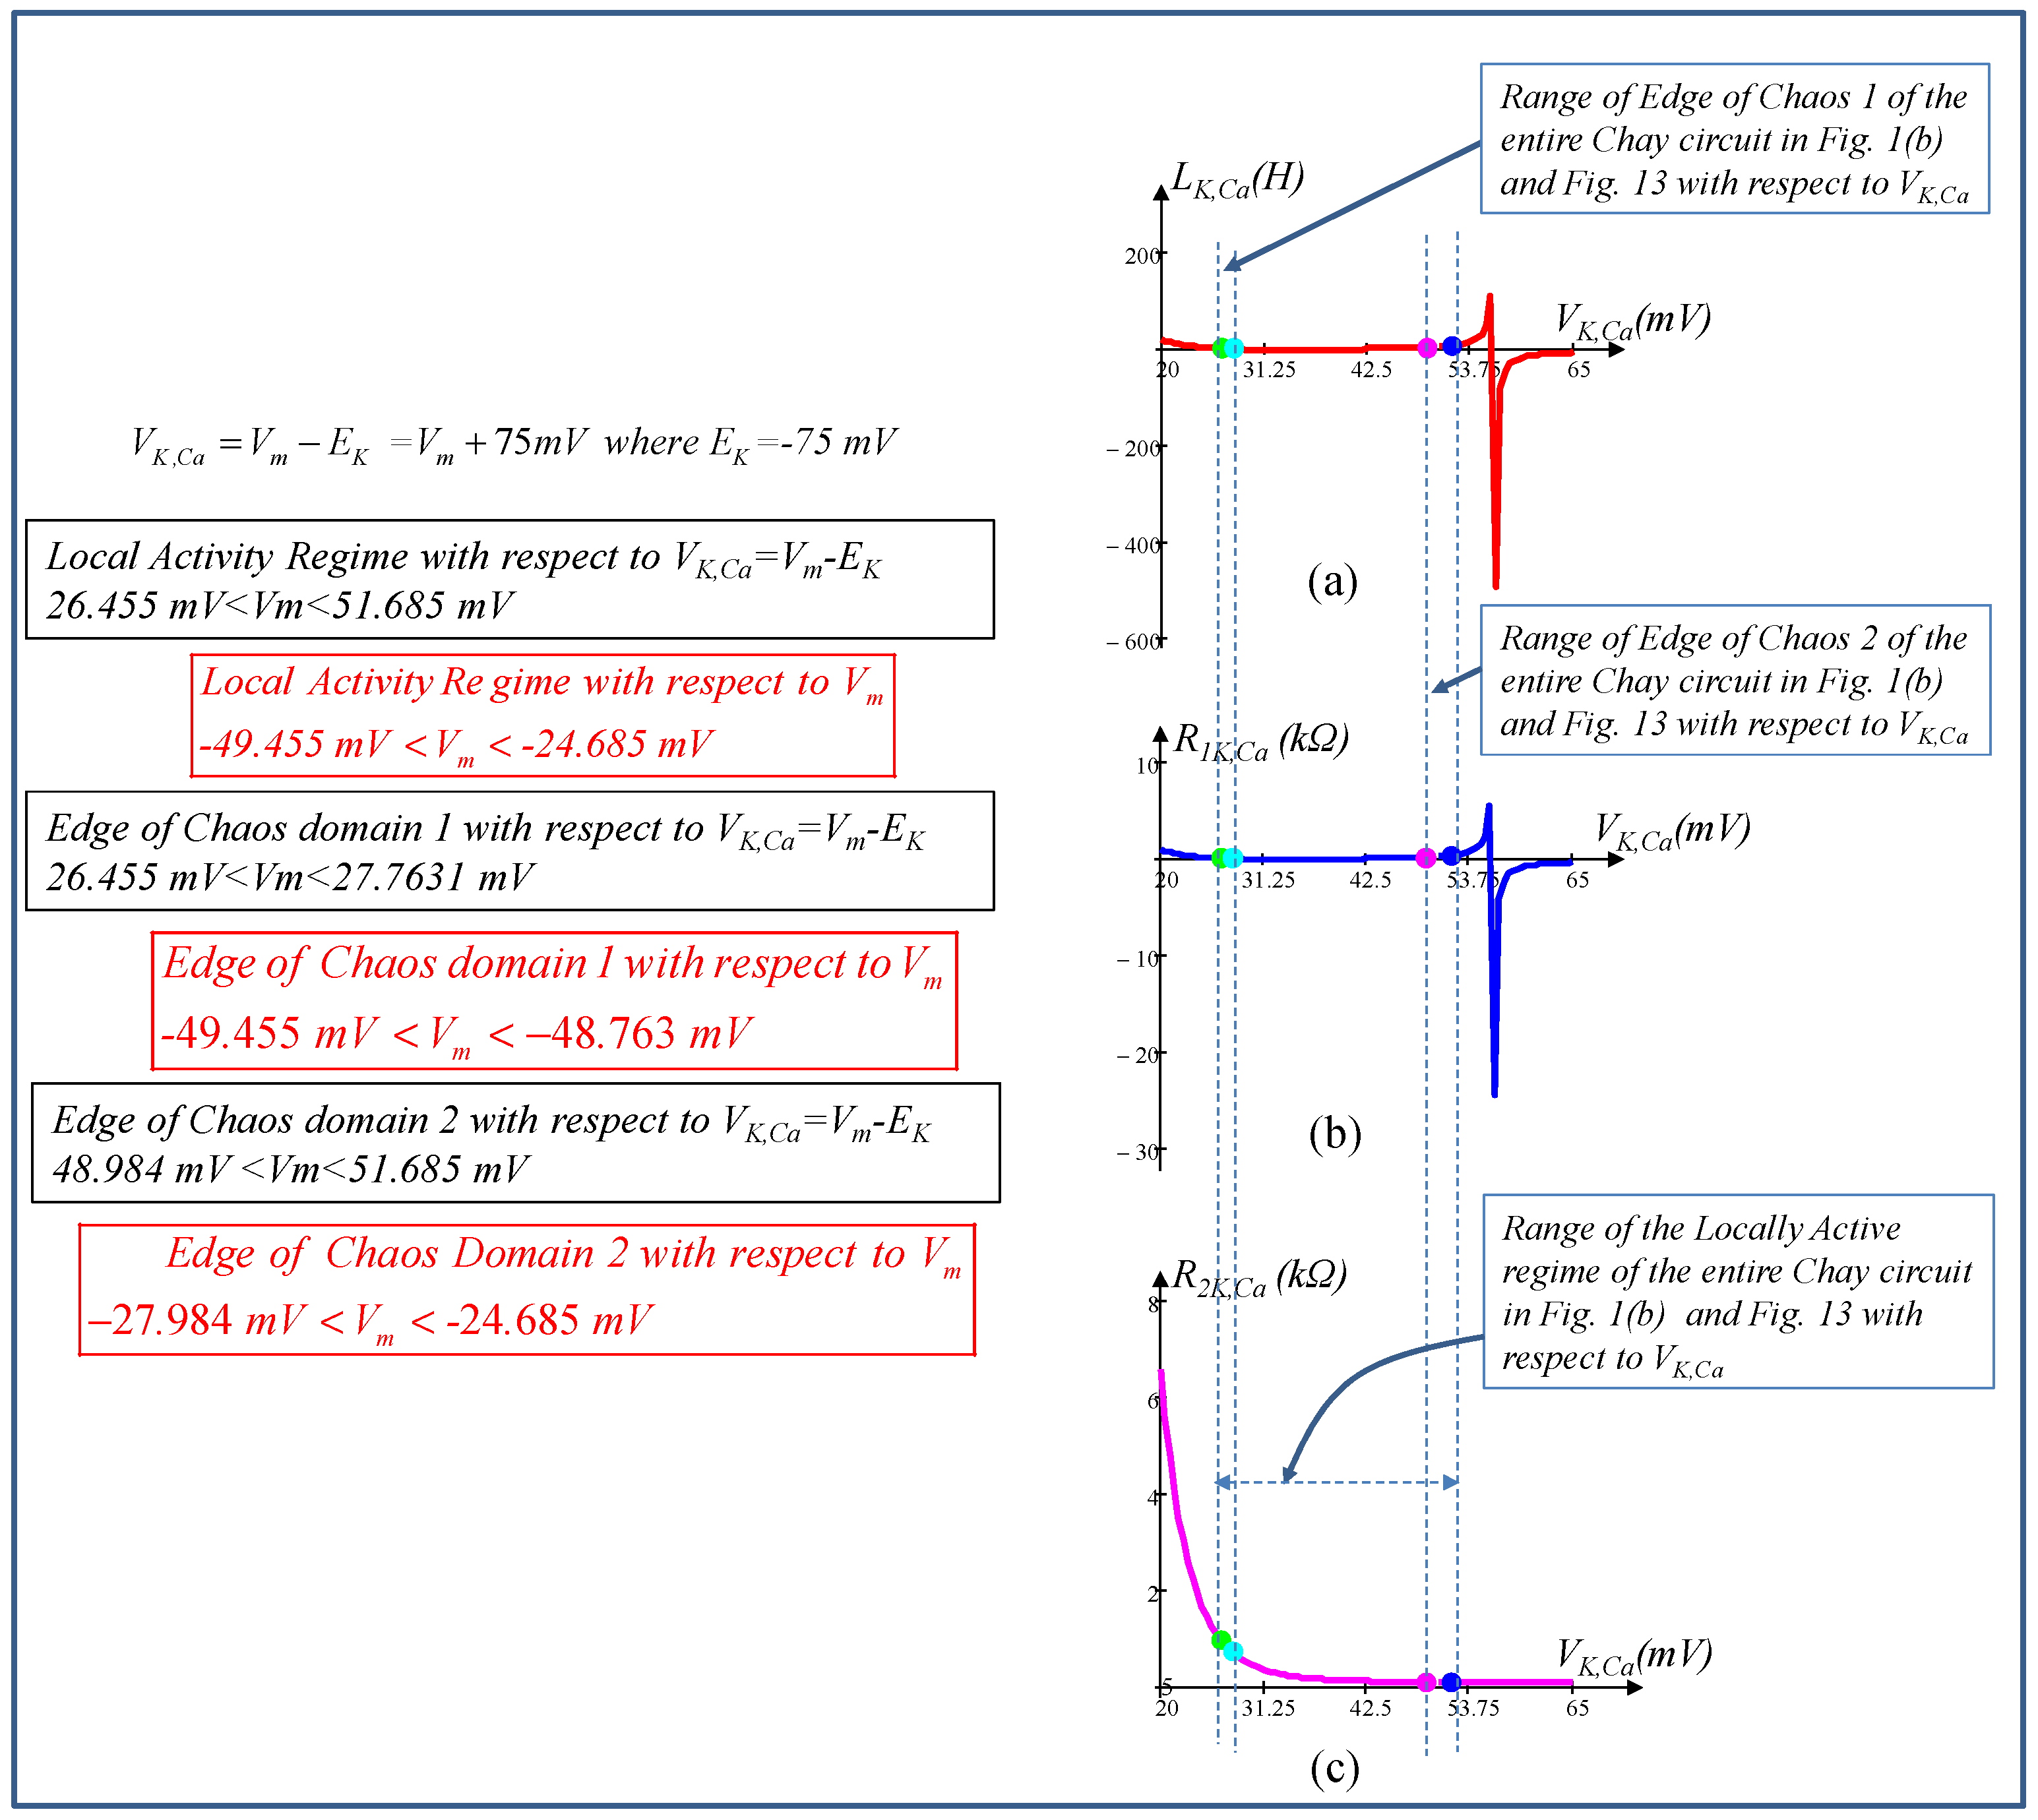
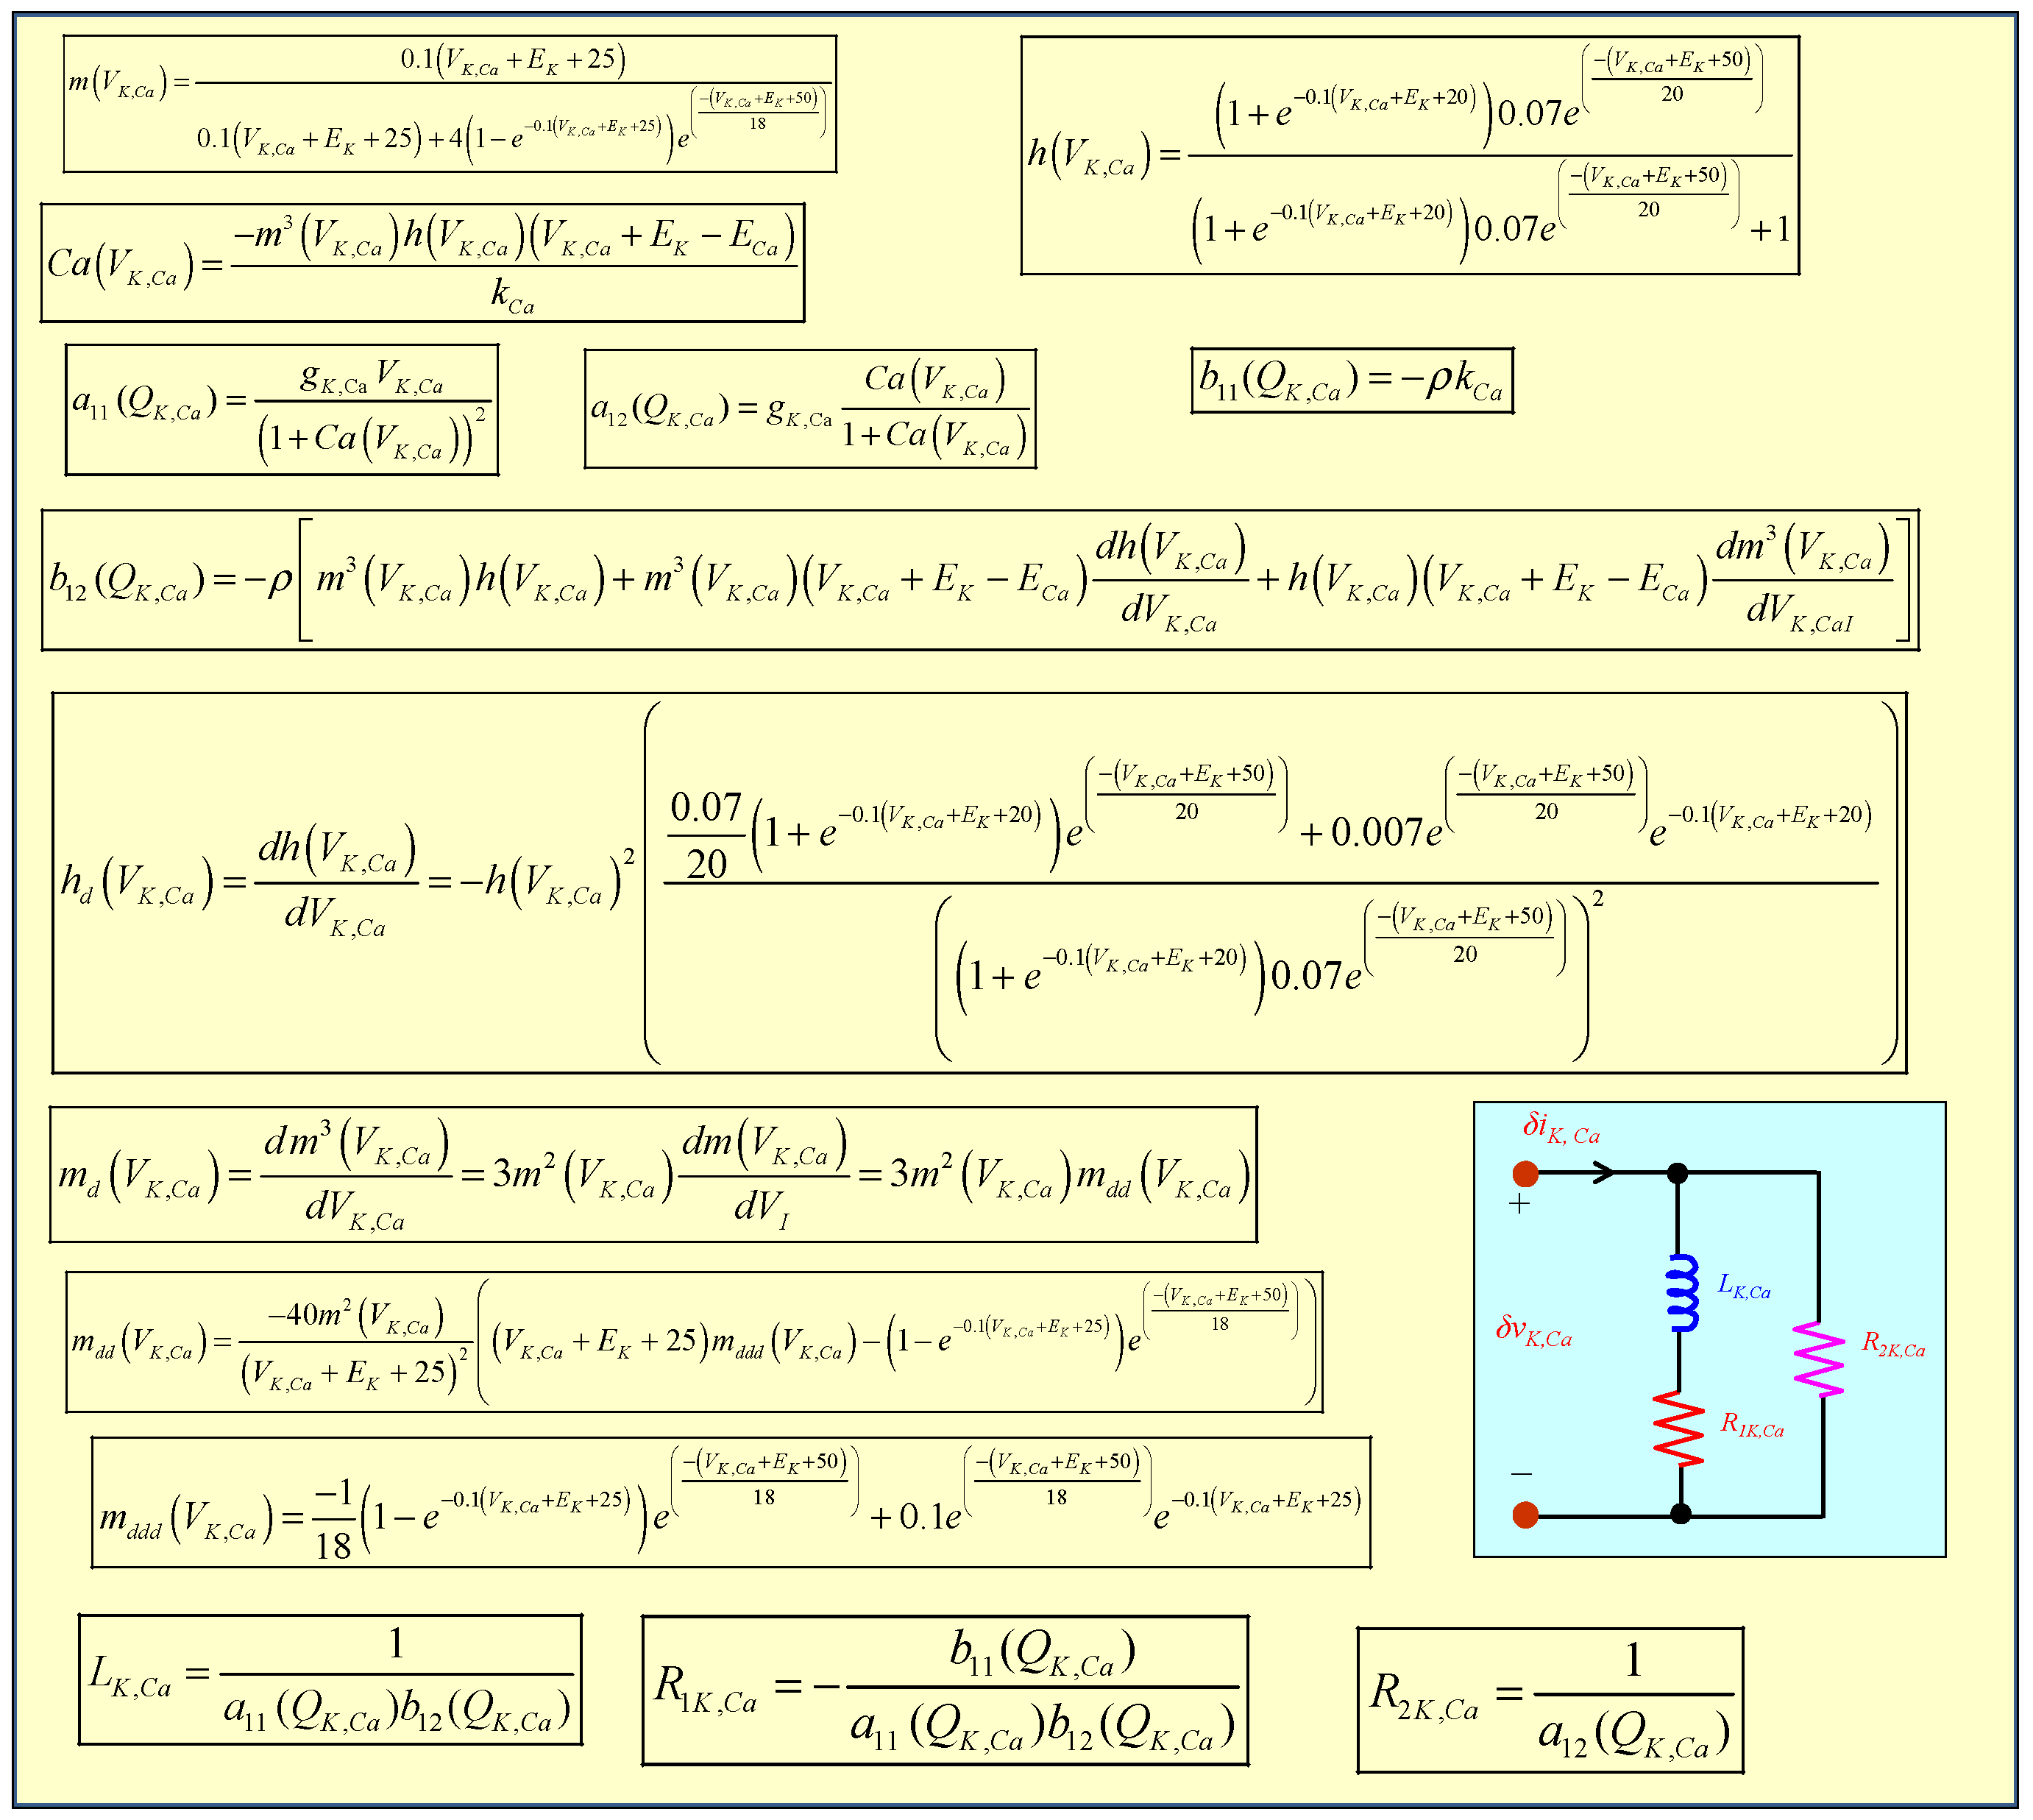
It follows from Equations (77)–(79) that the small-signal admittance function of the first-order calcium-sensitive potassium ion channel memristor is equivalent to the series connection of an inductor and a resistor in parallel with another resistor, as shown in Figure 12. The corresponding coefficients a11, a12, b11, b12, and inductance LK,Ca, resistance R1K,Ca, and resistance R2K,Ca as a function of the DC equilibrium voltage VK,Ca are shown in Figure 13 and Figure 14, respectively. The small-signal inductance and resistances (i.e., LK,Ca > 0, R1K,Ca > 0 and R2KCa > 0) over the edge of chaos 1 and edge of chaos 2 with respect to the VK,Ca are shown in Figure 14a, Figure 14b, and Figure 14c, respectively. Please note that the local activity, edge of chaos 1 and edge of chaos 2, shown in Figure 14a–c, are not the local activity, edge of chaos 1 and edge of chaos 2 of the individual calcium-sensitive potassium ion channel memristor. The local activity and edge of chaos domains are just information showing the corresponding range of voltage with respect to VK,Ca when measured across the individual calcium-sensitive potassium ion channel memristor of the entire connected Chay small-signal equivalent circuit in Figure 1b and Figure 16. For the readers’ convenience, the explicit formulas for computing the coefficients a11(Q,K,Ca), a12(QK,Ca), b11(Q,K,Ca), b12(Q,K,Ca) and LK,Ca, R1K,Ca, R2K,Ca are summarized in Figure 15.

5.4. Small-Signal Circuit Model of the Memristive Chay Model

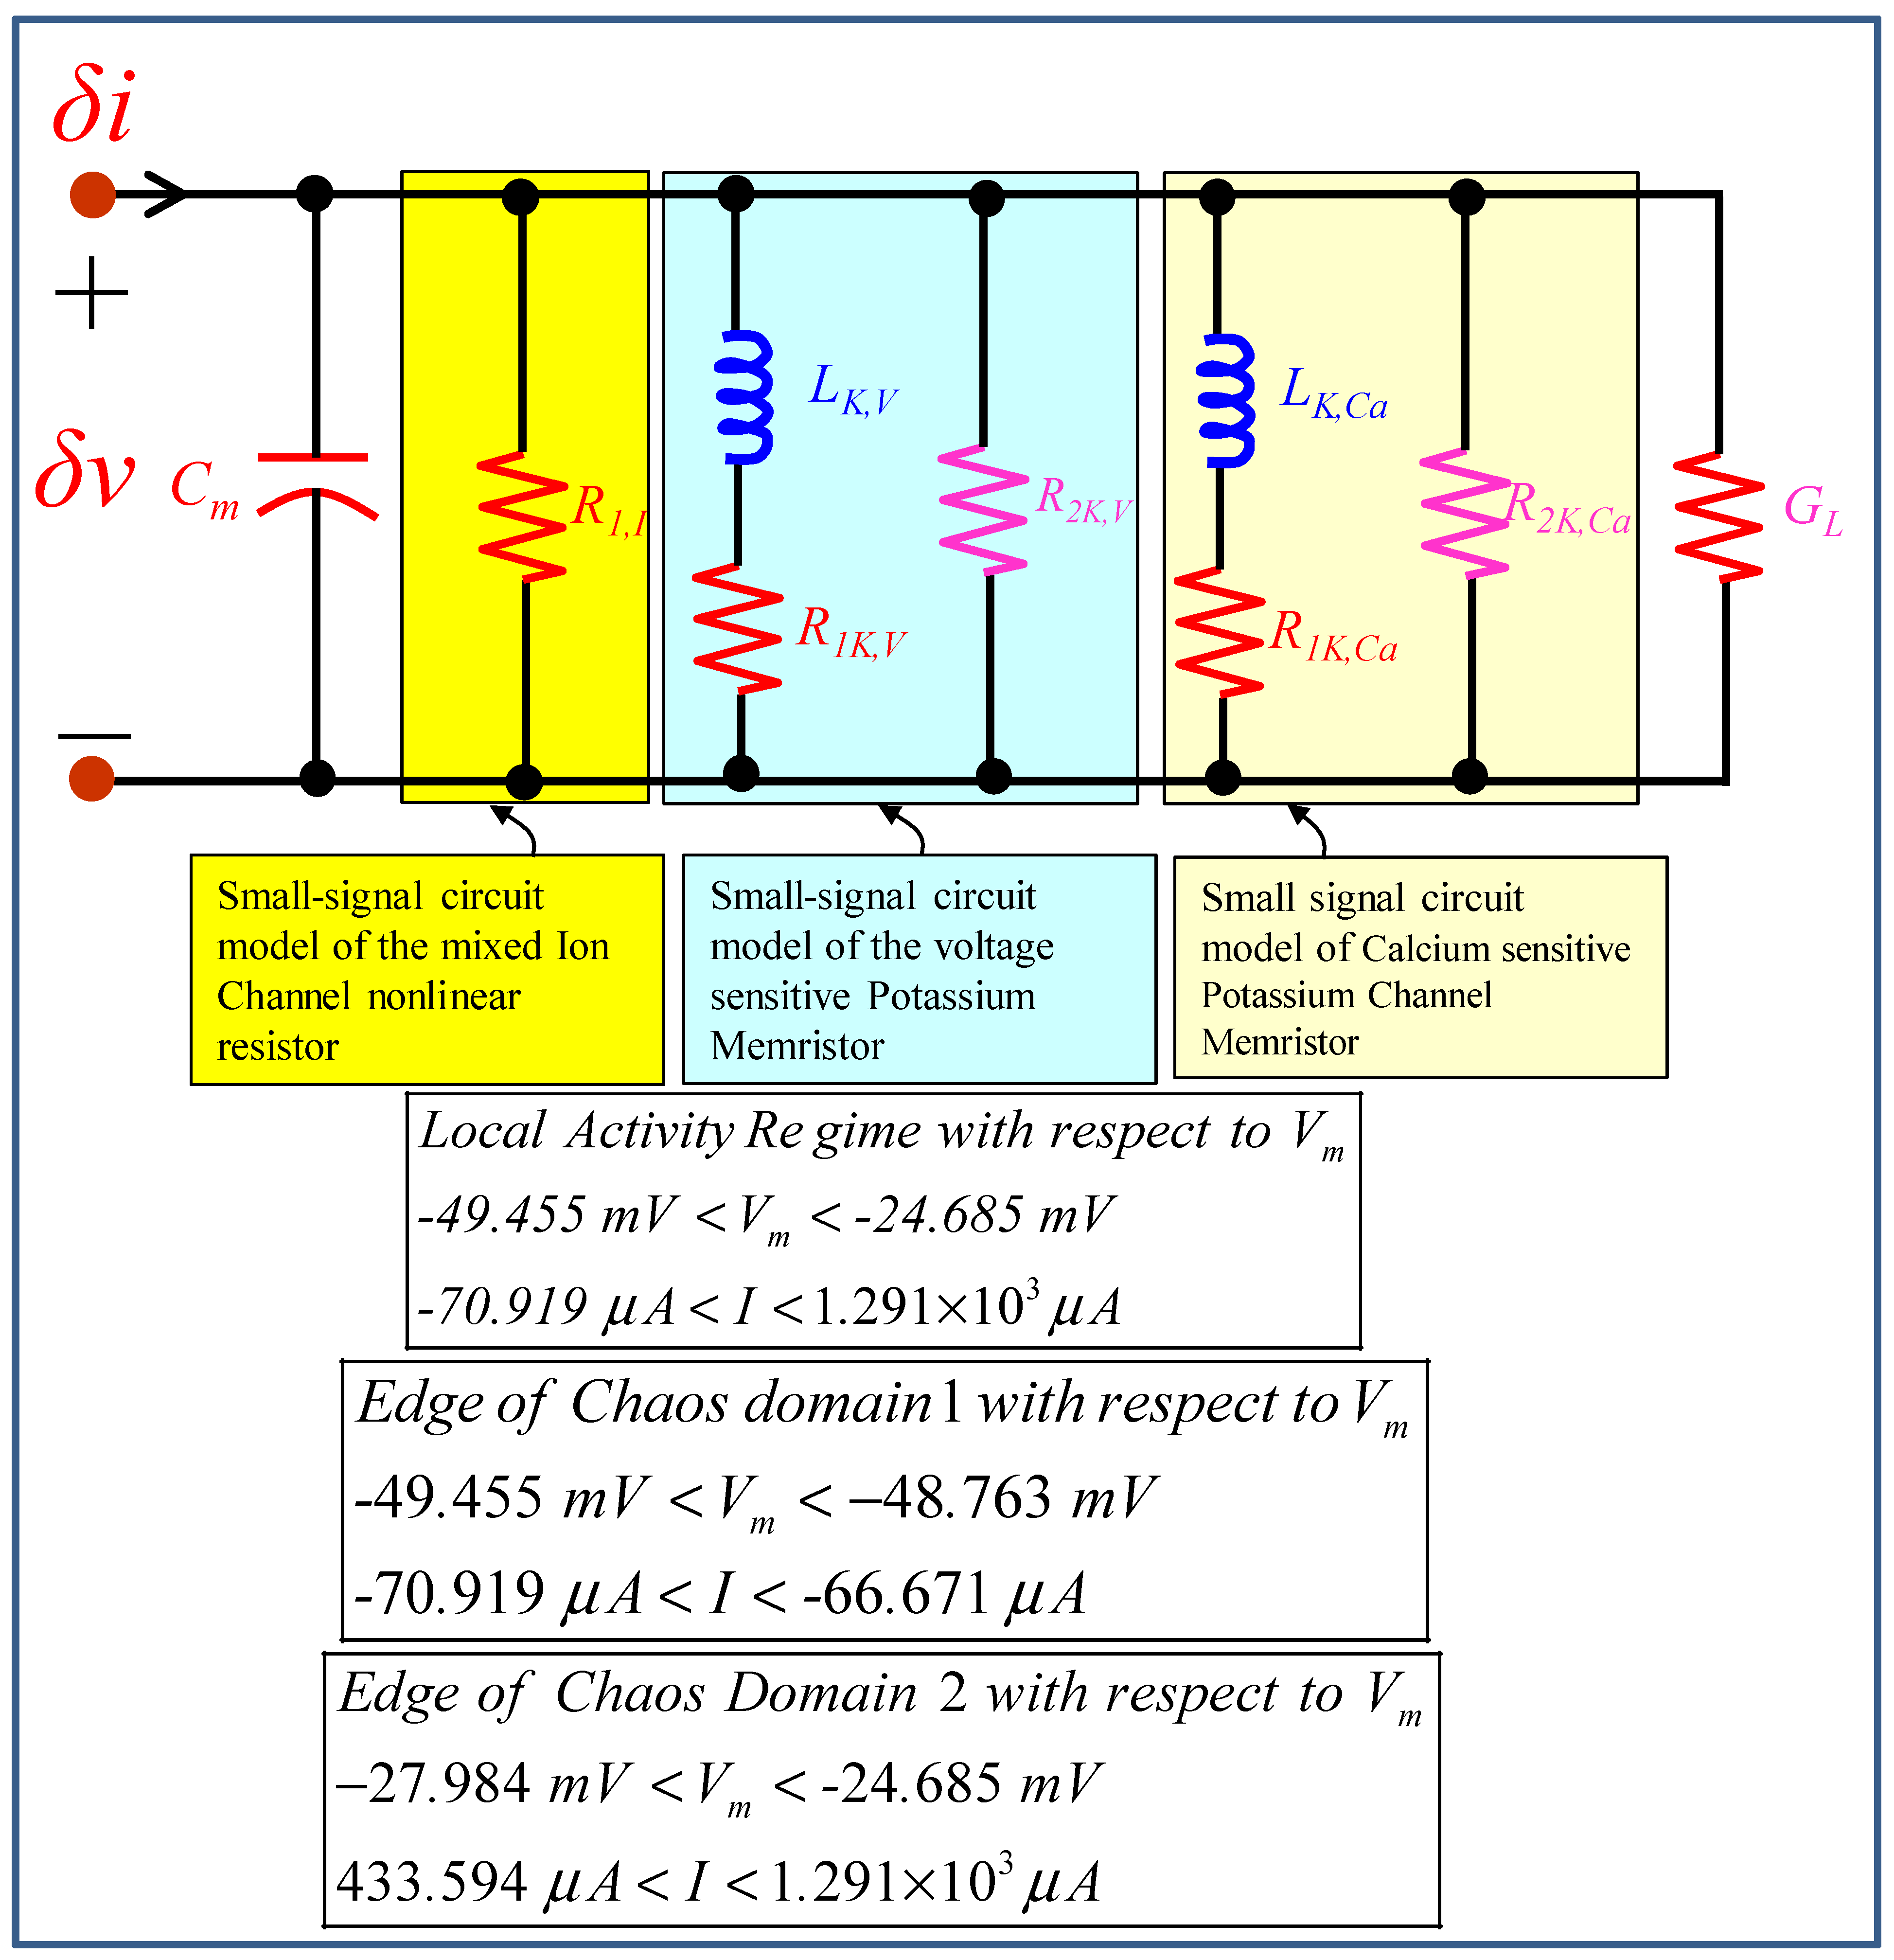
Let us replace the voltage-sensitive mixed ion channel nonlinear resistor, the voltage-sensitive potassium ion channel memristor, and the calcium-sensitive potassium ion channel memristor in the memristive Chay neuron circuit of Figure 1b with their small-signal models about DC operating voltages VI = VmEI, VK,V = VmEK, and VK,Ca = VmEK, respectively. Short-circuiting all the batteries, the equivalent small-signal circuit model of the third-order neuron circuit from Figure 1b about the operating point Vm(Q) is found to be composed of one capacitor, two inductors, and six resistors, as shown in Figure 16. The local admittance Y(s; Vm(Q)) of this linear circuit seen from the port and formed by the capacitor terminals about Q is given by
Y ( s ; V m ( Q ) )     =     s C m +     1 s L K , V + R 1 K , V     +     1 s L K , C a + R 1 K , c a     +     1 R 1 , I + 1 R 2 K , V     +     1 R 2 K , C a     +   G L  
The corresponding ranges of local activity, edge of chaos 1 and edge of chaos 2, at equilibrium voltage Vm(Q) (resp. I), are also given in Figure 16 for readers’ convenience. We will cover the details of these regimes in the section on locally activity and edge of chaos. The circuit element R1,I is obtained by calculating the small signal model of the voltage-sensitive mixed ion channel nonlinear resistor from Figure 7 at equilibrium voltage Vm(Q) = VI + EI. Similarly, LK,V, R1K,V, and R2K,V are calculated from the small-signal equivalent circuit of the voltage-sensitive potassium ion channel memristor from Figure 11, and LK,Ca, R1K,Ca, and R2K,Ca are calculated from the small-signal equivalent circuit of the calcium-sensitive potassium ion channel memristor from Figure 15 at equilibrium voltage Vm(Q), respectively. Note that VK,V + EK, and VK,Ca + EK must be replaced by Vm(Q) in Figure 11 and Figure 15 by the small signal model of the voltage-sensitive potassium ion channel memristor and calcium-sensitive potassium ion channel memristor, respectively.

5.4.1. Frequency Response

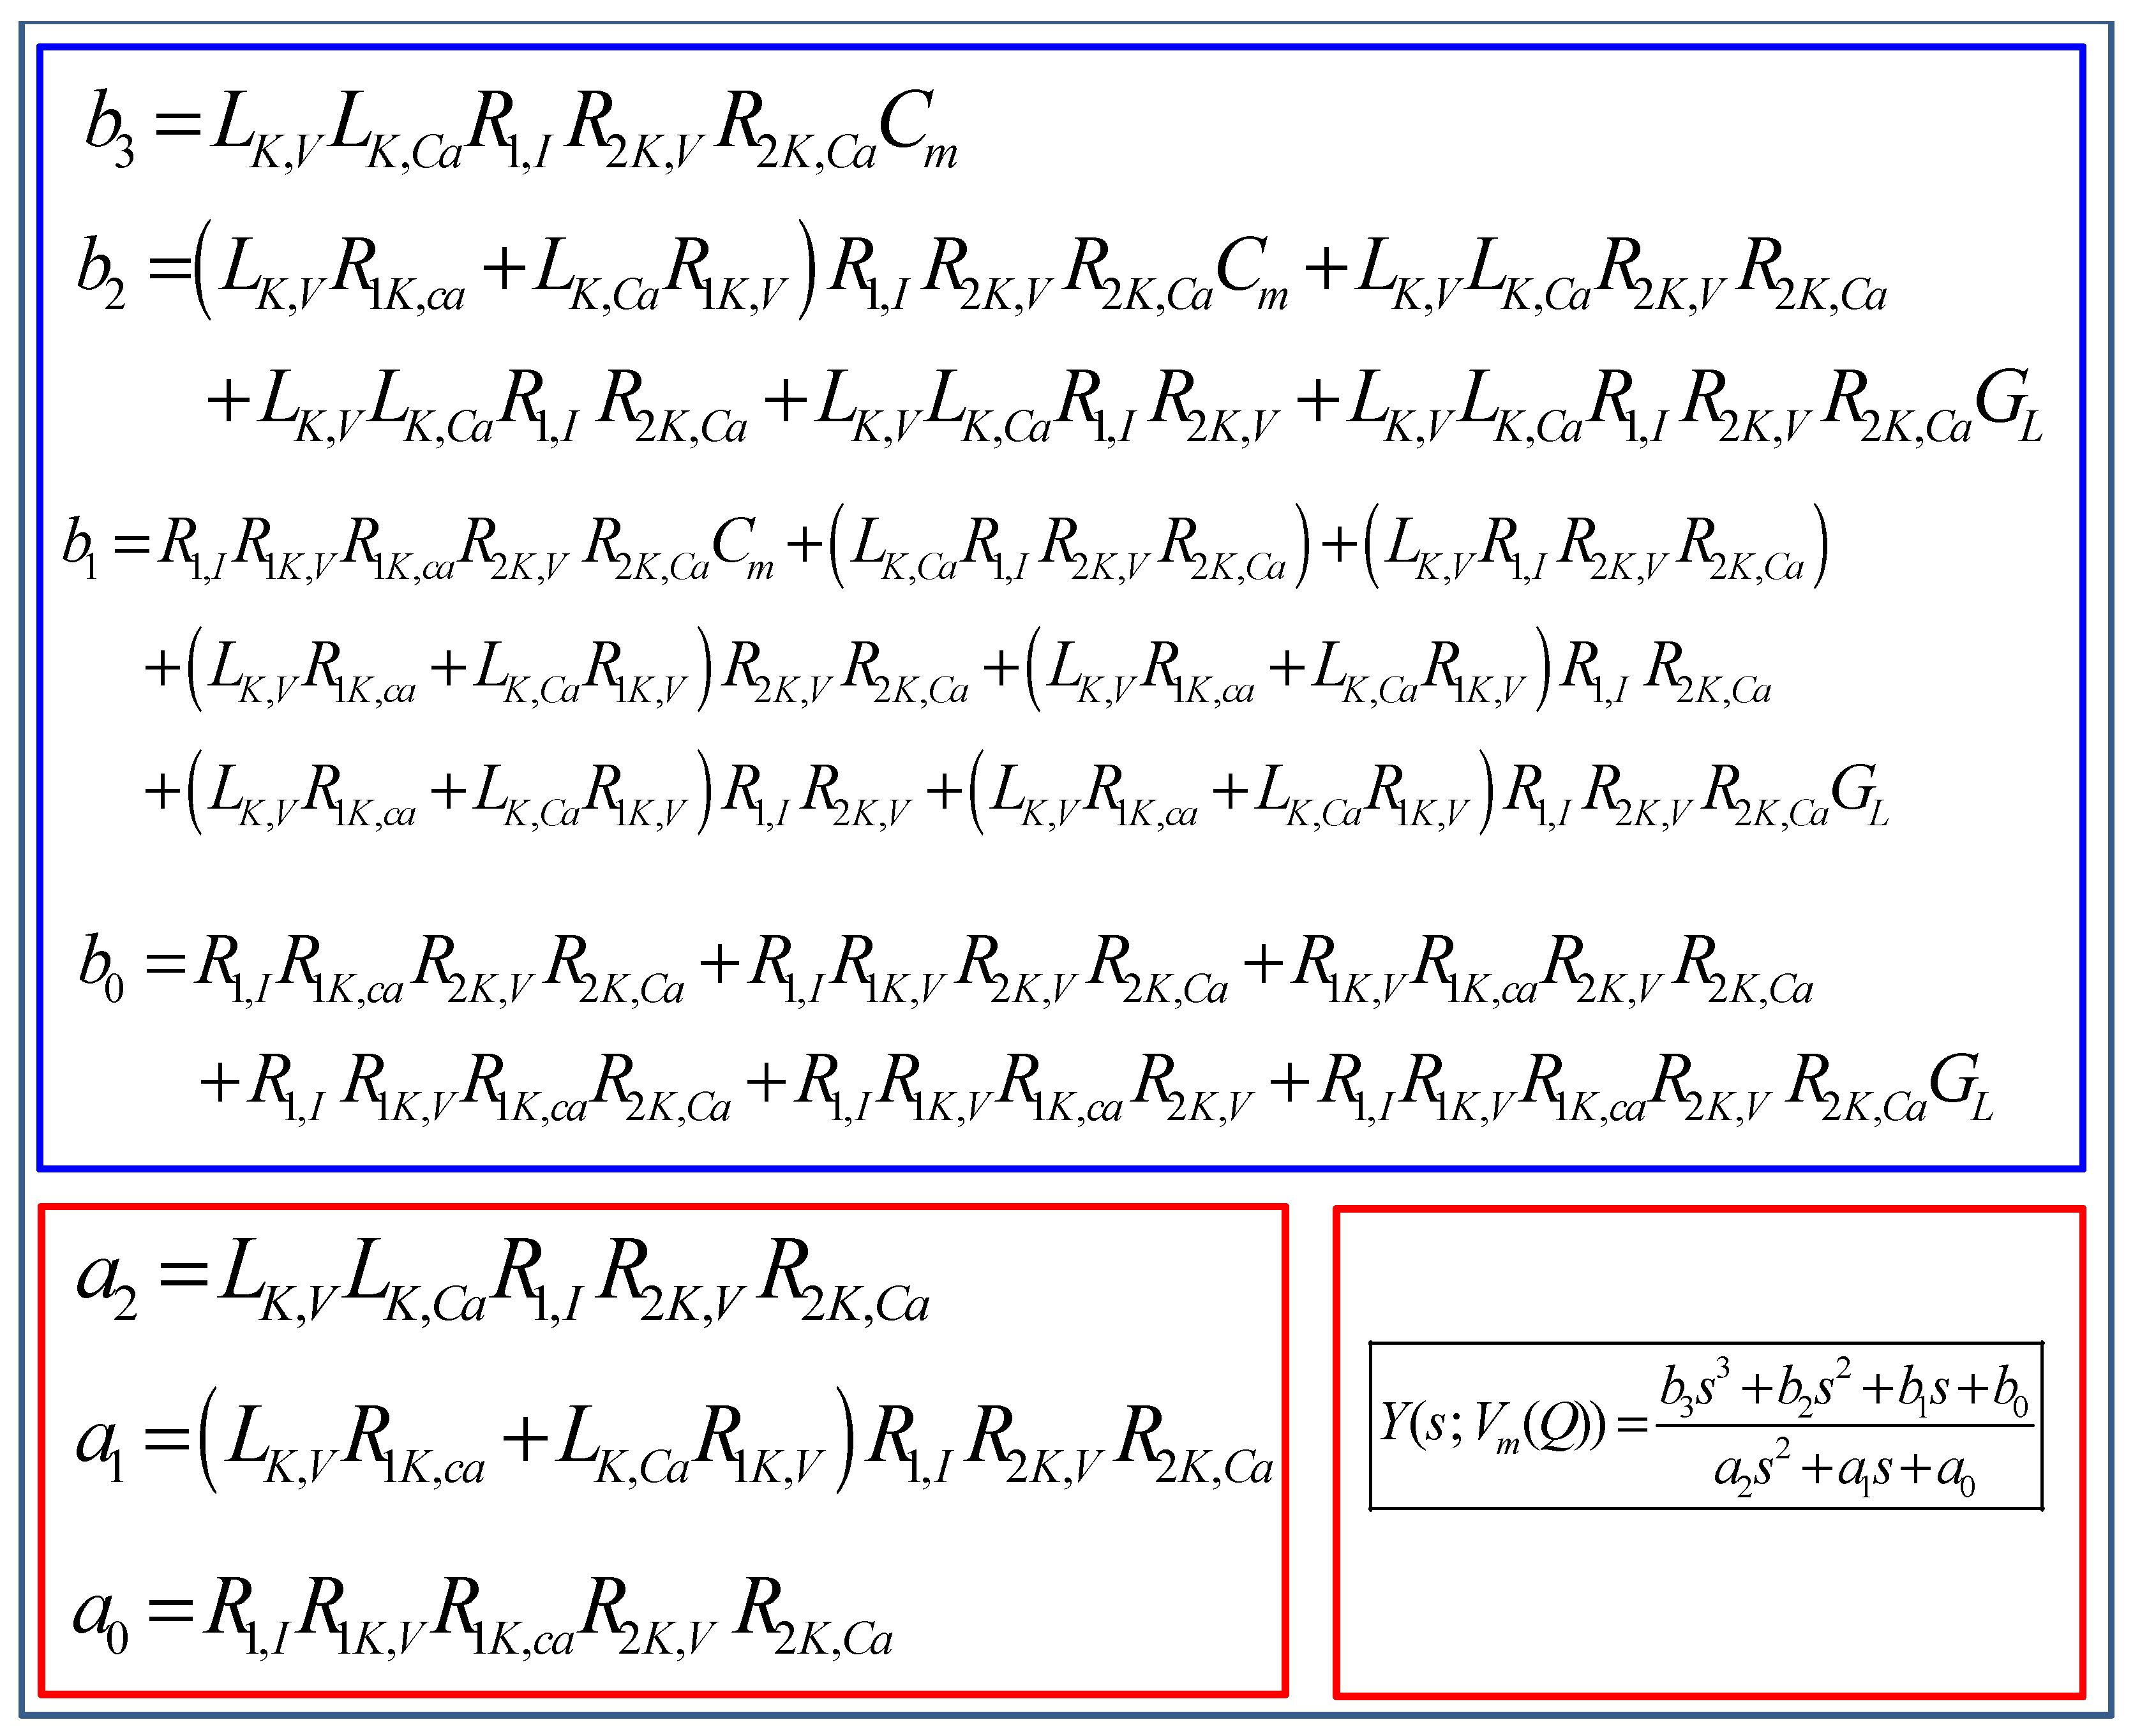
A convenient way to find the total admittance Y(s; Vm(Q)) by recasting Equation (80) into a rational function of the complex frequency variable s is as follows:
Y ( s ;   V m ( Q ) )     =     b 3 s 3 + b 2 s 2 + b 1 s + b 0 a 2 s 2 + a 1 s + a 0
where the explicit formulas for computing the coefficients b3, b2, b1, b0, a2, a1, and a0 are summarized in Figure 17.
Substituting s = i ω in Equation (81), we obtain the following small-signal admittance function at the equilibrium voltage Vm(Q):
Y ( i ω ; V m ( Q ) )     =       ( b 0     b 2 ω 2 ) ( a 0     a 2 ω 2 )   +   a 1 ω 2 ( b 1     b 3 ω 2 )   ( a 0     a 2 ω 2 ) 2   +   ( a 1 ω ) 2       +       i ω ( b 1     b 3 ω 2 ) ( a 0     a 2 ω 2 )   a 1 ( b 0     b 2 ω 2 ) ( a 0     a 2 ω 2 ) 2   +   ( a 1 ω ) 2                                                                  
The corresponding real part ReY(; Vm(Q)) and imaginary part ImY(; Vm(Q)) from Equation (82) are given by,
R e Y ( i ω ; V m ( Q ) ) = ( b 0     b 2 ω 2 ) ( a 0     a 2 ω 2 )   +   a 1 ω 2 ( b 1     b 3 ω 2 )   ( a 0     a 2 ω 2 ) 2   +   ( a 1 ω ) 2   I m Y ( i ω ; V m ( Q ) ) = ω ( b 1     b 3 ω 2 ) ( a 0     a 2 ω 2 )   a 1 ( b 0     b 2 ω 2 ) ( a 0     a 2 ω 2 ) 2   +   ( a 1 ω ) 2
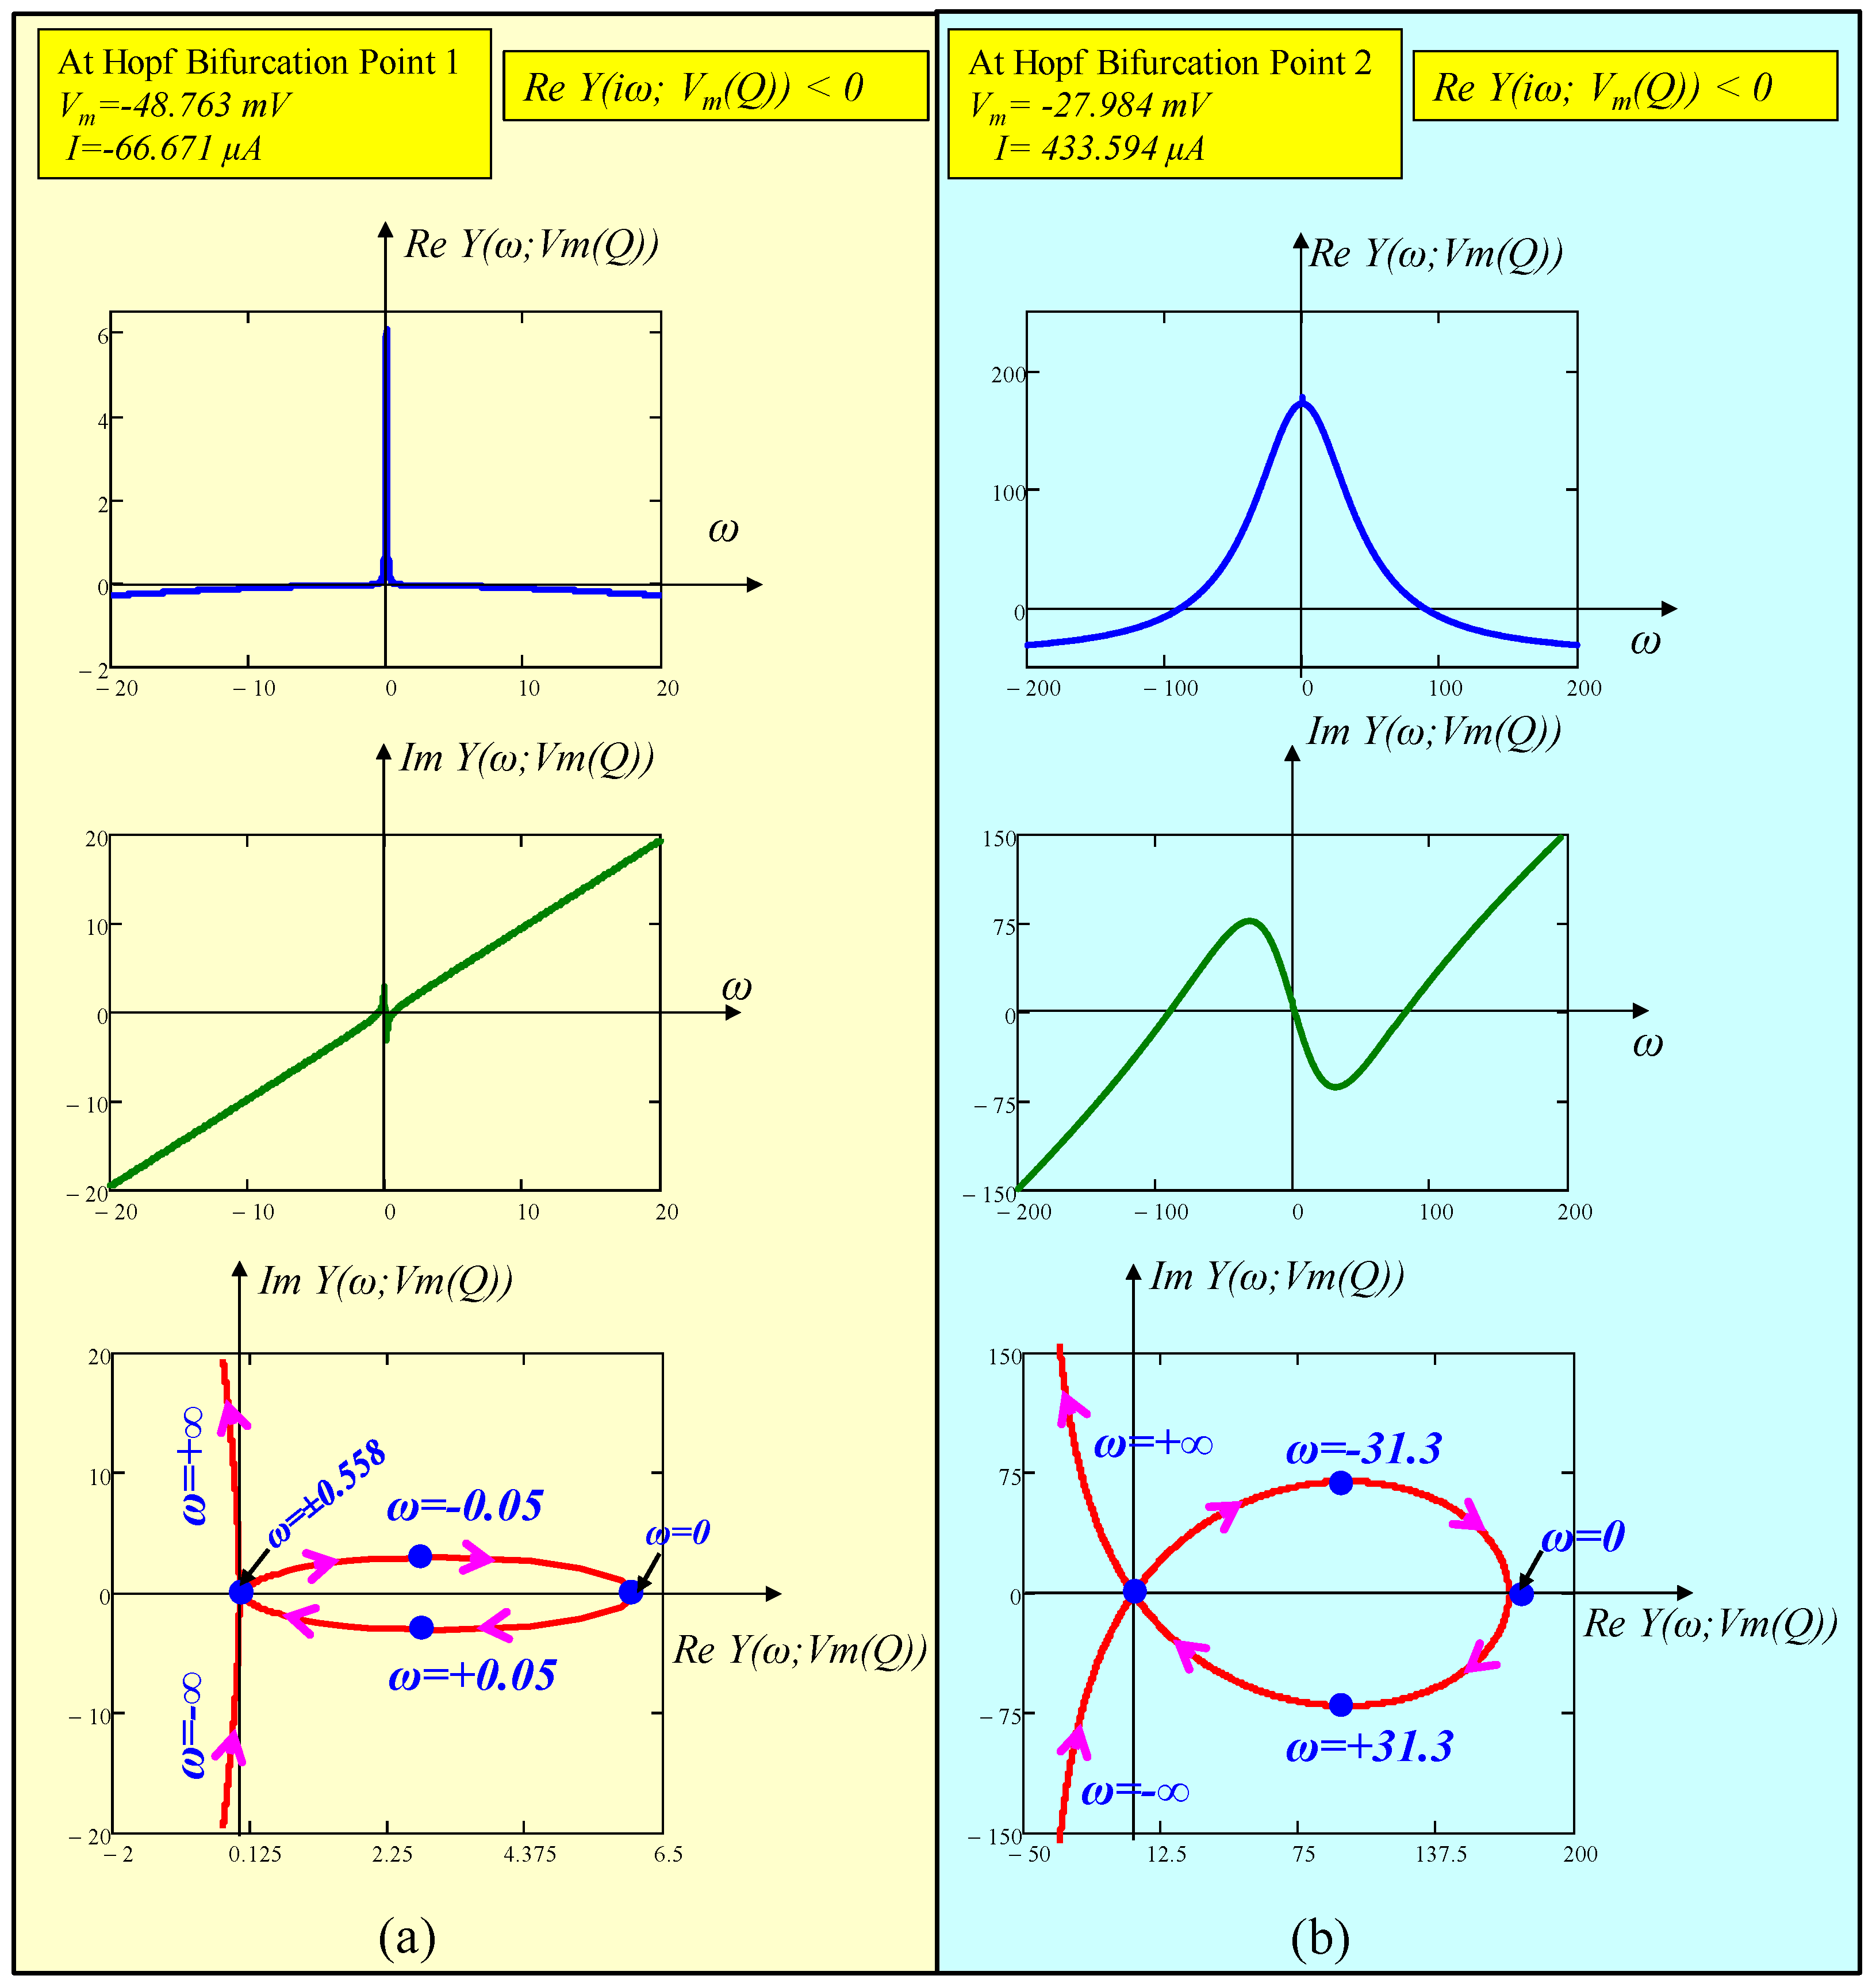
Figure 18a,b show ReY(; Vm(Q)) vs. ω, ImY(; Vm(Q)) vs. ω, and the Nyquist plot ImY(; Vm(Q)) vs. ReY(; Vm(Q)) at the DC equilibrium voltage Vm = −48.763 mV (resp., I = −66.671 μA), and Vm = −27.984 mV (resp., I = 433.594 μA), respectively. Observe from Figure 18a,b that ReY(; Vm(Q)) < 0, thereby confirming the memristive Chay model is locally active at each of the two operating points. Our extensive numerical computations show the two DC equilibria coincide with two Hopf bifurcation points, which are the origin of the oscillation, spikes, chaos, and bursting in excitable cells. We will discuss these two bifurcation points in the next section with a pole-zeros and eigen values diagram.

5.4.2. Pole-Zero Diagram of the Small-Signal Admittance Function Y(s; Vm(Q)) and Eigen values of the Jacobian Matrix

The location of the poles and zeros of the small signal admittance function Y(s; Vm(Q)) of Equation (81) is computed by factorizing its denominator and numerators as
Y ( s ; V m ( Q ) )     =     k ( s z 1 ) ( s z 2 ) ( s z 3 ) ( s p 1 ) ( s p 2 )
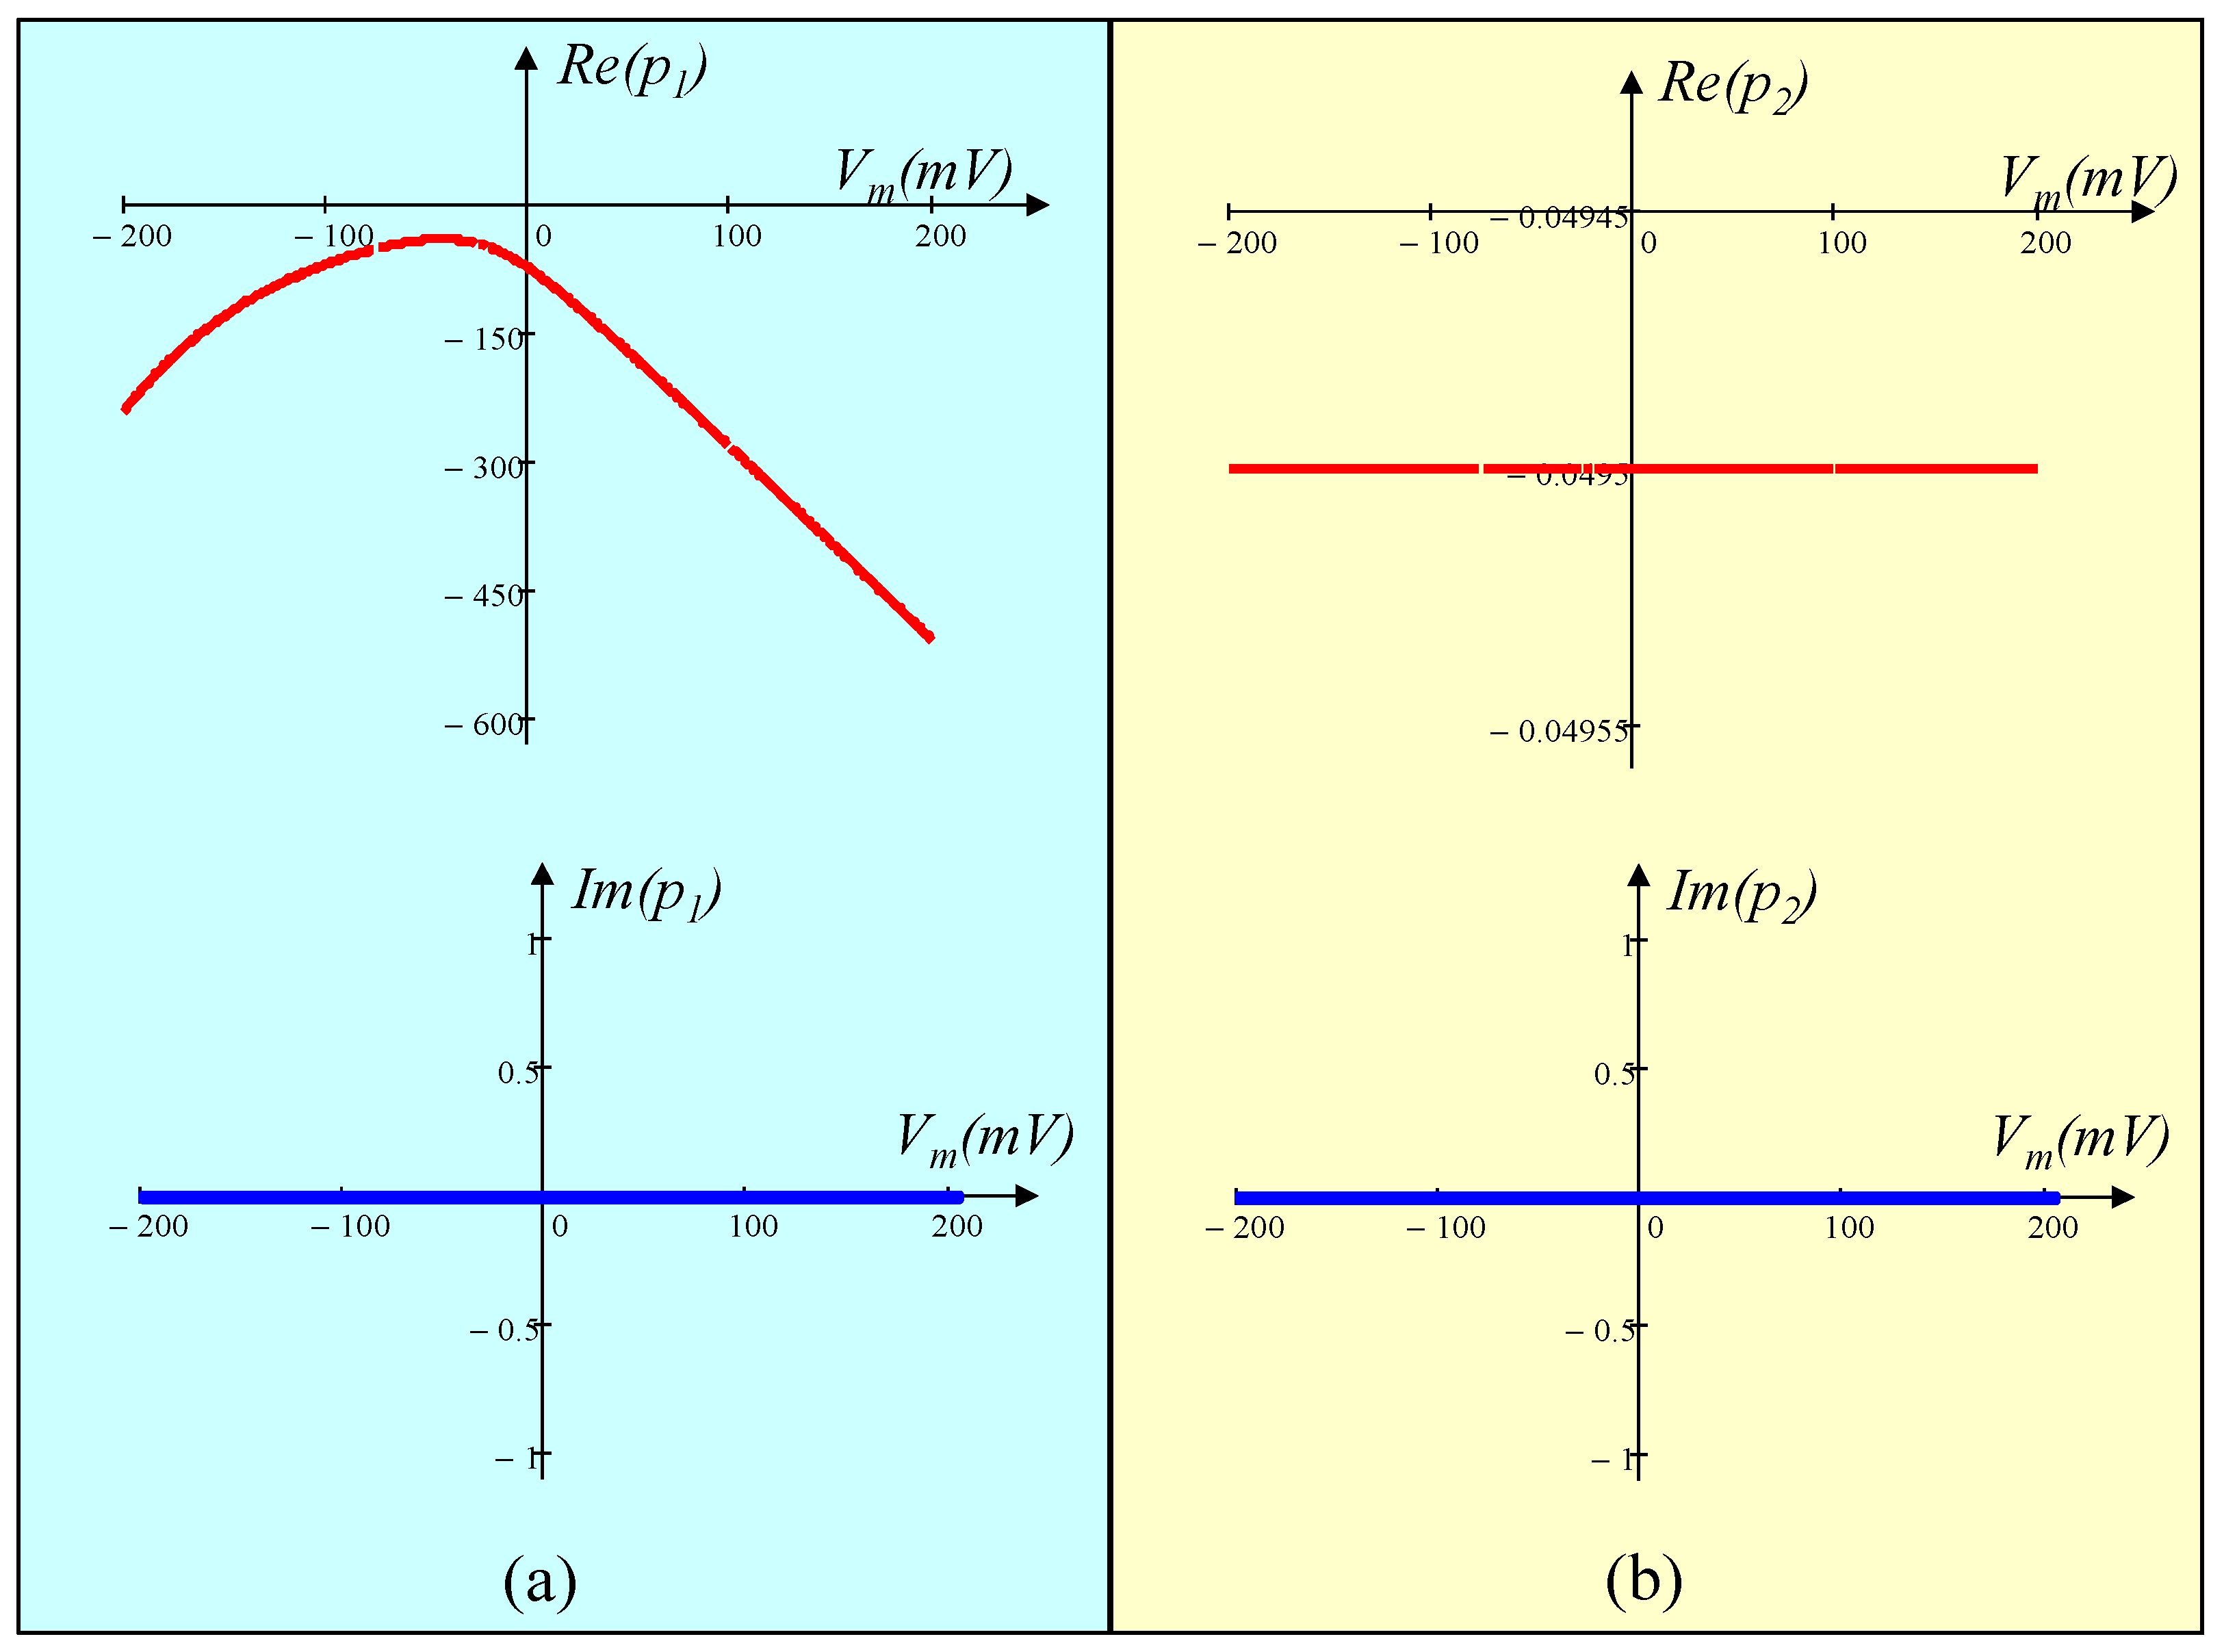
The poles of the small-signal admittance function Y(s; Vm(Q)) as a function of the voltage Vm over −200 mV < Vm < 200 mV is shown in Figure 19. Observe from Figure 19a,b that the two poles Re(p1), Re(p2) are negative while Im(p1), Im(p2) remain consistently zero for the specified DC input Vm. This observation confirms that the two poles of the admittance function possess no complex frequencies.
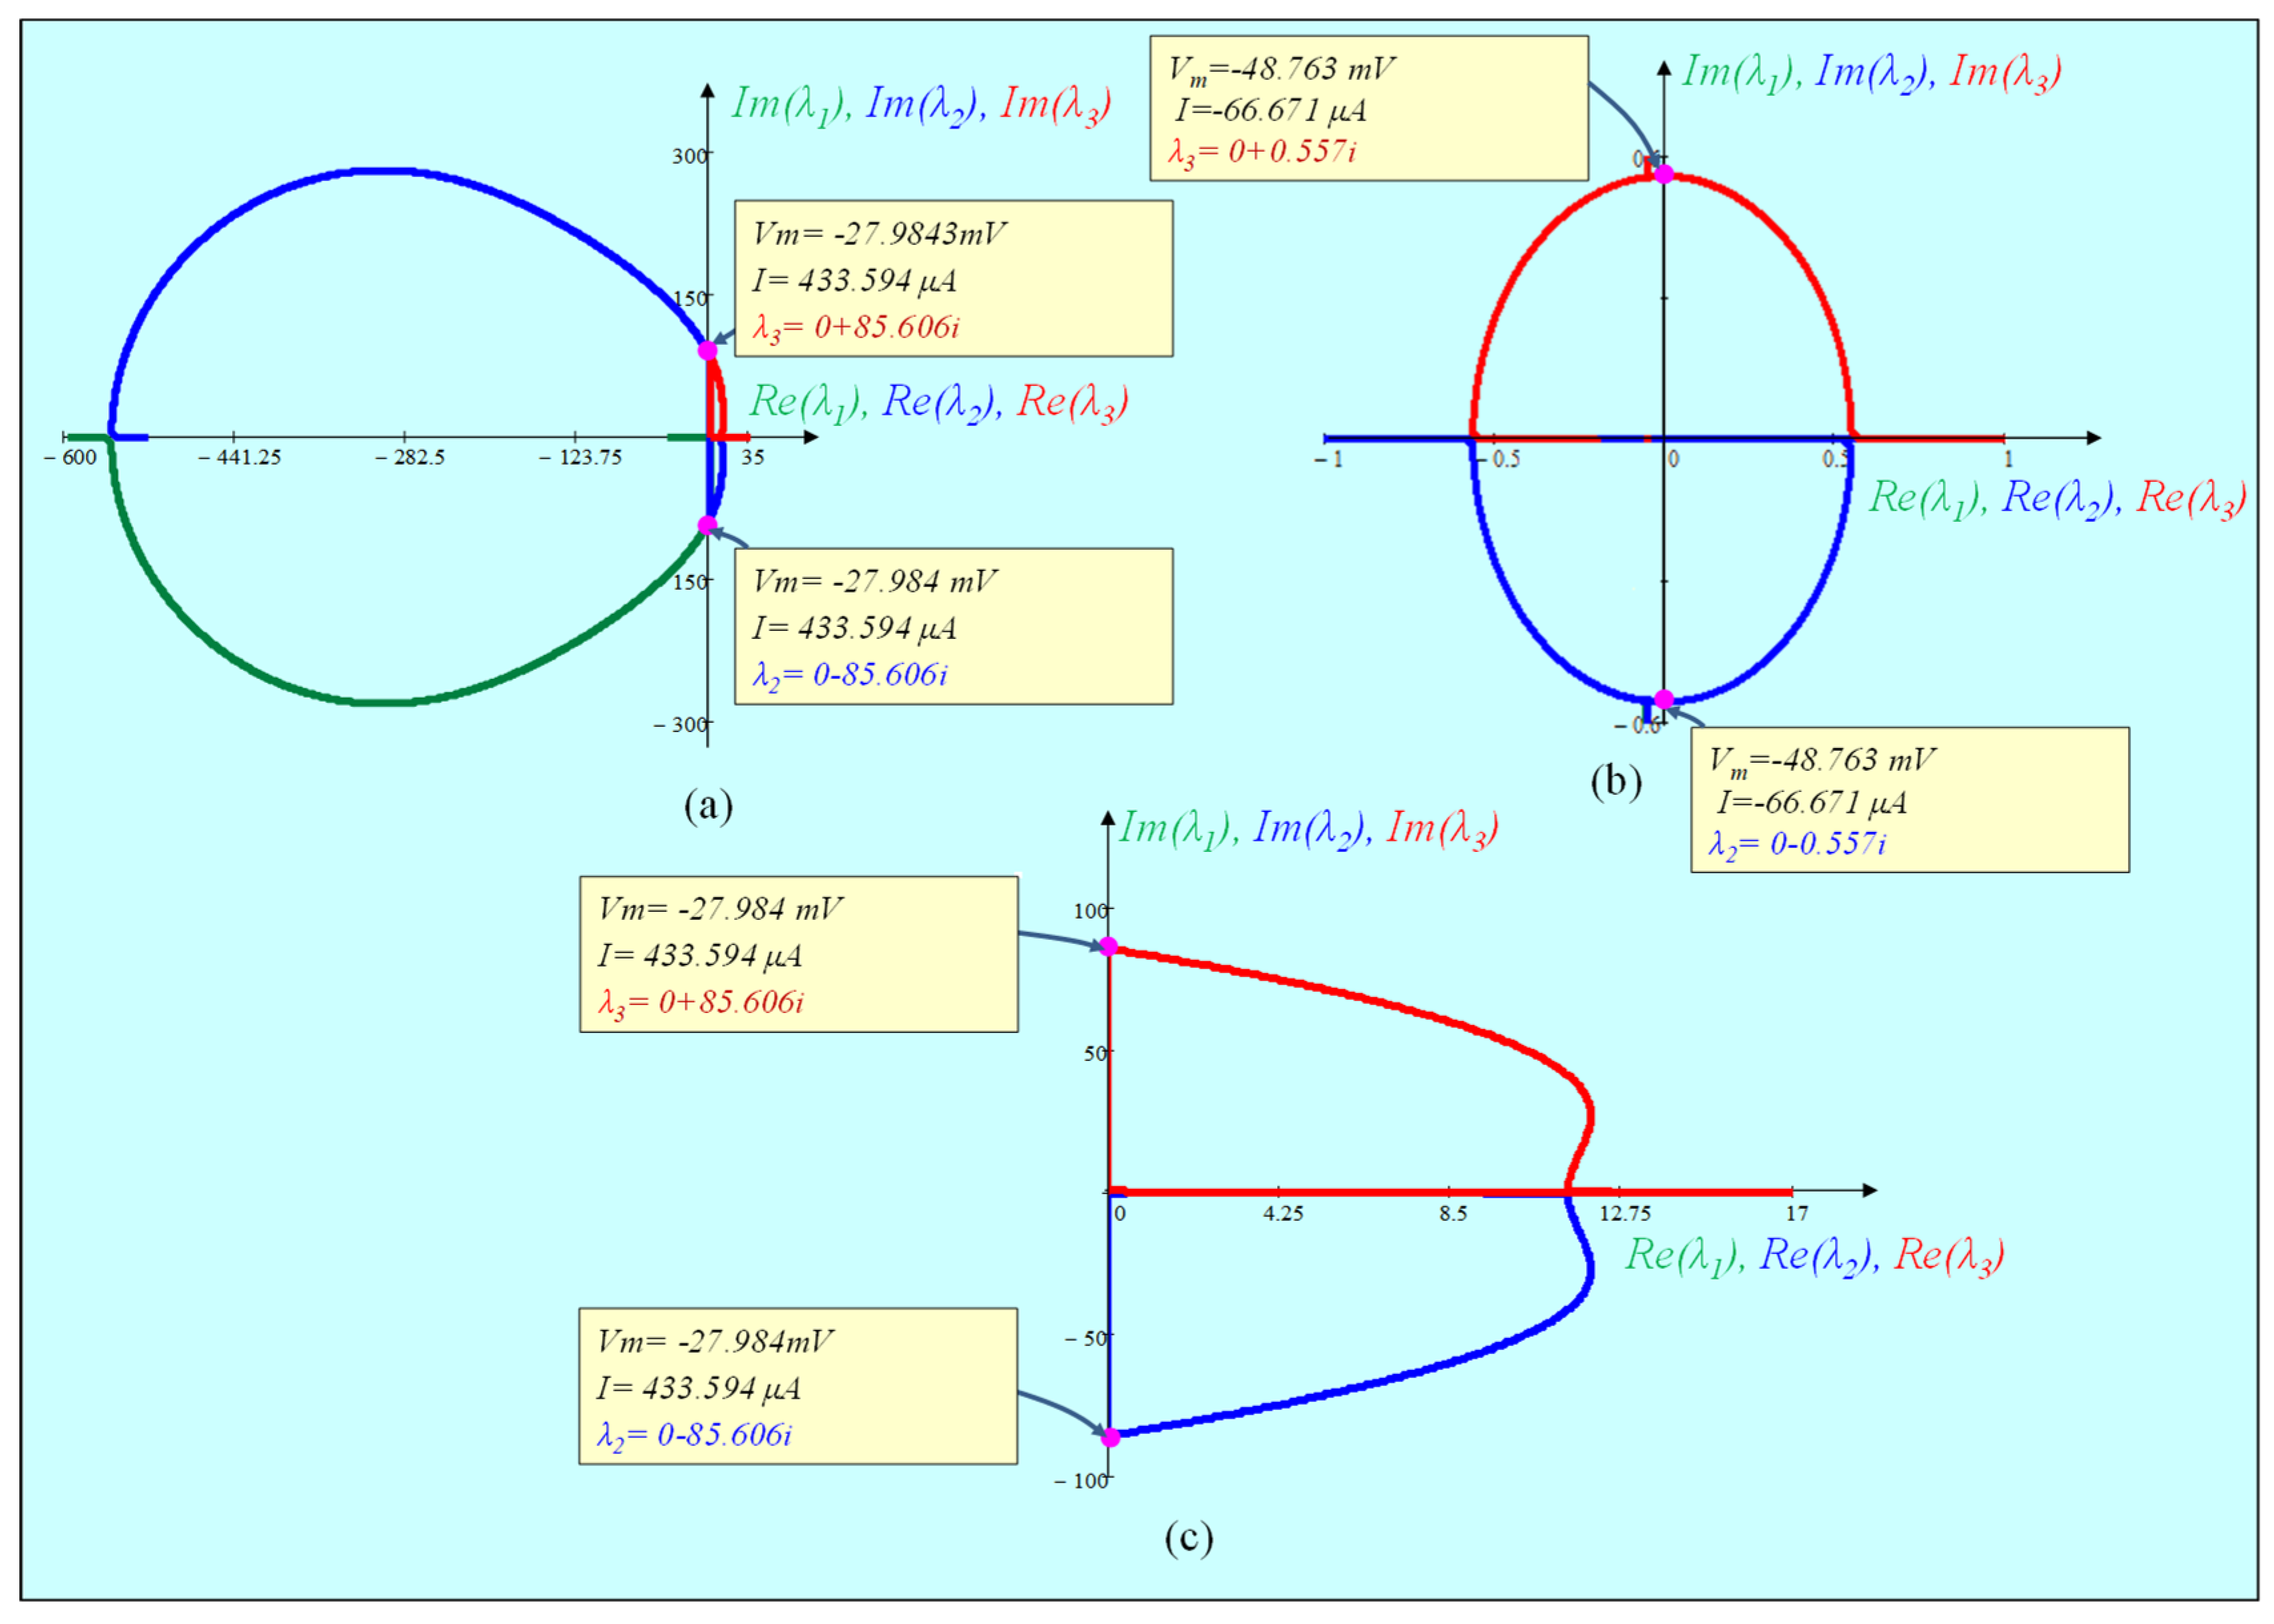
Figure 20a shows the Nyquist plot, i.e., loci of the imaginary part Im(zi) vs. the real part Re(zi) of the zeros as a function of the input voltage Vm over the interval −55 mV ≤ Vm ≤ 25 mV. Observe that the real parts of the two zeros z2 and z3 are zero at Vm = −48.763 mV (resp., I = −66.671 μA) and Vm = −27.984 mV (resp., I = 433.594 μA), respectively. The corresponding points when Re(zi) = 0 are known as Hopf bifurcation points in bifurcation theory. Figure 20b,c show the zoomed version of Figure 20a near the two bifurcation points, respectively. It is also observed that the Re(z2) and Re(z3) lie in the open right half plane (RHP) between the bifurcation points −48.763 mV < Vm < −27.984 mV (resp. −66.671 μA < I < 433.594 μA). Observe from Figure 21 that the eigen values, computed from the Jacobian matrix, associated with the ODEs (1)–(3) are identical to the zeros of the neuron local admittance Y(s; Vm(Q)), as inferable from Figure 20, and expected from the Chua theory [3,4].

6. Local Activity, Edge of Chaos, and Hopf-Bifurcation in Memristive Chay Model

Local activity and the edge of chaos are powerful mathematical and quantitative theories to predict whether a nonlinear system exhibits complexity or not. Local activity refers to a characteristic of nonlinear systems wherein infinitesimal fluctuations in energy are amplified, leading to the emergence of complex dynamical behavior in the system [34,35,36,37,38,39,40,41,42,43,44]. This section presents an extensive analysis of the memristive Chay model using the principles of local activity, the edge of chaos, and the Hopf-bifurcation theorem to predict the mechanism of generating the complicated electrical signals in an excitable cell.

6.1. Locally Active Regime

The local activity theorem developed by Chua reveals that a nonlinear system must satisfy at least one of the following conditions, concerning its local transfer function about a given operating point in order to support the emergence of complexity [36].
(i) The zero of the admittance function Y(s; Vm(Q)) lie in the open-right plane where Re(sz) > 0.
(ii) Y(s; Vm(Q)) has multiple zeros on the imaginary axis.
(iii) Y(s; Vm(Q)) has a simple zero on the imaginary axis s = z on the imaginary axis and K Q ( i ω z ) lim s i ω z = ( s i ω z ) Y ( s ; V m ( Q ) ) is either a negative real number or a complex number.
(iv) ReY(; Vm(Q)) < 0 for some ω ϵ [−∞, +∞].
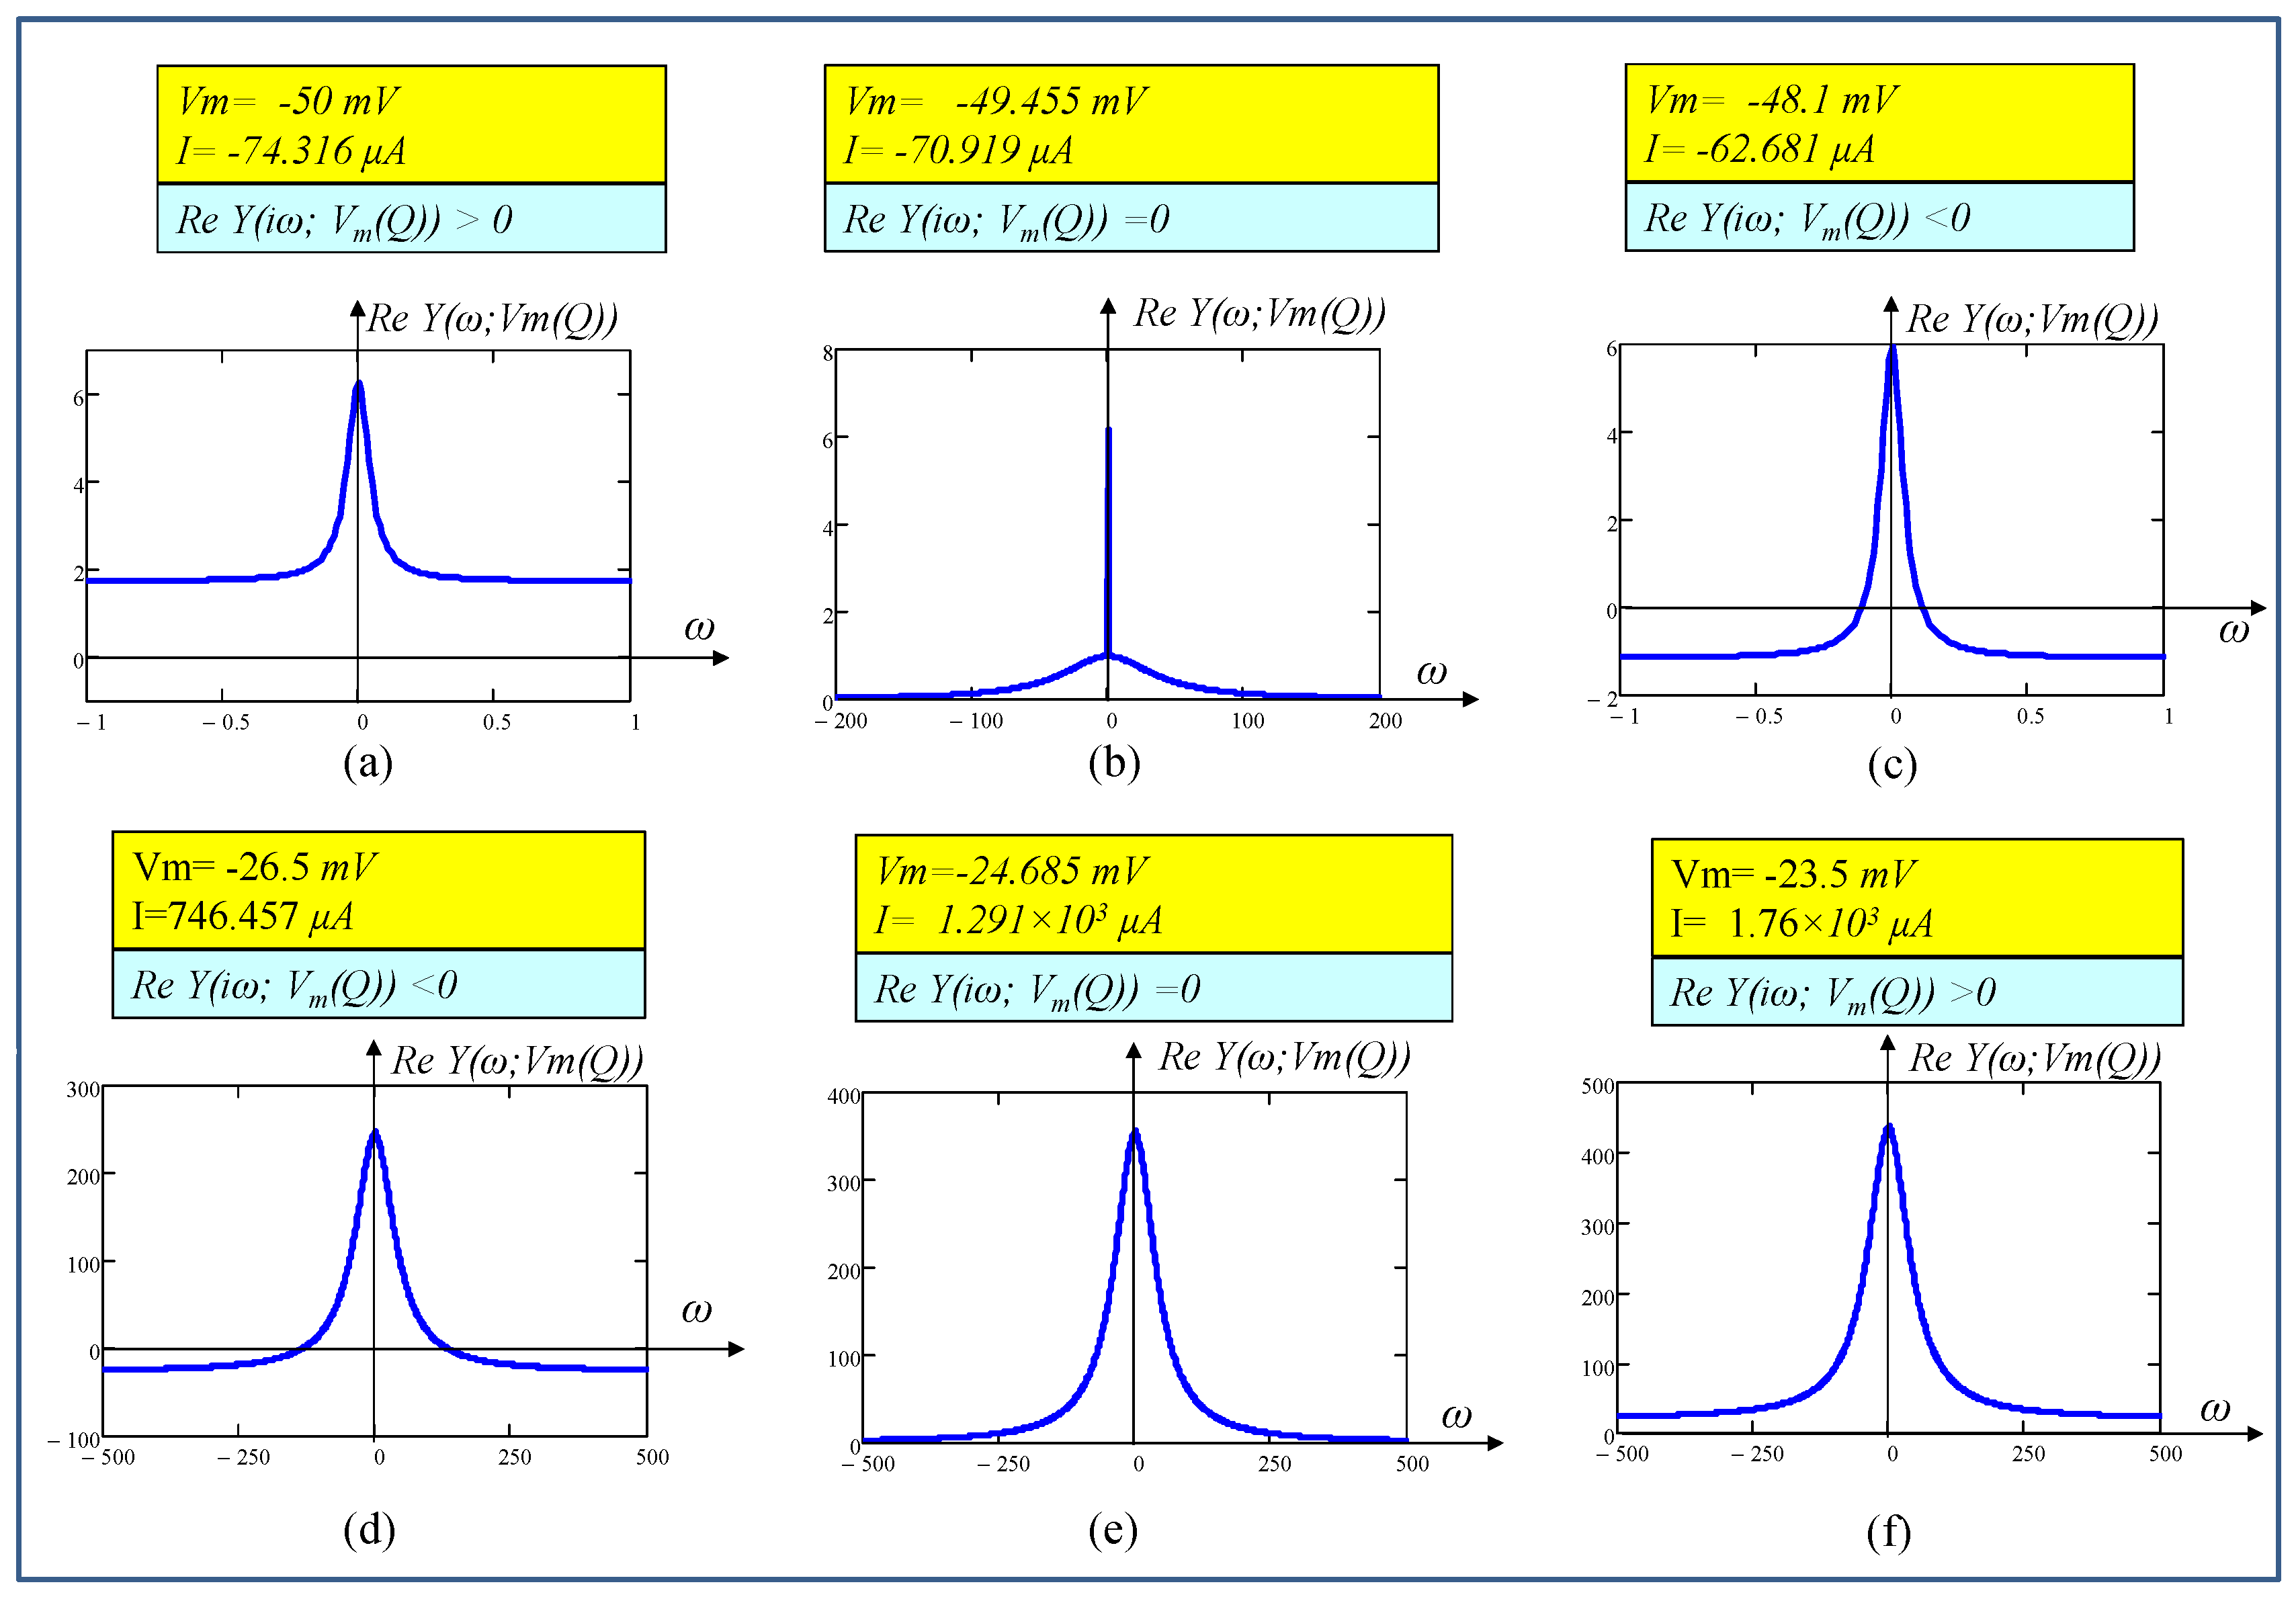
In other words, the emergence of action potentials, chaos, bursting, or spikes in neurons are impossible unless the cells are locally active. Therefore, restricting the behavior of a nonlinear system to its local activity operating regime reduces the considerable time necessary to identify the complex phenomena that may emerge across its physical medium as compared with a standard trial-and-error numerical investigation. In order to restrict the above dynamical behavior in the memristive Chay model of an excitable cell in the local activity regime, we performed comprehensive numerical analyses within the range of the DC equilibrium voltage Vm = −50 mV (resp. I = −74.316 μA) to Vm = −23.5 mV (resp. I = 1.76 × 10³ μA). Observe from Figure 22a the real part of the admittance of the frequency response ReY(; Vm(Q)) > 0 at Vm = −50 mV (resp. I = −74.316 μA), thereby confirming locally passive at this equilibrium point. However, when Vm > −50 mV, our in-depth simulation in Figure 22b shows that ReY(; Vm(Q)) = 0 at Vm = −49.455 mV (resp. I = −70.919 μA) and Figure 22c,d show that ReY(; Vm(Q)) < 0 at Vm = −48.1 mV (resp. I = −62.681 μA) and Vm = −26.5 mV (resp. I = 746.457 μA) respectively for some frequency ω, confirming an excitable cell is locally active at these equilibria. Our simulations in Figure 22e shows a further increase in the DC equilibrium voltage at Vm = −24.685 mV (resp. I =1.291 × 10³ μA), and the loci are tangential to the ω axis, i.e., ReY(; Vm(Q)) = 0. However, when Vm > −24.685 mV, say Vm = −23.5 mV (resp. I = 1.76 × 10³ μA), it is observed from Figure 22f that Re Y (; Vm(Q)) > 0, and the memrisitve Chay model is no more locally active, confirming the cell is locally passive at this equilibrium. Therefore, the local activity regime that started above Vm = −49.455 mV (resp. I = −70.919 μA) exists over the following regime
  Local   ActivityRegime   - 49 . 455   m V < V m < 24 . 685   m V - 70 . 919   μ A < I < 1.291 × 10 3 μ A    

6.2. Edge of Chaos Regime

The edge of chaos is a tiny subset of the locally active domain where the zeros of the admittance function Y(s; Vm(Q))(equivalent to the eigen values of the Jacobian matrix) lie in the open left-half plane, i.e., Re(zp) < 0 (eigen values λi < 0) as well as ReY(; Vm(Q)) < 0. Figure 21a,b show the real part of the eigen values vanish at Vm = −48.7631 mV (resp. I = −66.671 μA) with a pair of complex eigen values λ2,3 = ±0.557i. It follows from the edge of chaos theorem that the corresponding equilibrium point is no longer asymptotically stable and becomes unstable thereafter, confirming the first edge of chaos regime over the following small interval:
  Edge   of   chaos   domain   1   49.455   m V < V m < 48.763   m V 70.919   μ A < I < 66.671   μ A  
Observe from Figure 21c that the real part of the eigen values vanish at λ2,3 = ±85.606i at DC equilibrium voltage Vm = −27.984 mV (resp. I = 433.594 μA). It follows that the corresponding equilibrium point Vm(Q) is no longer asymptotically stable below this equilibrium point, therefore confirming the existence of a second edge of chaos regime over the following interval:
  Edge   of   chaos   Domain   2 27.984   m V < V m < 24.685   m V 433.594   μ A < I < 1.291 × 10 3 μ A  
The nonlinear dynamical behavior of the memristive Chay model in this paper is controlled by the function of the input stimulus I. The local activity, edge of chaos 1 and edge of chaos 2 regimes are computed in this paper under the assumption of departing the input parameter I from lower stimulus to higher stimulus (resp. low DC equilibrium voltage Vm(Q) to high equilibrium voltage Vm(Q)).

6.3. Hopf-Bifurcation

Hopf-bifurcation namely, super-critical and sub-critical bifurcations are local bifurcation phenomena in which an equilibrium point changes its stability as the parameter of the nonlinear system changes under certain conditions. An unstable equilibrium point surrounded by a stable limit cycle results in a super-critical Hopf bifurcation, whereas a subcritical Hopf bifurcation refers to a qualitative change in the behavior of a system where a stable equilibrium point transitions to instability, giving rise to sustained oscillations or limit cycles as a parameter is varied. Our careful simulation at Hopf-bifurcation point 1 at Vm = −48.763 mV (resp. I = −66.671 μA) (The supercritical Hopf bifurcation points 1 and 2 observed in this paper are based on the numerical simulations and for the parameters listed in Table 2. The bifurcation phenomenon may vary for different parameters and environments.) shows that stimulus current I should be chosen within the very small edge of chaos domain 1, where the real part of the eigen values are negative. The result converges to DC equilibrium for any initial conditions. Likewise, if I is selected within bifurcation point 1, where the real part of the eigen values are positive, the result converges to a stable limit cycle. Therefore, it follows from the bifurcation theory that bifurcation point 1 is a super-critical Hopf bifurcation. Figure 23a,b show the numerical simulations at I = −68.118 μA and I = −65.077 μA, respectively. Observe from Figure 23a,b that I =−68.118 μA lying within the tiny subset of edge of chaos domain 1 converges to DC equilibrium and I = −65.077 μA lying in the open right half-plane (RHP) converges to spikes, respectively, confirming that bifurcation point 1 is a super-critical Hopf bifurcation.
Similarly, our careful examination predicts a stable DC equilibrium point when current I is chosen within a very small edge of chaos 2, confirming supercritical Hopf bifurcation at bifurcation point Vm = −27.984 mV (resp. I = 433.594 μA). The possibility of the above scenario is illustrated in Figure 24. Figure 24a shows the membrane potential Vm converges to a stable DC equilibrium point when I = 440 μA, chosen within the edge of chaos domain 2. Figure 24b shows that when I = 430.884 μA, chosen very close and inside the bifurcation point 2, where the real part of the eigenvalue is positive and lies in the open right half plane (RHP), the transient waveform converges to a stable limit cycle as predicted by the Hopf super critical bifurcation theorem.
Table 3 illustrates the computation of the potassium ion channel activation n, calcium concentration Ca, and eigen values (λ1, λ2, and λ3) as a function of the DC stimulus current I (resp. membrane potential Vm) at the DC equilibrium point Q. It is observed from Table 3 and Figure 21a,c that the two Hopf bifurcations points 1 and 2 occur at Vm = −48.763 mV (resp. I = −66.671 μA) and Vm = −27.984 mV (resp. I = 433.594 μA), respectively, where the eigen values are purely imaginary at these two equilibria. As I decreases (resp. Vm decreases) from Hopf bifurcation point 1, the eigen values migrate to the left-hand side, confirming the real parts of the eigen values are no longer positive and thereby confirming the first negative real eigen values regime exists over the following interval.
Negative   real   eigen   values   regime   1 : < V m < 48.763   m V < I < 66.671   μ A  
Similarly, as I increases (resp. Vm increases) from the second bifurcation points, the positive real part of the eigen values migrates from the open right half to the open left half, confirming the second negative real eigen values regime over the following interval:
Negative   real   eigen   values   regime   2 : 27.984   m V < V m < + 433.594   μ A < I < +  
Observe from Table 3 and Figure 21a–c that two eigen values of the Jacobian matrix associated with the ODE set Equations (1)–(3) lie on the open RHP for each operating point Q corresponding to a DC current I value between Hopf bifurcation point 1 and Hopf bifurcation point 2. Therefore, the generation of periodic, bursting, spikes, and chaos signals predicted by the Hopf bifurcation theorem in an excitable cell exists over the following interval:
Unstable   ( periodic ,   bursting ,   chaos ,   spikes )   regime : 48.763   m V < V m < 27.984   m V   66.671   μ A < I < 433.594   μ A  
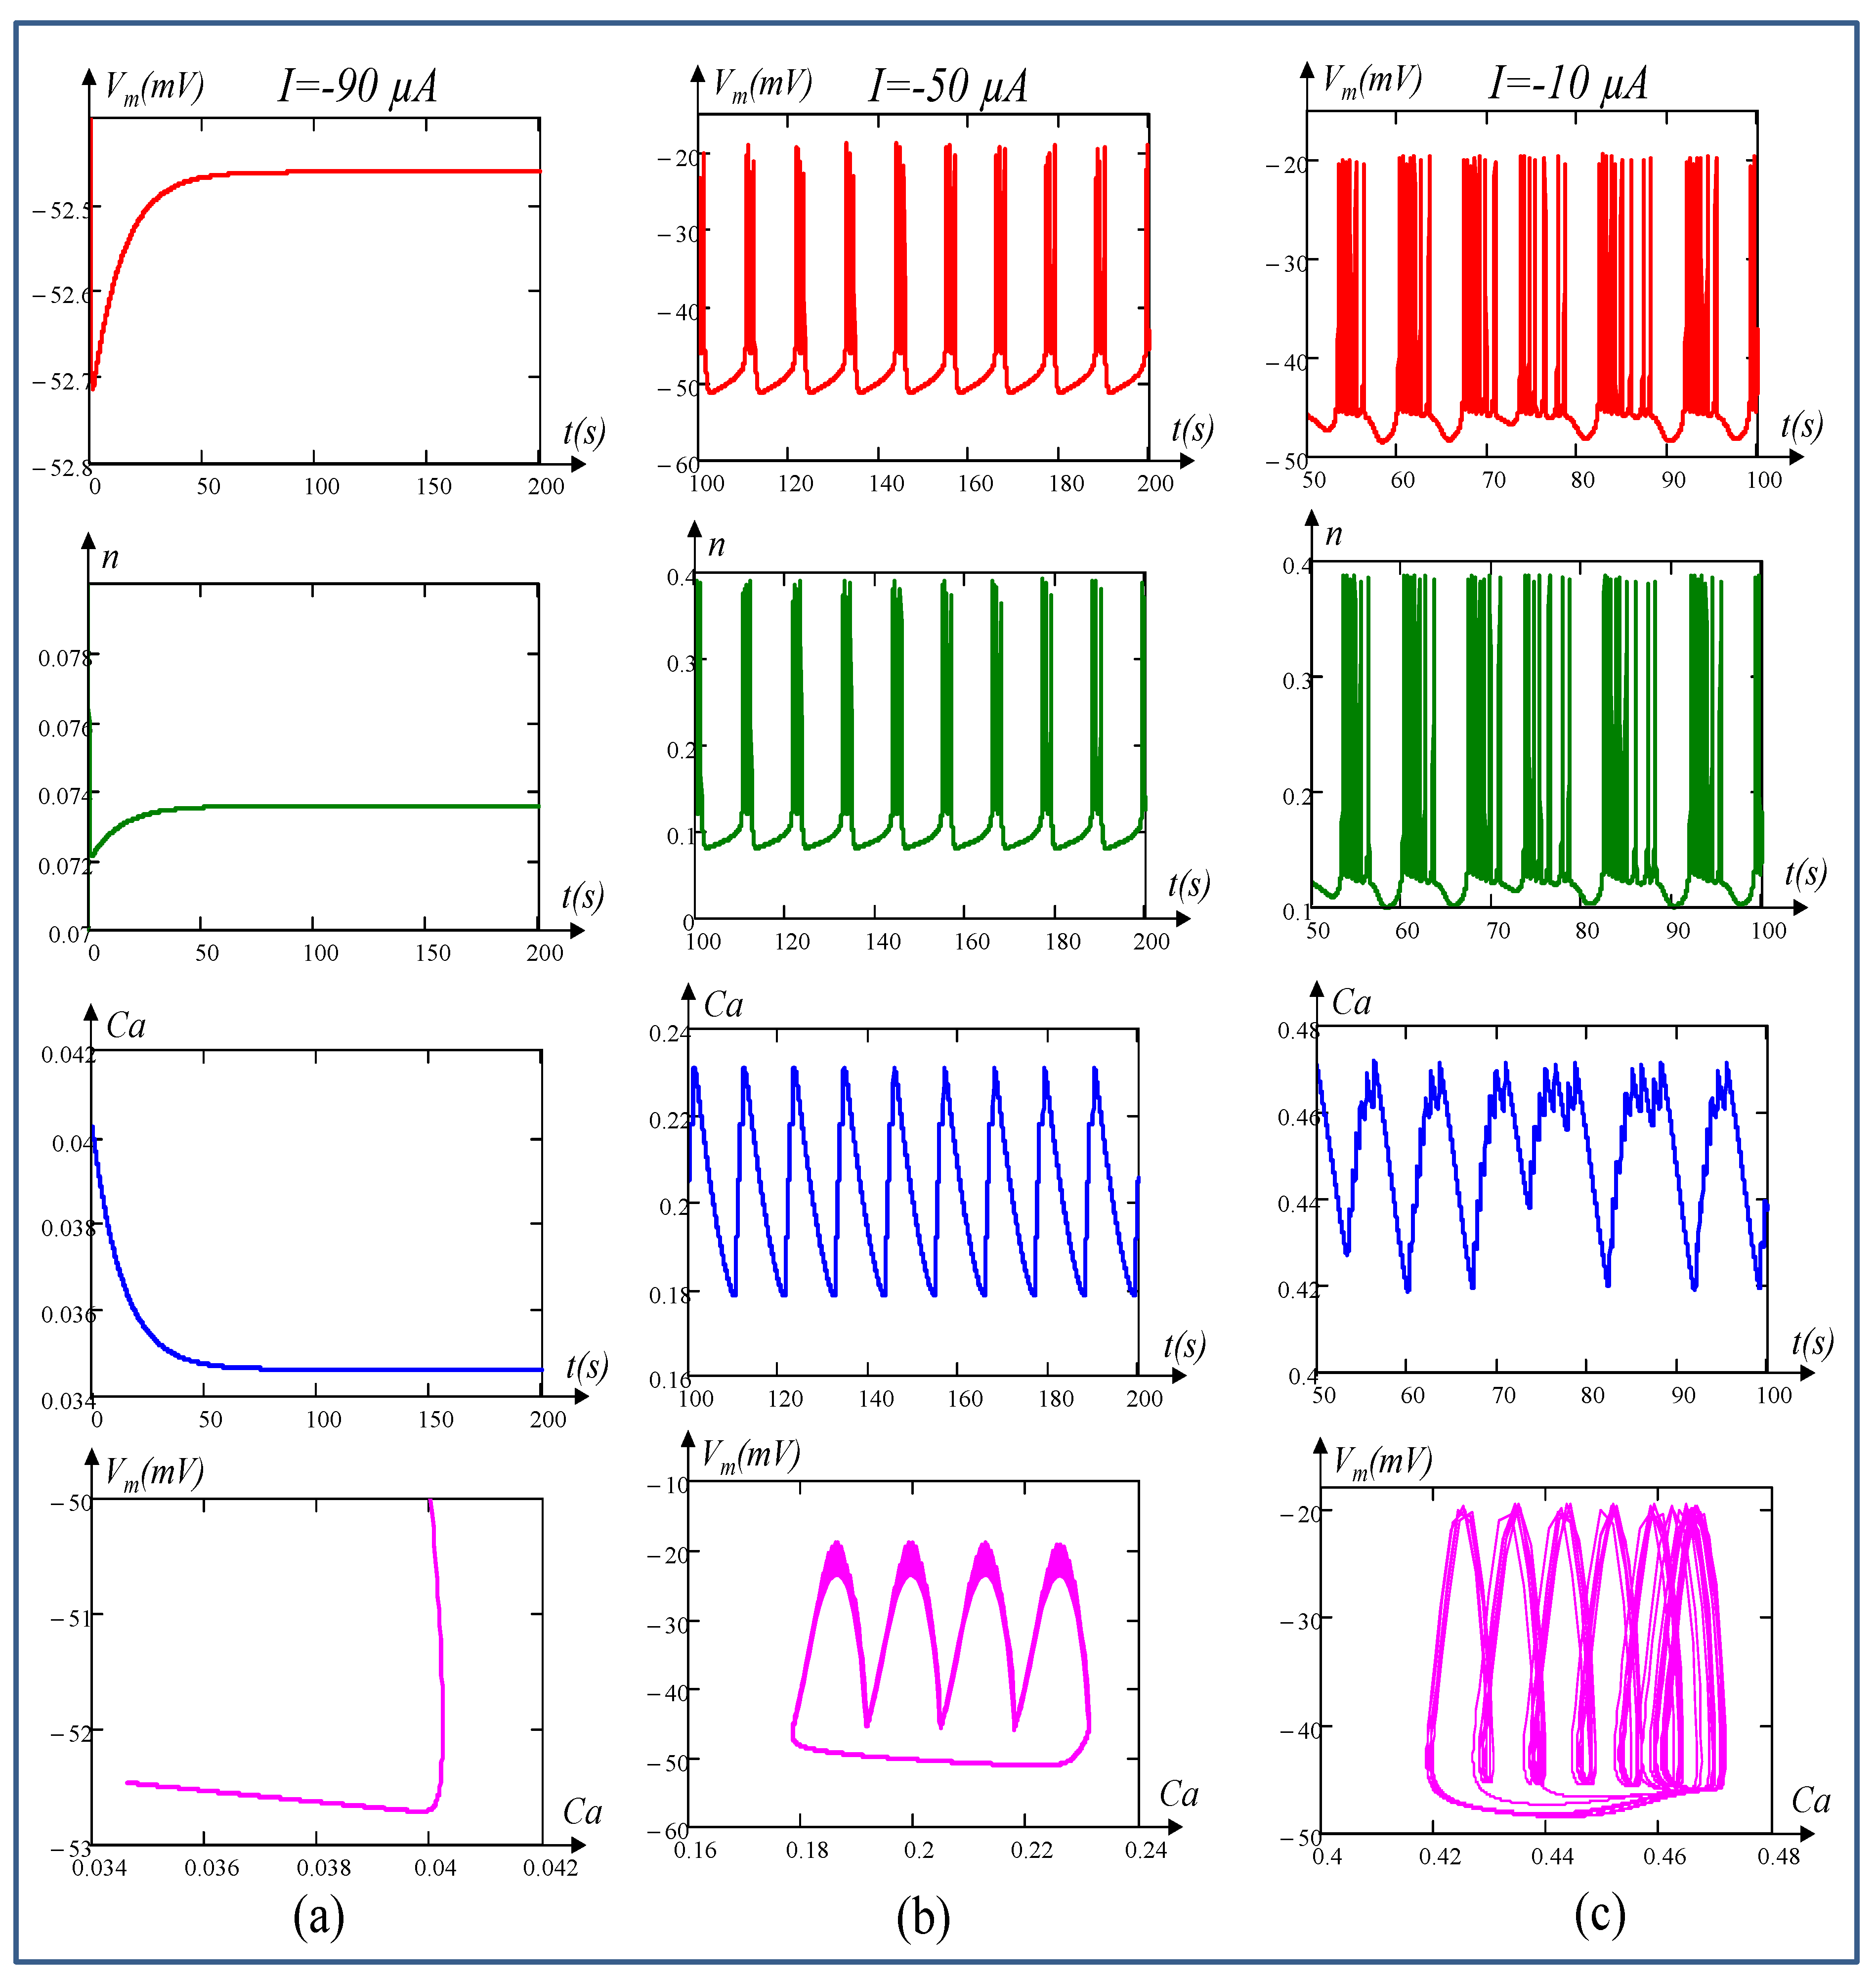
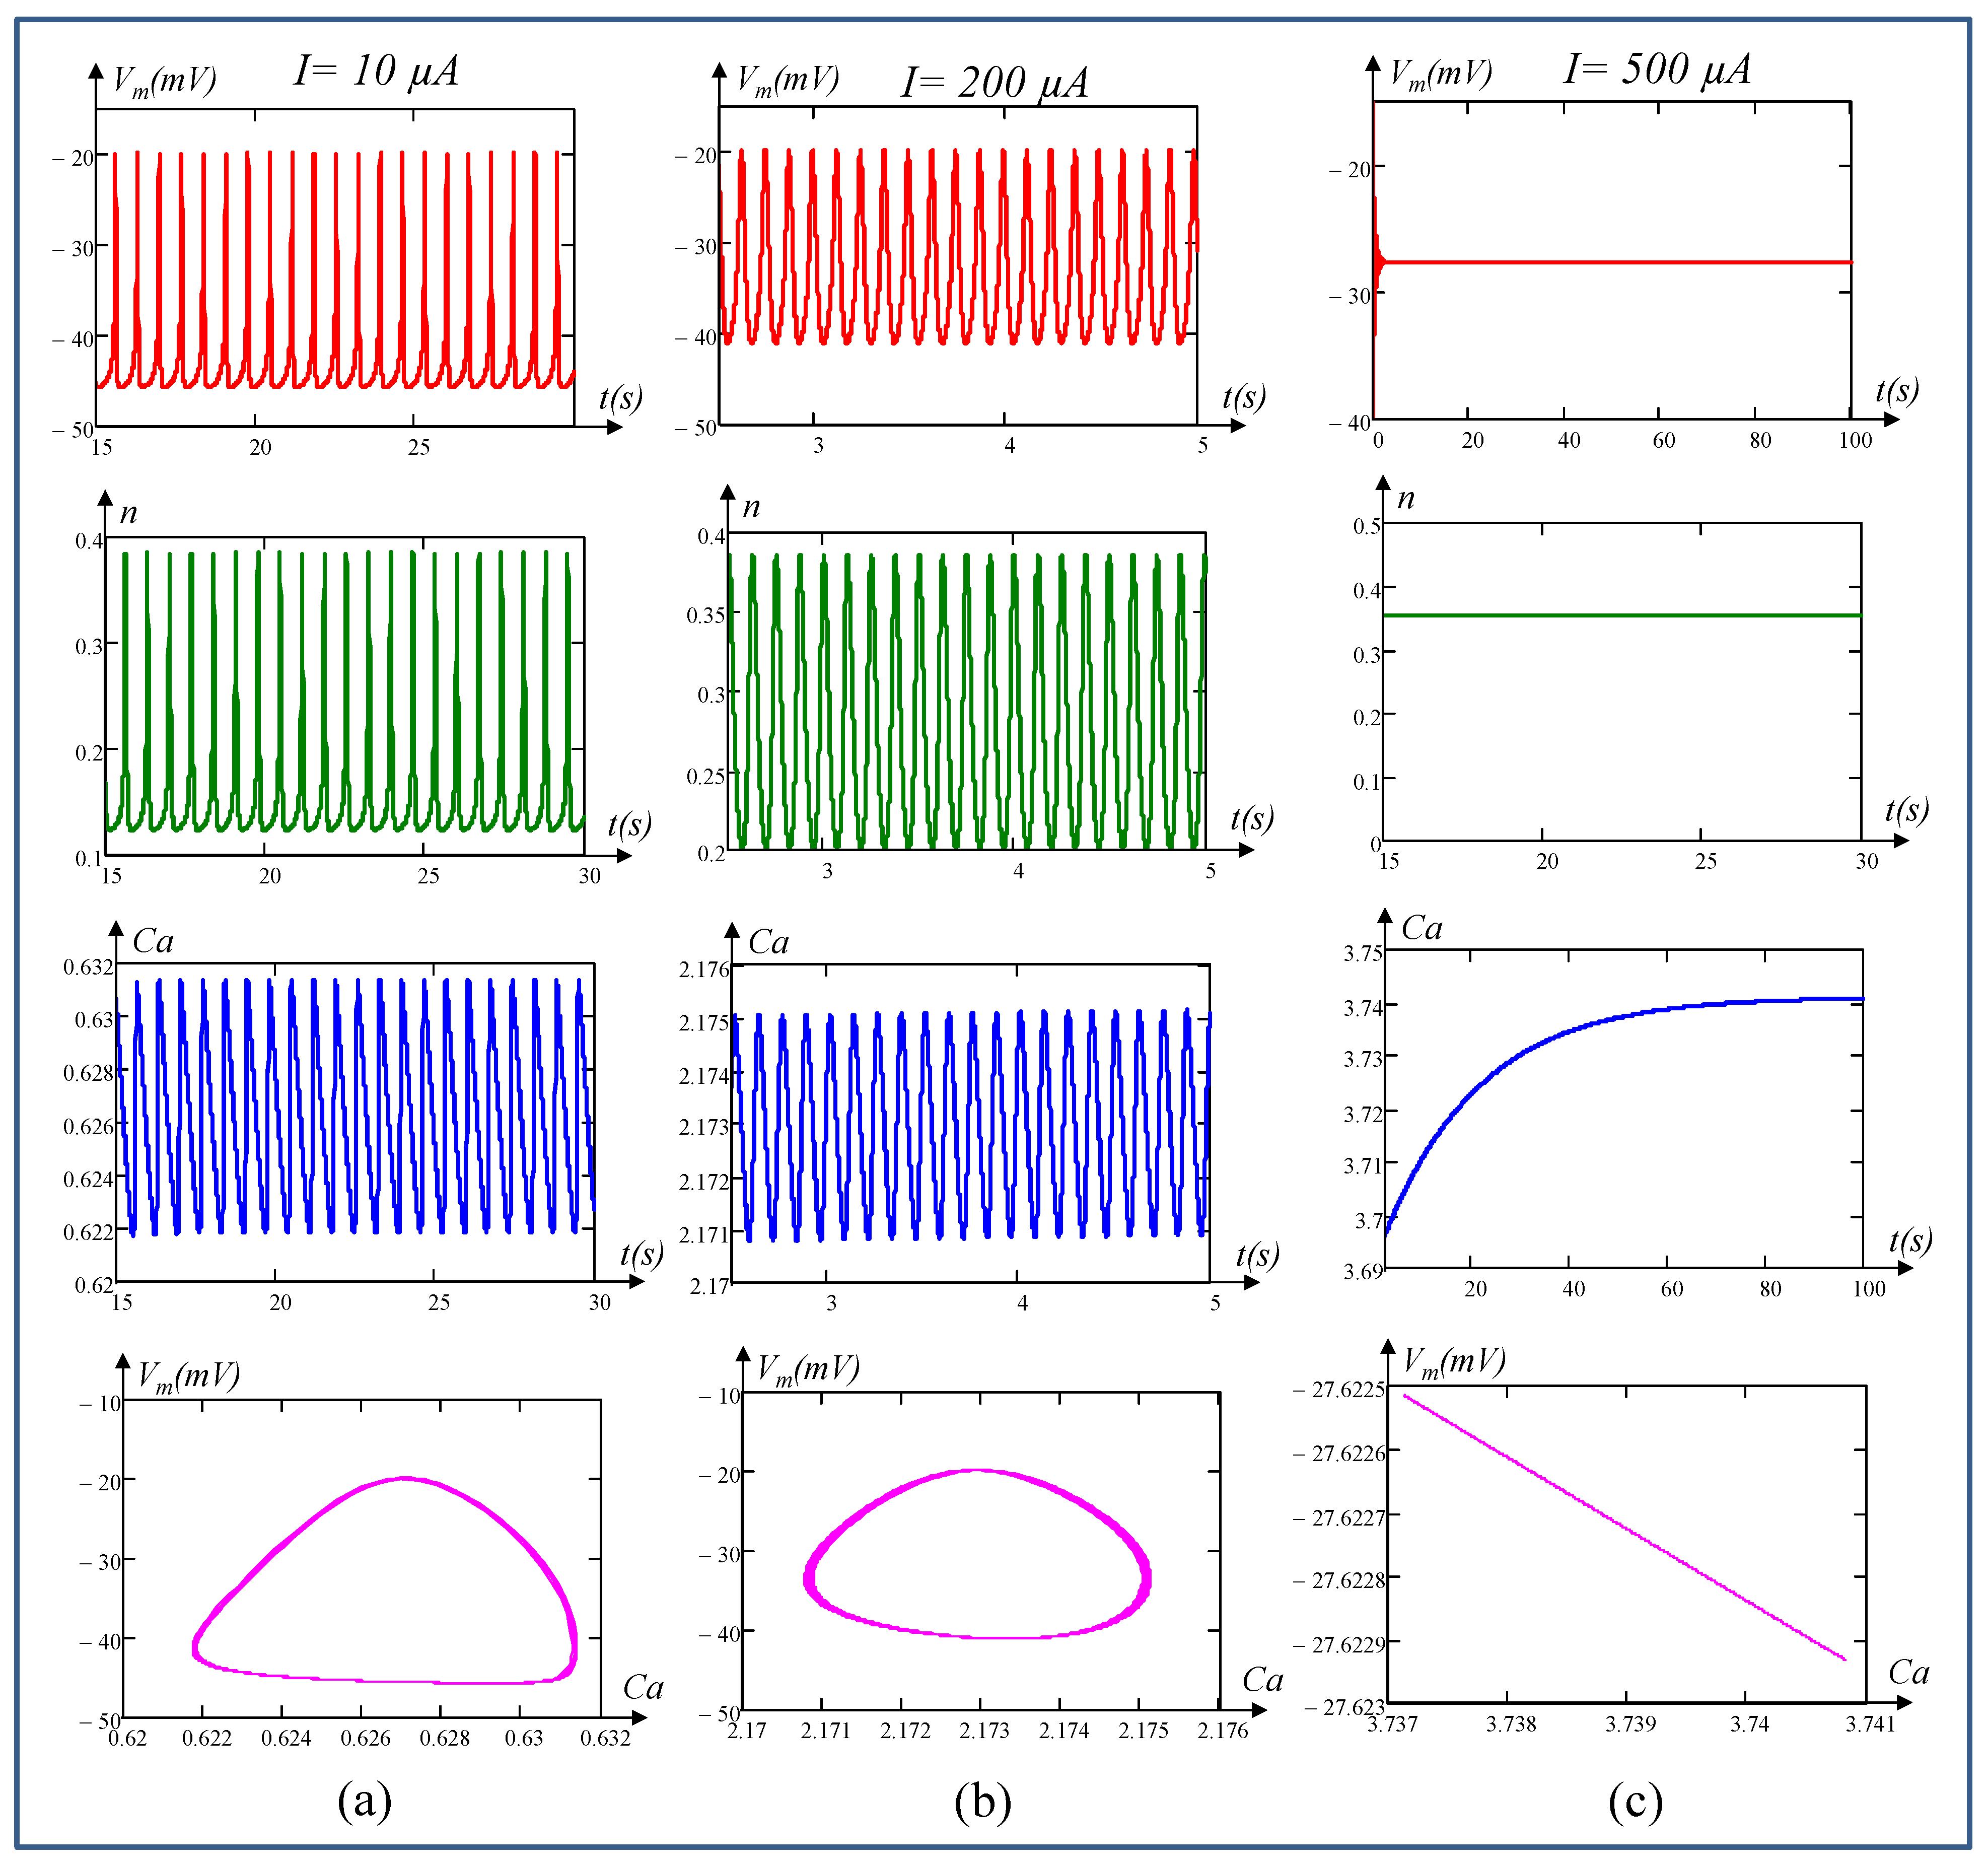
The convergence of the membrane potential to stable and unstable DC equilibrium points is verified by numerical simulations at different values of I and is illustrated in Figure 25. Figure 25a shows the transient waveform of membrane potential Vm converging to a stable DC equilibrium at I = −90 µA, confirming the Hopf bifurcation theorem no longer holds at this equilibrium. Similarly, when DC stimulus currents I = −50 µA and −10 µA are chosen inside the two bifurcation points I = −66.671 μA and I = 433.594 µA, we observed different patterns of oscillations as shown in Figure 25b,c, confirming the bifurcation theorem holds in this regime. Likewise, when DC stimulus currents I = 10 μA and I = 2000 μA are applied within the bifurcation points I = −66.671 μA and I = 433.594, respectively, oscillation patterns emerge as depicted in Figure 26a,b. Similarly, Figure 26c illustrates the transient waveform of the membrane potential Vm, indicating its convergence to a stable DC equilibrium at I = 500 μA. This observation suggests that the Hopf bifurcation theorem no longer holds at this equilibrium point.
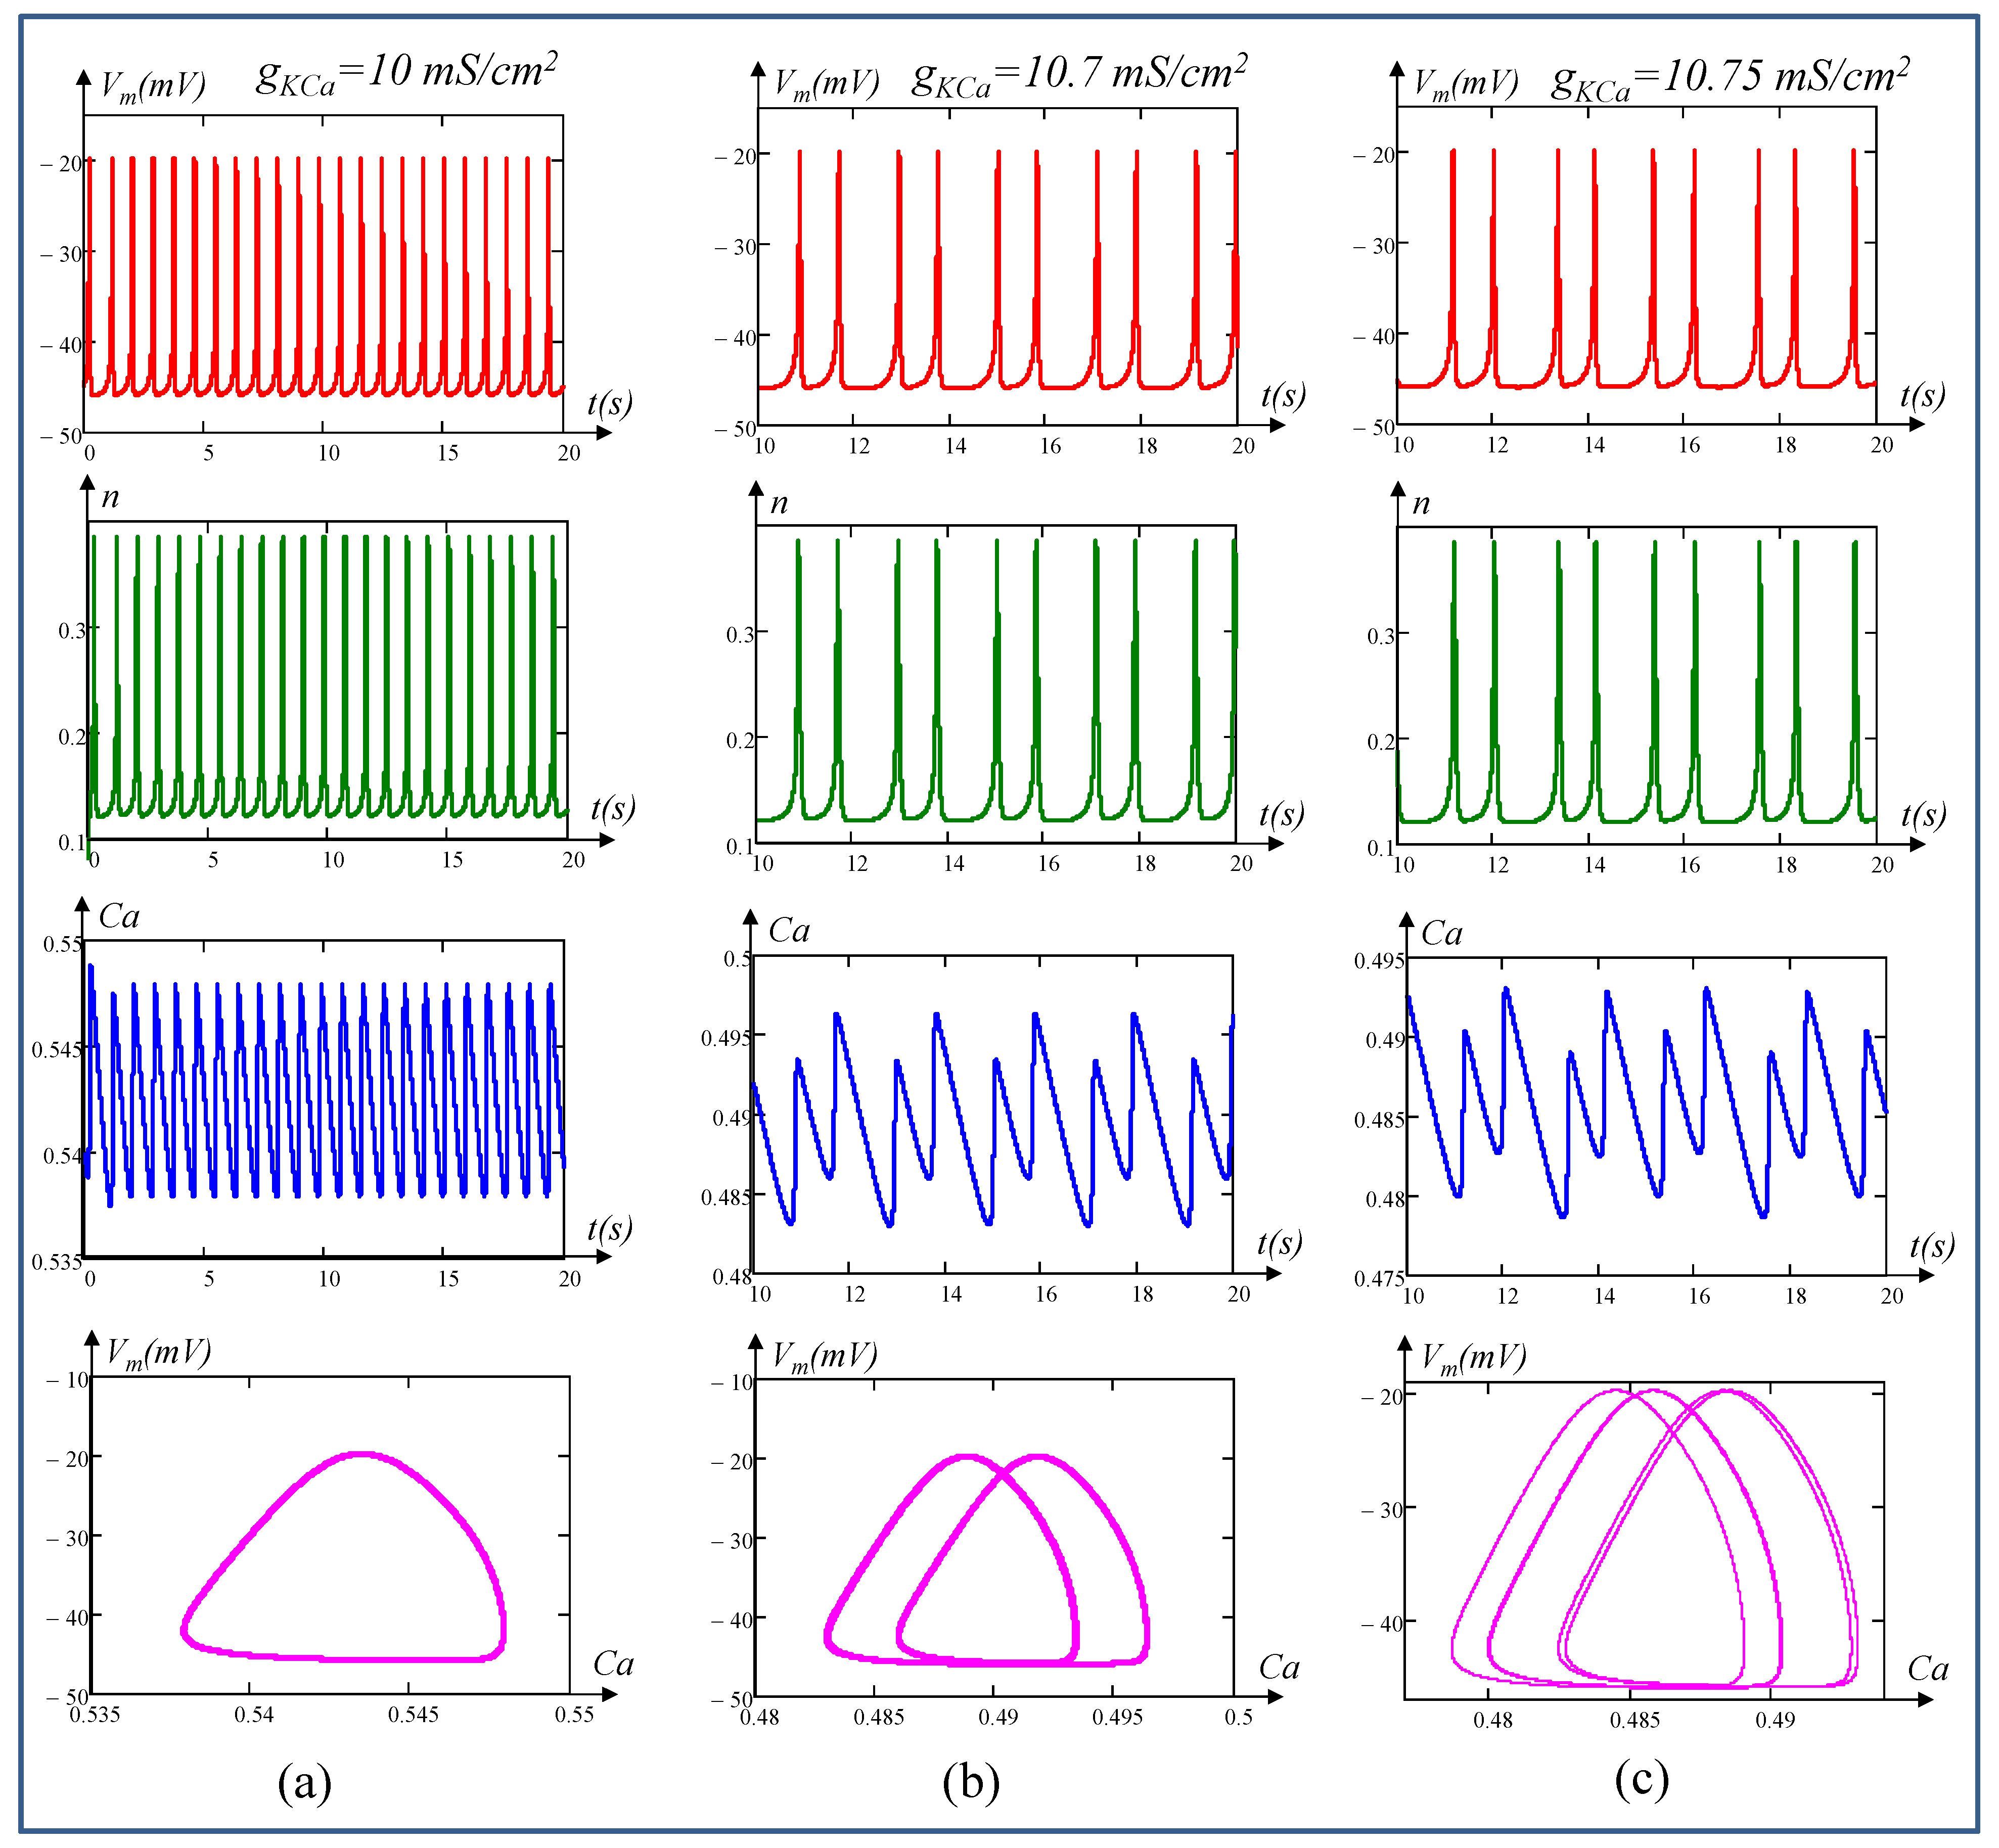
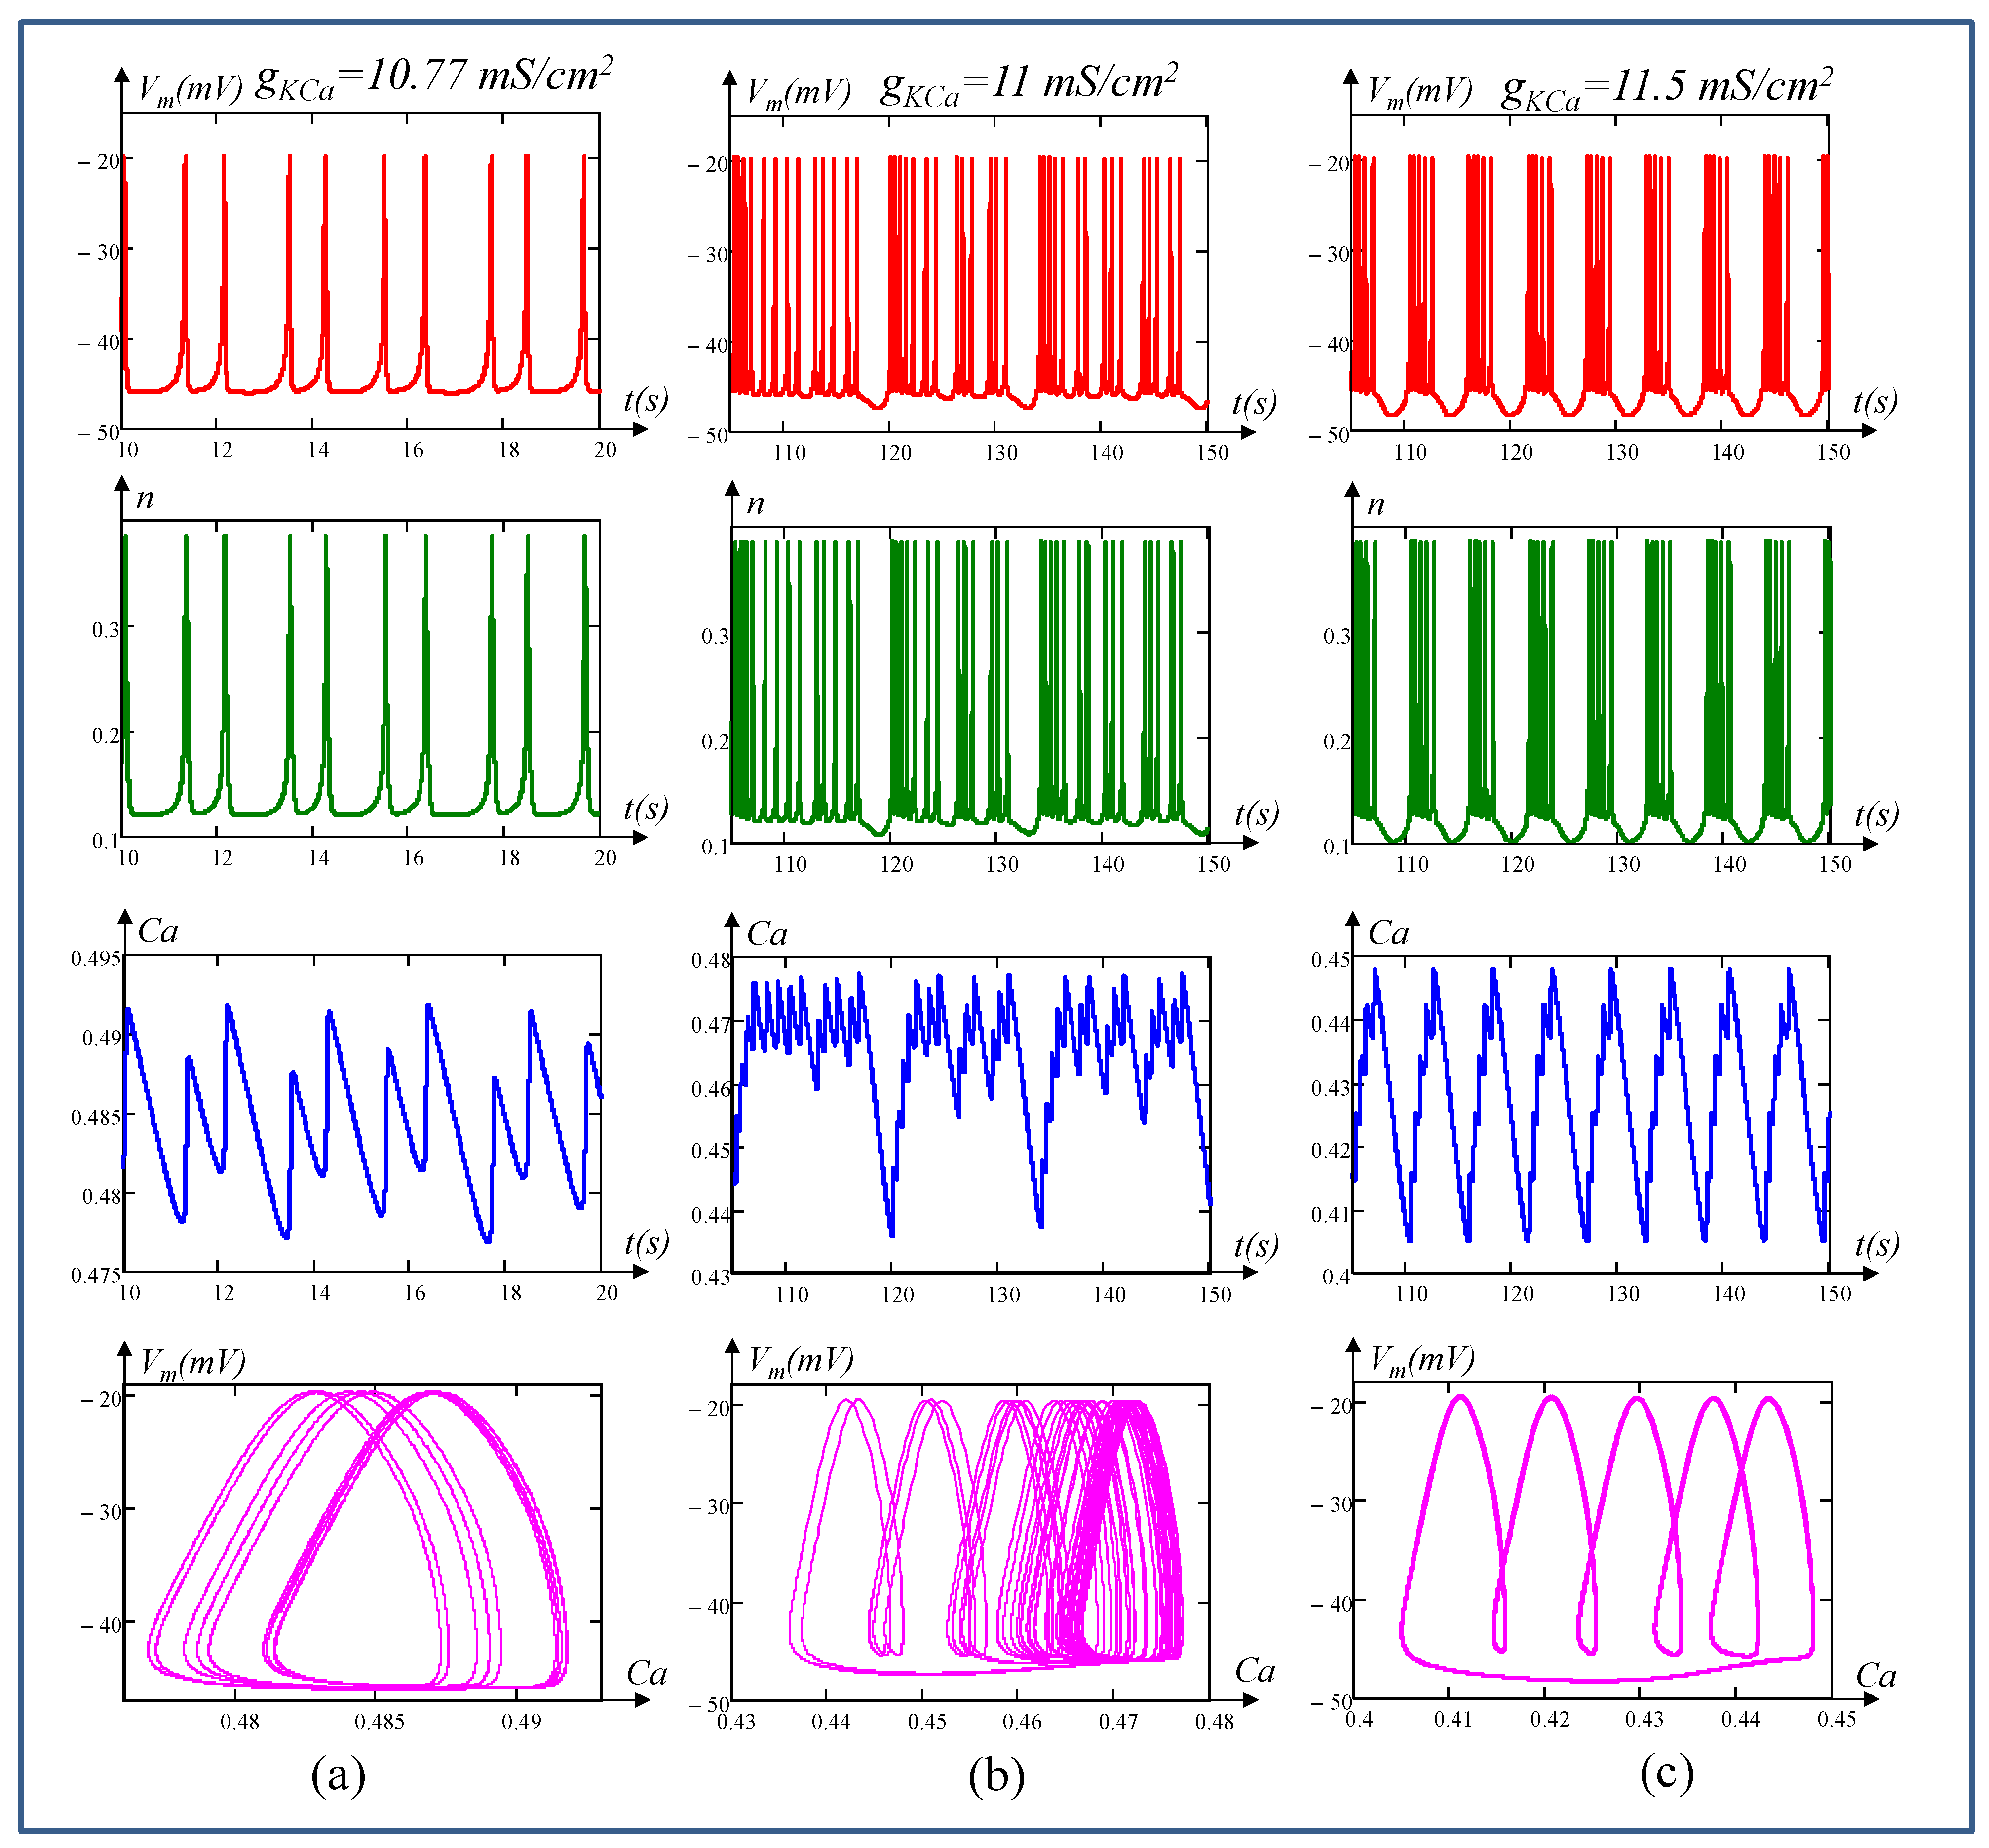
Figure 27 and Figure 28 show the different patterns of oscillations when the conductance gKCa of the calcium-sensitive potassium ion channel memristor is varied from 10 mS/cm2 to 11.5 mS/cm2 at stimulus current I = 0. Figure 27a shows the excitable membrane cell has a stable limit cycle with period one at gK,Ca = 10 mS/cm2. As the parameter gK,Ca increases to 10.7 mS/cm2, 10.75 mS/cm2, and 10.77 mS/cm2, the cell fires periods two, four, and eight, as shown in Figure 27b, Figure 27c, and Figure 28a, respectively. The change in period doubling is more apparent in calcium concentration (Ca) vs. time and Vm vs. Ca, as shown at the bottom of Figure 27b, Figure 27c, and Figure 28a, respectively. Figure 28b shows the waveform of the memistive Chay model, confirming the existence of aperiodic oscillation (chaos) at gK,Ca = 11 mS/cm2. The firing of aperiodic oscillations from the cell can be clearly seen from the plot of Ca vs. time and Vm vs. Ca in Figure 28b. A further increase in gK,Ca to 11.5 mS/cm2 gives rise to the firing of the cell from aperiodic to rhythmic bursting, as shown in Figure 28c.

7. Concluding Remarks

This paper has provided a comprehensive and quantitative analysis of a biological excitable cell using the Chay neuron model. Through memristive theory, we have demonstrated that the voltage-sensitive mixed ion channel functions as a nonlinear resistor, while the voltage-sensitive potassium ion channel and calcium-sensitive potassium ion channel in an excitable cell are indeed time-invariant first-order generic memristors.
Furthermore, we have conducted in-depth analyses to derive the small signal model, admittance function, pole-zero diagrams, frequency response of admittance functions, and Nyquist plot at the DC equilibrium point Q. Our investigations revealed the existence of the local activity regime in the memristive Chay model within the voltage range of −49.455 mV to −24.685 mV and identified edge of chaos regime domains 1 and 2 within the voltage ranges of −49.455 mV to −48.763 mV and −27.984 mV to −24.685 mV, respectively. Moreover, consistent with the predictions of the Hopf bifurcation theorem, we observed the presence of an oscillating regime between two bifurcation points within the voltage range of −48.763 mV to −27.984 mV. Our numerical simulations confirmed the super-critical Hopf bifurcation with complex conjugates of eigen values coincident on the purely imaginary axis at ±0.557i and ±85.606i, respectively. It was also observed that a tiny change in external stimulus current I in excitable cells, far from the bifurcation points, no longer holds the Hopf bifurcation theorem as it crosses the imaginary axis from right to left, confirming that the real part of the eigen values becomes negative and converges to a DC equilibrium point.
Our comprehensive comparison of the HH, FitzHugh–Nagumo, ML, and Chay models presented in Table 2 along with their individual strengths and limitations revealed distinct advantages and drawbacks, making them suitable for different research contexts and questions. The selection of a particular model depends on the specific objectives. We primarily focused on advancing the understanding of excitable cells by modeling the networks of memristors and predicting their responses with the concepts of memristor theory, DC steady state analyses, small signal equivalent circuits, local activity principles, the edge of chaos theorem, and Hopf bifurcations. In conclusion, the theoretical framework outlined in this paper confirms the significance of memristors in simulating action potentials in excitable cells and also establishes a foundation for their application in neuron modeling, artificial intelligence, and brain-like machine interfaces. Our proposed model offers potential for enhancing adaptive neural networks, neuroprosthetics, neuromorphic computing architectures, and the broader scope of artificial intelligence, thereby aiding in the development of brain-like information processing systems.

Author Contributions

Conceptualization, M.S.; methodology, M.S.; software, M.S.; validation, M.S., A.A., V.R. and R.K.B.; formal analysis, M.S., A.A., R.T., V.R. and R.K.B.; investigation, M.S., A.A., R.T., V.R. and R.K.B.; writing—original draft preparation, M.S.; writing—review and editing, M.S., A.A., R.T., V.R. and R.K.B.; supervision, R.T. All authors have read and agreed to the published version of the manuscript.

Funding

This research received no external funding.

Data Availability Statement

The original contributions presented in the study are included in the article, further inquiries can be directed to the corresponding authors.

Conflicts of Interest

The authors declare no conflicts of interest.

Appendix A. Abbreviations of the Model Parameters

CmMembrane Capacitance
EKPotential across K+ ion channel memristor
EIPotential across mixed ion channel memristor
ELPotential across leakage channel
ECaPotential across Ca2+ ion channel memristor
gK,VVoltage-sensitive K+ ion-channel conductance
gIVoltage-sensitive mixed ion channel conductance
gL Leakage channel conductance
gKCa Calcium activated potassium conductance
kCa Rate constant for the efflux of the intracellular Ca2+ ions
ρProportionality constant
λn Rate constant for K+ ion-channel opening
mProbability of activation of the mixed ion channel in steady state
αmThe rate at which the activation of the mixed ion channel closed gates transition to an open state (s−1)
βmThe rate at which the activation of the mixed ion channel open gates transition to the close state (s−1)
hProbability of inactivation of the mixed ion channel in steady state
αhThe rate at which the inactivation of the mixed ion channel closed gates transition to an open state (s−1)
βhThe rate at which the inactivation of the mixed ion channel open gates transition to the close state (s−1)
nProbability of n opening of the K+ ion channel memristor
n Steady state value of n
αnThe rate at which K+ ion channel closed gates transition to an open state (s−1)
βnThe rate at which K+ ion channel opened gates transition to an close state (s−1)

References

  1. Hodgkin, A.L.; Huxley, A.F. A quantitative description of membrane current and its application to conduction and excitation in nerve. J. Physiol. 1952, 117, 500–544. [Google Scholar] [CrossRef] [PubMed]
  2. Chua, L.O.; Kang, S.M. Memristive devices and systems. Proc. IEEE 1976, 64, 209–223. [Google Scholar] [CrossRef]
  3. Chua, L.O.; Sbitnev, V.I.; Kim, H. Hodgkin-Huxley axon is made of memristors. Int. J. Bifurc. Chaos 2012, 22, 1230011. [Google Scholar] [CrossRef]
  4. Chua, L.O.; Sbitnev, V.I.; Kim, H. Neurons are poised near the edge of chaos. Int. J. Bifurc. Chaos 2012, 22, 1250098. [Google Scholar] [CrossRef]
  5. Chua, L. Hodgkin–Huxley equations implies Edge of chaos kernel. Jpn. J. Appl. Phys. 2022, 61, SM0805. [Google Scholar] [CrossRef]
  6. Chua, L. Everything you wish to know about memristor but are afraid to ask. Radioengineering 2015, 24, 319–368. [Google Scholar] [CrossRef]
  7. Hodgkin, A.L.; Keynes, R.D. Experiments on the injection of substances into squid giant axons by means of microsyringe. J. Physiol. 1956, 131, 592–616. [Google Scholar] [CrossRef] [PubMed]
  8. Morris, C.; Lecar, H. Voltage oscillations in the Barnacle giant muscle fiber. J. Biophys. Soc. 1981, 35, 193–213. [Google Scholar] [CrossRef] [PubMed]
  9. Sah, M.P.; Kim, H.; Eroglu, A.; Chua, L. Memristive model of the Barnacle giant muscle fibers. Int. J. Bifurc. Chaos 2016, 26, 1630001. [Google Scholar] [CrossRef]
  10. Rajamani, V.; Sah, M.P.; Mannan, Z.I.; Kim, H.; Chua, L. Third-order memristive Morris-Lecar model of barnacle muscle fiber. Int. J. Bifurc. Chaos 2017, 27, 1730015. [Google Scholar] [CrossRef]
  11. Noble, D. A modification of the Hodgkin-Huxley equations applicable to Purkinje fibre action and peacemaker potentials. J. Physiol. 1962, 160, 317–352. [Google Scholar] [CrossRef] [PubMed]
  12. Hudspeth, A.J.; Lewis, R.S. A model for electrical resonance and frequency tuning in saccular hair cells of the bull-frog Rana catesbeiana. J. Physiol. 1988, 400, 275–297. [Google Scholar] [CrossRef] [PubMed]
  13. Giguère, C.; Woodland, P.C. A computational model of the auditory periphery for speech and hearing research. J. Acoust. Soc. Am. 1994, 95, 331–342. [Google Scholar] [CrossRef] [PubMed]
  14. Nawrocki, R.A.; Voyles, R.M.; Shaheen, S.E. A mini review of neuromorphic architectures and implementations. IEEE Trans. Electron. Devices 2016, 63, 3819–3829. [Google Scholar] [CrossRef]
  15. Lee, Y.; Lee, T.W. Organic synapses for neuromorphic electronics: From brain inspired computing to sensorimotor nervetronics. Am. Chem. Soc. 2019, 52, 964–974. [Google Scholar] [CrossRef]
  16. Gentili, P.L. Photochromic and luminescent materials for the development of chemical artificial intelligence. Dye. Pigment. 2022, 205, 110547. [Google Scholar] [CrossRef]
  17. Peercy, B.E.; Sherman, A.S. How pancreatic beta-cells distinguish long- and short-time scale CAMP signals. Biophys. J. 2010, 99, 398–406. [Google Scholar] [CrossRef]
  18. Pedersen, M.G. Contributions of mathematical modeling of Beta-cells to the understanding of beta-cell oscillations and insulin secretion. Diabetes Technol. Soc. 2009, 3, 12–20. [Google Scholar] [CrossRef]
  19. Felix-Martinez, G.J.; Godlinez-Fernandez, J.R. Mathematical models of electrical activity of the pancreatic β-cell. Islets 2014, 6, e949195. [Google Scholar] [CrossRef]
  20. Kaestner, K.H.; Thompson, M.C.; Dor, Y.; Gill, R.G.; Glaser, B.; Kim, S.K.; Sander, M.; Stabler, C.; Stewart, A.F.; Powers, A.C. What is a β-cell? -Chapter I in the Human Islet Research Network (HIRN) review series. Mol. Metab. 2021, 53, 101323. [Google Scholar]
  21. Lenzen, S. The pancreatic beta cell: An intricate relation between anatomical structure, the signalling mechanism of glucose-induced insulin secretion, the low antioxidative defence, the high vulnerability and sensitivity to diabetic stress. ChemTexts 2021, 7, 13. [Google Scholar] [CrossRef]
  22. Marinelli, I.; Thompson, B.M.; Parekh, V.S.; Fletcher, P.A.; Gerardo-Giorda, L.; Sherman, A.S.; Satin, L.S.; Bertram, R. Oscillations in K(ATP) conductance drive slow calcium oscillations in pancreatic β-cells. Biophys. J. 2022, 121, 1449–1464. [Google Scholar] [CrossRef]
  23. Marinelli, I.; Parekh, V.; Fletcher, P.; Thompson, B.; Ren, J.; Tang, X.; Saunders, T.L.; Ha, J.; Sherman, A.; Bertram, R.; et al. Slow oscillations persist in pancreatic beta cells lacking phosphofructokinase M. Biophys. J. 2022, 121, 692–704. [Google Scholar] [CrossRef] [PubMed]
  24. Mukai, E.; Fujimoto, S.; Inagaki, N. Role of Reactive Oxygen Species in Glucose Metabolism Disorder in Diabetic Pancreatic β-Cells. Biomolecules 2022, 2022, 12091228. [Google Scholar] [CrossRef] [PubMed]
  25. Millette, K.; Rodriguez, K.; Sheng, X.; Finley, S.D.; Georgia, S. Exogenous Lactogenic Signaling Stimulates Beta Cell Replication In Vivo and In Vitro. Biomolecules 2022, 12, 215. [Google Scholar] [CrossRef]
  26. Bertram, R.; Marinell, I.; Fletcher, P.A.; Satin, L.S.; Sherman, A.S. Deconstructing the integrated oscillator model for pancreatic β-cells. Math. Biosci. 2023, 365, 109085. [Google Scholar] [CrossRef]
  27. Plant, R.E. Bifurcation and resonance in a model for bursting nerve cells. J. Math. Biol. 1981, 11, 15–32. [Google Scholar] [CrossRef]
  28. Chay, T.R. Eyring rate theory in excitable membranes. Application to neural oscillations. J. Phys. Chem. 1983, 87, 2935–2940. [Google Scholar]
  29. Chay, T.R.; Keizer, J. Minimal model for membrane oscillations in the pancreatic β-cell. J. Biophys. Soc. 1983, 42, 181–190. [Google Scholar] [CrossRef]
  30. Chay, T.R. Chaos in a three-variable model of an excitable cell. Physica D 1985, 16, 233–242. [Google Scholar] [CrossRef]
  31. FitzHugh, R. Impulses and physiological states in theoretical models of nerve membrane. Biophys. J. 1961, 1, 445–466. [Google Scholar] [CrossRef] [PubMed]
  32. Chua, L. Five non-volatile memristor enigmas solved. Appl. Phys. A Mater. Sci. Process. 2018, 124, 563. [Google Scholar] [CrossRef]
  33. Chua, L. If it’s pinched it’s a memristor. Semicond. Sci. Technol. 2014, 29, 104001. [Google Scholar] [CrossRef]
  34. Chua, L.O.; Desoer, C.A.; Kuh, E.S. Linear and Nonlinear Circuits; McGraw-Hill Book Co.: New York, NY, USA, 1987. [Google Scholar]
  35. Chua, L.O. CNN: A Paradigm for Complexity; World Scientific: Singapore, 1998. [Google Scholar]
  36. Chua, L.O. Local activity is the origin of complexity. Int. J. Bifurc. Chaos 2005, 15, 3435–3456. [Google Scholar] [CrossRef]
  37. Chua, L.O. Local activity principle: Chua’s riddle, “Turing machine, and universal computing rule 137”. In The Chua Lectures: From Memristors and Cellular Nonlinear Networks to the Edge of Chaos; World Scientific Series on Nonlinear Science; World Scientific: Singapore, 2020. [Google Scholar]
  38. Ascoli, A.; Demirkol, A.S.; Chua, L.O.; Tetzlaff, R. Edge of chaos theory resolves Smale paradox. IEEE Trans. Circuit Syst. I 2022, 69, 1252–1265. [Google Scholar] [CrossRef]
  39. Sah, M.P.; Mannan, Z.I.; Kim, H.; Chua, L. Oscillator made of only One memristor and one battery. Int. J. Bifurc. Chaos 2015, 25, 1530010. [Google Scholar] [CrossRef]
  40. Ascoli, A.; Demirkol, A.S.; Chua, L.O.; Tetzlaff, R. Edge of chaos is sine qua non for Turing instability. IEEE Trans. Circuit Syst. I 2022, 69, 4596–4609. [Google Scholar] [CrossRef]
  41. Ascoli, A.; Demirkol, A.S.; Chua, L.O.; Tetzlaff, R. Edge of chaos explains prigogine’s instability of the homogeneous. IEEE J. Emerg. Sel. Top. Circuits Syst. (JETCAS) 2022, 12, 804–820. [Google Scholar] [CrossRef]
  42. Ascoli, A.; Demirkol, A.S.; Tetzlaff, R.; Chua, L.O. Analysis and design of bio-inspired circuits with locally-active memristors. IEEE Trans. Circuit Syst. II 2024, 71, 1721–1726. [Google Scholar] [CrossRef]
  43. Ascoli, A.; Demirkol, A.S..; Tetzlaff, R.; Chua, L.O. Edge of chaos theory sheds light into the all-or-none phenomenon in neurons—Part I: On the fundamental role of the sodium ion channel. IEEE Trans. Circuit Syst. I 2024, 71, 5–19. [Google Scholar] [CrossRef]
  44. Ascoli, A.; Demirkol, A.S.; Tetzlaff, R.; Chua, L.O. Edge of chaos theory sheds light into the all-or-none phenomenon in neurons—Part II: On the necessary and sufficient conditions for the observation of the entire life cycle of an action potential. IEEE Trans. Circuit Syst. I, 2023; under review. [Google Scholar]
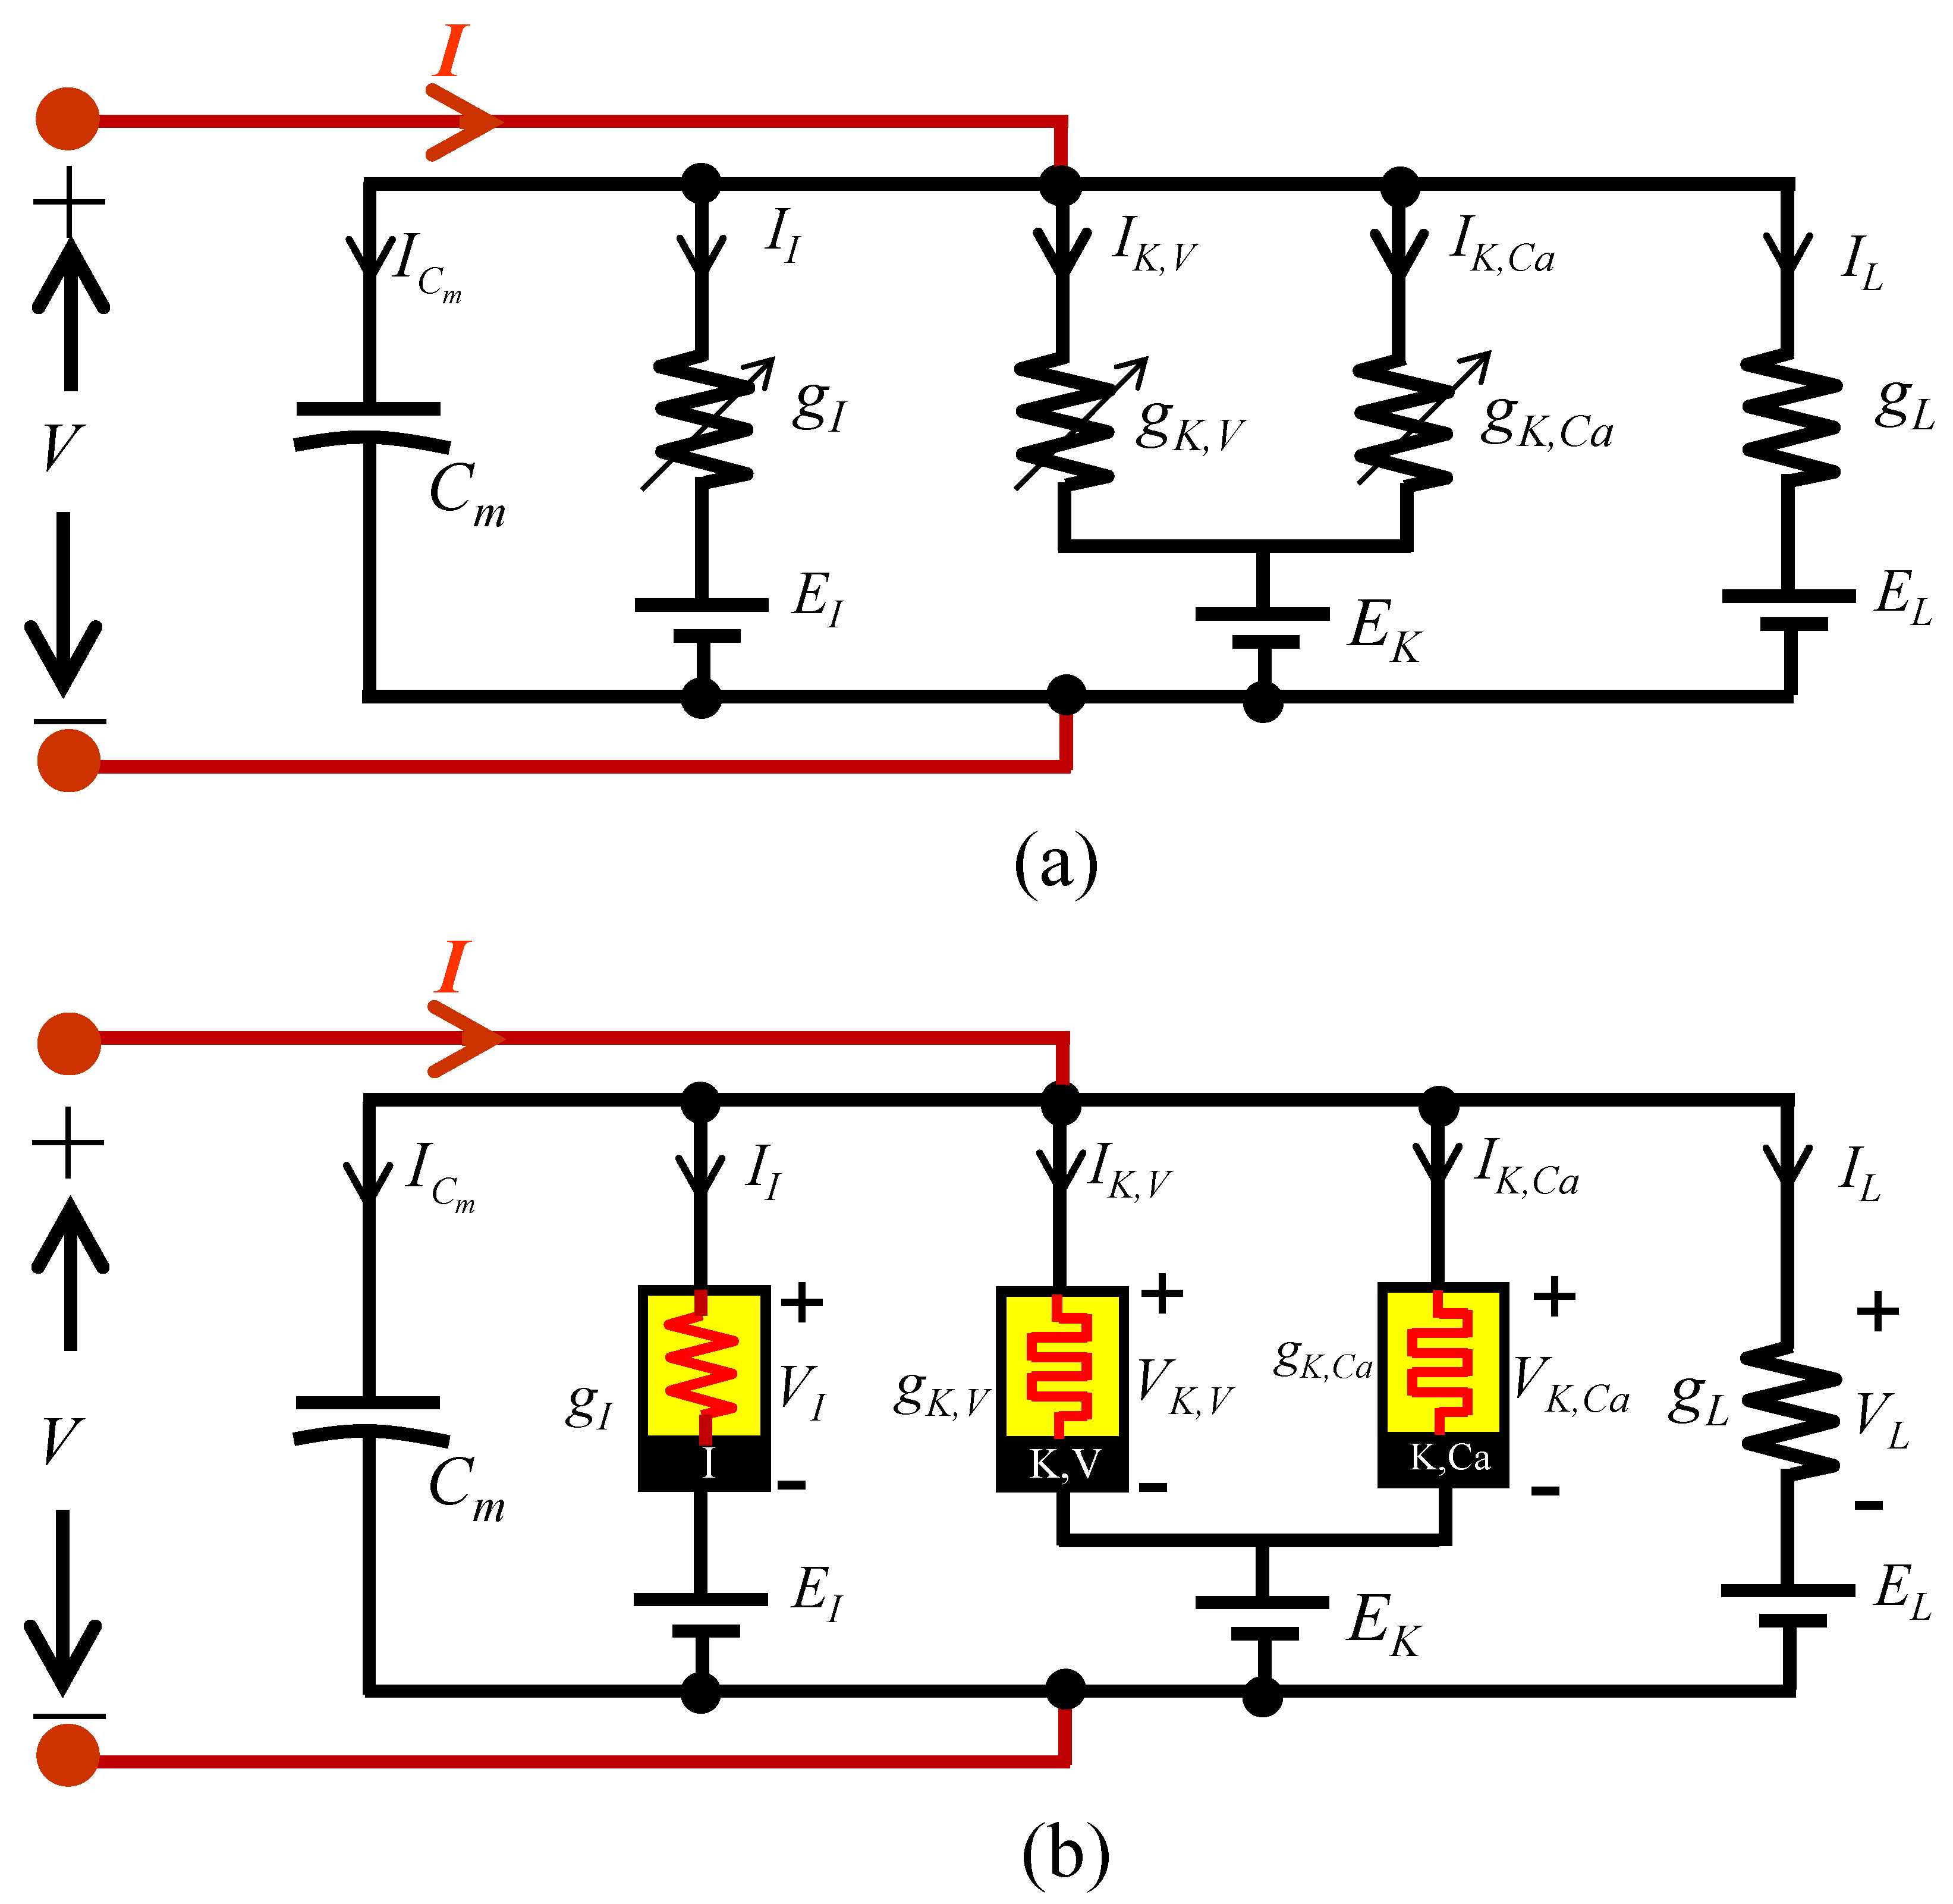
Figure 1. Typical Chay neuron model of an excitable cell [30]. (a) Electrical circuit model, following conventional assumption as time varying conductances [1]. (b) Equivalent memristive Chay model based on Chua’s memristive theory [2,3,4]. The potential ECa for Ca2+ ion given in the rate of the calcium concentration in Equation (3) is not an external battery source and not shown in external (a) and (b), respectively.
Jlpea 14 00031 g001
Figure 2. Output waveform plotted on the iI vs. vI plane when the input voltage vI = 100sin(2πft) mV is applied with three different frequencies, namely f = 100 Hz, 200 Hz, and 1 KHz, to the voltage-sensitive mixed ion channel. The output nonlinear waveform observed in Figure 2 for different frequencies confirms the mixed ion channel is a nonlinear resistor.
Jlpea 14 00031 g002
Figure 3. Pinched hysteresis loops of voltage-sensitive potassium ion channel memristor at frequencies f = 100 KHz, 500 KHz, and 4 MHz for the input signal vK,V(t) = 100sin(2πft) mV.
Jlpea 14 00031 g003
Figure 4. Pinched hysteresis loops of the calcium-sensitive potassium ion channel memristor at frequencies f = 10 Hz, 30 Hz, and 200 Hz for the input signal vK,Ca(t) = 100sin(2πft) mV.
Jlpea 14 00031 g004
Figure 5. (a) Memristive DC Chay model at equilibrium voltage Vm. (b) DC V-I curve of a mixed ion channel nonlinear resistor at equilibrium voltage VI = VmEI. (c) DC V-I curve of voltage-sensitive potassium ion channel memristor at equilibrium voltage VK,V = VmEK. (d) DC V-I curve of the calcium-sensitive potassium ion channel memristor at equilibrium voltage VK,Ca = VmEK. (e) DC V-I curve of the leakage channel at equilibrium voltage VL = VmEL. (f) Plot of the DC V-I curve of the memristive Chay model at membrane voltage Vm.
Jlpea 14 00031 g005
Figure 6. (a) Small-signal circuit model of the voltage-sensitive mixed ion channel nonlinear resistor about the DC equilibrium point QI (VI, II). (b) Plot of the coefficient a12 and resistance R1,I as a function of the DC equilibrium voltage VI = VmEI, where EI = 100 mV. R1,I < 0 over the range of local activity, edge of chaos 1 and edge of chaos 2 of the mixed ion channel nonlinear resistor is identified with respect to VI of the entire Chay circuit in Figure 1b and Figure 16.
Jlpea 14 00031 g006
Figure 7. Explicit formulas for computing the coefficients a12(QI) of the voltage-sensitive mixed ion channel nonlinear resistor.
Jlpea 14 00031 g007
Figure 8. Small-signal equivalent circuit model of the voltage-sensitive potassium ion channel memristor about the DC equilibrium point QK,V (VK,V, IK,V).
Jlpea 14 00031 g008
Figure 9. Plot of coefficients (a) a11, (b) a12, (c) b11, and (d) b12 of the voltage-sensitive potassium ion channel memristor as a function of the DC equilibrium voltage VK,V.
Jlpea 14 00031 g009
Figure 10. (a) Inductance LK,V (b) resistance R1K,V and (c) resistance R2K,V of the voltage-sensitive potassium ion channel memristor as a function of DC equilibrium voltage VK,V = VmEK where EK = −75 mV. LK,V > 0, R1KV > 0 and R2KV > 0 shown in figures over the local activity, edge of chaos 1 and edge of chaos 2 are just corresponding range of the voltage with respect to VK,V of the entire connected Chay small signal equivalent circuit of Figure 1b and Figure 16.
Jlpea 14 00031 g010
Figure 11. Explicit formulas for computing the coefficients a11(QK,V), a12(QK,V), b11(QK,V), b12(QK,V) and LK,V, R1K,V, R2K,V of the voltage-sensitive potassium ion channel memristor.
Jlpea 14 00031 g011
Figure 12. Small-signal equivalent circuit model of the calcium-sensitive potassium ion channel memristor about the DC equilibrium point QK,Ca (VK,Ca, IK,Ca).
Jlpea 14 00031 g012
Figure 13. Plot of coefficients (a) a11 (b) a12, (c) b11, and (d) b12 of the calcium-sensitive potassium ion channel memristor as a function of the DC equilibrium voltage VK,Ca.
Jlpea 14 00031 g013
Figure 14. (a) Inductance LK,Ca (b) resistance R1K,Ca and (c) resistance R2K,Ca of the calcium-sensitive potassium ion channel memristor as a function of DC equilibrium voltage VK,Ca. LK,Ca > 0, R1K,Ca > 0, and R2KCa > 0 over the edge of chaos 1 and edge of chaos 2 with respect to VK,Ca of the entire connected Chay small-signal equivalent circuit of Figure 1b and Figure 16.
Jlpea 14 00031 g014
Figure 15. Explicit formulas for computing the coefficients a11(QK,Ca), a12(QK,Ca), b11(QK,Ca), b12(QK,Ca) and LK,Ca, R1K,Ca, R2K,Ca of the calcium-sensitive potassium ion channel memristor.
Jlpea 14 00031 g015
Figure 16. Small-signal equivalent circuit model of the memristive Chay model. The DC equilibrium voltage Vm is computed at Vm = VI + EI for mixed ion channel non-linear resistor, Vm = VK,V + EK for voltage-sensitive potassium ion channel memristor, and Vm = VK,Ca + EK for calcium-sensitive potassium ion channel memristor, respectively.
Jlpea 14 00031 g016
Figure 17. Explicit formulas for computing the coefficients of Y(s; Vm(Q)).
Jlpea 14 00031 g017
Figure 18. Small-signal admittance frequency response and Nyquist plot of the memristive Chay neuron model at (a) Vm = −48.763 mV (resp., I = −66.671 μA) and (b) Vm = −27.984 mV (resp., I = 433.594 μA). Observe that ReY(; Vm(Q)) < 0 at the two Hopf-bifurcation points.
Jlpea 14 00031 g018
Figure 19. Poles diagram of the small-signal admittance function Y(s; Vm(Q)) as a function of Vm over −200 mV < Vm < 200 mV (a) The top and bottom figures are the plots of the real part of pole 1 Re(p1) and the imaginary part of pole 1 Im(p1), respectively. (b) The top and bottom figures are the plots of the real part of pole 2 Re(p2) and the imaginary part of pole 2 Im(p2), respectively.
Jlpea 14 00031 g019
Figure 20. Zeros diagram of the small-signal admittance function Y(s; Vm(Q)) (a) Nyquist plot of the zeros z1, z2, z3 in Im(zi) vs. Re(zi) plane (b) Nyquist plot near the Hopf-bifurcation point 1, Vm = −48.763 mV (resp., I = −66.671 μA). (c) Nyquist plot near the Hopf-bifurcation point 2, Vm = −27.984 mV (resp., I = 433.594 μA).
Jlpea 14 00031 g020
Figure 21. Plot of the loci of the eigen values of the Jacobian Matrix (a) Nyquist plot of the eigen values λ1, λ2, λ3 in Im(λi) vs. Re(λi) plane. (b) Nyquist plot near the Hopf-bifurcation point 1, Vm = −48.763 mV (resp., I = −66.671 μA). (c) Nyquist plot near the Hopf-bifurcation point 2, Vm = −27.984 mV (resp., I = 433.594 μA). Our numerical computations confirm the zeros of the admittance functions Y(s; Vm(Q)) obtained in Figure 20 are identical to the eigen values of the Jacobian matrix.
Jlpea 14 00031 g021
Figure 22. Plot of Re(; Vm(Q)) to illustrate the local activity principle at (a) Vm = −50 mV (resp. I = −74.316 μA) (b) Vm = −49.455 mV (resp. I = −70.919 μA), (c) Vm = −48.1 mV (resp. I = −62.681 μA), (d) Vm = −26.5 mV (resp. I = 746.457 μA), (e) Vm = −24.685 mV (resp. I = 1.291 × 10³ μA), (f) Vm = −23.5 mV (resp. I = 1.76 × 10³ μA), respectively.
Jlpea 14 00031 g022
Figure 23. Numerical simulations to confirm the super-critical Hopf bifurcation at bifurcation point 1. Plot of membrane potential Vm at (a) I = −68.118 μA which lies inside the tiny subset of edge of chaos domain 1 and beyond bifurcation point 1 converges to the DC equilibrium; (b) I = −65.077 μA, chosen just to the right of bifurcation point 1, where the real parts of two zeros of the neuron local admittance lie on the open right half plane (RHP), converges to the spikes.
Jlpea 14 00031 g023
Figure 24. Numerical simulations to confirm the super-critical Hopf bifurcation at bifurcation point 2. (a) Plot of membrane potential Vm which converges to stable DC equilibrium when I = 440 µA chosen inside the tiny subset of edge of chaos domain 2 and near and beyond the bifurcation point 2. (b) Membrane potential converging to oscillation as predicted by the Hopf bifurcation theorem when I = 430.884 µA is chosen inside the bifurcation point (open right-half pane).
Jlpea 14 00031 g024
Figure 25. Patterns of oscillations when stimulus current I is chosen beyond and inside the bifurcation points. (a) DC pattern observed when I = −90 µA chosen beyond bifurcation point 1 (I = −66.671 μA). Different patterns of oscillations occur when I is chosen between the two bifurcation points I = −66.671 μA and I = 433.594 μA at (b) I = −50 μA and (c) I = −10 μA.
Jlpea 14 00031 g025
Figure 26. Patterns of oscillations when stimulus current I is chosen inside and beyond the bifurcation points. Oscillation patterns when I is chosen between the two bifurcation points I = −66.671 μA and I = 433.594 μA, at (a) I = 10 μA, and (b) I = 200 μA. (c) The DC pattern when I = 500 μA is chosen beyond bifurcation point 2 (I = 433.594 μA).
Jlpea 14 00031 g026
Figure 27. Different patterns of oscillations when gKCa varied from 10 mS/cm2 to 10.75 mS/cm2 at DC situmulus current I = 0. (a) Period-1 oscillation at gK,Ca = 10 mS/cm2 (b) Period-2 oscillation at gK,Ca = 10.7 mS/cm2 (c) Period-4 oscillation at gK,Ca = 10.75 mS/cm2. The simulations were performed at the initial conditions Vm(0) = −50 mV, n(0) = 0.1, and Ca(0) = 0.48.
Jlpea 14 00031 g027
Figure 28. Different patterns of oscillations when gKCa varied from 10.77 mS/cm2 to 11.5 mS/cm2 at DC stimulus current I = 0. (a) Period-8 oscillation at gK,Ca = 10.77 mS/cm2; (b) Aperiodic (chaotic) oscillation at gK,Ca = 11 mS/cm2; (c) Bursting at gK,Ca = 11.5 mS/cm2. The simulations were performed at the initial conditions Vm(0) = −50 mV, n(0) = 0.1, and Ca(0) = 0.48.
Jlpea 14 00031 g028
Table 1. Parameters of the Chay neuron model of an excitable cell.
Cm1 mF/cm2gK,V1700 mS/cm2
EK−75 mVgI1800 mS/cm2
EI100 mVgL7 mS/cm2
EL−40 mVgK,Ca10 mS/cm2
ECa100 mVKca3.3/18 mV
λn230ρ0.27
Table 2. Comparison analyses of HH, FitzHugh–Nagumo, ML, and Chay models.
ModelsMemristive ModelsStrengthsLimitations
HH [1]The potassium ion channel and sodium ion channel in the HH model are represented by generic memristors [3].It is a framework to understand the emergence of action potential propagation in neurons based on the experimental data of the squid giant axon.It is difficult to generalize to all neurons. Incapable of producing complicated bursting patterns
FitzHugh–Nagumo [31]It does not follow state-dependent Ohm’s law and cannot model with memristors.Simplified model of neuronal excitation.Not accurately represent all neuronal behaviors. Incapable of producing bursting
ML [8]It was modeled that the state-independent (dependent) calcium ion channel acts as a nonlinear resistor (generic memristor) and state-dependent potassium ion channel acts as a generic memristor [9,10].It is initially presented a model for the barnacle muscle fiber, and later it was considered a popular and simplified representation of the neuron model.Limited in capturing certain neuronal dynamics. Cannot produce bursting patterns.
Chay [30]We are proposing a framework that the cells of excitable membranes can be modeled as the networks of memristors.Novel model of excitable cells to capture multiple neuronal states, such as action potentials, periodic oscillations, aperiodic oscillations, spikes, and bursting patterns.Limited validation in experimental contexts and a lack of details for some applications.
Table 3. Computation of the potassium ion channel activation n, calcium concentration Ca, and eigen values (λ1, λ2, and λ3) as a function of the stimulus current I (resp. membrane potential Vm). Rows 5 to 7 pertain to the edge of chaos 1, rows 8 to 16 pertain to the unstable local activity domain, and rows 17 to 20 pertain to the edge of chaos 2. Rows 7 and 17 pertain to Hopf bifurcation points 1 and 2, respectively, for the memristive Chay neuron model.
S.NVm (mV)I (µA)nCaλ1λ2λ3
1.−52.00−87.020.080.04−40.515−3.842−0.084
2.−51.00−80.630.080.05−40.107−2.871−0.111
3.−50.50−77.460.090.06−39.891−2.289−0.139
4.−50.00−74.320.090.0739.666−1.617−0.196
5.−49.455−70.9190.940.08−39.408−0.533 − 0.174i−0.533 + 0.174i
6.−49.00−68.120.10.1−39.181−0.19 − 0.525i−0.19 + 0.525i
7.−48.763−66.6710.10.1−39.0580 − 0.557i0 + 0.557i
8.−48.50−65.080.10.11−38.9170.222 − 0.51i0.2215 + 0.5097i
9.−46.00−51.020.120.21−37.320.0465.736
10.−45.00−46.370.130.27−36.5120.0278.498
11.−42.00−39.370.160.53−33.2180.000118.604
12.−40.00−42.780.180.79−29.899−0.008425.99
13.−38.00−51.260.211.13−24.898−0.011231.992
14.−32.0017.590.292.57−0.06111.669 − 38.01i11.669 + 38.01i
15.−30.00160.680.323.12−0.0538.049 − 61.778i8.049 + 61.778i
16.−28.00430.840.353.65−0.0510.08 − 85.421i0.08 + 85.421i
17.−27.984433.5940.353.65−0.0510 − 85.606i0 + 85.606i
18.−27.00628.910.363.89−5.556 − 97.197i−5.556 + 97.197i−0.051
19.−25.501.02 × 1030.394.22−15.942 − 114.607i−15.942 + 114.607i−0.0501
20.−24.6851.291 × 1030.404.37−22.466 − 123.858i−22.466 + 123.858i−0.0499
21.−23.001.99 × 1030.434.64−37.643 − 142.384i−37.643 + 142.384i−0.0497
22.−22.002.5 × 1030.444.75−47.529 − 152.923i−47.529 + 152.923i−0.0496
Disclaimer/Publisher’s Note: The statements, opinions and data contained in all publications are solely those of the individual author(s) and contributor(s) and not of MDPI and/or the editor(s). MDPI and/or the editor(s) disclaim responsibility for any injury to people or property resulting from any ideas, methods, instructions or products referred to in the content.