Article

Green Technology Transfer and Energy-Related Operational Port Carbon Emissions: Evidence from Listed Port Companies in China

1
Business School, Hohai University, Nanjing 211100, China
2
School of Economics and Management, Jiangsu University of Science and Technology, Zhenjiang 212000, China
*
Author to whom correspondence should be addressed.
Systems 2026, 14(9), 1108; https://doi.org/10.3390/systems14091108
Submission received: 2 June 2026 / Revised: 18 August 2026 / Accepted: 24 August 2026 / Published: 7 September 2026

Highlights

Please indicate how your work links to systems science via your contributions to systems practice, theory, and/or methodology.
  • Develops a system-oriented framework linking green technology transfer, operational mechanisms, and contextual conditions in port decarbonization.
  • Shows how regulatory, innovation, financial, and digital conditions jointly shape the effectiveness of green technology transfer.
What are the main findings and/or the implications of the main findings?
  • Green technology transfer reduces energy-related operational port carbon emissions through cleaner energy use and technological progress.
  • Environmental regulation, regional innovation support, and financial health strengthen the emissions-reduction effect of green technology transfer.

Abstract

Against the background of resource constraints and the difficulty of independent green technology innovation, green technology transfer (GTT) provides an important pathway for listed port companies to reduce energy-related emissions from their operational activities and advance low-carbon transformation. Based on panel data from 19 listed Chinese port companies from 2011 to 2024, this paper examines the effect and mechanisms of GTT on energy-related operational port carbon emissions (EOPCE) from both theoretical and empirical perspectives. The results show that (1) GTT significantly reduces EOPCE, and this finding remains robust after a series of robustness and endogeneity tests. (2) Mediation analysis indicates that GTT reduces EOPCE by promoting a cleaner energy consumption structure and technological progress. (3) Moderation analysis shows that environmental regulation, regional innovation support, and port financial health significantly strengthen the negative effect of GTT on EOPCE, while no statistically significant moderating effect of port technology absorptive capacity is identified under the current sample and proxy measure. (4) Heterogeneity analysis reveals that the effect of GTT on EOPCE varies across port regions and digitalization levels.

1. Introduction

Facing the global climate challenge, China has formally committed to achieving peak carbon emissions by 2030 and attaining carbon neutrality by 2060. Against this backdrop, ports have emerged as a critical target of governmental carbon-control policies [1], as port-related activities account for nearly 3% of global greenhouse gas emissions [2]. At the same time, port-related carbon emissions in China remain substantial [3]. Public disclosures indicate that, as the world’s largest container port and the world’s largest port by cargo throughput, the total greenhouse gas emissions of Shanghai International Port Group and Ningbo Zhoushan Port in 2025 were approximately 1.20 million and 1.23 million tonnes of CO2, respectively, highlighting the substantial decarbonization pressure facing China’s major ports amid intensive operations and continued business expansion. Although the relevant ports have started to explore “zero-carbon” terminals through the large-scale deployment of wind and solar power, such efforts remain limited relative to the broader challenge of port decarbonization. This makes it particularly important to identify effective ways to reduce energy-related operational port carbon emissions (EOPCE) in China.
Green technology innovation is widely recognized as an important means of reducing carbon emissions [4]. However, because green technologies often involve public-good characteristics, long R&D cycles, high costs, and dual externalities, firms may lack sufficient incentives to undertake independent low-carbon R&D. In response to this situation, existing studies suggest that, although independent green-technology R&D remains important [5], GTT can provide an efficient complementary pathway for emissions reduction when firms face resource constraints and increasing environmental pressure. Previous research has shown that full international sharing of green technologies could potentially cut cumulative global carbon emissions by roughly 40% [6]. GTT denotes the movement of energy-saving and emission-reducing technologies from suppliers to users through mechanisms such as cooperation, trade, and sharing [7]. Ideally, GTT can accelerate the application of technologies such as clean energy, energy-efficient cargo-handling equipment, and smart port management systems in port operations, thereby effectively reducing EOPCE. In practice, however, GTT has not always brought the expected EOPCE-reduction effect, and EOPCE continues to increase in a large number of ports.
Academic research on EOPCE has traditionally focused on measurement approaches and the effects of energy use, infrastructure optimization, and technological advancement [8]. GTT, as an important carbon emission reduction tool, has not received due attention in research on EOPCE. In view of this, using listed Chinese port enterprises as the research sample, this paper seeks to address the following central questions: (1) In real-world port operational contexts, does GTT exert a significant mitigating effect on EOPCE? If so, how large is its marginal effect? (2) Which factors shape the effectiveness of such transfer in lowering emissions? (3) Is there heterogeneity in the effect of GTT on EOPCE across different contexts? By addressing these questions, this paper seeks to offer theoretical insights that can assist policymakers in designing effective GTT initiatives and maximizing their potential to reduce EOPCE in Chinese ports.
The remainder of this paper is organized as follows. Section 2 reviews the relevant literature and develops the research hypotheses. Section 3 presents the methodology, including the model setting, variable measurement, and data sources. Section 4 reports the empirical results and analysis. Section 5 discusses the main findings in light of the existing literature. Section 6 presents the conclusions, policy implications, limitations, and directions for future research.

2. Literature Review and Research Hypotheses

2.1. Literature Review

2.1.1. Measurement, Determinants, and Governance of Port-Related Carbon Emissions

Against the backdrop of global warming, port-related carbon emissions have become an important issue in global climate governance. Existing research shows that carbon emissions of ports mainly come from fuel combustion during ship docking, energy consumption generated by equipment operation, and the carbon footprint brought by logistics [9,10]. These emissions not only directly impact the surrounding ecological environment but also influence the long-term sustainability of regional economic growth [11]. Existing research has increasingly focused on three major areas: emissions measurement, determinants, and emissions management. In terms of carbon emission measurement, researchers are mainly committed to constructing an accurate emission accounting system to lay the foundation for the scientific measurement of port-related carbon emissions [10]. Compared with the early methods that relied on statistical data deduction or empirical parameter estimation, research in recent years has tended to adopt a fusion modeling strategy, which integrates AIS ship dynamics data, port operation logs and energy consumption inventories to construct a measurement model based on emission factors and fuel consumption coefficients, thereby enabling comprehensive carbon accounting across the entire chain of activities—terminal operations, vessel berthing, and land-side logistics [12,13]. At the same time, some research has also applied Life Cycle Assessment (LCA) methods to evaluate port emissions dynamically from a systems-oriented perspective, which promotes the evolution of measurement from a static single point to a dynamic system [14]. In terms of influencing factor analysis, existing studies have shown that the functional positioning, cargo structure, route density and equipment technology level exert substantial influence on the volume, intensity, and temporal dynamics of port emissions [15]. For instance, container ports usually have low carbon emission intensity due to high operational efficiency and electrification, while dry bulk ports generally have high emission intensity due to the high dependence of their equipment on high-carbon fuels [16]. Meanwhile, due to the high shipping density and operation frequency, ports located in eastern coastal areas emit considerably more carbon than inland ports in China’s central and western regions [10]. In addition, although green-port initiatives have driven declines in emission intensity at some ports, expanding international shipping demand and stronger agglomeration effects keep aggregate carbon emissions at persistently high levels [17]. This paradoxical phenomenon of “decreasing intensity and increasing total volume” reflects that port-related carbon emissions have significant structural inertia and scale effects, and are strongly influenced by macroeconomic fluctuations, shipping market expansion and industrial agglomeration [18]. In terms of carbon emission management, research has shown that shore power systems, new energy handling equipment and intelligent dispatching systems have become the main tools for port emission reduction [19]. Meanwhile, enhancements in evaluation systems, regulatory limits and carbon emission information disclosure mechanisms provide institutional guidance for the low-carbon transformation of ports [20]. In addition, market-based tools including carbon taxes, emissions trading schemes, and green finance have further accelerated emission reduction efforts in the port sector [21].

2.1.2. Conceptualization, Measurement, and Emission-Reduction Effects of GTT

As an important complement to corporate green innovation, GTT has emerged as a significant driver of enterprises’ transition toward low-carbon development [22]. GTT broadly denotes the dissemination and utilization of low-carbon and energy-efficient technologies across regions and firms, encompassing external technology introduction, internal technology diffusion and cross-organizational technology cooperation [23]. In recent years, governments and industry organizations have promoted the cross-regional and cross-organizational diffusion of green technologies through policy incentives and technology cooperation alliances, while enterprises have accelerated technology introduction, adaptation, and innovation in the context of digitalization, contributing to the continued development of GTT [24,25]. However, it should be emphasized that GTT extends beyond mere introduction and application of technology, and it constitutes a complex process involving knowledge sharing, managerial change and industrial synergy [26].
Because GTT involves multiple channels and stages, existing studies have adopted different indicators according to their research scale and analytical purpose. At the macro level, international trade, foreign direct investment, technology licensing, and Clean Development Mechanism projects have been used to capture technology transfer embodied in equipment, capital flows, contractual arrangements, and project cooperation [27]. Patent-based studies have employed patent counts and patent families to characterize the development and geographical diffusion of environmental technologies, while patent citations have been used to trace knowledge flows and technological spillovers across countries and organizations [28,29]. By comparison, changes in patent ownership and patent-assignment records provide observable evidence of formal technology transactions and the reallocation of technological assets between different actors [30,31]. Patent-assignment datasets have also been employed to examine transactions in technology markets and the reallocation of patent ownership among different market actors [32]. These indicators capture different dimensions of GTT and are therefore not fully interchangeable: trade and investment indicators generally reflect relatively aggregate transfer channels, patent citations identify knowledge diffusion, and patent transactions record legally recognized changes in technology ownership. Given the firm-level longitudinal setting of this study and the need to identify the recipient company and transfer year, legally recorded green patent transfers are used to measure the frequency of formal external green technology acquisition, with the detailed construction and measurement boundaries of this indicator presented in Section 3.2.2.
Formal technology acquisition provides recipient enterprises with access to external green technological resources, but the realization of its emission-reduction potential still depends on subsequent technological adaptation, organizational integration, and operational application. If enterprises lack the capabilities and supporting conditions required to complete these subsequent processes, they may struggle to sustainably harness the carbon-reduction potential of GTT [33]. Existing research identifies three principal pathways through which GTT may reduce enterprise carbon emissions. First, introducing renewable energy systems and green production processes reduces enterprises’ reliance on traditional high-carbon technologies, thereby reducing carbon emissions [34]. Second, deploying automated control, smart logistics, and digital energy management systems enhances operational efficiency and reduces emissions by curbing unnecessary energy consumption [35]. Third, GTT promotes supply-chain coordination, industrial linkages, and regional cooperation, which contributes to broader and more systemic carbon-mitigation outcomes [36,37]. Evidence from practical applications nevertheless indicates that the emission-reduction outcomes of GTT are not uniform across recipient enterprises. Some enterprises have realized carbon emission reduction through GTT, while others have achieved limited results because of inadequate infrastructure, insufficient technological adaptation, and shortages of professional personnel [38]. Therefore, whether externally acquired green technologies can be effectively absorbed, integrated into operating systems, and translated into sustained emission reductions remains an important issue requiring further investigation.

2.1.3. Research Gaps, Analytical Motivation, and Contributions

The literature reviewed above has advanced our understanding of port-related carbon emissions and GTT, but several research gaps remain. Firstly, existing studies on GTT and environmental performance have mainly focused on international technology diffusion, regional and industrial technology flows, and general enterprise or developing-country contexts [6,22,23,24,25,26,27,28,29]. By comparison, research on port decarbonization has concentrated primarily on emission accounting, energy use, equipment electrification, shore-power application, operational optimization, and environmental-governance instruments [21,39,40]. Although these two strands of the literature provide important insights into green technology diffusion and port emission reduction, the firm-level relationship between formal external green technology acquisition and EOPCE has received comparatively limited direct examination. As sea–land hubs, listed port companies engage in energy-intensive operational activities such as cargo handling, storage, internal transportation, and equipment operation. The combination of large operating scale, continuous equipment use, infrastructure dependence, and diverse energy inputs makes EOPCE distinct from the carbon emissions of general enterprises [39,40]. It is therefore necessary to examine how GTT affects EOPCE by treating listed port companies as distinct operational entities.
Secondly, the emission-reduction effect of GTT on ports is shaped not only by technology acquisition and direct application but also by subsequent technological adaptation, organizational integration, and operational implementation. Existing studies have shown that the environmental outcomes of technology transfer depend on recipient capabilities, technology compatibility, supporting infrastructure, policy conditions, and cooperation among relevant actors [37,38,40,41]. However, these conditions have rarely been integrated into a unified firm-level framework for examining how GTT affects EOPCE. Accordingly, this paper constructs an analytical framework incorporating both mediating and moderating effects. It examines the mediating roles of energy consumption structure (ECS) and technological progress (TEP), as well as how the external environment—environmental regulation (ENR) and regional innovation support (RIS)—and internal endowments—technology absorptive capacity (TAC) and financial health (FIH)—condition the effect of GTT on EOPCE.
Thirdly, existing studies commonly measure GTT using trade, foreign direct investment, technology-licensing activities, patent flows, patent citations, or formal patent transactions [27,28,29,30,31,32]. These indicators identify different transfer channels, but limited attention has been paid to whether green technologies originating from different types of organizations generate different environmental outcomes after being transferred to port companies. Accordingly, this study distinguishes between academic-origin GTT (AO-GTT), originating from universities and research institutions, and enterprise-origin GTT (EO-GTT), originating from other firms. This classification identifies the organizational origin of transferred technologies rather than presuming that the two categories represent inherently different learning modes or technological-maturity levels. Meanwhile, different port regions vary in their industrial structures, innovation resources, policy environments, and market conditions, which may affect the adaptation and implementation of transferred technologies [23,24,26,37]. Port digitalization also provides an important operational foundation for integrating external technologies with equipment systems, production processes, logistics organization, and energy management [24,25,35]. Therefore, this paper further examines whether the effect of GTT on EOPCE varies across technology origins, the Bohai Rim (BR), Yangtze River Delta (YRD), and Pearl River Delta (PRD), and different levels of port digitalization.
The main contributions of this paper are as follows. (1) This paper incorporates GTT into the analytical framework of port carbon governance and systematically examines its effect on energy-related carbon emissions generated within the operational boundaries of listed port companies, thereby enriching the literature on GTT and the operational decarbonization of ports. (2) This paper integrates the mediating roles of ECS and TEP with the moderating roles of ENR, RIS, TAC, and FIH, providing a unified framework for identifying the transmission mechanisms and contextual conditions through which formal external green technology acquisition is translated into lower EOPCE. (3) This paper further examines whether the emission-reduction effect of GTT varies across organizational technology origins, regional contexts, and port digitalization levels. This analysis provides more rigorous evidence regarding the conditions under which GTT generates stronger operational emissions-reduction outcomes and supports differentiated technology-acquisition and implementation strategies for listed port companies.

2.2. Research Hypotheses

2.2.1. Impact Mechanism of GTT on EOPCE

Technology diffusion theory holds that the transfer of advanced green technologies can weaken enterprises’ dependence on traditional high-carbon technologies and enhance their opportunities for technological adaptation and subsequent innovation, thereby improving carbon-emission reduction efficiency [33,38,41]. Meanwhile, the synergistic evolution perspective suggests that port decarbonization depends not only on internal technological upgrading but also on the coordinated development of operational systems and the support provided by technology suppliers, energy providers, and the regional policy environment. Under this theoretical framework, GTT can provide port companies with external low-carbon technological resources and reduce EOPCE by improving operational processes and strengthening the integration of green technologies into port production systems.
At the micro level, GTT facilitates the application of intelligent scheduling, automated handling, energy-efficient equipment, and digital energy-management systems. Traditional port operations rely heavily on fuel-powered machinery and may suffer from inefficient scheduling, equipment idling, and repetitive cargo movements, which increase both energy consumption and operational emissions. The acquisition and application of green technologies can improve equipment utilization, optimize resource allocation, and reduce unnecessary energy use, supporting the transition of port operations from extensive energy consumption toward more efficient and low-carbon production. At the operational-system level, GTT can promote coordination among equipment operation, energy supply, cargo handling, storage, and internal transportation. These activities are closely interconnected and involve multiple equipment systems, energy sources, and technology providers. Through cooperation with equipment manufacturers, energy suppliers, research institutions, and specialized technology-service providers, port companies can combine clean-energy technologies, low-carbon handling equipment, intelligent dispatching systems, and digital energy-management platforms. Such integration improves compatibility among energy supply, equipment operation, and production processes and strengthens the capacity of transferred technologies to reduce EOPCE. At the regional level, GTT facilitates technical cooperation and knowledge exchange among ports, technology suppliers, and innovation actors. Regional technology-sharing platforms and inter-port cooperation can reduce the costs of searching for, evaluating, and adapting green technologies and allow port companies to obtain implementation experience from other market participants. GTT may also promote the diffusion of common technical standards and operating practices, thereby supporting coordinated carbon governance across port clusters.
However, the occurrence of formal technology transfer does not guarantee the immediate or complete application of the transferred technology. Differences between the technical characteristics of transferred patents and existing equipment systems may generate substantial adaptation costs, while infrastructure lock-in, shortages of specialized personnel, and weak organizational coordination may delay or weaken their operational effects [33,41]. Moreover, improvements in energy efficiency may reduce the effective cost of equipment use and stimulate higher equipment utilization or production activity, partially offsetting the initial energy savings through a rebound effect [42]. Existing evidence indicates that rebound effects generally reduce the realized amount of energy savings rather than completely reverse them, but they imply that the actual emissions-reduction effect may be smaller than the technical potential of the acquired technology [42].
Therefore, the effect of GTT on EOPCE is not automatic and depends on whether formally acquired technologies are subsequently adapted and embedded in port operations. Nevertheless, because the transferred technologies identified in this study are specifically related to energy conservation, clean energy, pollution control, and green operational processes, their efficiency-enhancing and energy-substitution effects are expected to outweigh the potential adaptation and rebound effects. Based on the above analysis, this paper proposes the following hypothesis:
Hypothesis 1 (H1).
GTT can exert a significant inhibitory effect on EOPCE.

2.2.2. Mediating Mechanisms of ECS and TEP

As energy-intensive enterprises, port companies generate EOPCE through operational activities that are closely related to their energy consumption structure and production technologies. GTT may reduce EOPCE by promoting a cleaner ECS and facilitating TEP. However, the realization of these mechanisms depends on the adaptation and effective use of the transferred technologies. For a long time, port energy consumption has been dominated by high-carbon energy sources, and the extensive use of diesel and other fossil fuels has constituted an important source of EOPCE. GTT can promote the green transformation of port ECS by improving access to electrified cargo-handling equipment, clean-energy-powered machinery, low-carbon internal transportation equipment, and renewable-energy technologies. The application of these technologies can reduce dependence on conventional fossil fuels and support a transition from a high-carbon-dominated energy structure toward a more diversified and lower-carbon energy mix. GTT involving solar energy, wind power, hydrogen energy, energy storage, and related energy-management technologies can also expand the technical options available for on-site clean-energy production and consumption. Technological learning and repeated application may further reduce the costs of acquiring, adapting, and operating such technologies. Through the expansion of clean-energy supply and the substitution of lower-carbon energy for conventional fuels, GTT provides an important channel for optimizing port ECS. Nevertheless, the energy-structure effect of GTT may be constrained by the carbon intensity of externally supplied electricity, the coverage and utilization of supporting infrastructure, equipment compatibility, and the costs of clean-energy conversion. A transferred clean-energy technology may therefore generate limited short-term changes in ECS when complementary facilities have not yet been established or when existing equipment remains locked into conventional fuels [33,38]. Efficiency improvements may also stimulate additional energy use and partially offset the savings associated with energy substitution [42]. Despite these constraints, technologies directly related to electrification, clean-energy substitution, and energy management are expected to increase the proportion of relatively clean energy used in port operations.
Environmental economics theory indicates that TEP can reduce emissions intensity by optimizing resource allocation and improving production efficiency. As a source of external technological resources, GTT enables port companies to obtain automated handling technologies, intelligent scheduling systems, production-process control tools, and digital energy-efficiency management technologies without relying exclusively on internal R&D. These technologies can improve operational output and green technological performance under given capital and labor inputs, supporting an outward shift in the production technology frontier. GTT also creates opportunities for technological adaptation and subsequent development. Port companies generally need to adjust externally acquired technologies to their equipment structures, cargo-handling processes, safety requirements, and operational environments. The adaptation, recombination, and further development of transferred technologies can strengthen technical capabilities, improve equipment performance, and promote the integration of green technologies into port production systems. TEP can therefore reduce EOPCE by improving energy-use efficiency, optimizing operating procedures, and raising the technological level of production. Conversely, the technological-progress effect may take time to materialize because externally acquired technologies require testing, engineering adaptation, system integration, employee training, and subsequent maintenance. Technologies that are poorly matched with existing production systems may initially increase learning and adjustment costs without immediately improving the technological frontier [38]. Furthermore, productivity improvements can expand operational capacity and cargo-handling activity, which may offset part of the emissions reduction generated by efficiency gains [42]. Even so, because green technology transfer directly introduces energy-saving processes, cleaner equipment, and environmentally oriented technological knowledge, its contribution to production efficiency and green technological output is expected to dominate these short-term adjustment and scale effects. Accordingly, the following mediation hypotheses are proposed:
Hypothesis 2a (H2a).
ECS mediates the negative effect of GTT on EOPCE.
Hypothesis 2b (H2b).
TEP mediates the negative effect of GTT on EOPCE.

2.2.3. Moderating Mechanisms of the External Environment

The effect of GTT on EOPCE depends not only on technology acquisition and application but also on the external institutional and innovation environments in which port companies operate. ENR and RIS can influence the incentives, resources, and complementary services available for adapting and implementing transferred technologies.
Consistent with the Porter Hypothesis, appropriately designed environmental regulation can stimulate enterprises to seek technological solutions that reduce compliance costs and improve environmental performance. Port companies are subject to environmental requirements concerning energy efficiency, equipment emissions, shore-power use, clean production, and carbon management. Stronger port-specific regulation can increase the cost of retaining high-carbon technologies and encourage firms to prioritize technologies with identifiable emissions-reduction potential in their investment and resource-allocation decisions. ENR can also accelerate equipment retrofitting, energy substitution, and production-process adjustment, strengthening the integration of transferred green technologies into port operations. However, the innovation–compensation effect of environmental regulation is not unconditional. The compliance-cost perspective suggests that rigid, unpredictable, or poorly targeted regulation may divert financial and managerial resources away from technology adaptation and delay investment under conditions of high adjustment costs. Empirical research on different versions of the Porter Hypothesis finds stronger support for regulation-induced innovation than for the proposition that innovation benefits necessarily offset the full costs of compliance [43]. Accordingly, the effect of ENR depends on its targeting, predictability, flexibility, and consistency with firms’ technological and operational conditions. Compared with broad environmental-policy signals, port-specific requirements related to shore-power use, equipment upgrading, clean-energy application, and emissions control provide clearer implementation targets and strengthen the operational relevance of transferred technologies. When regulation is closely aligned with port production activities and supported by stable technical standards and enforcement arrangements, its incentive and implementation effects are expected to outweigh the potential compliance burden.
RIS constitutes another important external condition for technology diffusion. Green technologies commonly involve high initial costs, substantial technological uncertainty, and demanding adaptation requirements. Regional fiscal support, innovation services, and cooperation networks can reduce the costs of technology search and implementation. Cooperation among port companies, universities, research institutions, equipment manufacturers, and technology-service providers can facilitate knowledge exchange, technical problem-solving, and subsequent redevelopment, thereby improving the conversion of transferred technologies into operational emissions reductions. Nevertheless, regional innovation support may have limited effects when funding is fragmented, policy instruments are poorly targeted, or innovation resources are disconnected from the actual technical requirements of port operations. Generalized subsidies may also encourage formal technology acquisition without ensuring subsequent engineering application. Technology-transfer research emphasizes that public support generates stronger outcomes when it is coordinated with recipient demand, implementation capabilities, and complementary institutions [40,41]. Therefore, RIS is expected to strengthen the effect of GTT when it provides relevant technical services, financial support, and collaborative innovation resources rather than merely increasing the amount of general innovation expenditure. Accordingly, the following hypotheses are proposed regarding the moderating roles of the external environment:
Hypothesis 3a (H3a).
ENR positively moderates the negative effect of GTT on EOPCE.
Hypothesis 3b (H3b).
RIS positively moderates the negative effect of GTT on EOPCE.

2.2.4. Moderating Mechanisms of the Internal Endowments

The effectiveness of GTT in reducing EOPCE is also conditioned by firms’ internal endowments. TAC and FIH influence whether port companies can identify appropriate external technologies, complete the necessary adaptation and integration processes, and sustain their operational application.
TAC reflects an enterprise’s ability to recognize, assimilate, transform, and apply externally acquired knowledge. Green technologies are often complex and context-dependent, and their operational effectiveness depends on their compatibility with the recipient’s existing knowledge, equipment, and production processes. Port companies with stronger technological knowledge can more accurately identify technologies suited to their emission characteristics, ECS, equipment structures, and operational requirements. They can also combine transferred technologies with internal knowledge through engineering adaptation and subsequent innovation, thereby improving their environmental performance. However, strong internal R&D capabilities do not necessarily ensure openness to external technologies. Research on the “not-invented-here” syndrome indicates that established R&D groups may place excessive confidence in internally generated knowledge and reject or undervalue external ideas, potentially weakening external knowledge acquisition and application [44]. In addition, a firm’s existing knowledge may be concentrated in areas that are not closely related to the transferred technology. Under such conditions, a high level of general technological investment may not translate into stronger technology compatibility, engineering adaptation, or cross-departmental implementation. The moderating effect of TAC is therefore conditional on the relevance of the existing knowledge base and the willingness and organizational capacity to integrate external technologies. When technological knowledge is aligned with the acquired technology and supported by coordination among R&D, equipment, production, energy management, and safety units, stronger TAC is expected to reduce adaptation costs and improve the operational use of GTT.
FIH reflects a company’s ability to mobilize financial resources, withstand investment risks, and maintain stable long-term operations. Introducing a green technology usually requires more than the payment associated with acquiring the technology itself. Port companies may also need to invest in equipment retrofitting, infrastructure connections, system testing, employee training, and long-term maintenance. Companies with stronger financial conditions can sustain these complementary investments and are better able to tolerate uncertainty during the technology-adaptation period. At the same time, stronger financial resources may support the expansion of cargo-handling capacity and capital-intensive equipment, potentially increasing operational energy consumption. Financial health therefore does not necessarily reduce emissions directly. Its moderating role arises from its capacity to support the complementary investment needed to convert formally acquired green technologies into actual operational improvements. Given the high capital intensity and equipment interdependence of port operations, the implementation-support effect of financial resources is expected to outweigh the potential scale-expansion effect in the GTT process. Accordingly, the following hypotheses are proposed regarding the moderating roles of internal endowments:
Hypothesis 4a (H4a).
TAC positively moderates the negative effect of GTT on EOPCE.
Hypothesis 4b (H4b).
FIH positively moderates the negative effect of GTT on EOPCE.
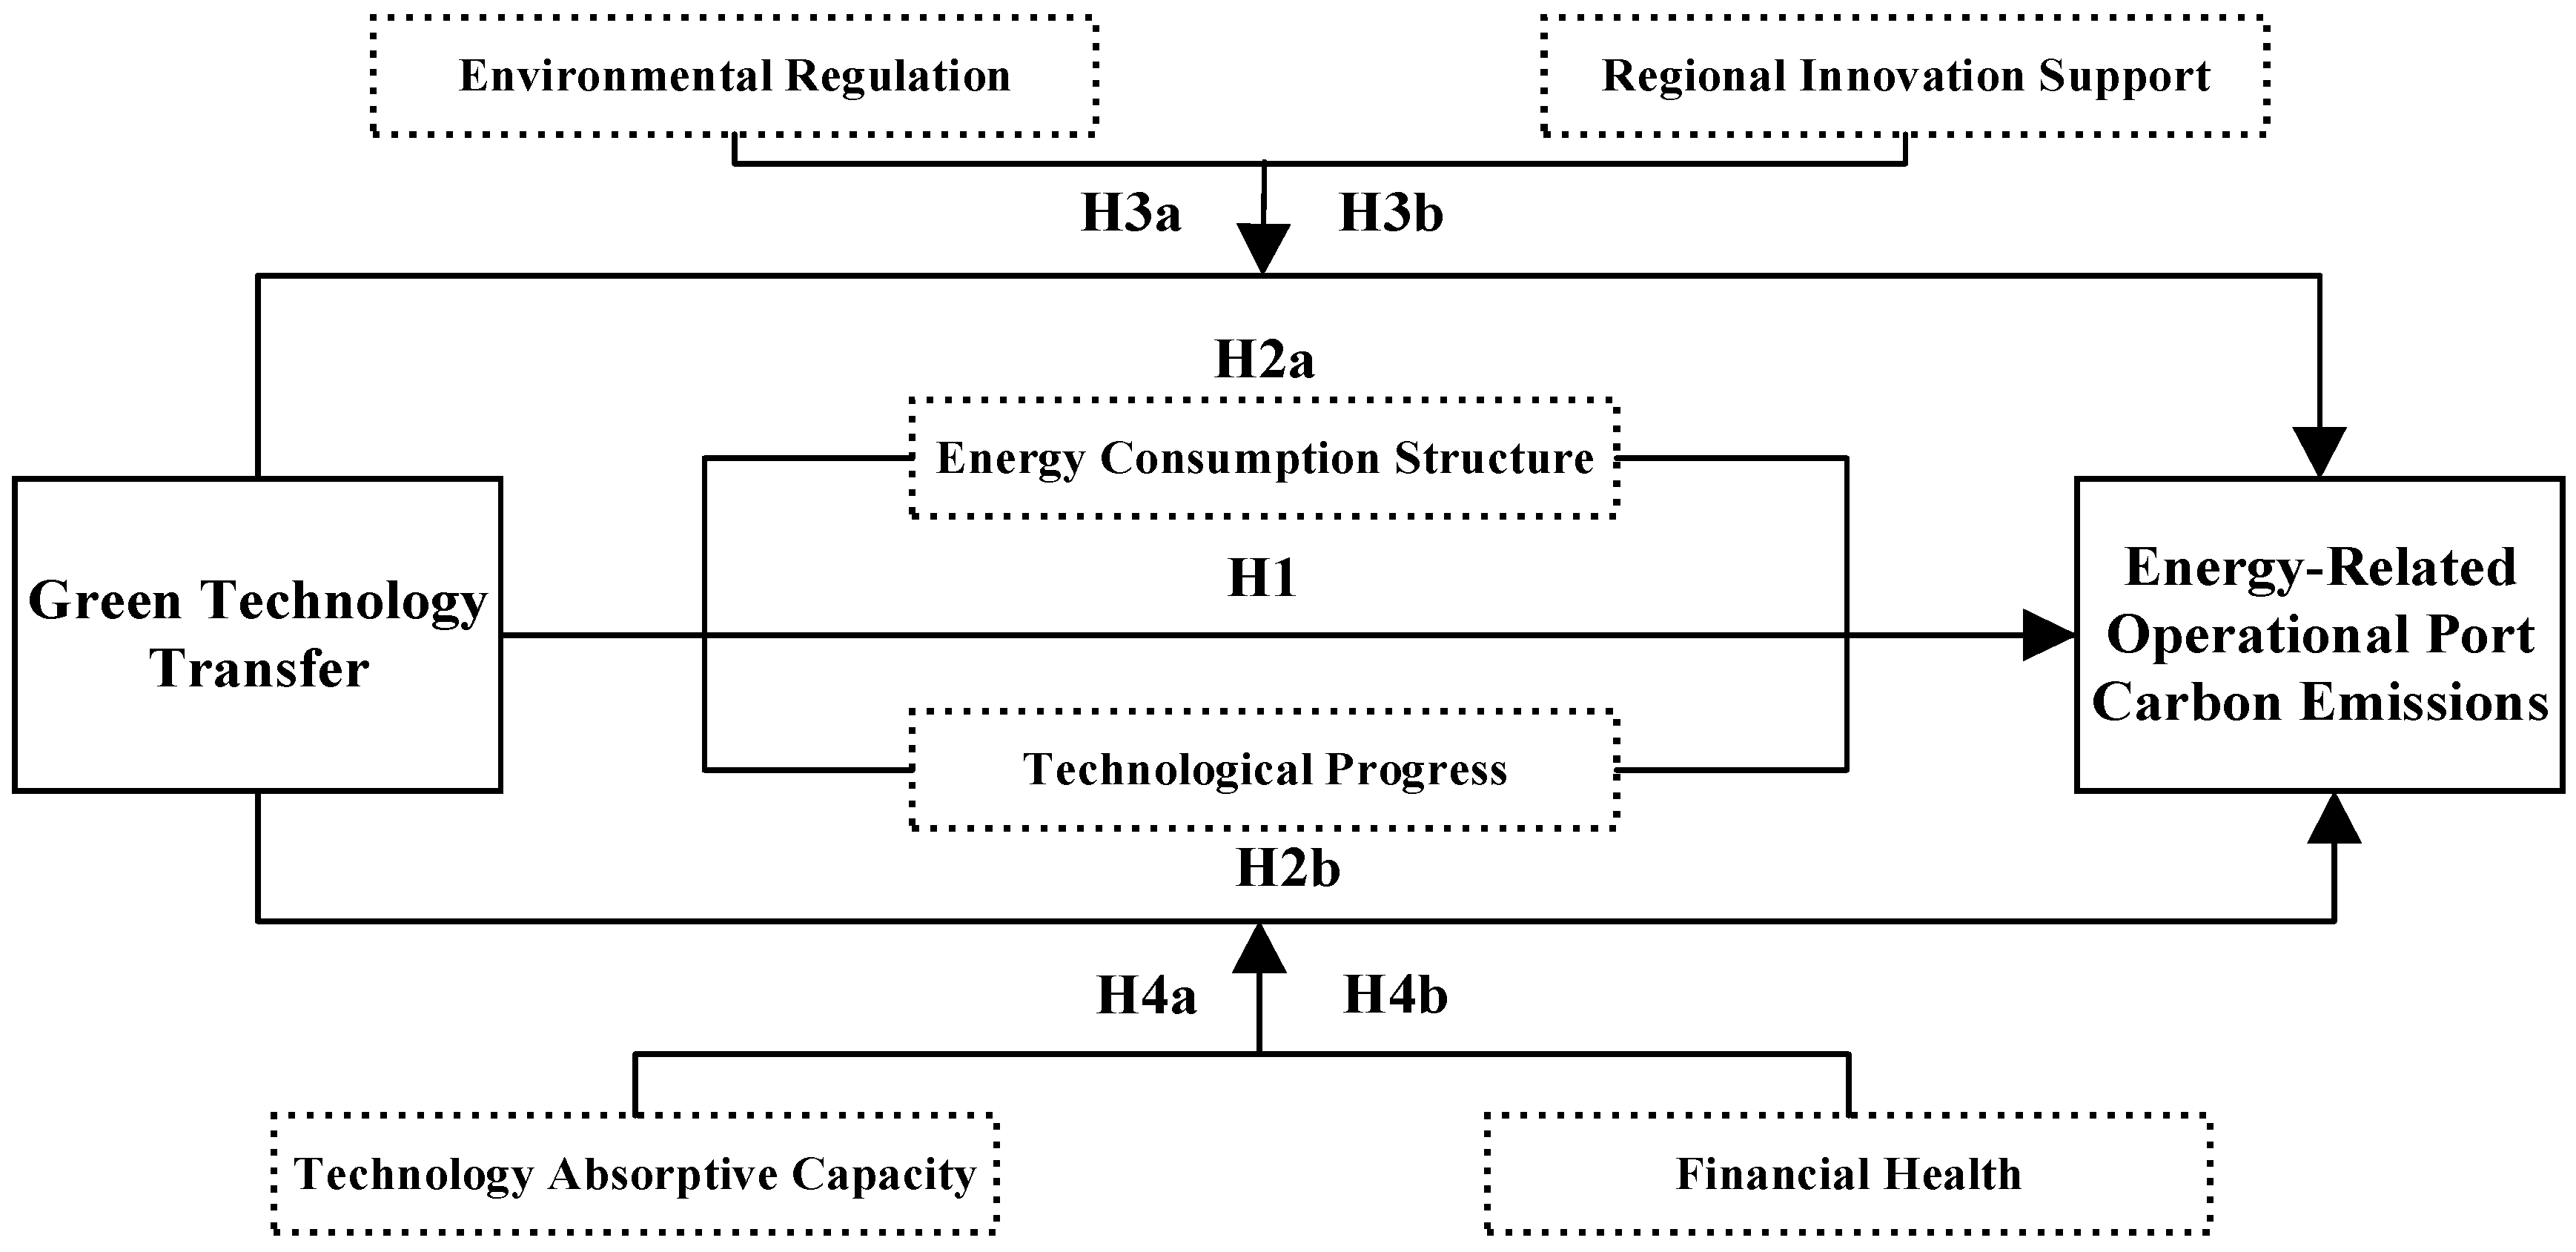
Based on the above theoretical analysis, this paper constructs a theoretical framework of the impact of GTT on EOPCE, as shown in Figure 1.

3. Methodology

3.1. Model Setting

To examine whether GTT reduces EOPCE, this paper specifies the following econometric model as shown in Equation (1).
E O P C E i t = C + β G T T i t + k = 1 7 θ k C V i t + v i + u t + ε i t
where i denotes a listed port company; t denotes time; k denotes the number of control variables; C denotes the constant term; ν represents firm fixed effects; u represents year fixed effects; ε denotes random error term; EOPCE denotes energy-related operational port carbon emissions; and GTT denotes the green technology transfer of listed port companies. In addition, according to the research results related to the influencing factors of EOPCE [45], seven main factors, namely, economic development (ECO), foreign investment intensity (FDI), port scale (SCA), port digital development (DIG), R&D personnel ratio (RDP), operating cash flow (OCF), and capital intensity (CAP) are included in the set of control variables (CV).
To examine whether GTT reduces EOPCE through ECS and TEP, this paper specifies the following mediation model as shown in Equation (2).
E O P C E i t = C 0 + β   G T T i t + k = 1 7 θ k C V i t + v i + u t + ε i t M E D i t = C 1 + β 1 G T T i t + k = 1 7 θ k C V i t + v i + u t + ε i t E O P C E i t = C 2 + β 2 G T T i t + η M E D i t + k = 1 7 θ k C V i t + v i + u t + ε i t
where β is the estimated coefficient of GTT on EOPCE (total effect); β1 is the estimated coefficient of GTT on the mediating variable (MED); η is the estimated coefficient of MED on EOPCE; and β2 is the estimated coefficient of GTT on EOPCE (direct effect).
To examine whether the effect of GTT on EOPCE is moderated by the external environment (ENR and RIS) and internal endowments (TAC and FIH), this paper specifies the following moderation model, as shown in Equation (3).
E O P C E i t = C 3 + β 3 G T T i t + α R E G i t + γ G T T i t R E G i t + k = 1 7 θ k C V i t + v i + u t + ε i t
where α is the estimated coefficient of the moderating variable (REG) and γ is the estimated coefficient of the interaction term (GTT×REG).

3.2. Variables

3.2.1. Dependent Variable

Energy-related operational port carbon emissions (EOPCE). An appropriate definition of the accounting boundary is a prerequisite for carbon-emission measurement. Port-related carbon emissions generally arise from port operations, purchased energy, berthed vessels, landside collection and distribution transport, and other activities within the port–shipping–logistics system [46,47]. Given that the empirical units of this study are listed port companies, this paper focuses on the energy-related carbon emissions generated by their operational activities and defines the dependent variable as energy-related operational port carbon emissions (EOPCE).
The comprehensive measurement of emissions from berthed vessels and hinterland transportation requires continuous and comparable source-specific data. In particular, AIS-based vessel-emission estimation depends on information concerning vessel operating status, berthing duration, main- and auxiliary-engine power, load factors, fuel types, and corresponding emission factors. It also requires an accurate mapping among individual vessel calls, terminals, ports, and listed port companies. However, such information is not continuously available for all 19 sampled companies over the 2011–2024 period. Meanwhile, the disaggregated energy data publicly disclosed by port companies differ substantially in organizational boundary, energy category, reporting unit, and temporal continuity. Incorporating such incomplete information would compromise the consistency and comparability of the panel data.
Accordingly, following the existing literature [48], this study estimates EOPCE by combining the comprehensive energy consumption per unit of throughput, cargo throughput, and the CO2 emission factor of standard coal, as shown in Equation (4):
E O P C E i t = H C i t S C i t F c
where EOPCEit denotes the estimated energy-related operational port carbon emissions of listed port company i in year t, rather than the complete carbon footprint of the entire port system; HCit denotes comprehensive energy consumption per unit of cargo throughput, measured in standard coal equivalent; SCit represents cargo throughput; and Fc denotes the CO2 emission factor of standard coal.
This measure integrates the operating scale of a port company with the energy intensity embodied in each unit of cargo-handling activity. Cargo throughput reflects the scale of port operations, while comprehensive energy consumption per unit of throughput captures the energy-use characteristics of cargo handling, storage, internal transportation, equipment operation, and related production activities. Their combination therefore provides a consistent basis for identifying cross-company differences and intertemporal changes in EOPCE and corresponds closely to the operational channels through which transferred green technologies, including low-carbon handling equipment, intelligent energy-management systems, process-optimization technologies, and clean-energy applications, may affect carbon emissions. By construction, EOPCE primarily captures emissions associated with cargo handling, storage, internal transportation, equipment operation, and other energy-consuming activities within listed port companies, while emissions from berthed vessels and hinterland collection and distribution transport are not directly included.

3.2.2. Explanatory Variable

Green technology transfer (GTT). As discussed in Section 2.1.2, GTT encompasses multiple stages, including formal technology acquisition, knowledge exchange, technological adaptation, organizational integration, and operational application. Given the absence of continuous and comparable firm-year information on the managerial integration and post-transfer deployment of green technologies, the empirical measurement in this study focuses on the observable formal acquisition stage of GTT. Existing studies indicate that changes in patent ownership and patent-assignment records provide legally recognized and traceable evidence of technology transactions and the movement of technological assets between different entities [30,31,32,49]. Compared with patent applications or patent stocks, which primarily reflect technology creation and accumulation, and patent citations, which mainly capture knowledge diffusion and spillovers, patent transfer records more directly identify the formal movement of an existing technology from an external supplier to a specific recipient company. They also contain identifiable information on the transferred patent, transferor, recipient, and transfer date, thereby supporting consistent matching at the company-year level. Therefore, this study uses green patent transfer records to measure the frequency with which listed port companies formally acquire external green technologies.
The specific measurement steps are as follows. Firstly, the International Patent Classification codes associated with green technologies are identified according to the WIPO Green Inventory introduced by the World Intellectual Property Organization in 2010. Secondly, according to the IPC classification codes, green patent records associated with each listed port company are obtained from the Patsnap Global Patent Database. Thirdly, patent transfer events are identified from the corresponding legal-status and patent-assignment records, and the green patent transfer database is subsequently constructed. Python 3.9 is then used to clean and classify the transfer records according to the organizational identity of the transferor [50]. Green patent transfers from universities and research institutions to listed port companies are aggregated to construct academic-origin GTT (AO-GTT), whereas transfers from enterprises are aggregated to construct enterprise-origin GTT (EO-GTT). When a listed port company receives no green patent transfer from a particular organizational source in a given year, the corresponding source-specific variable is coded as zero. Finally, the registration date of each patent transfer is taken as the time of technology transfer, and the annual number of green patent transfer events received by each listed port company is calculated as the GTT indicator.
Patent transfer records are legally documented, traceable, and consistently identifiable across companies and years, making them suitable for constructing a continuous firm-year panel of formal external green technology acquisition. Nevertheless, the baseline indicator assigns equal weight to each transfer event and therefore does not directly distinguish among patents with different technological values, maturity levels, commercial relevance, scopes of application, or adaptation requirements. Moreover, a legally recorded change in patent ownership does not necessarily imply that the transferred technology has been immediately or fully absorbed, adapted, and deployed in port operations. Accordingly, the GTT indicator should be interpreted as measuring the frequency of formal external green technology acquisition rather than the complete qualitative depth or realized operational application of GTT. The estimated coefficient therefore represents the average effect associated with an additional formally recorded green patent transfer event across heterogeneous transfers. To partially account for differences in technological content, the robustness analysis further replaces the baseline indicator with the annual number of green invention patent transfer events received by each listed port company.

3.2.3. Mediating Variables

Energy consumption structure (ECS). ECS refers to the proportion of different types of energy in the total energy consumption of enterprises in a certain period of time [51]. Based on this definition, this paper firstly converts the consumption of various types of energy in listed port companies into standard coal consumption. Secondly, natural gas and electricity are selected as representative cleaner energy sources, and their combined share in the total energy consumption of listed port companies is used to measure ECS.
Technological progress (TEP). Following the Global Malmquist productivity index framework proposed by Pastor and Lovell (2005) [52], and drawing on studies of port-enterprise performance and technological innovation efficiency [53], this study constructs an output-oriented Global DEA–Malmquist model under the assumption of constant returns to scale. Net fixed assets and the number of employees are used as input variables, while cargo throughput and the stock of internally developed green invention patents are treated as desirable outputs. The technological change component (TECHCH) is extracted from the productivity index and transformed into its natural logarithm to measure TEP.

3.2.4. Moderating Variables

Environmental regulation (ENR). ENR refers to the institutional arrangements through which local governments constrain and guide energy consumption and pollution emissions arising from port operations by formulating and implementing relevant policies, standards, and regulatory measures. Following the text-based approach of Xiong et al. [54], this paper uses the annual Government Work Reports of the cities where listed port companies’ principal operating ports are located and employs Python to collect, clean, segment, and analyze the report texts. Based on policy documents concerning port environmental governance, three dictionaries are constructed to identify port-related objects, environmental governance issues, and regulatory actions. These dictionaries respectively cover terms related to ports and port operations, such as “port,” “terminal,” and “berthed vessels”; environmental matters, such as “shore power,” “vessel emissions,” “pollutant reception and disposal,” and “clean energy”; and regulatory actions, such as “mandatory,” “supervision,” “inspection,” “penalty,” and “rectification.” Using clauses as the basic identification unit, only clauses containing at least one term from each dictionary are classified as valid port-specific environmental regulation statements, thereby excluding general references to green development that lack explicit port-related regulatory content. Accordingly, ENR is measured as the number of valid port-specific environmental regulation statements per 1000 valid words in each government work report.
Regional innovation support (RIS). RIS refers to the resources invested by local governments to support R&D activities in the region [55]. In view of this, this paper uses the proportion of fiscal science and technology expenditure in local general budget expenditure to proxy government support for regional innovation [56].
Technology absorptive capacity (TAC). TAC denotes enterprises’ ability to recognize, digest and apply technologies from external sources. Research shows that firms’ ability to acquire and adapt external technologies is closely related to their R&D investment. Greater R&D investment can strengthen firms’ capacity to learn from and adapt external technologies and facilitate the transformation of external knowledge into innovative outputs. Based on this, this paper uses R&D intensity, i.e., the ratio of a listed port company’s annual R&D expenditures to its operating revenues, as an empirical proxy for TAC [57].
Financial health (FIH). FIH refers to the robustness of a company’s financial condition, reflecting its ability to utilize resources effectively, manage risk, and maintain long-term financial stability [58]. In view of this, this paper constructs the FIH-score model to measure the FIH of listed port companies [59]. The model is as shown in Equation (5).
F I H _ S c o r e = 1.2 x 1 + 1.4 x 2 + 3.3 x 3 + 0.6 x 4 + 0.99 x 5
where x1 is the ratio of working capital to total assets; x2 is the ratio of retained earnings to total assets; x3 is the ratio of earnings before interest to total assets; x4 is the ratio of market value of equity to total liabilities; and x5 is the ratio of operating income to total assets.

3.2.5. Control Variables

Economic development (ECO). Prior research indicates that regional ECO materially influences EOPCE. On the one hand, ECO promotes trade growth, which increases cargo handling, storage, internal transportation, and equipment operation, thereby raising the operational energy consumption and EOPCE of listed port companies. On the other hand, economically developed regions usually have abundant green innovation resources, sound environmental regulatory systems and high public awareness of environmental protection, which is conducive to reducing EOPCE. In view of this, this paper adopts GDP per capita to measure the ECO.
Foreign investment intensity (FDI). Like economic development, FDI increases the business volume and operational energy consumption of listed port companies, thereby pushing up EOPCE. Meanwhile, FDI brings cross-border flow of technology, capital, and management experience, which provides strong support for ports to optimize their operation mode and thus reduce EOPCE. In view of this, this paper adopts the proportion of actual foreign investment in the year to GDP to measure FDI.
Port scale (SCA). On the one hand, an increase in scale will bring about greater cargo flow and operational intensity, leading to a rise in total energy consumption and EOPCE. On the other hand, large-scale ports usually have a greater capacity for resource allocation and the application of green technology, reducing emissions per unit of activity. As an important characterization of SCA, the number of port berths directly reflects the carrying capacity and operation scale of the port. Therefore, this paper measures SCA by the number of port berths.
Port digital development (DIG). Research shows that DIG can lower EOPCE by promoting intelligent operations, refined operational scheduling, and efficient energy use. As the core support for DIG, informationization investment directly reflects the efforts and progress made by ports in building digital infrastructure, introducing intelligent systems and improving data management capabilities. In view of this, this paper adopts port informatization investment to measure DIG.
R&D personnel ratio (RDP). Prior research indicates that a firm’s R&D capability constitutes an important foundation for identifying, assimilating, and applying external knowledge. Corporate R&D activities can facilitate technological upgrading and improve environmental performance, while green R&D contributes to eco-innovation and carbon-emission reduction. For listed port companies, a higher proportion of R&D personnel can strengthen the capacity to absorb and adapt transferred green technologies, optimize equipment operation, and implement energy-saving practices, thereby contributing to lower EOPCE. In view of this, this paper measures RDP as the number of R&D personnel divided by the total number of employees.
Operating cash flow (OCF). Low-carbon operational transformation generally requires sustained financial resources for equipment renewal, energy-saving retrofits, environmental investment, and routine maintenance. Stronger operating cash flow can provide stable internal financing, alleviate financing constraints, and enhance a firm’s capacity to undertake carbon-abatement activities. Existing evidence shows that financial constraints may increase corporate pollution, whereas firms with greater internal liquidity tend to exhibit lower carbon emissions partly because they invest more in renewable energy use and carbon-abatement projects. Conversely, higher operating cash flow may also reflect greater business volume and operational intensity, which can increase energy consumption. In view of these potentially opposing effects, this paper adopts net cash flow from operating activities divided by total assets to measure OCF.
Capital intensity (CAP). Fixed assets constitute the physical foundation of port operations and determine the scale, technical condition, and energy characteristics of handling equipment and operational infrastructure. On the one hand, a higher proportion of fixed assets may indicate greater reliance on capital-intensive equipment, increasing operational energy demand and EOPCE. On the other hand, the renewal and upgrading of fixed assets may incorporate energy-efficient technologies and improve equipment performance, which is conducive to energy conservation. In view of this, this paper measures CAP as net fixed assets divided by total assets.
The specific parameter symbols and definitions are shown in Table 1.

3.3. Data Sources

This study uses a panel of 19 listed Chinese port companies covering the period from 2011 to 2024. Listed port companies are selected because firm-level information on green patent acquisitions, energy consumption, operational activities, technological investment, and financial conditions can be consistently matched within a unified corporate boundary over an extended period. Their public disclosures provide relatively continuous, standardized, and comparable information for constructing the firm-year panel. Accordingly, the empirical findings should be interpreted as evidence concerning listed Chinese port companies rather than as average effects for the entire Chinese port sector. Data are drawn from the China Port Yearbook, Port Information Statistics, China Urban Statistical Yearbook, China Environmental Yearbook, China Energy Statistical Yearbook, China Electric Power Yearbook, China Science and Technology Statistical Yearbook, the official website of the Ministry of Transportation and Communications, the Wind database, and the Patsnap Global Patent Database. The linear interpolation method is used to supplement some of the missing data to ensure the completeness of the data. Table 2 reports the descriptive statistics of the main variables.

4. Empirical Results and Analysis

4.1. Benchmark Regression Analysis

Table 3 reports the benchmark regression results for the effect of GTT on EOPCE. Across columns (1)–(7), the coefficient of GTT remains significantly negative at the 1% level, while its estimated value gradually changes from −0.294 to −0.247 as the control variables are sequentially introduced. The results demonstrate that the estimated inhibitory effect of GTT on EOPCE is robust to the inclusion of alternative sets of control variables. In substantive terms, a higher level of GTT is consistently associated with lower energy-related operational carbon emissions among listed port companies. Therefore, Hypothesis 1 is supported, providing a stable empirical basis for the subsequent mechanism, moderation, and heterogeneity analyses. It should be noted that, as GTT is measured by the annual number of formally recorded green patent transfer events, the benchmark coefficient reflects the average change in EOPCE associated with an additional green patent transfer event across heterogeneous transferred technologies, rather than the marginal effect of changes in patent quality or technological maturity.
Regarding the control variables, ECO remains significantly negative at the 1% level across all specifications, suggesting that higher levels of regional economic development are associated with lower EOPCE. DIG also exhibits a significantly negative coefficient at the 1% level, indicating that port digital development is associated with reduced energy-related operational carbon emissions. The coefficient of RDP is negative and statistically significant at the 10% level, providing preliminary evidence that a higher proportion of R&D personnel may facilitate technological absorption and operational improvement, thereby contributing to emissions reduction. OCF is significantly negative at the 5% level, suggesting that stronger operating cash-flow capacity may provide firms with greater financial flexibility to undertake cleaner equipment investment and low-carbon operational adjustments. By contrast, CAP has a significantly positive coefficient at the 5% level, indicating that port companies with a higher proportion of fixed assets tend to exhibit higher EOPCE, possibly because capital-intensive port operations remain dependent on large-scale handling equipment and other energy-consuming infrastructure. The coefficients of FDI and SCA do not reach conventional levels of statistical significance, implying that their associations with EOPCE cannot be robustly identified in the benchmark specifications. Overall, the benchmark results show that ECO, DIG, RDP, and OCF are negatively associated with EOPCE, whereas CAP is positively associated with EOPCE, while the effects of FDI and SCA remain statistically insignificant.

4.2. Robustness and Endogeneity Analysis

Table 4 reports the robustness test results based on alternative measures of GTT, a changed sample period, and an alternative estimation method. Column (1) replaces GTT with the annual number of green patents owned by each listed port company. The coefficient is −0.236 and statistically significant at the 1% level, indicating that firms’ green technological accumulation is negatively associated with EOPCE. Column (2) uses the annual number of transferred green invention patents received by each listed port company as an alternative measure of GTT. Compared with the baseline measure, green invention patents generally involve higher technological complexity and innovation requirements. The estimated coefficient is −0.297 and significant at the 5% level, indicating that the negative effect of GTT on EOPCE remains valid when the transferred patents are restricted to invention patents. Although this alternative measure does not eliminate quality heterogeneity among invention patents, it applies a stricter technological-content screen while preserving the event-based measurement of GTT. Column (3) changes the sample period from 2011–2024 to 2011–2019 to reduce the potential influence of the COVID-19 pandemic, subsequent changes in port operations, and the intensified implementation of green-transition policies. The coefficient of GTT remains significantly negative at −0.216. Although its absolute magnitude is moderately lower than that obtained from the full sample, its sign and statistical significance remain unchanged. Column (4) employs the Prais–Winsten PCSE estimator while retaining firm and year effects and accounting for panel heteroskedasticity, contemporaneous cross-sectional correlation, and first-order serial correlation. The coefficient of GTT is −0.243 and significant at the 1% level. Overall, the negative effect of GTT on EOPCE remains stable across alternative variable measures, sample periods, and estimation methods, confirming the robustness of the benchmark results.
Table 5 further addresses potential endogeneity concerns by employing an external-supply-based instrumental variable, temporal-order tests, and dynamic panel estimators. Columns (1) and (2) of Table 5 jointly report the two-stage instrumental-variable estimation results. To mitigate potential endogeneity arising from omitted variables and reverse causality, this study constructs peer green technology transfer exposure through pre-existing intellectual-property intermediary networks (PGTE) as an instrumental variable for GTT, based on the diffusion of green technology transfer within the same port cluster and pre-sample intellectual-property service networks. Specifically, the instrument is calculated by multiplying the one-period-lagged average GTT of other port companies within the same port cluster, excluding the focal company, by the patent-agency network overlap measured from patent application records during 2006–2010. The former captures the green technology transfer activities observable and accessible within the port cluster, while the latter reflects the pre-existing intellectual-property service ties between the focal port company and its peer companies through shared patent agencies. An increase in GTT among peer port companies may improve the focal company’s access to patent supply-and-demand information and facilitate ownership verification and transfer registration through these established intermediary networks, thereby increasing its likelihood of receiving transferred green technologies. By contrast, patent-agency ties formed before the sample period do not directly participate in port operations, energy consumption, or emissions generation, and therefore have relatively limited direct channels through which they could affect EOPCE. Moreover, excluding the focal company from the peer average, lagging peer GTT by one period, and using pre-sample network characteristics help reduce potential interference arising from the focal company’s own behavior, contemporaneous reverse effects, and common current-period shocks. The first-stage results show that the coefficient of PGTE is 0.631 and statistically significant at the 1% level, indicating that green technology transfer activities among peer ports, transmitted through pre-existing intellectual-property service networks, significantly increase the focal company’s receipt of transferred green technologies. The Kleibergen–Paap rk LM statistic is 14.962 and significant at the 1% level, rejecting the null hypothesis of underidentification. The Kleibergen–Paap rk Wald F statistic is 16.578, exceeding the commonly used rule-of-thumb threshold of 10 and showing no evident weak-identification problem. The second-stage results show that, after instrumenting GTT with PGTE, the coefficient of GTT is −0.275 and statistically significant at the 5% level, remaining broadly consistent with the benchmark estimate in both direction and magnitude. These findings indicate that GTT continues to reduce the energy-related operational carbon emissions of listed port companies when identification relies on exogenous variation generated by peer technology diffusion and pre-existing intellectual-property service networks, providing further support for the benchmark conclusion.
Column (3) uses the first-order lag of GTT. The coefficient of L.GTT is −0.208 and significant at the 5% level, suggesting that green technologies transferred in the previous period are associated with lower current EOPCE. This result is consistent with the time required for technological absorption, equipment adaptation, and operational application after a formal technology transfer. Column (4) introduces the first-order lead of GTT as a placebo test. The coefficient of F.GTT is −0.029 and statistically insignificant, indicating that future GTT does not systematically predict current EOPCE. Although this result does not completely eliminate all possible forms of reverse causality, it provides additional support for the temporal ordering underlying the benchmark relationship. Column (5) reports the LSDVC estimation. The coefficient of lagged EOPCE is 0.472 and significant at the 1% level, indicating substantial persistence in firms’ energy-related operational carbon emissions. After correcting the finite-sample bias associated with the dynamic fixed-effects specification, the coefficient of GTT remains significantly negative at −0.233. Column (6) presents the system GMM results. The coefficient of lagged EOPCE is 0.499 and statistically significant, further confirming the dynamic persistence of EOPCE. Meanwhile, the coefficient of GTT is −0.249 and significant at the 1% level. The AR(1) test is significant, whereas the AR(2) test is insignificant, indicating the absence of second-order serial correlation. The Hansen test yields a p-value of 0.467, suggesting that the validity of the instrument set cannot be rejected.
Overall, the IV–2SLS, lagged-variable, lead-placebo, LSDVC, and system GMM results consistently support the negative effect of GTT on EOPCE. The estimated coefficients of GTT range from −0.208 to −0.275 and remain statistically significant across all substantive specifications, while the insignificant lead term provides no evidence that future GTT predicts current emissions. These findings indicate that the benchmark conclusion remains stable after accounting for potential omitted-variable bias, reverse causality, dynamic persistence, and finite-sample bias.

4.3. Mediating Effect Analysis

Table 6 reports the mediation test results for ECS and TEP. Following the conventional stepwise mediation-testing procedure, the benchmark regression first establishes a significant negative relationship between GTT and EOPCE. The second step examines whether GTT significantly affects the proposed mediating variables, and the third step evaluates whether the mediating variable remains significant after entering the EOPCE regression together with GTT. On this basis, this subsection assesses whether ECS and TEP serve as effective transmission channels linking GTT to EOPCE.
Columns (1) and (2) show that ECS constitutes a statistically significant mediating mechanism. Specifically, the coefficient of GTT on ECS in column (1) is significantly positive, indicating that GTT promotes the optimization of the port ECS. After ECS is introduced into the EOPCE regression in column (2), ECS enters with a significantly negative coefficient, while the coefficient of GTT remains significantly negative, though reduced in absolute magnitude relative to the benchmark estimate. This pattern is consistent with a partial mediation effect. In addition, the Sobel test statistic is significant, and the Bootstrap confidence interval of the indirect effect does not include zero, which further confirms the mediating role of ECS. Therefore, Hypothesis 2a is supported. Columns (3) and (4) show that TEP also constitutes a statistically significant mediating mechanism. Specifically, the coefficient of GTT on TEP in column (3) is significantly positive, indicating that GTT promotes technological progress in listed port companies. After TEP is introduced into the EOPCE regression in column (4), TEP enters with a significantly negative coefficient, while the coefficient of GTT remains significantly negative, though reduced in absolute magnitude relative to the benchmark estimate. This pattern is likewise consistent with a partial mediation effect. In addition, the Sobel test statistic is significant, and the Bootstrap confidence interval of the indirect effect does not include zero, which further confirms the mediating role of TEP. Therefore, Hypothesis 2b is supported.
Taken together, the mediation analysis reveals that both ECS and TEP serve as effective transmission channels through which GTT reduces EOPCE. These findings refine the benchmark conclusion by showing that the emission-reduction effect of GTT is transmitted through both energy consumption structure optimization and technological progress.

4.4. Moderating Effect Analysis

Table 7 reports the moderating effects of the external environment and internal endowments. To examine whether the effect of GTT on EOPCE varies across contextual conditions, this study introduces the interaction terms between GTT and ENR, RIS, TAC, and FIH, respectively. The results reveal differentiated boundary conditions for translating GTT into lower EOPCE.
Column (1) shows that the interaction term between GTT and ENR is significantly negative, indicating that stronger environmental regulation reinforces the negative effect of GTT on EOPCE. As environmental regulation intensifies, port companies face greater pressure to improve energy use, upgrade operational processes, and accelerate the application of externally acquired green technologies, thereby strengthening the emissions-reducing effect of GTT. Therefore, Hypothesis 3a is supported. Column (2) shows that the interaction term between GTT and RIS is significantly negative at the 5% level. This suggests that a stronger regional innovation system enhances the EOPCE-reducing effect of GTT. Regional innovation resources, knowledge networks, and supporting services may facilitate technology matching, knowledge diffusion, and the operational integration of transferred green technologies. Therefore, Hypothesis 3b is supported. Column (3) reports the moderating role of TAC. The interaction term between GTT and TAC is negative but statistically insignificant, indicating that firms’ R&D intensity does not significantly alter the marginal effect of GTT on EOPCE under the current sample and model specification. Accordingly, Hypothesis 4a is not supported by the present empirical evidence. Column (4) presents the moderating effect of FIH. The interaction term between GTT and FIH is significantly negative at the 1% level, indicating that better financial health strengthens the EOPCE-reducing effect of GTT. Port companies with stronger financial conditions are better positioned to finance equipment upgrading, technological adaptation, personnel training, and complementary operational adjustments, thereby facilitating the effective implementation of transferred green technologies. Therefore, Hypothesis 4b is supported.
Taken together, the moderating effect analysis shows that ENR, RIS, and FIH significantly strengthen the negative effect of GTT on EOPCE, whereas no statistically significant moderating effect is identified for the R&D-intensity-based TAC measure. These findings indicate that the emissions-reducing effect of GTT depends not only on the occurrence of technology transfer but also on the regulatory pressure, regional innovation support, and financial resources available for its implementation. The results therefore extend the benchmark finding by identifying the external and internal conditions under which GTT is more effectively translated into lower EOPCE.

4.5. Heterogeneity Analysis

Although the baseline regression results indicate that GTT significantly reduces EOPCE, this average effect may conceal differences arising from technology sources, regional conditions, and firms’ implementation capabilities. Whether transferred green technologies can be effectively embedded in port production systems and translated into tangible emission reductions depends not only on the technologies themselves but also on the external environment in which ports operate and the internal conditions of port enterprises. It is therefore necessary to further examine the heterogeneous effects of GTT to identify the specific contexts and boundary conditions under which its emission-reduction effect is realized.
According to the organizational source of the transferor, GTT can be divided into academic-origin GTT (AO-GTT), originating from universities and research institutions, and enterprise-origin GTT (EO-GTT), originating from other firms. AO-GTT is generally characterized by greater knowledge intensity and technological novelty but often requires further technical validation, engineering adaptation, and secondary development. By contrast, EO-GTT usually has a clearer basis for industrial application and tends to be more compatible with existing port equipment, production processes, and operational settings. Differences in organizational origin may therefore lead to variations in the application cycle and the realization of emission-reduction benefits. Chinese port regions also differ substantially in innovation resources, industrial structures, and institutional environments. Ports in the Bohai Rim (BR) are closely connected with energy, steel, and other heavy industries, and the application of green technologies may be constrained by traditional industrial structures and established equipment systems. The Yangtze River Delta (YRD) possesses concentrated innovation resources and a well-developed industrial support system, which facilitates the absorption and adaptation of external technologies. The Pearl River Delta (PRD) is highly open and has a comparatively strong foundation for introducing and applying advanced technologies in port equipment, operational management, and emission control. Accordingly, the emission-reduction effect of GTT may vary across the BR, YRD, and PRD. The level of port digitalization (DIG) constitutes an important foundation for the application of green technologies. A higher level of DIG can facilitate the integration of transferred technologies with cargo-handling operations, logistics organization, and energy-management systems through equipment connectivity, data collection, intelligent scheduling, and energy monitoring, while reducing information and coordination costs during technology implementation. By contrast, ports with lower DIG may face fragmented data systems, limited system compatibility, and insufficient process coordination, thereby constraining the emission-reduction potential of GTT.
Based on the above analysis, this study further examines the heterogeneous effects of GTT on EOPCE across three dimensions: technology source, including AO-GTT and EO-GTT; port region, including the BR, YRD, and PRD; and port digitalization level (DIG).
According to Table 8, the estimated coefficients of GTT are −0.183, −0.265, −0.147, −0.282, −0.213, −0.176, and −0.281 across the seven specifications, respectively, and all attain conventional levels of statistical significance. These results provide additional evidence that GTT contributes to reducing EOPCE and further reinforce the robustness of the benchmark findings.
Columns (1) and (2) report the heterogeneous effects of GTT by technology source. The coefficients of both AO-GTT and EO-GTT are significantly negative, indicating that green technologies originating from academic institutions and enterprises can both reduce EOPCE. The absolute coefficient of EO-GTT (−0.265) is larger than that of AO-GTT (−0.183). However, the inter-group coefficient-difference test yields a p-value of 0.151, indicating that the difference between the two estimates is not statistically significant. Therefore, although EO-GTT exhibits a larger estimated emission-reduction effect in numerical terms, the current evidence does not support the conclusion that its effect is systematically stronger than that of AO-GTT. Columns (3)–(5) present the heterogeneity results across port regions. The coefficient of GTT remains significantly negative in the BR, YRD, and PRD subsamples, suggesting that the emission-reduction effect of GTT is broadly present across the three major port regions. In absolute terms, the coefficient is largest in the YRD subsample (−0.282), followed by the PRD (−0.213), and smallest in the BR (−0.147). The coefficient-difference tests further show that the difference between the YRD and BR is statistically significant, with a p-value of 0.041, whereas the differences between the YRD and PRD and between the PRD and BR are not statistically significant. These findings indicate that the emission-reduction effect of GTT is significantly stronger in the YRD than in the BR, while the remaining regional differences are reflected mainly in coefficient magnitude rather than statistically robust inter-group variation. Columns (6) and (7) report the results for port digitalization. The estimated coefficients of GTT are significantly negative in both the L-DIG and H-DIG subsamples, indicating that GTT reduces EOPCE regardless of the level of port digitalization. Nevertheless, the absolute coefficient is substantially larger in the H-DIG group (−0.281) than in the L-DIG group (−0.176). The inter-group difference is statistically significant at the 10% level, with a p-value of 0.074, providing suggestive evidence that a higher level of digitalization strengthens the emission-reduction effect of GTT. This result implies that digital infrastructure, equipment connectivity, and data-enabled operational coordination may facilitate the integration of transferred green technologies into port operations.
Overall, the heterogeneity analysis shows that the emission-reduction effect of GTT is broadly robust across technology sources, port regions, and digitalization levels, but its magnitude is not entirely uniform. Statistically significant differences are identified between the YRD and BR and, at a weaker significance level, between the H-DIG and L-DIG groups, whereas the difference between AO-GTT and EO-GTT is not statistically significant. These findings not only reinforce the benchmark regression results but also demonstrate that the decarbonization effect of GTT depends partly on the regional and digital conditions under which transferred technologies are implemented.

5. Discussion

5.1. Baseline Relationship Between GTT and EOPCE

This study finds that GTT significantly reduces EOPCE, and this finding remains robust after a series of robustness and endogeneity tests. This result is broadly consistent with the existing literature on GTT, low-carbon technology diffusion, and environmental performance, which generally suggests that technology transfer can improve the environmental outcomes of recipient entities by facilitating the diffusion of cleaner technologies and reducing the cost of technology acquisition [60,61]. However, unlike most prior studies, which have mainly focused on regions, industries, or general enterprises, this paper further identifies a significant EOPCE-reducing effect of GTT among listed port companies, a setting characterized by high energy intensity, strong infrastructure dependence, and complex operational systems. In this sense, the present study extends the GTT literature to the operational context of listed port companies [23,24] and complements the port carbon-governance literature, in which the role of external technology acquisition has received comparatively limited attention [9,10,62].
A further implication of this finding is that external green technology acquisition can serve as an important complement to ports’ internal innovation efforts. Existing studies emphasize that the environmental outcomes of technology transfer depend on the recipient’s capacity to absorb, adapt, integrate, and apply externally acquired technologies [63,64]. The significant baseline coefficient identified in this study indicates that the frequency of formal external green technology acquisition has a measurable relationship with EOPCE at the firm-year level. This finding supports the view that patent-based technology acquisition provides a meaningful entry point through which listed port companies can obtain low-carbon technological resources and improve energy use, operating equipment, and production processes. The low-carbon transformation of port operations therefore does not rely exclusively on internal R&D and endogenous innovation; external green technology acquisition also constitutes an empirically relevant component of operational emissions reduction. Its effectiveness nevertheless remains embedded in subsequent energy restructuring, technological adaptation, organizational integration, and financial and regional support conditions.
The empirical meaning of the baseline coefficient is jointly defined by the measurement boundaries of EOPCE and GTT. On the dependent-variable side, EOPCE captures energy-related emissions generated by the operational activities of listed port companies, including cargo handling, storage, internal transportation, equipment operation, and related production activities. Emissions from berthed vessels and hinterland collection and distribution transport are not directly included. Because the relative importance of these omitted sources may vary with cargo structure, vessel-call intensity, and transport organization, the resulting measurement differences may not be entirely random across ports. If GTT involving shore-power systems, vessel scheduling, or green logistics coordination also reduces emissions outside the EOPCE boundary, the indicator may not fully capture the broader emissions-reduction effect of GTT. Conversely, ports with more active GTT may also operate more intensive shipping and hinterland transport networks, making the omitted emission sources potentially correlated with GTT. The precise direction and magnitude of this influence cannot be unambiguously determined with the available data.
On the explanatory-variable side, the annual number of green patent transfers records the frequency of formal external technology acquisition but assigns equal weight to patents with potentially different technological values and does not directly observe their subsequent absorption and operational deployment. If breakthrough or core-process patents generate stronger EOPCE-reduction effects than peripheral patents, a count-based indicator may compress such quality differences and understate the specific emissions-reduction potential of high-quality GTT. Conversely, legally completed transfers with limited technological value or incomplete operational application are also included in the baseline measure, which may dilute the estimated average effect. The overall direction of the resulting measurement influence is therefore not necessarily one-sided. Accordingly, the baseline coefficient captures the average change in EOPCE associated with one additional formal green patent transfer event across the heterogeneous technologies observed in the sample. It therefore reflects the transfer-frequency dimension of GTT rather than the marginal effect of patent quality, technological maturity, or realized application intensity.

5.2. Differential Mediating Roles of ECS and TEP

The mediation analysis shows that GTT can significantly reduce EOPCE through the ECS and TEP channels, indicating that the emissions-reduction effect generated by external green technology acquisition does not depend on a single mechanism. Instead, it is reflected in adjustments to operational energy use and advances in the production technology frontier. Although the two transmission channels differ in their specific mechanisms, both constitute important pathways through which GTT affects the operational carbon emissions of port companies.
ECS primarily reflects changes in the sources and composition of energy used in port operations. This result is consistent with previous studies showing that energy substitution, port-equipment electrification, shore power, cleaner fuels, and energy-management systems can improve port environmental performance [65,66]. EOPCE is closely related to the energy consumed by cargo-handling equipment, quay and yard cranes, lighting systems, and associated logistics activities. The introduction of external green technologies can provide the technological basis for applying shore-power facilities, clean-energy equipment, energy-storage systems, and intelligent energy-management solutions. These technologies reduce ports’ dependence on conventional high-carbon energy sources and promote a lower-carbon energy consumption structure. The significant mediating effect of ECS therefore indicates that GTT can convert external technology acquisition into tangible emissions-reduction outcomes by changing the sources and patterns of operational energy use.
TEP represents a distinct pathway associated with improvements in technological capability. It reflects shifts in the production technology frontier of port companies and captures improvements in the production relationship among capital, labor, operational output, and green technological output. GTT enables port companies to obtain external technological knowledge related to automated cargo handling, intelligent scheduling, production-process control, and green operational processes, thereby reducing the time and trial-and-error costs associated with developing comparable technologies entirely through internal R&D. Through the adaptation, recombination, and further development of transferred technologies, firms can improve operational output and green technological accumulation under given capital and labor inputs, thereby promoting an outward shift in the production technology frontier. The significantly negative effect of TEP on EOPCE indicates that technological progress not only improves operational capability and green innovation output but also reduces operational carbon emissions through enhanced equipment performance, optimized operating procedures, and improved energy-use efficiency. This finding is consistent with Sun et al. (2017), who show that technological and environmental factors jointly shape the performance of port enterprises [53], and with Wurlod and Noailly (2018), who find that green technological innovation can reduce energy intensity [67].
ECS and TEP constitute two important transmission channels through which GTT reduces EOPCE and reveal the different points at which these mechanisms operate. The ECS channel concerns which forms of energy port companies use and how those energy sources are allocated, whereas the TEP channel concerns how capital, labor, operational technologies, and green knowledge are combined. The former reduces high-carbon energy inputs through cleaner-energy substitution and energy-structure adjustment, while the latter improves the technological level of production through process upgrading, equipment retrofitting, operational optimization, and the accumulation of green technologies. These channels are related but not interchangeable, indicating that GTT affects both the energy-input side of port operations and the technological capability and production-process side. After ECS and TEP are introduced separately into the EOPCE regression, the coefficient of GTT remains statistically significant, indicating that both variables exert partial mediation effects. In addition to energy-structure optimization and technological progress, GTT may also influence the operational carbon emissions of port companies through equipment renewal, production coordination, management improvement, and supply-chain collaboration. These findings extend the existing literature by showing that green technology transfer in the port sector generates environmental benefits not only through energy substitution but also through advances in the technological frontier and the upgrading of operational technologies.

5.3. Heterogeneous Moderating Roles of External and Internal Conditions

The moderating-effect results show that ENR, RIS, and FIH significantly strengthen the negative effect of GTT on EOPCE, whereas no statistically significant moderating effect of TAC is identified under the current sample and R&D-intensity-based proxy measure. This indicates that whether GTT can be effectively converted into operational emissions reductions depends not only on technology transfer itself but also on the external institutional environment, regional innovation conditions, and firms’ internal resource endowments. Targeted environmental constraints, a well-developed regional innovation system, and sufficient financial resources provide important conditions for the adaptation, implementation, and sustained application of transferred technologies.
The significantly negative moderating effect of ENR indicates that stronger port-related environmental regulation reinforces the inhibitory effect of GTT on EOPCE. This finding is consistent with previous studies showing that environmental regulation can encourage highly polluting firms to increase technological investment and adopt cleaner production processes [68]. Port-specific regulatory requirements concerning shore-power use, low-sulfur fuels, clean-energy substitution, equipment upgrading, and pollution control can clarify firms’ emissions-reduction targets, increase the compliance costs of delaying technological transformation, and strengthen the incentives for port companies to acquire and apply green technologies. Under stronger environmental regulation, firms are also required to advance equipment retrofitting, infrastructure connection, and production-process adjustment, thereby reducing the likelihood that transferred green technologies remain idle or are confined to formal acquisition. ENR therefore not only promotes green technological investment directly but also strengthens the practical emissions-reduction benefits generated by external green technology transfer.
The significant moderating effect of RIS indicates that technology transfer is not an isolated market transaction but a process of knowledge acquisition and redevelopment embedded in regional innovation networks. A well-developed regional innovation system can provide port companies with policy coordination, specialized technical services, supplier support, cooperation with universities and research institutions, and complementary knowledge resources. These conditions reduce the costs associated with technology matching, implementation problem-solving, and subsequent re-innovation. Existing research suggests that firms’ ability to obtain innovation benefits from external knowledge spillovers depends on their internal R&D and knowledge-recombination capabilities, while the value of external knowledge sources is also shaped by the innovation environment and knowledge networks in which firms are embedded [69]. RIS therefore not only facilitates green technology transfer but also improves the adaptation efficiency and environmental value of transferred technologies in port operations, allowing the emissions-reduction effect of GTT to be more fully realized.
The significant moderating effect of FIH indicates that the green transformation of ports is not solely a technological issue but is also constrained by firms’ financial resources. The introduction of green technologies commonly requires complementary investment in equipment retrofitting, infrastructure connections, system testing, employee training, and ongoing maintenance. Port companies with stronger financial conditions are better able to bear the adaptation costs following technology acquisition and sustain the subsequent investment required for continued application. Xu and Kim (2022) find that financial constraints restrict firms’ investment in pollution abatement and increase pollutant emissions [70], while Flammer (2021) shows that green financing can support environmentally friendly projects and improve corporate environmental performance [71]. FIH therefore strengthens the conversion of GTT into actual operational emissions reductions by supporting the implementation and sustained use of transferred technologies.
By contrast, the coefficient of the interaction term between GTT and TAC is negative but statistically insignificant, indicating that firms’ R&D intensity does not significantly alter the marginal effect of GTT on EOPCE under the current sample and model specification. This finding differs from the conventional absorptive-capacity expectation that internal R&D and prior knowledge strengthen firms’ ability to identify, assimilate, and apply external knowledge [69,72]. One possible explanation lies in the distinction between the broad concept of absorptive capacity and the specific R&D-intensity indicator used in this study. R&D intensity reflects the scale of firms’ knowledge investment, but it does not directly indicate whether their knowledge base is aligned with a particular transferred technology or whether they possess the engineering and organizational capabilities required for its operational application. Moreover, the “not-invented-here” perspective suggests that established R&D teams may sometimes place greater value on internally generated knowledge and show resistance to external technological solutions [44]. Higher R&D intensity may primarily support internally initiated innovation, digital-system development, or the improvement of existing technologies, rather than the assimilation, adaptation, and further development of externally transferred green technologies. It may therefore not consistently strengthen the marginal emissions-reduction effect of GTT.
Technology absorption is also highly dependent on technological type and application context. Green technologies used in ports include shore-power facilities, clean-energy equipment, intelligent scheduling systems, energy-saving retrofits of cargo-handling machinery, and pollution-control processes. These technologies differ substantially in their required knowledge base, equipment interfaces, implementation cycles, and complementary conditions. A high overall level of R&D intensity does not necessarily imply that a firm’s existing knowledge structure is closely aligned with a specific transferred technology. When firms’ R&D activities are concentrated in fields that are only weakly related to the acquired technology, accumulated R&D knowledge may not be readily converted into advantages in technology identification, engineering adaptation, or operational application. Accordingly, the relationship between R&D investment and the emissions-reduction conversion efficiency of external green technologies may not be simple or linear. For port companies characterized by high capital intensity and strong infrastructure dependence, converting transferred technologies from knowledge acquisition into operational emissions reductions requires adjustments to equipment interfaces, engineering design, production-system testing, cross-departmental coordination, employee training, and subsequent maintenance. These processes depend not only on the knowledge stock of the R&D department but also on coordination among production, equipment, energy-management, and safety-management units. Port operations involve continuous production, equipment interdependence, and system coupling. Localized technological retrofits may therefore be constrained by the remaining service life of existing facilities, production schedules, and safety standards, resulting in a considerable implementation cycle. Even when firms maintain relatively high R&D investment, such investment may not generate an observable strengthening effect within a short period. Research on port energy systems and electrification likewise shows that the implementation of cleaner technologies requires coordination among energy systems, equipment operations, and production organization, rather than relying on technological or R&D resources alone [65,66]. The statistically insignificant moderating effect of TAC therefore does not imply that firms’ knowledge foundations and technological learning capabilities are unimportant in the process of green technology transfer. Rather, it indicates that R&D intensity alone is insufficient to consistently alter the emissions-reduction conversion efficiency of GTT. Whether externally acquired green technologies generate stronger environmental benefits also depends on the allocation of R&D resources, the alignment between firms’ existing knowledge and the transferred technologies, and the availability of engineering implementation and organizational integration capabilities.
Taken together, the four moderators exhibit differentiated boundary effects. ENR operates by strengthening emissions-reduction constraints and implementation incentives, RIS supports technology adaptation by providing complementary knowledge, specialized services, and innovation networks, and FIH provides the financial resources required for equipment retrofitting and sustained application. By comparison, the knowledge-investment foundation reflected in R&D intensity does not independently produce a statistically identifiable strengthening effect. These results indicate that the emissions-reduction effectiveness of GTT depends not only on whether port companies acquire external green technologies but also on whether the institutional and innovation environments in which they operate support technology implementation and whether firms possess sufficient resources to bear the costs of complementary retrofitting and sustained application.

5.4. Heterogeneity Across Technology Origins, Regional Contexts, and Digitalization Levels

The heterogeneity analysis further reveals that both AO-GTT and EO-GTT significantly reduce EOPCE, while the difference between their estimated coefficients is not statistically significant. This finding suggests that green technologies originating from both academic institutions and enterprises can serve as effective external sources for port decarbonization, and that the organizational origin of transferred technologies alone does not determine their environmental performance. AO-GTT is generally associated with frontier knowledge and scientific discoveries, which can broaden firms’ access to emerging green solutions but may require further validation, engineering adaptation, and localized development before practical application. EO-GTT, in contrast, is often characterized by stronger links with industrial practices and operational experience, which may facilitate technology deployment in existing production systems. However, regardless of technology origin, transferred technologies must undergo knowledge assimilation, operational integration, and continuous adjustment before generating stable emission-reduction outcomes. Existing studies have also emphasized that the performance of external technology acquisition depends not only on the source of knowledge but also on the compatibility between transferred technologies, absorptive capacity, and application environments [33,64]. Therefore, although the coefficient magnitude of EO-GTT is larger than that of AO-GTT, the current evidence does not support a systematic superiority of one technology source over another. Instead, both academic and enterprise sources constitute important channels for supplying green technologies to support port decarbonization.
The regional heterogeneity analysis shows that GTT significantly reduces EOPCE in the BR, YRD, and PRD subsamples, while the emission-reduction effect in the YRD is significantly stronger than that in the BR. However, the differences between the YRD and PRD and between the PRD and BR are not statistically significant. This result indicates that the effectiveness of GTT is not solely determined by the transferred technology itself, but is also embedded in the regional innovation and industrial environment in which the technology is implemented. The regional innovation system perspective suggests that technology diffusion depends on interactions among innovation actors, specialized intermediaries, industrial networks, and institutional support systems [73,74].
The stronger effect observed in the YRD may be associated with its relatively dense innovation resources, developed industrial supporting systems, and extensive technology collaboration networks. These conditions can facilitate technology evaluation, engineering adaptation, and subsequent improvement after technology transfer. Meanwhile, cooperation and competition among ports within the regional port cluster may further accelerate knowledge diffusion and technology replication. Previous studies have shown that regional innovation resources and environmental governance capacity play important roles in improving the effectiveness of green technology transfer and promoting regional green development [69,75]. In contrast, ports in the BR are more closely connected with traditional energy-intensive and heavy industries, where existing energy structures, cargo compositions, and operational systems may increase the adjustment costs associated with green technology integration. Moreover, the transformation of green technologies is also influenced by complementary conditions such as financing availability, government support, and enterprise investment capacity [1,70]. Therefore, the stronger effect of GTT in the YRD likely reflects the combined influence of innovation networks, industrial support, financial conditions, and regional coordination mechanisms rather than a single determining factor. Meanwhile, the absence of significant differences among other regional pairs indicates that regional advantages should not be interpreted as a simple ranking among all port regions.
The heterogeneous results by digitalization level further show that GTT significantly reduces EOPCE in both L-DIG and H-DIG groups, while the coefficient magnitude is larger in the H-DIG group and the difference between the two groups is significant at the 10% level. This finding indicates that digitalization may enhance the effectiveness of green technology transfer by improving technology integration and operational coordination. Digital capabilities can strengthen firms’ ability to identify, process, and utilize external technological knowledge, thereby facilitating the transformation of transferred technologies into practical environmental benefits [25]. For port enterprises, digital platforms, equipment connectivity, real-time monitoring, intelligent scheduling, and energy management systems provide essential support for integrating green technologies into cargo-handling operations and energy-consumption processes. As emphasized in recent port decarbonization research, equipment upgrading, digital management, and energy-system optimization need to function as complementary technological components to achieve substantial emission reductions [62,65]. Therefore, the significant effect of GTT in the L-DIG group suggests that digitalization is not a prerequisite for green technology transfer to generate emission reductions, whereas the stronger effect observed in the H-DIG group indicates that digital foundations may improve the efficiency of technology deployment and operational adaptation. Given that the difference between groups is only weakly significant, this result should be interpreted as suggestive evidence that digitalization strengthens the environmental benefits of GTT.
The insignificant differences among some groups and the magnitude of the estimated effects should also be interpreted in light of the characteristics of the research sample. This study focuses on 19 listed port companies in China. Although the multi-year panel provides sufficient temporal observations for the main estimations, further subgroup classification reduces the number of firms within each category and may weaken the statistical power of the coefficient-difference tests. At the same time, listed port companies are more likely than smaller or non-listed operators to have relatively standardized governance and disclosure practices, broader financing channels, stronger technical staffing, and greater capacity for equipment renewal and system integration. These conditions may facilitate the conversion of formally acquired green technologies into operational emissions reductions and may also reduce variation in implementation capacity among the sampled firms. Consequently, the estimated effects should not be interpreted as the average effect for the entire Chinese port industry. For smaller or non-listed ports, the effectiveness of GTT may depend more strongly on financing capacity, digital infrastructure, technical personnel, equipment compatibility, supporting facilities, and local regulatory conditions. The applicability of the findings to such ports, as well as to ports in developing countries with different institutional and infrastructure conditions, should therefore be assessed cautiously. For ports in developing economies participating in the Belt and Road Initiative, additional differences in regulatory enforcement, access to green finance, electricity and digital infrastructure, availability of specialized technical services, local innovation and supplier networks, and compatibility between transferred technologies and existing equipment systems may further condition the effectiveness of GTT. The carbon intensity and reliability of local energy supply may also influence whether electrification and other transferred low-carbon technologies translate into comparable reductions in operational emissions.
Overall, the heterogeneous analysis demonstrates that the emission-reduction effect of GTT is broadly robust across different technology sources, regional contexts, and digitalization conditions, although the magnitude of the effect is not completely uniform. The absence of significant differences between AO-GTT and EO-GTT indicates that both academic and enterprise sources can provide effective green technology support. The regional results highlight the importance of innovation ecosystems, industrial structures, financial conditions, and regional coordination in shaping technology implementation outcomes, particularly reflected in the stronger effect observed in the YRD compared with the BR. The digitalization results further suggest that digital infrastructure and operational intelligence can facilitate the integration of external green technologies into port production systems. Therefore, understanding the environmental value of GTT requires not only examining whether technology transfer occurs but also considering how transferred technologies interact with regional innovation environments and digital operational foundations.

6. Conclusions, Policy Implications, Limitations, and Future Research

6.1. Conclusions

Based on the panel data of 19 listed Chinese port companies from 2011 to 2024, this paper explores the impact mechanism of GTT on EOPCE at both theoretical and empirical levels. The results show that (1) GTT significantly reduces EOPCE, and this finding remains robust across a series of robustness and endogeneity tests. (2) Mediation analysis indicates that GTT reduces EOPCE by promoting a cleaner ECS and technological progress. (3) Moderation analysis shows that ENR, RIS, and FIH significantly strengthen the negative effect of GTT on EOPCE, while no statistically significant moderating effect of TAC is identified under the current sample and proxy measure. (4) Heterogeneity analysis reveals that the effect of GTT on EOPCE varies across port regions and digitalization levels.

6.2. Policy Implications

The results show that GTT reduces EOPCE by promoting a cleaner ECS and advancing TEP. Accordingly, the operational decarbonization of port companies should coordinate energy-structure adjustment with technological upgrading rather than relying on a single transmission channel. Intelligent energy-management systems can be applied to improve the monitoring, allocation, and precise scheduling of operational energy, while the electrification and energy-efficiency upgrading of cargo-handling and internal transportation equipment should be further promoted. Where technically and economically feasible, port companies should expand the use of lower-carbon and renewable energy sources in operational activities, including electricity, natural gas, hydrogen, wind, and solar power, to reduce dependence on conventional high-carbon fuels. Meanwhile, greater attention should be paid to converting externally acquired technologies into improvements in production processes and technological frontiers. Dedicated funds for green-port technological transformation can support pilot testing, equipment-interface adjustment, system integration, and the localized redevelopment of transferred technologies. Cooperation platforms involving port companies, universities, research institutions, equipment suppliers, and technical-service providers should also be strengthened to facilitate joint development and engineering application. In addition, professional training and interdisciplinary talent development should be promoted to support the operational integration and continuous upgrading of green technologies.
The moderating-effect results show that ENR, RIS, and FIH significantly strengthen the negative effect of GTT on EOPCE, whereas no statistically significant moderating effect of TAC is identified under the current sample and R&D-intensity-based proxy measure. Port-specific environmental regulation should therefore be made more targeted, operationally relevant, and closely connected with technology implementation. Regulatory requirements concerning operational energy use, equipment emissions, clean-energy substitution, equipment upgrading, and production-process optimization should be clearly defined and coordinated with corresponding technical standards, implementation schedules, and supervision mechanisms. Regional innovation systems should be improved by strengthening cooperation among ports, universities, research institutions, equipment manufacturers, and specialized technical-service organizations, thereby reducing the costs of technology search, matching, adaptation, and subsequent redevelopment. Financial support should also be expanded through green bonds, carbon-neutral loans, performance-linked credit, and other instruments to help port companies meet the capital requirements of equipment retrofitting, infrastructure connection, system testing, and long-term maintenance. Although no statistically significant moderating effect is identified for the R&D-intensity-based TAC measure, ports should not focus solely on increasing R&D intensity. Greater emphasis should instead be placed on aligning R&D resources with the technical requirements of transferred technologies and strengthening engineering adaptation, cross-departmental coordination, employee training, and operational integration.
The heterogeneity analysis shows that both AO-GTT and EO-GTT significantly reduce EOPCE, while the difference between their estimated effects is not statistically significant. Port companies should therefore avoid adopting a uniform preference for technologies from a particular organizational source and instead establish diversified technology-acquisition channels. Academic-origin technologies can provide access to frontier knowledge and emerging green solutions, but their implementation may require additional validation, pilot testing, engineering development, and localized adaptation. Enterprise-origin technologies may be more closely connected with industrial practice and existing operational systems, but their effectiveness likewise depends on compatibility, organizational absorption, and sustained application. Technology-selection decisions should therefore consider technological maturity, application readiness, equipment compatibility, implementation costs, and expected environmental performance rather than organizational origin alone. Regional results further indicate that the emissions-reduction effect of GTT is significantly stronger in the YRD than in the BR, whereas no statistically robust differences are identified between the YRD and PRD or between the PRD and BR. Policy design should consequently avoid mechanically replicating a single regional model. The YRD can promote cross-regional knowledge sharing and technical cooperation, while ports in the BR and other regions with relatively high retrofit costs should receive greater support in complementary financing, specialized technical services, equipment upgrading, and infrastructure adaptation. For smaller or resource-constrained ports, shared technology-service platforms, professional training, and differentiated financial support can help improve the conditions required to convert external green technologies into sustained operational emissions reductions. The digitalization results further suggest that port companies should strengthen equipment connectivity, real-time monitoring, intelligent scheduling, and digital energy-management systems to improve the integration and operational application of transferred green technologies. For ports with relatively weak digital foundations, policy support should prioritize interoperable data platforms, equipment-interface upgrading, and shared digital technology services rather than pursuing isolated digital investments.

6.3. Limitations and Future Research

First, the accounting boundary of EOPCE remains constrained by the availability and comparability of source-specific emissions data. This study primarily measures energy-related carbon emissions generated by listed port companies through cargo handling, storage, internal transportation, equipment operation, and related operational activities. Emissions from berthed vessels and hinterland collection and distribution transport are not incorporated into the same accounting framework because continuous AIS data, vessel–terminal–company mappings, and landside transport activity data cannot be consistently obtained at the firm level over the study period. Since container ports, bulk-cargo ports, and comprehensive ports differ in cargo composition, vessel-call intensity, equipment configuration, and transport organization, the scale and composition of the omitted emissions may also vary systematically across companies. EOPCE should therefore be interpreted as operational emissions within the accounting boundary adopted in this study rather than the complete carbon footprint of the broader port–shipping–hinterland system. The emissions-reduction effect identified here consequently pertains primarily to energy use, equipment operation, internal transportation, and related production activities within port-company operations, while the effects of GTT on emissions from berthed vessels and hinterland transportation remain to be further examined. Future research could integrate AIS vessel trajectories, terminal operation records, firm-level energy inventories, port-area vehicle activity, and hinterland freight data to separately estimate emissions from port operations, berthed vessels, and collection and distribution transport. Such a multisource framework would make it possible to examine whether GTT produces differentiated or complementary effects across emission sources and to assess the coordination of operational, vessel-side, and landside decarbonization measures.
Second, the measurement of GTT and related implementation conditions can be further refined. The number of green patent transfers provides an objective indicator of how frequently port companies formally acquire external green technologies, but it cannot fully capture the quality, maturity, transaction depth, or subsequent application of the transferred technologies. Patents may differ considerably in technological value, claim scope, engineering-adaptation requirements, and application readiness, while a legally recorded transfer does not necessarily imply that the technology has been fully absorbed, integrated, and continuously applied in port operations. Although green invention patent transfers are used as an alternative measure, this approach still cannot directly identify the intensity of post-transfer implementation. Future studies could construct quality-adjusted GTT indicators by incorporating forward patent citations, patent-family size, claim breadth, maintenance duration, transaction value, and technology-readiness information. Such extensions would make it possible to distinguish the transfer-frequency dimension identified in this study from the quality and maturity dimensions of GTT and to compare their respective emissions-reduction effects. Technology contracts, equipment investment, project implementation, and recipient-side follow-on innovation data could also be used to distinguish technology acquisition, adaptation, integration, and application.
The measurement of TAC is subject to a related limitation. R&D intensity reflects the foundation of firms’ knowledge investment, but it cannot fully capture multidimensional capabilities involving technology identification, engineering adaptation, system integration, cross-departmental coordination, and continuous operation and maintenance. For port companies characterized by high capital intensity, strong equipment interdependence, and strict safety requirements, the conversion of GTT into operational outcomes also depends on equipment compatibility, specialized personnel, employee training, and organizational coordination. Future research could combine firm surveys, technological cooperation experience, project-level adaptation records, personnel structures, and equipment-integration performance to develop a multidimensional measure of TAC. In addition, technological adaptation and production-frontier improvement may involve time lags. Longer lag structures or project-level implementation timelines could therefore be used to distinguish short-term operational adjustment from medium- and long-term technological upgrading.
Third, the sample composition limits the external applicability of the findings. This study focuses on 19 listed port companies in China, whose financial, technological, and operational data are relatively continuous and standardized. However, listed port companies generally have more developed governance structures, broader financing channels, stronger technical staffing, and greater capacity for equipment renewal and system integration. These conditions facilitate the adaptation and application of transferred technologies, implying that the estimated emissions-reduction effect may not be directly generalizable to small, medium-sized, or non-listed ports facing tighter financing constraints, weaker digital foundations, shortages of specialized personnel, or inadequate supporting facilities. Subgroup analyses also reduce the number of firms within each category and may weaken the statistical power of some coefficient-difference tests. Moreover, because national port-sector emissions and firm-level EOPCE are not reported under consistent organizational and accounting boundaries, the share of total port-sector emissions represented by the sample cannot be accurately quantified. The findings should therefore be interpreted primarily within the operational context of listed Chinese port companies. Future research could extend the sample to non-listed port operators, individual terminals, local port groups, and small and medium-sized ports by combining administrative records, firm surveys, terminal-level energy data, and local environmental disclosures. Cross-country extensions could further incorporate ports in developing economies participating in the Belt and Road Initiative under harmonized definitions of GTT and operational emissions. Comparative analyses could then examine whether the GTT–EOPCE relationship varies systematically with ownership structure, financing access, regulatory enforcement, digital and energy infrastructure, specialized technical capacity, equipment compatibility, and the strength of local innovation and technology-service networks. Such a design would allow the external validity of the current findings to be tested directly rather than inferred from the listed Chinese port-company sample.
Finally, causal identification remains constrained by the observational panel data and the limited cross-sectional sample. This study applies fixed-effects estimation, expanded control variables, IV–2SLS, lagged specifications, a lead-variable placebo test, LSDVC, and system GMM. Nevertheless, emissions pressure, incentives to acquire technology, and existing emissions levels may still interact bidirectionally and vary over time. The relatively small number of cross-sectional units may also make dynamic panel estimates sensitive to finite-sample properties and instrument specification. Future research could exploit exogenous shocks such as green-port pilot programs, changes in environmental regulation, green-credit reforms, and technology-subsidy policies, and apply difference-in-differences, event-study, and distributed-lag models to identify more clearly the temporal sequence linking technology acquisition, adaptation, technological progress, and emissions reduction. Additional data on local subsidies, green finance, corporate governance, technology-service networks, port competition, and knowledge spillovers would also support a more precise assessment of the implementation stages, organizational conditions, and regional environments under which GTT generates environmental benefits.

Author Contributions

Conceptualization, C.L.; methodology, C.L.; software, C.L.; validation, C.L., M.Z., and X.Y.; formal analysis, C.L.; investigation, C.L.; resources, C.L.; data curation, C.L.; writing—original draft preparation, C.L.; writing—review and editing, C.L.; visualization, C.L.; supervision, J.W.; project administration, J.W.; funding acquisition, J.W. All authors have read and agreed to the published version of the manuscript.

Funding

This research was funded by the National Natural Science Foundation of China (Grant No. 72171122).

Institutional Review Board Statement

Not applicable.

Informed Consent Statement

Not applicable.

Data Availability Statement

The data presented in this study are available on request from the corresponding author due to licensing restrictions associated with the commercial databases used to construct part of the dataset.

Conflicts of Interest

The authors declare no conflicts of interest.

References

  1. Li, M.; Luan, J.; Li, X.; Jia, P. An analysis of the impact of government subsidies on emission reduction technology investment strategies in low-carbon port operations. Systems 2024, 12, 134. [Google Scholar] [CrossRef] [Scilit]
  2. Alamoush, A.S.; Olcer, A.I.; Ballini, F. Port greenhouse gas emission reduction: Port and public authorities’ implementation schemes. Res. Transp. Bus. Manag. 2022, 43, 100708. [Google Scholar] [CrossRef] [Scilit]
  3. Fan, S.; Lu, Z. Research on the Peak Carbon Dioxide Emission Strategy of Chinese Port Based on Carbon Emission Estimation. Front. Environ. Sci. 2022, 9, 789970. [Google Scholar] [CrossRef] [Scilit]
  4. Wu, R.; Su, S.; Hou, J.; Wang, X. Digital economy, green technology innovation and urban carbon emissions: Evidence from Chinese cities. Systems 2026, 14, 291. [Google Scholar] [CrossRef] [Scilit]
  5. Ali, F.; Ali, A.; Haotian, D.; Ali, I. From boardrooms to greenrooms: Directors’ environmental background and green innovation. J. Innov. Knowl. 2026, 13, 100928. [Google Scholar] [CrossRef] [Scilit]
  6. Gu, G.; Wang, Z.; Wu, L. Carbon emission reductions under global low-carbon technology transfer and its policy mix with R&D improvement. Energy 2021, 216, 119300. [Google Scholar] [CrossRef] [Scilit]
  7. Oh, C.; Matsuoka, S. Complementary approaches to discursive contestation on the effects of the IPR regime on technology transfer in the face of climate change. J. Clean. Prod. 2016, 128, 168–177. [Google Scholar] [CrossRef] [Scilit]
  8. Barata, R.; Cruz, M.M.; Pascale, A.; Macedo, J.; Coelho, M.C. Decarbonizing small-medium ports in Portugal’s center region: A mobility plan for a 2050 emissions reduction roadmap. Int. J. Sustain. Transp. 2026, 20, 854–872. [Google Scholar] [CrossRef] [Scilit]
  9. Liu, C.; Zhao, M.; Yan, X.; Wu, J. The impact mechanism of environmental regulation and sustainable finance on green development of China’s A-share listed port enterprises. Int. J. Sustain. Transp. 2026, 20, 718–738. [Google Scholar] [CrossRef] [Scilit]
  10. Wang, L.; Peng, C.; Shi, W.; Zhu, M. Carbon dioxide emissions from port container distribution: Spatial characteristics and driving factors. Transp. Res. Part D Transp. Environ. 2020, 82, 102318. [Google Scholar] [CrossRef] [Scilit]
  11. Wang, T.; Wu, Z.; Cheng, P.; Wang, Y. The effect of carbon quota allocation methods on maritime supply chain emission reduction. Transp. Policy 2024, 157, 155–166. [Google Scholar] [CrossRef] [Scilit]
  12. Yang, D.; Wu, L.; Wang, S.; Jia, H.; Li, K.X. How big data enriches maritime research: A critical review of Automatic Identification System (AIS) data applications. Transp. Rev. 2019, 39, 755–773. [Google Scholar] [CrossRef] [Scilit]
  13. Tichavska, M.; Tovar, B.; Gritsenko, D.; Johansson, L.; Jalkanen, J.P. Air emissions from ships in port: Does regulation make a difference? Transp. Policy 2019, 75, 128–140. [Google Scholar] [CrossRef] [Scilit]
  14. Wang, L.; Li, Y. Estimation methods and reduction strategies of port carbon emissions: What literatures say? Mar. Pollut. Bull. 2023, 195, 115451. [Google Scholar] [CrossRef] [Scilit]
  15. Zhang, L.; Zeng, Q.; Wang, L. How to achieve comprehensive carbon emission reduction in ports? A systematic review. J. Mar. Sci. Eng. 2024, 12, 715. [Google Scholar] [CrossRef] [Scilit]
  16. Lattila, L.; Henttu, V.; Hilmola, O.P. Hinterland operations of sea ports do matter: Dry port usage effects on transportation costs and CO2 emissions. Transp. Res. Part E Logist. Transp. Rev. 2013, 55, 23–42. [Google Scholar] [CrossRef] [Scilit]
  17. Zeng, Y.; Yuan, X.; Hou, B. Analysis of carbon emission reduction at the port of integrated logistics: The port of Shanghai case study. Sustainability 2023, 15, 10914. [Google Scholar] [CrossRef] [Scilit]
  18. Wan, Z.; Nie, A.; Chen, J.; Pang, C.; Zhou, Y. Transforming ports for a low-carbon future: Innovations, challenges, and opportunities. Ocean Coast. Manag. 2025, 264, 107636. [Google Scholar] [CrossRef] [Scilit]
  19. Sifakis, N.; Konidakis, S.; Tsoutsos, T. Hybrid renewable energy system optimum design and smart dispatch for nearly zero energy ports. J. Clean. Prod. 2021, 310, 127397. [Google Scholar] [CrossRef] [Scilit]
  20. Song, J.; Xu, C.; Wang, C. Impacts of the carbon tax on green shipping supply chain under the port competition. Expert Syst. 2024, 41, e13229. [Google Scholar] [CrossRef] [Scilit]
  21. Mao, Z.; Ma, A.; Zhang, Z. Towards carbon neutrality in shipping: Impact of European Union’s emissions trading system for shipping and China’s response. Ocean Coast. Manag. 2024, 249, 107006. [Google Scholar] [CrossRef] [Scilit]
  22. Wiebe, K.S. Identifying emission hotspots for low carbon technology transfers. J. Clean. Prod. 2018, 194, 243–252. [Google Scholar] [CrossRef] [Scilit]
  23. Zhang, Y.; Wang, J.; Deng, H.; Zhang, D.; Wang, Y. Developing a multidimensional assessment framework for clean technology transfer potential and its application on the Belt and Road Initiative countries. J. Clean. Prod. 2023, 401, 136769. [Google Scholar] [CrossRef] [Scilit]
  24. Fusillo, F.; Quatraro, F.; Usai, S. Going green: The dynamics of green technological alliances. Econ. Innov. New Technol. 2022, 31, 362–386. [Google Scholar] [CrossRef] [Scilit]
  25. Zhu, X.; Chen, H.; Xiang, E.; Qi, Y. Digital transformation and corporate green technology transfer: The moderating effect of executive green cognition. Financ. Res. Lett. 2025, 76, 107035. [Google Scholar] [CrossRef] [Scilit]
  26. Hena, S.; Khan, S.U.; Cui, B.; Khan, S.; Zhang, D.; Cheng, Z. Synergistic effects of technology and native aptitude in the perspective of industrial transfer for sustainable development in emerging economies. Environ. Dev. Sustain. 2023, 25, 14927–14951. [Google Scholar] [CrossRef] [Scilit]
  27. Popp, D. International technology transfer, climate change, and the Clean Development Mechanism. Rev. Environ. Econ. Policy 2011, 5, 131–152. [Google Scholar] [CrossRef] [Scilit]
  28. Dechezleprêtre, A.; Glachant, M.; Haščič, I.; Johnstone, N.; Ménière, Y. Invention and transfer of climate change–mitigation technologies: A global analysis. Rev. Environ. Econ. Policy 2011, 5, 109–130. [Google Scholar] [CrossRef] [Scilit]
  29. Verdolini, E.; Galeotti, M. At home and abroad: An empirical analysis of innovation and diffusion in energy technologies. J. Environ. Econ. Manag. 2011, 61, 119–134. [Google Scholar] [CrossRef] [Scilit]
  30. Serrano, C.J. The dynamics of the transfer and renewal of patents. RAND J. Econ. 2010, 41, 686–708. [Google Scholar] [CrossRef] [Scilit]
  31. De Marco, A.; Scellato, G.; Ughetto, E.; Caviggioli, F. Global markets for technology: Evidence from patent transactions. Res. Policy 2017, 46, 1644–1654. [Google Scholar] [CrossRef] [Scilit]
  32. Graham, S.J.H.; Marco, A.C.; Myers, A.F. Patent transactions in the marketplace: Lessons from the USPTO Patent Assignment Dataset. J. Econ. Manag. Strategy 2018, 27, 343–371. [Google Scholar] [CrossRef] [Scilit]
  33. Ockwell, D.G.; Watson, J.; MacKerron, G.; Pal, P.; Yamin, F. Key policy considerations for facilitating low carbon technology transfer to developing countries. Energy Policy 2008, 36, 4104–4115. [Google Scholar] [CrossRef] [Scilit]
  34. Mohsin, M.; Taghizadeh-Hesary, F.; Iqbal, N.; Saydaliev, H.B. The role of technological progress and renewable energy deployment in green economic growth. Renew. Energy 2022, 190, 777–787. [Google Scholar] [CrossRef] [Scilit]
  35. Karakosta, C.; Doukas, H.; Psarras, J. Technology transfer through climate change: Setting a sustainable energy pattern. Renew. Sustain. Energy Rev. 2010, 14, 1546–1557. [Google Scholar] [CrossRef] [Scilit]
  36. Khan, Y.; Hassan, T.; Tufail, M.; Marie, M.; Imran, M.; Xiuqin, Z. The nexus between CO2 emissions, human capital, technology transfer, and renewable energy: Evidence from Belt and Road countries. Environ. Sci. Pollut. Res. 2022, 29, 59816–59834. [Google Scholar] [CrossRef] [Scilit]
  37. Watson, J.; Byrne, R.; Ockwell, D.; Stua, M. Lessons from China: Building technological capabilities for low carbon technology transfer and development. Clim. Change 2015, 131, 387–399. [Google Scholar] [CrossRef] [Scilit]
  38. Worrell, E.; Van Berkel, R.; Fengqi, Z.; Menke, C.; Schaeffer, R.; Williams, R.O. Technology transfer of energy efficient technologies in industry: A review of trends and policy issues. Energy Policy 2001, 29, 29–43. [Google Scholar] [CrossRef] [Scilit]
  39. Lam, J.S.L.; Notteboom, T. The greening of ports: A comparison of port management tools used by leading ports in Asia and Europe. Transp. Rev. 2014, 34, 169–189. [Google Scholar] [CrossRef] [Scilit]
  40. Acciaro, M.; Vanelslander, T.; Sys, C.; Ferrari, C.; Roumboutsos, A.; Giuliano, G.; Lam, J.S.L.; Kapros, S. Environmental sustainability in seaports: A framework for successful innovation. Marit. Policy Manag. 2014, 41, 480–500. [Google Scholar] [CrossRef] [Scilit]
  41. Bozeman, B. Technology transfer and public policy: A review of research and theory. Res. Policy 2000, 29, 627–655. [Google Scholar] [CrossRef] [Scilit]
  42. Gillingham, K.; Rapson, D.; Wagner, G. The rebound effect and energy efficiency policy. Rev. Environ. Econ. Policy 2016, 10, 68–88. [Google Scholar] [CrossRef] [Scilit]
  43. Lanoie, P.; Laurent-Lucchetti, J.; Johnstone, N.; Ambec, S. Environmental policy, innovation and performance: New insights on the Porter Hypothesis. J. Econ. Manag. Strategy 2011, 20, 803–842. [Google Scholar] [CrossRef] [Scilit]
  44. Katz, R.; Allen, T.J. Investigating the Not Invented Here (NIH) syndrome: A look at the performance, tenure, and communication patterns of 50 R&D project groups. R&D Manag. 1982, 12, 7–20. [Google Scholar] [CrossRef] [Scilit]
  45. Martinez-Moya, J.; Vazquez-Paja, B.; Maldonado, J.A.G. Energy efficiency and CO2 emissions of port container terminal equipment: Evidence from the Port of Valencia. Energy Policy 2019, 131, 312–319. [Google Scholar] [CrossRef] [Scilit]
  46. Zhang, Z.; Rong, W.; Liu, Y.; Yang, Y. Port carbon emission estimation: Principles, practices, and machine learning applications. Transp. Res. Part E Logist. Transp. Rev. 2025, 199, 104159. [Google Scholar] [CrossRef] [Scilit]
  47. Yu, Y.; Sun, R.; Sun, Y.; Shu, Y. Integrated carbon emission estimation method and energy conservation analysis: The Port of Los Angeles case study. J. Mar. Sci. Eng. 2022, 10, 717. [Google Scholar] [CrossRef] [Scilit]
  48. Freitas, D.; Gervasio, H. The challenge of benchmarking carbon emissions in maritime ports. Environ. Pollut. 2024, 363, 125170. [Google Scholar] [CrossRef] [Scilit]
  49. Jiao, J.; Chen, C.; Bai, Y. Is green technology vertical spillovers more significant in mitigating carbon intensity? Evidence from Chinese industries. J. Clean. Prod. 2020, 257, 120354. [Google Scholar] [CrossRef] [Scilit]
  50. Fitjar, R.D.; Rodriguez-Pose, A. Firm collaboration and modes of innovation in Norway. Res. Policy 2013, 42, 128–138. [Google Scholar] [CrossRef] [Scilit]
  51. Wang, Q.; Yang, T.; Li, R. Economic complexity and ecological footprint: The role of energy structure, industrial structure, and labor force. J. Clean. Prod. 2023, 412, 137389. [Google Scholar] [CrossRef] [Scilit]
  52. Pastor, J.T.; Lovell, C.A.K. A global Malmquist productivity index. Econ. Lett. 2005, 88, 266–271. [Google Scholar] [CrossRef] [Scilit]
  53. Sun, J.; Yuan, Y.; Yang, R.; Ji, X.; Wu, J. Performance evaluation of Chinese port enterprises under significant environmental concerns: An extended DEA-based analysis. Transp. Policy 2017, 60, 75–86. [Google Scholar] [CrossRef] [Scilit]
  54. Xiong, L.; Long, H.; Zhang, X.; Yu, C.; Wen, Z. Can environmental information disclosure reduce air pollution? Evidence from China. Front. Environ. Sci. 2023, 11, 1126565. [Google Scholar] [CrossRef] [Scilit]
  55. Wei, L.; Lin, B.; Zheng, Z.; Wu, W.; Zhou, Y. Does fiscal expenditure promote green technological innovation in China? Evidence from Chinese cities. Environ. Impact Assess. Rev. 2023, 98, 106945. [Google Scholar] [CrossRef] [Scilit]
  56. Zhai, H.; Yang, Y.; Ding, H.; Zhou, Y. Research on the Configuration Path of Regional Green Innovation in Space and Time: Dynamic QCA Analysis Based on Provincial Panel Data. Sustainability 2025, 17, 1871. [Google Scholar] [CrossRef] [Scilit]
  57. Awwad, M.S.; Abuhommous, A.A.A.; Adaileh, A.M. Unravelling the relationship between absorptive capacity, innovation, and financial performance: A longitudinal study. Int. J. Innov. Stud. 2025, 9, 116–128. [Google Scholar] [CrossRef] [Scilit]
  58. Hong, S.J.; Farris, M.T., II; Pohlen, T.L.; Idug, Y. Exploring the impact of working capital in the US aviation industry for profitability and shareholder value. Transp. Policy 2023, 144, 90–101. [Google Scholar] [CrossRef] [Scilit]
  59. Altman, E.I. Financial ratios, discriminant analysis and the prediction of corporate bankruptcy. J. Financ. 1968, 23, 589–609. [Google Scholar] [CrossRef]
  60. Zhou, S.; Peng, F. The impact of technology transfer on the green innovation efficiency of Chinese high-tech industry. Front. Sociol. 2023, 8, 1141616. [Google Scholar] [CrossRef] [Scilit]
  61. Ockwell, D.; Byrne, R. Improving technology transfer through national systems of innovation: Climate relevant innovation-system builders (CRIBs). Clim. Policy 2016, 16, 836–854. [Google Scholar] [CrossRef] [Scilit]
  62. Song, D.P. A literature review of seaport decarbonisation: Solution measures and roadmap to net zero. Sustainability 2024, 16, 1620. [Google Scholar] [CrossRef] [Scilit]
  63. Lema, A.; Lema, R. Low-carbon innovation and technology transfer in latecomer countries: Insights from solar PV in the clean development mechanism. Technol. Forecast. Soc. Change 2016, 104, 223–236. [Google Scholar] [CrossRef] [Scilit]
  64. Li, X. Sources of external technology, absorptive capacity, and innovation capability in Chinese state-owned high-tech enterprises. World Dev. 2011, 39, 1240–1248. [Google Scholar] [CrossRef] [Scilit]
  65. Iris, Ç.; Lam, J.S.L. A review of energy efficiency in ports: Operational strategies, technologies and energy management systems. Renew. Sustain. Energy Rev. 2019, 112, 170–182. [Google Scholar] [CrossRef] [Scilit]
  66. Abu Bakar, N.N.; Bazmohammadi, N.; Vasquez, J.C.; Guerrero, J.M. Electrification of onshore power systems in maritime transportation towards decarbonization of ports: A review of the cold ironing technology. Renew. Sustain. Energy Rev. 2023, 178, 113243. [Google Scholar] [CrossRef] [Scilit]
  67. Wurlod, J.-D.; Noailly, J. The impact of green innovation on energy intensity: An empirical analysis for 14 industrial sectors in OECD countries. Energy Econ. 2018, 71, 47–61. [Google Scholar] [CrossRef] [Scilit]
  68. Brown, J.R.; Martinsson, G.; Thomann, C. Can environmental policy encourage technical change? Emissions taxes and R&D investment in polluting firms. Rev. Financ. Stud. 2022, 35, 4518–4560. [Google Scholar] [CrossRef] [Scilit]
  69. Audretsch, D.B.; Belitski, M. The knowledge spillover of innovation. Ind. Corp. Change 2022, 31, 1329–1357. [Google Scholar] [CrossRef] [Scilit]
  70. Xu, Q.; Kim, T. Financial constraints and corporate environmental policies. Rev. Financ. Stud. 2022, 35, 576–635. [Google Scholar] [CrossRef] [Scilit]
  71. Flammer, C. Corporate green bonds. J. Financ. Econ. 2021, 142, 499–516. [Google Scholar] [CrossRef] [Scilit]
  72. Cohen, W.M.; Levinthal, D.A. Absorptive capacity: A new perspective on learning and innovation. Adm. Sci. Q. 1990, 35, 128–152. [Google Scholar] [CrossRef] [Scilit]
  73. Palm, A. Innovation systems for technology diffusion: An analytical framework and two case studies. Technol. Forecast. Soc. Change 2022, 182, 121821. [Google Scholar] [CrossRef] [Scilit]
  74. Cooke, P. Regional innovation systems: Development opportunities from the ‘green turn’. Technol. Anal. Strateg. Manag. 2010, 22, 831–844. [Google Scholar] [CrossRef] [Scilit]
  75. Shang, Y.M.; Mi, Z.F.; Zhou, C.; Lin, L. Impact of intercity low-carbon technology transfer on carbon emission reduction in China: Based on the “dichotomy” of knowledge learning and technology learning. Resour. Sci. 2023, 45, 827–842. [Google Scholar] [CrossRef] [Scilit]
Figure 1. Theoretical framework of GTT reducing EOPCE.
Systems 14 01108 g001
Table 1. Definition of variables.
Variable TypeVariable NameVariable SymbolMeasurement Method
Dependent variableEnergy-related operational port carbon emissionsEOPCECalculated from Equation (4)
Explanatory variableGreen technology transferGTTAnnual number of green patent transfer events received by each listed port company
Mediating variablesEnergy consumption structureECSThe sum of the natural gas and electricity consumption/total energy consumption of ports
Technological progressTEPLogarithm of TECHCH from Global DEA–Malmquist index
Moderating variablesEnvironmental regulationENRCalculated from port-specific regulatory text frequency
Regional innovation supportRISScience and technology investment/general fiscal budget expenditure
Technology absorptive capacityTACPort annual R&D expenditures/operating revenues
Financial healthFIHCalculated from Equation (5)
Control variablesEconomic developmentECOGDP per capita
Foreign investment intensityFDIActual foreign investment in the year/GDP
Port scaleSCAThe number of port berths
Port digital developmentDIGPort informatization investment
R&D personnel ratioRDPThe number of R&D personnel/total number of employees
Operating cash flowOCFNet cash flow from operating activities/total assets
Capital intensityCAPNet fixed assets/total assets
Table 2. Descriptive statistics.
VariablesObsMeanSDMinimumMaximum
EOPCE2663.4761.3370.9586.847
GTT2660.9181.1760.0006.000
ECS2660.2870.1080.0610.579
TEP2660.0250.087−0.2480.291
ENR2660.5090.4610.0002.672
RIS2660.0320.0140.0080.070
TAC2660.0270.0180.0010.082
FIH2662.9140.8031.0274.915
ECO26613.6182.4628.92121.714
FDI2660.0220.0160.0020.079
SCA26661.84226.73112.000142.000
DIG2661.7651.1180.1035.602
RDP2660.0770.0420.0030.228
OCF2660.0610.047−0.0730.196
CAP2660.4610.1530.1060.812
Table 3. Benchmark regression results.
Variables(1)(2)(3)(4)(5)(6)(7)
GTT−0.294 *** (−3.251)−0.288 ***
(−3.196)
−0.277 ***
(−3.050)
−0.265 ***
(−2.983)
−0.259 ***
(−2.934)
−0.253 ***
(−2.861)
−0.247 ***
(−2.794)
ECO−0.087 *** (−4.963)−0.085 ***
(−4.911)
−0.082 ***
(−4.842)
−0.079 ***
(−4.723)
−0.078 ***
(−4.681)
−0.076 ***
(−4.523)
−0.075 ***
(−4.421)
FDI −0.014
(−1.021)
−0.013
(−0.952)
−0.012
(−0.917)
−0.012
(−0.893)
−0.011
(−0.851)
−0.011
(−0.826)
SCA 0.008
(0.762)
0.007
(0.693)
0.007
(0.671)
0.006
(0.612)
0.006
(0.579)
DIG −0.129 ***
(−3.115)
−0.126 ***
(−3.071)
−0.122 ***
(−2.987)
−0.119 ***
(−2.936)
RDP −0.518 *
(−1.756)
−0.546 *
(−1.794)
−0.583 *
(−1.842)
OCF −0.598 **
(−2.014)
−0.641 **
(−2.087)
CAP 0.317 **
(2.046)
C3.112 ***
(6.091)
2.985 ***
(5.724)
2.901 ***
(5.616)
2.845 ***
(5.487)
2.818 ***
(5.402)
2.783 ***
(5.278)
2.756 ***
(5.184)
Firm FEYesYesYesYesYesYesYes
Year FEYesYesYesYesYesYesYes
Obs266266266266266266266
Adj. R20.5630.5710.5820.5890.5990.6100.619
Note: *, **, and *** denote significance at the 10%, 5%, and 1% levels, respectively.
Table 4. Robustness test results.
(1)(2)(3)(4)
GTT−0.236 ***
(−3.781)
−0.297 **
(−2.432)
−0.216 **
(−2.257)
−0.243 ***
(−3.074)
CVYesYesYesYes
Firm FEYesYesYesYes
Year FEYesYesYesYes
AR(1) corr.NoNoNoYes
PCSENoNoNoYes
Obs266266171266
Adj. R20.6230.6110.5930.608
Note: ** and *** denote significance at the 5% and 1% levels, respectively.
Table 5. Endogeneity test results.
(1)(2)(3)(4)(5)(6)
PGTE0.631 ***
(4.061)
GTT −0.275 **
(−2.351)
−0.233 ***
(−2.806)
−0.249 ***
(−2.957)
L.GTT −0.208 **
(−2.276)
F.GTT −0.029
(−0.475)
L.EOPCE 0.472 ***
(5.094)
0.499 ***
(4.603)
CVYesYesYesYesYesYes
Firm FEYesYesYesYesYesYes
Year FEYesYesYesYesYesYes
Obs247247247247247247
Adj. R20.4210.5830.6120.605
KP rk LM 14.962
KP rk Wald F16.578
AR(1) 0.005
AR(2) 0.302
Hansen test 0.467
Note: ** and *** denote significance at the 5% and 1% levels, respectively.
Table 6. Mediation analysis results.
(1)(2)(3)(4)
ECSEOPCETEPEOPCE
GTT0.131 ***
(4.125)
−0.206 ***
(−2.617)
0.014 ***
(4.001)
−0.228 ***
(−2.747)
ECS −0.311 ***
(−4.443)
TEP −1.350 **
(−2.254)
CVYesYesYesYes
Firm FEYesYesYesYes
Year FEYesYesYesYes
Obs266266266266
Adj. R20.6640.6570.3220.631
Sobel test−3.023 ***−1.961 **
Bootstrap test[−0.070, −0.016][−0.039, −0.002]
Note: ** and *** denote significance at the 5% and 1% levels, respectively.
Table 7. Moderation analysis results.
ENRRISTACFIH
(1)(2)(3)(4)
GTT−0.238 ***
(−3.426)
−0.247 ***
(−3.006)
−0.264 ***
(−3.131)
−0.241 **
(−2.739)
REG−0.036 **
(−2.104)
−0.061 *
(−1.840)
−0.038
(−1.152)
−0.068 ***
(−3.711)
GTT×REG−0.068 ***
(−3.684)
−0.049 **
(−2.418)
−0.023
(−0.944)
−0.036 ***
(−3.245)
CVYesYesYesYes
Firm FEYesYesYesYes
Year FEYesYesYesYes
Obs266266266266
Adj. R20.6180.6290.6150.624
Note: *, **, and *** denote significance at the 10%, 5%, and 1% levels, respectively.
Table 8. Heterogeneity analysis results.
AO
(1)
EO
(2)
BR
(3)
YRD
(4)
PRD
(5)
L-DIG
(6)
H-DIG
(7)
GTT−0.183 **
(−2.286)
−0.265 ***
(−3.117)
−0.147 *
(−1.842)
−0.282 ***
(−3.226)
−0.213 **
(−2.246)
−0.176 *
(−1.844)
−0.281 ***
(−3.312)
CVYesYesYesYesYesYesYes
Year FEYesYesYesYesYesYesYes
Firm FEYesYesYesYesYesYesYes
Obs2662668411270126140
Adj. R20.6210.6380.6040.6420.6190.6170.639
Bootstrap Difference-test p-values
AO-GTT vs. EO-GTT0.151
YRD vs. BR0.041
YRD vs. PRD0.188
PRD vs. BR0.327
H-DIG vs. L-DIG0.074
Note: *, **, and *** denote significance at the 10%, 5%, and 1% levels, respectively.
Disclaimer/Publisher’s Note: The statements, opinions and data contained in all publications are solely those of the individual author(s) and contributor(s) and not of MDPI and/or the editor(s). MDPI and/or the editor(s) disclaim responsibility for any injury to people or property resulting from any ideas, methods, instructions or products referred to in the content.