Article

The Landside Traffic Effects of Air Travel: Modeling Traffic Volumes and External Costs for Germany

Institute of Logistics and Aviation, Technische Universitaet Dresden, 01069 Dresden, Germany
Systems 2026, 14(8), 1002; https://doi.org/10.3390/systems14081002
Submission received: 26 May 2026 / Revised: 7 August 2026 / Accepted: 12 August 2026 / Published: 17 August 2026
(This article belongs to the Special Issue Sustainable Urban Transport Systems)

Highlights

Please indicate how your work links to systems science via your contributions to systems practice, theory, and/or methodology.
  • Develops a modular systems-based framework to quantify airport-induced landside traffic volumes and their associated external costs across passengers, cargo, employees, and suppliers.
  • Integrates transport demand modeling and external cost assessment into a transferable methodology applicable to different airports and geographical contexts.
What are the main findings and/or the implications of the main findings?
  • Airport-induced landside traffic causes substantial external costs, with passengers and employees accounting for the largest shares and accident costs representing the dominant externality.
  • Behavioral measures such as modal shifts, higher vehicle occupancy, and reduced travel distances offer considerable potential to reduce these external costs, highlighting the importance of integrated airport mobility strategies.

Abstract

Air travel induces substantial landside traffic through the movement of passengers, employees, suppliers, and cargo between airports and their surrounding regions. While this airport-induced landside traffic has received growing attention within airport sustainability research, its associated external costs remain insufficiently quantified. This study develops a modular model to estimate traffic volumes and associated external costs of airport-induced landside traffic. It accounts for key behavioral and operational parameters, including modal split, trip distances, occupancy rates, and trip frequencies, differentiated across user groups and transport modes. The model is applied to Germany as a case study using national mobility statistics, airport data, and external cost factors from European transport studies. The assessment covers greenhouse gas emissions, air pollution, accidents, noise, habitat damage, and upstream fuel supply impacts. Results indicate that airport-induced landside traffic generated external costs of approximately EUR 1.43 billion in Germany in 2019, with passengers and airport employees accounting for the largest shares. Accident costs and greenhouse gas emissions dominate the overall impacts. Sensitivity analyses further show that moderate behavioral changes, such as modal shifts toward public transport and increased vehicle occupancy, can significantly reduce external costs. The findings highlight the importance of integrating landside access into environmental assessments and sustainable airport planning.

1. Introduction

1.1. Background

Air travel usually consists of complex itineraries where the origins and destinations are typically not located at the airport site. Consequently, airport-induced landside traffic is generated, causing environmental and societal impacts primarily through the operation of transport vehicles, the supporting infrastructure, and the fuel supply chain. Although airport-induced landside traffic has recently received greater attention within airport sustainability research, no transferable framework currently exists that consistently quantifies its associated societal external costs across passengers, cargo, employees, and suppliers using a unified modeling approach. This study introduces a framework to estimate the traffic volumes and external costs of airport-induced landside traffic.
Previous research suggests that a considerable share of airport-related landside traffic is generated not only by passengers but also by employees [1,2,3,4], and likely also by suppliers and business visitors.
The magnitude and characteristics of this landside traffic are influenced by various factors, including the airport’s size and function (e.g., hub vs. regional airport), its facilities and services, its geographic location, and the availability of surrounding transport infrastructure [1,5,6,7]. These determinants are consistent with general findings on travel behavior and traffic generation [8,9,10].

1.2. Concept and Scope

External costs are uncompensated costs caused by effects on the environment and society. While transport generates benefits which are mainly private, such as reduced travel time and lower transport costs for users, many of its negative impacts are borne by third parties rather than by the transport users themselves [11,12]. These impacts differ considerably across regions and local conditions, and may in some cases exceed the associated benefits of transport activities [13].
This study focuses on the negative externalities caused by airport-induced landside traffic. The analysis includes greenhouse gas emissions (GHG), air pollutants (AP), accidents (ACC), noise (NOI), habitat damage (HAB), and upstream impacts from fuel supply processes, referred to as well-to-tank emissions (WTT). Greenhouse gas emissions comprise climate-relevant emissions such as carbon dioxide (CO2), methane (CH4), and nitrous oxides (N2O). Air pollutants are emissions that affect human health, ecosystems, crops, and materials, such as ammonia (NH3), non-methane volatile organic compounds (NMVOC), sulfur dioxides (SO2), nitrogen oxides (NOx), and particulate matter (PM). Accident costs include both material and immaterial damages, for example vehicle damage, medical expenses, injuries, and loss of life. Noise impacts are assessed based on harmful exposure of transport-related sound to the affected population. Habitat damage includes land use, land fragmentation, and environmental degradation caused by transport infrastructure and related emissions. Fuel supply impacts represent upstream externalities associated with the production, distribution, and storage of fuels [14,15,16,17].
Time losses caused by congestion are excluded from the assessment. Although congestion costs are commonly included in broader transport cost analyses, they primarily represent economic inefficiencies rather than environmental or health-related externalities.

1.3. Traffic Categories and Parameters

The model distinguishes between several categories of airport-related traffic, each quantified in traffic units (tu), defined as one passenger or 100 kg of payload. Passenger traffic includes persons starting or ending their air journey at the airport. Cargo (including mail) traffic refers to payloads transported by air that either originate from or are destined for the airport. Employee traffic includes both flight crews and ground staff directly or indirectly related to airport operations. In addition, the model considers business visitors such as consultants, service providers, and public officials visiting the airport, as well as suppliers delivering goods required for airport operations, including fuel, food, and maintenance materials.
Traffic generated by private or recreational visits to the airport, such as shopping or sightseeing activities, is excluded because of its comparatively low relevance and the limited direct connection to flight operations.
To estimate traffic generation and the resulting externalities, the model applies several key parameters. Traffic quantity describes the number of trips generated to and from the airport. The trip factor represents the number of trips per person or payload unit, and accounts for effects such as round trips and drop-off behavior. Trip distance reflects the average one-way distance between the origin and the airport. The occupancy rate describes the average number of persons or the amount of freight transported per vehicle. Finally, the modal split represents the distribution of trips across different transport modes, such as car, bus, or rail.
Together, these parameters enable the estimation of total traffic volume, expressed in vehicle-kilometers (vkm) or passenger-kilometers (pkm), and the associated external costs for all relevant airport-related user groups [9,16,18].

1.4. State of the Art

Airport sustainability has received increasing attention in recent years, addressing topics such as airport operations, environmental management, decarbonization strategies, and sustainable transport systems [1,19,20]. While these studies have contributed to a broader understanding of sustainable airport development, research on airport-induced landside traffic has mainly focused on travel behavior, modal shift, and access strategies. Integrated assessments of the associated societal external costs remain comparatively scarce.
The existing literature on airport-induced landside traffic primarily investigates mobility patterns rather than quantifying their resulting externalities. The authors of [7] analyzed passenger access characteristics and modal split at airports in different world regions, while [5,6] examined determinants of passenger mode choice. In contrast, empirical information on employee and supplier mobility remains limited and is largely based on older studies [4,21]. Existing studies generally focus on individual transport groups or specific aspects of airport access, whereas transferable frameworks that consistently quantify the external costs of airport-induced landside traffic across passengers, cargo, employees, and suppliers remain lacking.
Statistics and general details about aviation, such as aircraft movements or passenger and cargo numbers, can be obtained from official sources like aviation and statistics authorities.1 Some airports and associations also offer details about total, transfer, and originating passengers or their employees, for instance [22,23,24,25] for Germany. However, the definitions and boundaries used in these datasets are not always clearly specified or harmonized, which means that the figures should often be interpreted as approximate estimates rather than exact values.
Landside origins and destinations are not directly available, meaning that travel distances cannot be obtained for all groups under consideration. Some publications by airports offer values in this respect, but usually do not publish the background or methodology of how these numbers were generated [22] or give only rough values [7,26]. Information about group-specific determinants, such as occupancy rates for employees or number of trips in a set time, is not available, with same being the case for business visitors or suppliers. These figures need to be derived from general surveys about the determining factors of mobility behavior. In Germany, for example, this includes MiD (“Mobilität in Deutschland”), which is a nationwide survey of households on their everyday transport behavior commissioned by the Federal Ministry of Transport and Digital Infrastructure (BMVI).2 Other countries provide similar information, such as the National Travel Survey (NTS) in Great Britain or the National Household Travel Survey (NHTS) in the United States. As airports do not fall into the classic model of everyday mobility behavior or urban mobility, the parameters have to be applied and adjusted accordingly in order to take into consideration the specific boundary conditions of the examined groups of people, the integration of the airport into the surrounding spatial and settlement structure, and the regional transportation offerings.
Transport modes have quite different characteristics, such as fuel type, vehicle sizes and capacities, emission classes, and the environment in which the vehicles are underway (e.g., urban vs. motorway for road traffic, long distance vs. regional for rail trains). The mode-specific emission parameters and external cost factors for Germany have been elaborated by, for example, [14,27] and on a country-specific basis and EU-283 average for the European Union in the “Handbook on the External Costs of Transport” of the Directorate for Mobility and Transport of the European Commission (DG MOVE) [16]. Thus, different approaches can be used for estimating external costs, such as calculating the costs of damage, avoidance, restoration, etc., depending on the nature of the issue considered and the scope set. An overview of transportation cost studies for other world regions is presented by [15].
All input data used in this study refer to 2019. This year was deliberately selected as the latest representative baseline unaffected by the disruptions caused by the COVID-19 pandemic while still ensuring close temporal consistency with the official statistics and industry surveys used to derive the model parameters. Although some travel and commuting patterns may have changed since then, the year 2019 provides the best compromise between data availability, consistency, and representativeness for the present analysis.

2. Methodology

2.1. General Considerations

To calculate total external costs, the average landside traffic volume V induced by a flight event is estimated according to Equations (1) and (2), based on the following key determinants: number of traffic units N, single trip distances d, the number of trips represented by the trip factor t f , vehicle occupancy b, and modal split m. These parameters are distinguished and aggregated by the different transport modes i and specific transport groups j of passengers and air cargo, airport employees, and suppliers/official visitors.
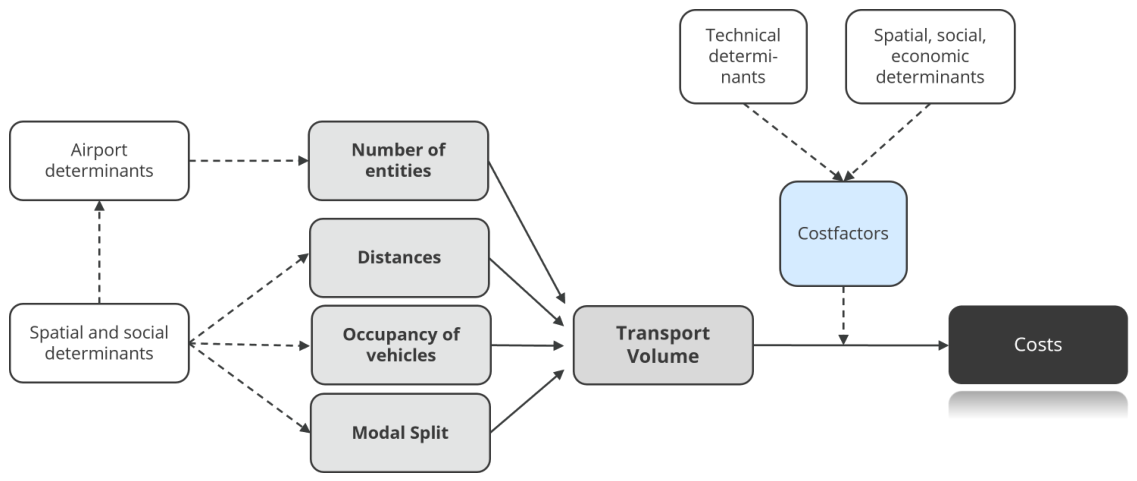
The modeling approach is designed to be applicable across different geographical contexts, depending on the availability of relevant mobility and transport data. For illustrative purposes, the model is applied to a case study using data from Germany. However, even in this case study, the results should be regarded as approximations. Due to limited public data availability, many group-specific parameters (e.g., trip lengths, occupancy rates) must be estimated based on national travel surveys or regional mobility studies. In the German case, parameters are derived from sources such as the “Mobilität in Deutschland” survey. Figure 1 outlines the model framework along with the key determinants used for quantifying transport volumes and their related environmental impacts.
The numbers for arriving and departing passengers and cargo are assumed to be balanced, as these values are generally balanced for most airports [28,29]. Consequently, only departing passengers and cargo are modeled explicitly for the annual assessment, with each traffic unit representing both the departure and the corresponding arrival. Within the modeled departing traffic, passenger and cargo are distinguished into originating and transfer traffic. This distinction is required because only originating traffic generates direct landside traffic, whereas transfer traffic contributes only to airport handling activities. Details on this classification are provided in Section 2.2 and Section 2.3.
Accordingly, for the estimation of landside traffic volumes, only the considered traffic units N are taken into account. For passengers and cargo, these correspond to originating traffic units, whereas for employees and suppliers all units are considered, as these groups are not classified into originating and transfer movements. Transfer passenger and cargo units T do not generate additional landside traffic, and as such are excluded from the traffic volume calculation. They are considered subsequently for the proportional allocation of employee- and supplier-related external costs.
V i j = m i j · d i j · t f i j · N j b i j
[ vehicle · km ] = [ − ] · [ km ] · trip tu · tu vehicles trip
V = ∑ i ∈ M ∑ j ∈ G V i j
In the above equations, M denotes the set of transport modes and G denotes the set of transport groups.
Equation (3) estimates the mode- and group-specific external costs C i j by multiplying traffic volumes with mode-specific cost factors c f per unit distance. The corresponding values are taken from [16] and refer to one vehicle-kilometer (vkm).
Accordingly, individual modes are represented by average passenger cars, light commercial vehicles (LCV), and heavy goods vehicles (HGV), while public transport is represented by bus and rail. These average model vehicles are based on general assumptions concerning technical determinants, such as vehicle occupancy (load factor), vehicle size, fuel type, emission standard, and the distribution of travel across motorway, rural, and urban roads. These assumptions also account for spatial determinants such as population density, income level, etc.4 Variations between the EU member states are presented in Section 3.2.3. Table 1 shows the average environmental costs for Germany, which are used for the further calculations in this study.
To obtain the total external costs for each transport group, all mode-specific costs within a group are summed according to Equation (4). The variables used in Equations (1)–(4) are defined in Table 2.
C i j = V i j ∗ c f i
C j = ∑ i ∈ M C i j
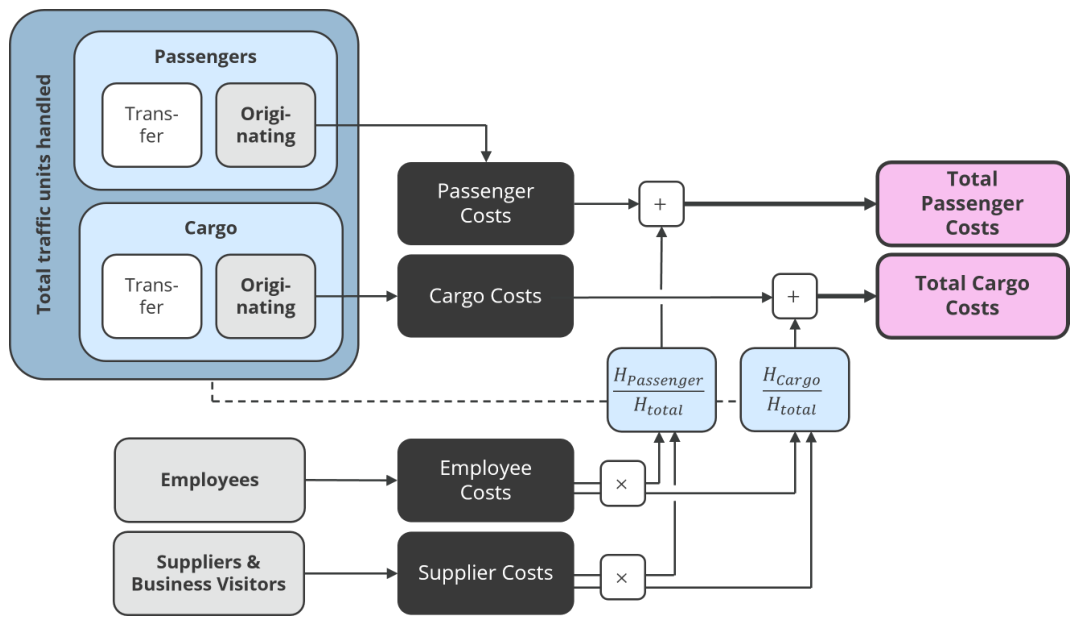
After calculating the external costs for all transport groups individually, the external costs of employees and suppliers are allocated proportionally across the handled passenger and cargo traffic units H according to Equation (5), as illustrated in Figure 2. This allocation reflects that employee- and supplier-related traffic supports the handling of all passenger and cargo traffic units, including originating and transfer traffic. The resulting passenger and cargo costs are then summed to obtain the total external costs (Equation (6)). Dividing these costs by the corresponding number of originating traffic units yields the external costs per originating traffic unit (Equation (7)). The variables used in Equations (5)–(7) are defined in Table 3. In these equations, the group index j applies only to passenger and cargo transport groups.
C j total = C j + H j H C Employees + C Suppliers
with
H j = N j + T j
and
H = ∑ j H j
C = ∑ j C j t o t a l
c j = C j t o t a l N j

2.2. Passengers

Passengers are generally assumed to access from a landside origin to a first entry point for multi-sector flights, meaning that at least one landside arrival and departure is necessary for each passenger.
When determining the number of passengers, double-counting occurs by recording all boardings (also each time during transfers).5 Therefore, the data must be adjusted for these values in order to ultimately determine the originating passengers.
In this way, the share of originating passengers shows a negative correlation with the connectivity of airports, i.e., the number and frequency of direct and indirect connecting destinations and flights [30]. Hub airports with a lot of direct and indirect connections, such as Frankfurt or Munich in Germany, have a below-average proportion of originating passengers compared to other airports. As the air traffic statistics for Frankfurt show, around 50% of the passengers traveling there are transfer passengers [31]. Following [24,29,32], an average value of 75% originating passengers6 is assumed in this study.
The travel behavior of passengers is strongly influenced by the passenger type (business or leisure travelers, families, etc.) or trip parameters such as trip purpose, costs, reliability, travel- and waiting times. In addition, individual parameters such as age, gender, income, and group size shape travel behavior [5,9,33], but are not considered in this paper.
Modal splits vary among different airports and world regions. Airports in the Americas tend to have a higher share of individual transport modes, while Europe and Asia show a shift to public transport [32]. The survey by [24] for Germany revealed that in 2014, 70% of the passengers traveled by private or rental car or taxi and 30% by public transport. These are values that depend on the individual conditions of an airport, that is, its geo- and socio-spatial situation. For example, the travel costs and travel time of a specific mode negatively correlate with the probability of the respective mode being chosen. Since specific emissions, and hence external costs, vary with the type of vessel, an intramodal distinction seems reasonable. Therefore, the intra-public transport share in this study is simplified into either train or bus. Within the mode of individual transport taxi, self-driven cars and car users dropped off and picked up by third parties are distinguished in order to cover different trip factors. Exploring the data of [5,7,32], an overall usage of around 5% bus and 27% local or long-distance train,7 40% dropped off by car, and 28% self-driven car, taxi, or rental car can be determined for European airports.
The occupancy rate likely varies with the mode and types of passengers at airports. A mean value of 1.5 is assumed for individual transport in Germany [9], since there is no respective value for airport access and egress in particular. The average value of 1.5 is expected to also apply to accompanied passengers; in this case, the person bringing them is not counted.
Concerning passenger travel distances, [7] determined that for airports in the upper Adria region in Italy and Slovenia, 70% of the passengers originated from within 60 km and 75% from within 65 km. Figures for Germany provided by [34] show that, on average, 31% of passengers arrive at the airport from within a radius of 25 km, 56% within 50 km, and 72% from within 75 km. This approach of applying these radii is itself a simplification, as a real catchment area is geometrically more complex and depends on various factors such as travel time from the origin, accessibility and mobility pricing, and flight schedules and frequencies [3,7,26]. For the following calculations in this study, a uniform average access distance of 50 km was intentionally selected as a simplification for the average airport catchment in Germany, taking into consideration the relatively high density of airports in Germany [35].8 Possible differentiations in the modal split, etc., associated with the distance are not considered in what follows.
One return trip is assumed for original passengers who come to the airport with their own or a rental car, for a trip factor of 2. Cab and transfer services are also added to the category of car users who drive themselves, as it can be assumed that they will try to avoid empty trips and optimize their processes accordingly. Passengers who are brought to and dropped off at the airport by individual transportation are assigned a simplified value of 4, as it can be assumed that the person bringing the passenger will return to the point of departure or another location and generate another round trip later to pick up the respective passenger.
The following parameter table (Table 4) summarizes the underlying mobility assumptions for passengers. For each parameter, the original data source, reference year, and status are provided. Parameters are classified as observed (directly obtained from empirical data), derived (calculated or harmonized from one or more sources), or assumed due to missing empirical data. All parameter tables follow the same structure for cargo, employees, and suppliers, respectively.

2.3. Cargo

To model the traffic volume induced by the landside connection of air cargo, this study refers to values from aviation statistics in this respect. The quantity of original air cargo (including mail) is not available, as the data are usually only published with the quantities onloaded and offloaded as well as the transfer freight, which is a special case of cargo that remains on the aircraft with the same flight number and as such is not relevant in this study. In all, 2,400,000 tonnes of cargo were on-loaded at German airports in 2019 [28,29]. Information on how much cargo was off- and on-loaded at the same airport, which would not induce any landside traffic, is not publicly available. A rough assumption here is that 75% of the cargo connects to landside origins and destinations, amounting to 1,800,000 tons. Therefore, this study specifies that 100 kg of cargo represents one traffic unit.
There is a huge variety (modal split) of vessels engaged in road freight transport. Analyzing data for the EU-28 countries reveals that almost 75% of all vehicle kilometers are carried out by heavy goods vehicles of more than 30 t maximum permissible laden weight [36,37]. For simplification, it is assumed in this study that all cargo is transported by heavy goods vehicles (HGVs).
According to the statistics on total road freight transport in Europe, an occupancy rate of 12.5 tons (125 traffic units) of transported cargo per trip is assumed.9 [16,36].
Examination of data from [36,37] shows that the average distance of transported goods in Europe is around 138 km per trip. Because of the consideration of only on-loaded cargo, a trip factor of 2 is applied, which covers delivery to and the pick-up from the airport.
All mobility parameters for cargo are summarized in Table 5.

2.4. Employees

Employees are allocated in the following as employee work-years per traffic unit, which indicates the fraction of how many employees with an average year of work are needed to handle one traffic unit. Table 6 shows an example of the number of employees at some selected German airports, extracted from official airport publications. The number of employees per transported traffic unit can be estimated from these values, taking the originating passengers and on-loaded freight at the respective airports into account. This results in approximately 0.00146 to 0.00180 employee work-years per transported traffic unit. It can be assumed that the available employment figures are not always consistent in their boundaries. The number of directly flight-related personnel is likely to be overestimated at airports with a lot of maintenance or manufacturing facilities or other companies operating within the airport limits. After comparing the plausibility of these figures with other publications,10 the mean value of 0.00164 employee work-years per traffic unit handled or 610 traffic units per work-year, weighted according to the traffic units of the respective airports, is applied for further calculations.
The modal split of employees differs from that of air passengers due to varying requirements regarding travel frequency, duration, distance, and time of day. In addition, employees tend to use cars more frequently than air passengers, a pattern largely driven by the provision of free parking spaces [2,21]. In Germany, the 2011 workplace survey of Cologne/Bonn Airport, for example, shows a modal split of 72% individual and 28% public transport, incl. others [43]. The publication of Frankfurt Airport reveals that 29% of the employees had used public transport, with a significant drop down to 17% after the COVID-19 pandemic. As no further values are available, the assumption for further consideration is a modal split of 75% individual and 25% public transport. For the latter, the same intra-modal split as for passenger public transport is assumed [31].
The occupancy rate of the individual travel modes is also likely to depend on factors such as trip costs, including free car parking possibilities. The value for the trip purpose of “work” is set at 1.2, according to general values for Germany from [9].
To determine a trip factor, the average number of days per year of commuting to the airport has to be estimated. The employees working at the airport are a heterogeneous group consisting of ground staff (at Frankfurt Airport, approximately 60 to 70%), which is made up of employees in handling, retail, administration, authorities, maintenance, operations, etc., as well as flight personnel (approx. 30 to 40% of employees at the airport) to perform the respective flights [22]. For ground staff in Germany, a conventional working week with five working days is assumed, corresponding to 260 working days over 52 weeks per year. With an average vacation entitlement, public holidays, and sick days of 30 and 10 days, respectively, this results in 210 working days [44]. It is unknown how many of the employees are teleworking or working part-time and how this part-time work is distributed (e.g., as a reduction in daily working hours or whole days). It is assumed in this study that possible part-time work or teleworking reduces the number of trips to 80 % of the working days,11 resulting in a trip factor of 168 days to commute to the workplace, which is multiplied by 2 to cover the trips forth and back. Table 7 shows an overview of the assumptions made.
Concerning flight personnel, overnight stays at the destination are common, for example in network airlines with many intercontinental flights or combinations of short flights into flight rotations that last several days [45]. Although this reduces the number of journeys to work, it probably also increases the tendency to commute long distances.12 Some regional, charter, and low-cost airlines, however, tend to have working days that end at the place of origin [46]. As no corresponding data could be researched in this regard, the impact in this respect is considered indifferently and no distinction between flight and ground personnel is applied.
The average single trip distance traveled by employees commuting to an airport workplace is influenced by multiple factors, including the airport’s location relative to urban centers, the availability of public transport, and regional settlement structures; therefore, standard work-related travel distances from general mobility surveys may not adequately represent airport-specific commuting patterns. This is particularly relevant for airports, which are often located outside of dense urban areas and poorly integrated into everyday mobility infrastructures [3].
In the German context, the nationwide “Mobilität in Deutschland” survey reports an average commuting distance of 15 km for work-related trips [9]. However, this value is likely to underestimate commuting distances to airports. Both mean and median values from such surveys may be biased, either by long-distance commuters (inflating the mean) or by a high share of short urban trips (deflating the median) [47].
More specific insights can be drawn from an analysis of airport employee residence data at three major German airports: Frankfurt/Main (FRA), Munich (MUC), and Cologne/Bonn (CGN). These show that approximately 60% to 80% of employees live within 25 km of the airport, while 20% to 40% commute from distances of 35 km or more (Table 8). Since many datasets rely on straight-line (air) distances, a detour factor must be applied to approximate actual ground travel, which depends on the regional road network and settlement structure [48].
For the purposes of this study, an average one-way commuting distance of 25 km is assumed for airport employees in the German case study.
Table 9 provides an overview of all mobility parameters used for employees.


2.5. Suppliers and Official Visitors

Certain delivery services or activities at airports are carried out daily (food supply, cleaning services, etc.), while others occur at intervals.13 However, no data is available on the type and characteristics of suppliers and business visitors. For the number of trips, a rough estimation of one delivery per 100 traffic units was selected to obtain an order-of-magnitude estimate in the absence of empirical data. This results in around 1.25 million annual trips arriving at the airport by suppliers and other business visitors in Germany.
It can be assumed that suppliers use individual vehicles (trucks or light commercial vehicles) and that business visitors are reasonably represented in the MiD via the trip purpose “business”. Therefore, it should be assumed for simplicity that the modal split is 25% by car, 50% by light commercial vehicles (LCV) and 25% by heavy goods vehicles (HGV). The route lengths are difficult to estimate, as there are no data in this respect. Some delivery services are certainly long-distance, but a large proportion is likely to have a local or regional origin (e.g., food or cleaning services). For this reason, and as there are no better values available, we apply the same 50 km distance value here as for the average passenger single trip. The mobility parameters for suppliers and official visitors are summarized in Table 10.

3. Application

The baseline scenario represents airport-induced landside transport in Germany in 2019 based on the model assumptions and input parameters described in Section 2. It serves as the reference case for evaluating the influence of alternative behavioral and methodological assumptions in the subsequent sensitivity analysis (Section 3.2).

3.1. Baseline Scenario

3.1.1. Traffic Volume

Passengers and Cargo
In 2019, each originating air passenger in Germany generated an average of 72.0 vkm by car, 0.27 vkm by train, and 0.28 vkm by bus, leading to a total of 6.75 billion vkm by car and 50.4 million vkm by public transport. Each traffic unit of originating air cargo caused an average of 2.21 vkm by heavy goods vehicles, resulting in 39.7 million vkm. Table 11 summarizes the mean traffic volume per originating traffic unit for passengers and cargo.
Employees
Airport employees were associated with an average of 8.63 vkm by car and 0.03 vkm by train or bus per originating passenger or cargo traffic unit. This translates to 1.29 billion vkm by car and 8.7 million vkm by public transport (train and bus) annually in 2019 (Table 12).
Suppliers and Others
Per traffic unit of originating passenger or cargo, suppliers and business visitors induced 0.21 vkm by car or truck and 0.42 vkm by light commercial vehicles. This results in a total of 125.0 million vkm in 2019 in Germany (Table 13).

3.1.2. External Costs

Combining the mode-specific external cost factors presented in Table 1 with the traffic volumes derived in Section 3.1.1 yields the external costs for each transport group and externality, shown in Table 14 and Table 15. Following the allocation procedure described in Section 2, employee- and supplier-related external costs are distributed proportionally across all handled passenger and cargo traffic units before the resulting costs are expressed per originating traffic unit.
Accordingly, a single originating air passenger causes approximately EUR 14.03 of external costs through induced landside transport, whereas a cargo unit causes approximately EUR 2.81, both including the indirect impacts associated with airport employees and suppliers. In total, airport-induced landside transport resulted in external costs of approximately EUR 1.43 billion in Germany in 2019.
As presented in Table 16 and Table 17, the majority of these costs are attributable to passenger and employee transport. Table 18 show, that across all transport groups, accident costs clearly dominate the overall external cost structure, accounting for approximately 61% of the total. Greenhouse gas emissions (12%) and air pollution (9%) constitute the second-largest categories, followed by habitat damage (7%), upstream fuel supply (6%), and noise (5%).

3.2. Sensitivity Analysis

Uncertainties are inherent in both the mobility parameters and the applied external cost factors. A univariate sensitivity analysis was performed in order to systematically evaluate the influence of the major model parameters. By varying each parameter individually while keeping all remaining inputs constant, the contribution of each assumption to the overall model outcome can be isolated and quantified. This approach provides transparency regarding the dominant sources of uncertainty and allows the sensitivity of the model to individual assumptions to be assessed directly. The selected parameters represent those identified as the principal sources of uncertainty within the proposed modeling framework.

3.2.1. Variation of Fundamental Data

Several assumptions were made regarding the underlying data, such as the estimated work volume per traffic unit (see Section 2.4) and the volume of supplier services, which was approximated at one delivery per 100 traffic units handled (see Section 2.5). As illustrated in Table 19, applying a 10% reduction to each parameter leads to an overall decrease of external costs of 1.53% regarding employee work volume and a decrease of 0.23% for supplier services.

3.2.2. Behavioral Scenarios

To assess the influence of behavioral parameters on external costs of airport-induced landside traffic, a set of marginal and scenario-based sensitivity analyses was conducted. The marginal analysis considers isolated changes in individual parameters, while the scenario analysis combines changes to better reflect realistic intervention approaches.
Marginal Effects
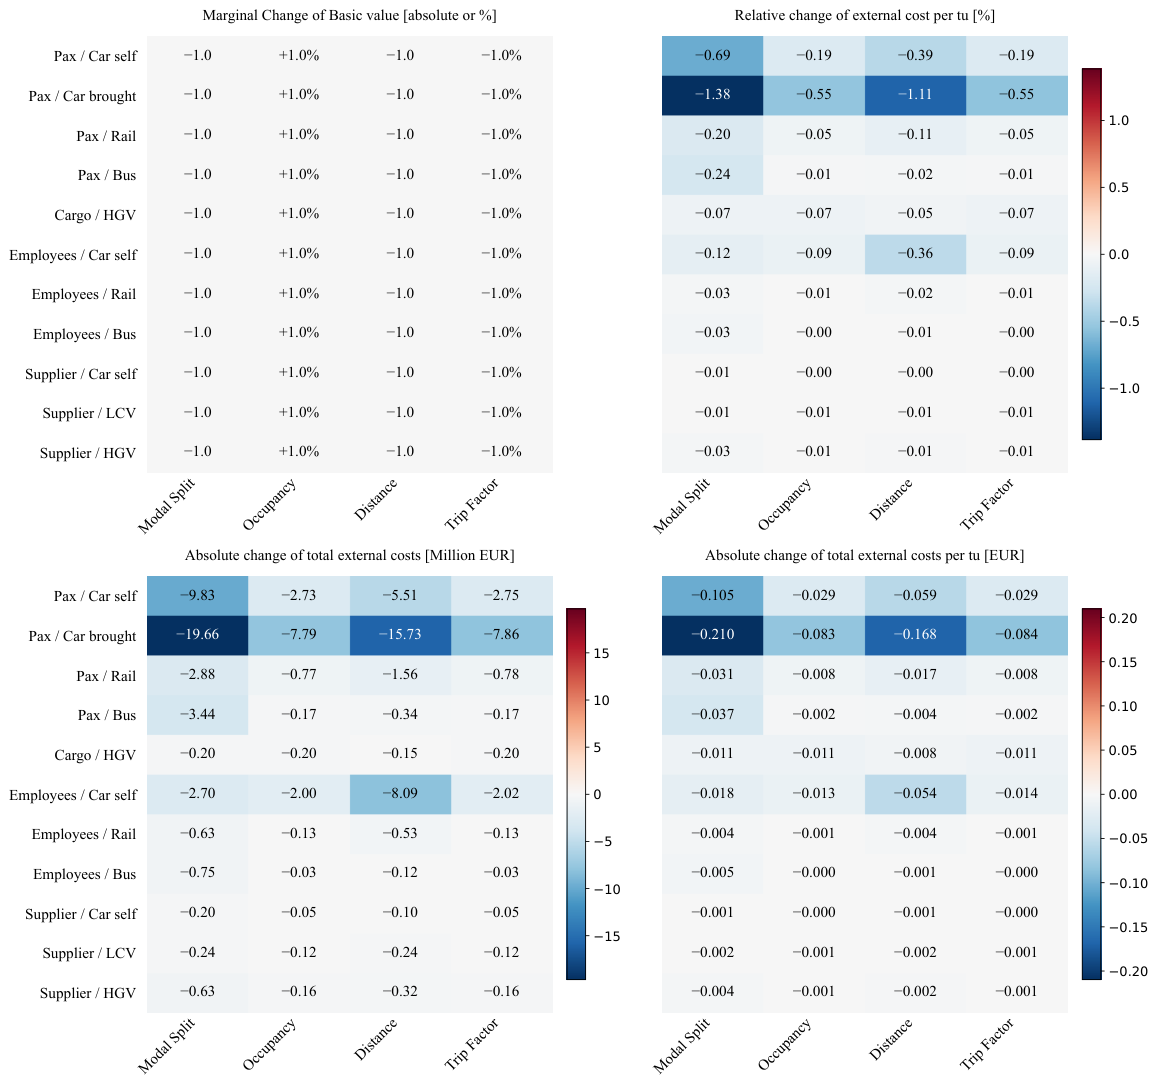
Figure 3 summarizes the sensitivity of the model to marginal changes in the principal behavioral parameters for all transport groups and transport modes. Each parameter was varied individually while all remaining model inputs were kept constant, allowing the isolated influence of each assumption on the model outcome to be quantified. Modal split and travel distance were modified by absolute changes (1 percentage point and 1 km, respectively), whereas occupancy and trip factors were varied by relative changes of 1% to account for their different scales.
The results indicate that the modal split and the proportion of passengers being dropped off at airports have the greatest influence on the external costs of airport-induced landside transport. In particular, reducing the share of private car use consistently decreases both total external costs and external costs per traffic unit. Travel distance also has a pronounced effect, especially for passengers and employees, as all distance-related externalities increase proportionally with the traveled distance.
For example, shifting 1 percentage point of passenger trips away from private cars reduces external costs by approximately 0.69% (10.5 €cent per traffic unit) for self-driving passengers and by 1.38% (21 €cent per traffic unit) for passengers being dropped off at airports. These changes correspond to annual reductions of approximately EUR 9.8 million and EUR 19.7 million, respectively. In contrast, an equivalent shift away from public transport results in comparatively small changes of approximately 3.1 €cent and 3.7 €cent per traffic unit for rail and bus users.
Increasing vehicle occupancy and reducing trip factors both produce smaller but systematic reductions in external costs. Owing to the linear formulation of Equations (1)–(6), identical relative changes in occupancy and trip factors lead to proportional changes in traffic volumes, and consequently in the resulting external costs.
Overall, the marginal analysis identifies passenger travel behavior, particularly mode choice and airport access patterns, as the most influential determinants of airport-induced landside transport externalities, whereas occupancy and trip frequency primarily affect the magnitude of the resulting costs rather than their structure.
Scenario-Based Analysis
While the marginal analysis identifies the influence of individual parameters, real-world interventions usually affect several behavioral determinants simultaneously. Therefore, a set of scenario-based analyses was developed to evaluate the combined impact of plausible changes in travel behavior and operational conditions (Table 20). The scenarios represent potential policy measures such as improved public transport accessibility, parking pricing strategies, road or access charges, incentives for higher vehicle occupancy, flexible working arrangements, and the selection of regional suppliers.
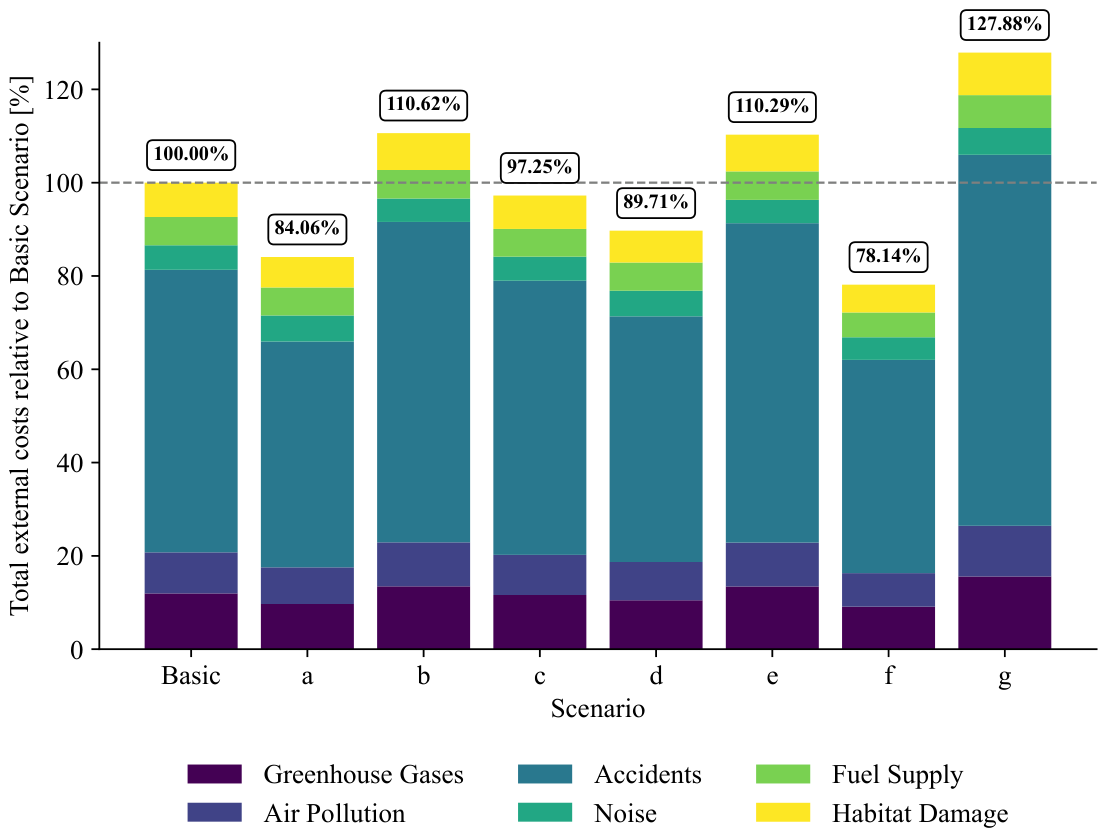
The resulting relative and total changes of external costs are summarized in Table 21 and Table 22 and Figure 4. Overall, the scenarios confirm the findings of the marginal analysis, namely, that passenger travel behavior is the dominant driver of airport-induced landside transport externalities.
Scenarios a and b investigate different levels of public transport use by air passengers. Scenario a assumes that 50% of all passenger trips are undertaken by public transport, whereas Scenario b represents a case with only 20% public transport usage. These values reflect the range of modal shares currently observed at German airports [5,7]. Increasing the public transport share reduces total external costs by 15.9%, whereas the lower public transport share increases total costs by 10.6%. The strongest changes occur for accident costs and greenhouse gas emissions. Noise costs increase slightly under Scenario a because rail transport exhibits higher specific noise costs than road transport.
Scenario c examines a reduction of passenger drop-off trips by shifting 10% of accompanied passengers towards self-driving passengers. Such a development could result, for example, from modified parking strategies or reduced incentives for short-term pick-up and drop-off activities. The corresponding reduction in total external costs amounts to approximately 2.8%.
Scenarios d and e extend the analysis to both passengers and employees by assuming a modal shift of 10 percentage points between private and public transport. A shift towards public transport decreases total external costs by 10.3%, whereas the opposite development results in a comparable increase, underlining the importance of sustainable access strategies for both user groups.
Finally, scenarios f and g combine several behavioral changes to represent integrated developments rather than isolated interventions. In addition to a modal shift towards public transport, these scenarios assume higher vehicle occupancy, reduced trip frequencies of employees through measures such as flexible working arrangements and home office, and shorter supplier travel distances due to more regional procurement. Scenario g applies the same assumptions in the opposite direction. Compared with the baseline, the combined scenarios lead to the largest changes in total external costs, ranging from a reduction of 21.9% (Scenario f) to an increase of 27.9% (Scenario g). These results demonstrate that coordinated measures that simultaneously affect multiple behavioral determinants have substantially greater effects than isolated interventions.

3.2.3. Variation of Cost Factors

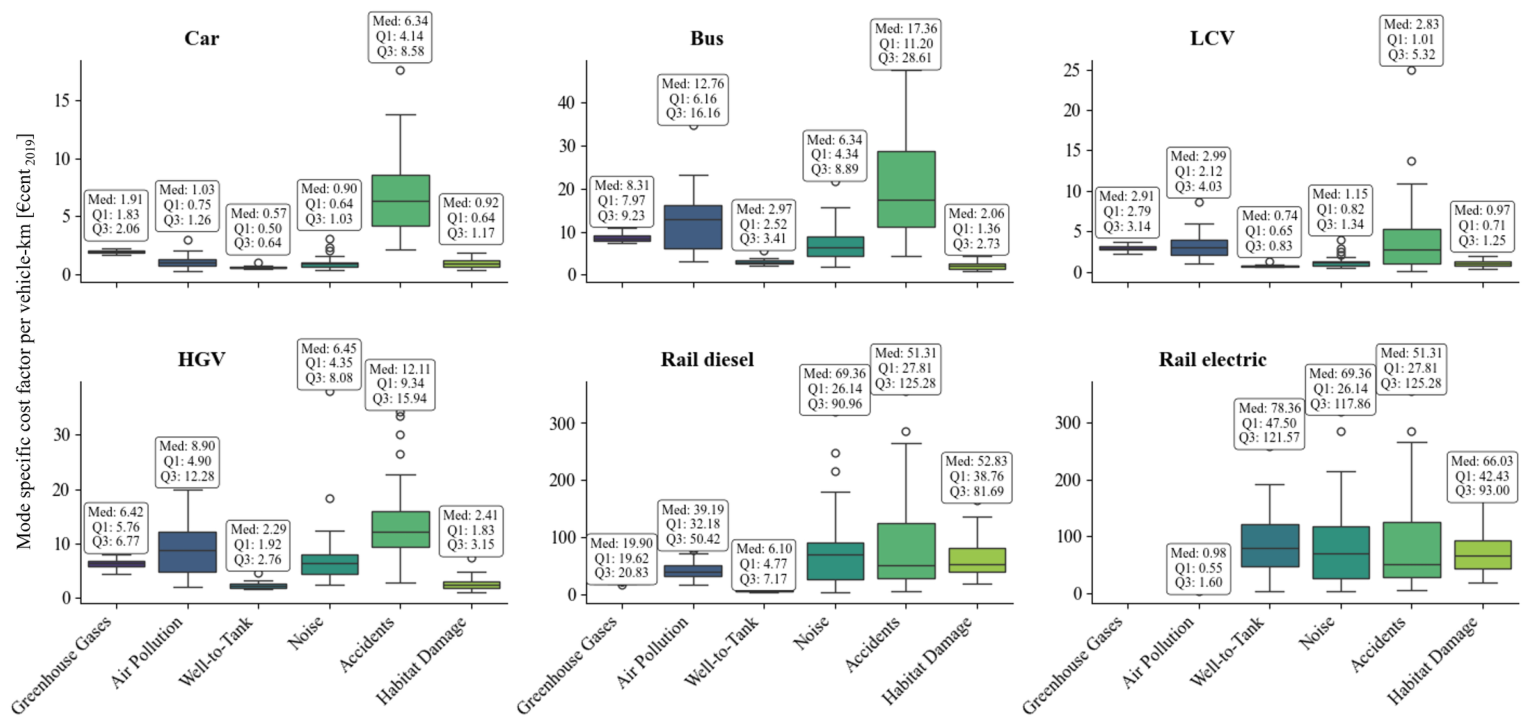
External cost factors vary significantly between countries due to differing emission characteristics, vehicle technologies, and socioeconomic conditions [16,17,50,51]. As shown in Figure 5, there is substantial variance across European countries.

4. Discussion

4.1. Interpretation and Implications

The results of this study demonstrate that airport-induced landside traffic generates substantial external costs, amounting to approximately EUR 1.43 billion annually in Germany under the baseline assumptions. Passenger and employee travel account for the majority of these costs, while road accidents and greenhouse gas emissions represent the dominant externality categories. The scenario analysis further shows that these costs are highly sensitive to behavioral assumptions, and as such are not fixed quantities. Rather than representing a statistical uncertainty interval, the combined scenarios provide a plausible range of outcomes resulting from simultaneous changes in key behavioral parameters, including modal split, vehicle occupancy, trip frequency and travel distance. Under favorable assumptions, annual external costs decrease to approximately EUR 1.12 billion (−21.9% relative to the baseline), whereas less favorable developments increase the costs to approximately EUR 1.83 billion (+27.9%). This range illustrates both the considerable mitigation potential of integrated mobility strategies and the influence of travel behavior on the overall magnitude of airport-induced landside transport externalities. As such, aviation-related environmental assessments that disregard landside traffic underestimate the total external effects and, consequently, the associated costs.
The high magnitude of external costs per traffic unit of passengers is primarily driven by the high share of motorized individual transport (70%), comparatively long average access distances (50 km), low vehicle occupancy (1.5 persons per vehicle), and the high proportion of accompanied passengers in this group, which substantially increases the number of generated vehicle trips through higher trip factors.
In contrast, the estimated external costs per cargo traffic unit are approximately one-tenth of those for passengers. This difference mainly reflects the substantially larger transport capacity of cargo vehicles, resulting in considerably lower vehicle-kilometers per traffic unit. However, this result should be interpreted in the context of the modeling assumptions, particularly the assumed average payload, transport distances, and exclusive representation of cargo transport by heavy goods vehicles. Consequently, the reported values should primarily be interpreted as indicative average estimates rather than universally applicable ratios between passenger and cargo transport.
Airport employees constitute the second-largest contributor to external costs. Although individual commuting distances are considerably shorter than those of passengers, the combination of frequent commuting, low vehicle occupancy (1.2 persons per vehicle), and high reliance on private cars results in substantial annual traffic volumes. This finding indicates that employee mobility represents an important but frequently overlooked contributor to airport-related externalities.
Although suppliers and business visitors account for only a small share of the total external costs in the German case study, their relevance may increase considerably at airports with extensive maintenance facilities, cargo hubs, manufacturing activities, or large commercial areas. Consequently, this traffic category should not generally be neglected in airport-wide environmental assessments.
Based on these results, mitigation measures should not focus exclusively on passenger access, as addressing employee mobility also offers considerable potential for reducing external costs. The scenario analysis shows that increasing public transport accessibility, improving vehicle occupancy through ride-sharing schemes, reducing employee car dependency by parking management, and shortening access distances through integrated airport and regional planning all show considerable mitigation potential.
Finally, the dominance of accident costs further illustrates that airport-induced landside traffic should not solely be regarded as an environmental issue. Instead, it represents a broader societal challenge that extends beyond airport boundaries and links airport planning with regional road safety, transport infrastructure, and mobility policy.

4.2. Model Limitations

Despite its flexibility and transferability, the model in this paper relies on several assumptions due to data limitations.

4.2.1. Fundamental Data

Many fundamental parameters had to be assumed or derived from aggregated data due to the lack of harmonized airport-specific statistics, such as the share of locally originated passengers and air cargo or the number of employees and their working patterns. Figures for suppliers and business-related traffic volumes were approximated, and may also be subject to considerable uncertainty. All input data refer to the pre-pandemic year 2019. Although this avoids distortions caused by the COVID-19 pandemic, it is possible that changes in travel demand, remote working, commuting behavior, and public transport usage may have altered some of the underlying parameters in recent years. Consequently, the absolute results should be interpreted as representative for only the 2019 reference situation. Nevertheless, the methodological relationships and underlying mechanisms governing landside traffic generation are not specific to 2019, making them generally applicable beyond the selected reference year.

4.2.2. Mobility Parameters

Key mobility parameters such as modal split, trip distances, occupancy rates, and trip frequencies were often not directly available and had to be derived from general mobility surveys or extrapolated from limited airport-specific data. As a result, many values represent national or regional averages that may not reflect airport-specific characteristics or spatial structures. Consequently, the model results should be interpreted as estimates rather than precise measurements. Among these assumptions, the use of uniform access distances represents one of the major simplifications of the model. In reality, airport catchment areas differ substantially depending on airport size, location, connectivity, surrounding population density, and transport infrastructure; consequently, the applied average passenger access distance may overestimate traffic volumes for regional airports while underestimating those of major hub airports. Moreover, the model assumes uniform behavior within defined groups (e.g., passengers, employees) even travel behavior in reality varies significantly by trip purpose, region, and sociodemographic characteristics. For instance, the distance to the airport and choice of transport mode may differ markedly between leisure and business travelers or between urban and rural airports. However, airports with larger catchment areas may induce longer landside access trips while simultaneously reducing the need for feeder flights, illustrating the complex interaction between landside and airside transport.
Cargo transport distances are based on average European values, and may not adequately represent airports with highly specialized cargo structures or region-specific supply chains.
Regarding employees, another important source of uncertainty is the heterogeneous composition of the workforce. Ground staff typically commute frequently over comparatively short distances, whereas flight crews often commute less frequently but may travel considerably longer distances due to multi-day duty rotations and home-base concepts. Aggregating both groups into a common commuting profile smooths these differences, and may overestimate one group while underestimating the other.
Since traffic volume scales almost linearly with trip distance, deviations from the assumed average distance directly affect the calculated external costs. Therefore, the presented results should primarily be interpreted as national average estimates rather than airport-specific values.
Modal split values are also highly dependent on local transport infrastructure, service frequency, travel time, ticket prices, and parking availability. Consequently, airports with good public transport infrastructure are likely to have a lower share of private car use than assumed in this study, leading to an overestimation of road traffic volumes and related external costs. Conversely, airports with poor public transport accessibility may be underestimated.
Although a considerable share of airport cargo is transported by heavy goods vehicles, smaller consignments, express freight, and service logistics are also carried by light commercial vehicles. Therefore, the exclusive use of HGVs is likely to slightly overestimate external costs for cargo transport.
The mobility characteristics of suppliers and business visitors are currently among the least documented components of airport-related traffic. Consequently, all corresponding parameters were derived qualitatively from general assumptions, and should be regarded as indicative rather than representative.

4.2.3. Cost Values

The cost values used in this study are based on country-specific external cost factors published by [16], differentiated by transport mode. For the allocation of costs, either representative modal values or weighted averages were used. However, these values vary substantially between European countries due to differences in vehicle technologies, fuel types, accident rates, average occupancy levels, and population density.14 In road traffic, technologies other than petrol and diesel engines are not represented by the current cost factors. Future changes in vehicle technologies and fuel pathways are expected to alter the relative importance of different external cost categories. Furthermore, the applied external cost factors represent average rather than marginal costs; consequently, the sensitivity analysis illustrates average scenario effects and should not be interpreted as the marginal impact of adding or removing a single vehicle or passenger. This limitation is particularly relevant for public transport, where higher passenger numbers do not necessarily require additional train or bus services.
The presented model excludes congestion effects and associated societal costs due to the main focus being on environmental and health-related costs. Additional travel time losses imposed on other road users and congestion-induced emissions are not represented. Therefore, the reported external costs constitute a conservative estimate that does not include all societal transport externalities.

4.3. Future Research

The identified limitations highlight the need for more comprehensive and airport-specific datasets on both traffic generation and travel behavior. In particular, post-pandemic developments such as changes in passenger demand, remote working, employee commuting patterns, and cargo logistics should be reassessed and incorporated into updated model parameters.
A better understanding of airport catchment areas for passengers, cargo, and employees represents another important research field. Airport-specific travel surveys, observations, and accessibility studies could substantially improve the estimation of trip distances and modal splits. Public transport operators could contribute by providing more detailed information on vehicle occupancy and service utilisation, while cargo operators could improve the empirical basis by reporting shipment origins, transported tonnage, and vehicle categories.
Finally, future external cost factors should account for technological developments such as battery–electric and hydrogen-powered vehicles as well as alternative fuel pathways including synthetic fuels and biofuels.
Despite the identified limitations, the modular structure of the proposed framework allows all parameters to be replaced by airport- or country-specific values. Consequently, the methodology can readily be transferred to different geographical contexts as more detailed mobility data become available.

5. Conclusions

This study introduces a model for estimating external costs of airport-induced landside traffic. The model provides a modular and transparent framework that can be applied to different regions and airport types. The novelty lies in the integrated consideration of passengers, cargo, employees, and suppliers within a single modular assessment framework. It provides a practical basis for integrating landside traffic into future environmental assessments, airport planning, and transport policy.
As applied to Germany, the model reveals that such traffic generates significant externalities, primarily caused by passenger and employee trips. The results suggest that landside access should be systematically considered in environmental assessments of the aviation sector.
However, its reliability depends heavily on the availability of context-specific data. Improving the granularity and consistency of empirical data, particularly concerning modal choices, trip distances, and occupancy rates, should be a priority for researchers and transport authorities alike.
The scenario-based analysis demonstrates that moderate changes in user behavior such as shifting to public transport or improving vehicle utilization can yield significant reductions in external costs. This supports the integration of sustainable mobility measures into airport and regional transport planning.
Future research should focus on validating behavioral assumptions. Comparative analyses across different regions and airport types could also provide valuable insights for policy development and best-practice transfer.

Supplementary Materials

The source code and input data required to reproduce the analyses presented in this study are available at: https://github.com/mbergerdd/airport-induced-landside-traffic (accessed on 11 August 2026).

Funding

This research received no external funding.

Institutional Review Board Statement

Not applicable.

Informed Consent Statement

Not applicable.

Data Availability Statement

The original contributions presented in this study are included in the article/Supplementary Material. Further inquiries can be directed to the corresponding author.

Conflicts of Interest

The author declares no conflicts of interest.

Abbreviations

The following abbreviations are used in this manuscript:
GHGGreenhouse Gases
APAir Pollutants
ACCAccidents
NOINoise
WTTFuel Supply/Well-to-Tank Emissions
HABHabitat Damage
LCVLight Commercial Vehicles
HGVHeavy Goods Vehicles

Notes

1
E.g., Destatis (https://www.destatis.de (accessed on 12 July 2026)) in Germany, Eurostat or EASA for Europe, and Federal Aviation Administration or the Bureau of Transportation Statistics (https://www.bts.gov/topics/airlines-airports-and-aviation (accessed on 12 July 2026)) for the U.S.
2
See: http://www.mobilitaet-in-deutschland.de (accessed on 12 July 2026).
3
EU-28 represents the 28 member states of the European Union in 2019 (including Great Britain).
4
The spread among these values can be significant, as exemplary cost values for EU-28 show. A small car of Euro 4 emission class, for example, induces air pollution costs of EUR 0.96 per pkm on motorways, but EUR 1.09 on urban roads. A Euro V Diesel heavy goods vehicle between 7.5 and 12 t maximum weight induces air pollution costs of EUR 1.55 per tkm on motorways but EUR 4.93 on urban roads, in comparison to a vehicle with more than 32 tons maximum weight, which costs EUR 0.68 per tkm on motorways and EUR 1.08 on urban roads. Variations of these costs also exist among the vessel types of public transport. A standard urban bus with a diesel engine and Euro V emission class, for example, generates EUR 0.35 per pkm on motorways and EUR 1.16 on urban roads, compared with EUR 0.03 and EUR 0.12 for a Euro IV emission class vehicle [16].
5
E.g., because a passenger on a flight from Berlin via Frankfurt to Singapore is counted as a boarding passenger in both Berlin and Frankfurt.
6
Ref. [29] provides figures of 124.44 mill. total and 80.76 mill. originating passengers on international flights in 2019, but no values for intra-Germany connections, with total departing passengers of 23.11 million. With the assumption that the share of originating passengers is the same or even higher on domestic flights, a value of 75% seems reasonable.
7
Ref. [5] shows around 24% metro and train, 2.5% bus, and 5.5% a combination of both.
8
Regarding reachable airports within a given travel time.
9
Calculation by adding up figures for trips (column G “Fahrten”), distances (column I “Kilometer”), and transported tons of freight (column K “Tonnen”). Comparing average vehicle costs with average costs per tkm from the EU Handbook, the average load per trip in 2023 was 11.42 tons for Germany and 12.33 tons for Europe (EU-27).
10
With 149,243,940 traffic units (including cargo and mail) at German airports per year ([29], Table 1.1.1) and 253,500 direct employees [38]) (excluding aircraft manufacturers), this results in a comparable value of 0.00170.
11
According to company information, 27.6% of employees at Munich Airport work part-time, for example, and just under 9% do so at Cologne/Bonn Airport. For the latter, it is also stated that 20% of working hours at the airport company can be carried out in the “mobile office”, i.e., at home or on the move, though without specifying how and to what extent this option is used. Neither the type and structure of the part-time quotas nor the exact working time quota is known [39,41].
12
By legal and collectively agreed rest period regulations, which often allow several consecutive days off after flight operations lasting several days (see Regulation (EU) No. 83/2014, section ORO.FTL.105).
13
Ref. [49], for example, lists more than 130 different product groups from 3800 suppliers.
14
The latter mainly affects noise and air pollution costs.

References

  1. Mahesh, S.; Calvert, S.C. Decarbonizing airport access: A review of landside transport sustainability. Transp. Res. Part D Transp. Environ. 2025, 140, 104625. [Google Scholar] [CrossRef] [Scilit]
  2. Pasha, M.; Hickman, M. Airport Employees Ground Accessibility: Review and Assessment. In Proceedings of the Australasian Transport Research Forum, Auckland, New Zealand, 27–29 November 2017. [Google Scholar]
  3. Kazda, A.; Caves, R.E. (Eds.) Airport Design and Operation; Emerald Group Publishing Limited: Leeds, UK, 2017. [Google Scholar] [CrossRef] [Scilit]
  4. Humphreys, I.; Ison, S. Changing airport employee travel behaviour: The role of airport surface access strategies. Transp. Policy 2005, 12, 1–9. [Google Scholar] [CrossRef] [Scilit]
  5. Colovic, A.; Pilone, S.G.; Kukić, K.; Kalić, M.; Dožić, S.; Babić, D.; Ottomanelli, M. Airport Access Mode Choice: Analysis of Passengers’ Behavior in European Countries. Sustainability 2022, 14, 9267. [Google Scholar] [CrossRef] [Scilit]
  6. Kristoffersson, I.; Berglund, S. Modelling connection trips to long-distance travel. Eur. Transp. Res. Rev. 2022, 14, 30. [Google Scholar] [CrossRef] [Scilit]
  7. Paliska, D.; Drobne, S.; Borruso, G.; Gardina, M.; Fabjan, D. Passengers’ airport choice and airports’ catchment area analysis in cross-border Upper Adriatic multi-airport region. J. Air Transp. Manag. 2016, 57, 143–154. [Google Scholar] [CrossRef] [Scilit]
  8. Profillidis, V.A.; Botzoris, G.N. Modeling of Transport Demand: Analyzing, Calculating, and Forecasting Transport Demand; Elsevier: Amsterdam, The Netherlands, 2019. [Google Scholar]
  9. Follmer, R.; Gruschwitz, D. Mobility in Germany—Short Report; Federal Ministry of Transport and Digital Infrastructure (BMVI): Berlin, Germany, 2019. [Google Scholar]
  10. Koszowski, C.; Gerike, R.; Hubrich, S.; Götschi, T.; Pohle, M.; Wittwer, R. Active Mobility: Bringing Together Transport Planning, Urban Planning, and Public Health. In Towards User-Centric Transport in Europe; Müller, B., Meyer, G., Eds.; Series Title: Lecture Notes in Mobility; Springer International Publishing: Cham, Switzerland, 2019; pp. 149–171. [Google Scholar] [CrossRef] [Scilit] [PubMed]
  11. Rosik, P.; Wójcik, J. Transport Infrastructure and Regional Development: A Survey of Literature on Wider Economic and Spatial Impacts. Sustainability 2023, 15, 548. [Google Scholar] [CrossRef] [Scilit]
  12. Ecoplan/Infras. Die Nutzen des Verkehrs [The Benefits of Transport]; Technical Report; Ecoplan/Infras: Bern, Switzerland, 2006. [Google Scholar]
  13. Tardieu, L. Economic evaluation of the impacts of transportation infrastructures on ecosystem services. In Handbook on Biodiversity and Ecosystem Services in Impact Assessment; Geneletti, D., Ed.; Edward Elgar Publishing: Camberley, UK, 2016. [Google Scholar] [CrossRef] [Scilit]
  14. Schröder, D.; Kirn, L.; Kinigadner, J.; Loder, A.; Blum, P.; Xu, Y.; Lienkamp, M. Ending the myth of mobility at zero costs: An external cost analysis. Res. Transp. Econ. 2023, 97, 101246. [Google Scholar] [CrossRef] [Scilit]
  15. Victoria Transport Policy Institute. Transportation Cost and Benefit Analysis II—Literature Review; Technical Report; Victoria Transport Policy Institute: Victoria, BC, Canada, 2022. [Google Scholar]
  16. Schroten, A.; Essen, H.V.; Wijngaarden, L.V.; Sutter, D.; Parolin, R.; Fiorello, D.; Brambilla, M.; Maffii, S.; El Beyrouty, K.; Fermi, F.; et al. Handbook on the External Costs of Transport: Version 2019. 2019. Available online: https://cedelft.eu/publications/handbook-on-the-external-costs-of-transport-version-2019/ (accessed on 11 February 2023).
  17. Ecoplan/Infras. Externe Effekte des Verkehrs 2010—Monetarisierung von Umwelt-, Unfall- und Gesundheitseffekten [External Effects of Transport 2010—Monetisation of Environmental, Accident and Health Effects]; Technical Report; Ecoplan/Infras: Bern, Switzerland, 2014. [Google Scholar]
  18. Teodorović, D.; Janić, M. Transportation Engineering: Theory, Practice, and Modeling, 2nd ed.; Butterworth-Heinemann: Cambridge, UK, 2022. [Google Scholar]
  19. Papagrigoriou, N.; Palantzas, G.; Nalmpantis, D. Airports and environmental sustainability: A review. E3S Web Conf. 2023, 436, 11006. [Google Scholar] [CrossRef] [Scilit]
  20. Greer, F.; Rakas, J.; Horvath, A. Airports and environmental sustainability: A comprehensive review. Environ. Res. Lett. 2020, 15, 103007. [Google Scholar] [CrossRef] [Scilit]
  21. Budd, T.; Ison, S.; Ryley, T. Airport surface access in the UK: A management perspective. Res. Transp. Bus. Manag. 2011, 1, 109–117. [Google Scholar] [CrossRef] [Scilit]
  22. Fraport. Zahlen, Daten und Fakten [Facts and Figures]. Available online: https://www.fraport.com/de/konzern/ueber-uns/zahlen--daten-und-fakten1.html (accessed on 15 May 2019).
  23. Munich Airport. Statistischer Jahresbericht 2019—Luftverkehrsstatistik [Statistical Annual Report 2019—Air Transport Statistics]; Technical Report; Munich Airport: Munich, Germany, 2020. [Google Scholar]
  24. ADV. Airport Travel Survey 2018—Zahlen, Daten, Fakten [Airport Travel Survey 2018—Facts and Figures]; Technical Report; ADV: Berlin, Germany, 2018. [Google Scholar]
  25. Duesseldorf Airport. Geschäftsbericht 2014 [Annual Report 2014]; Technical Report; Duesseldorf Airport: Düsseldorf, Germany, 2014. [Google Scholar]
  26. Lieshout, R. Measuring the size of an airport’s catchment area. J. Transp. Geogr. 2012, 25, 27–34. [Google Scholar] [CrossRef] [Scilit]
  27. Bünger, D.B.; Matthey, D.A. Methodenkonvention 3.0 zur Ermittlung von Umweltkosten—Kostensätze [Methodological Convention 3.0 for the Assessment of Environmental Costs—Cost Rates]; Technical Report; Umweltbundesamt: Dessau, Germany, 2019. [Google Scholar]
  28. Eurostat. Air Transport of Goods by Country (Yearly Data) (avia_pa, avia_go); Eurostat: Luxembourg, 2024. [Google Scholar] [CrossRef]
  29. Destatis. Luftverkehr auf Hauptverkehrsflughäfen—Fachserie 8 Reihe 6.1—2019 [Air Transport at Major Airports—Series 8, Volume 6.1—2019]; Destatis: Wiesbaden, Germany, 2019; Volume 6. [Google Scholar]
  30. ACI Europe. Airport Industry Connectivity Report 2004–2014; Technical Report; ACI Europe: Brussels, Belgium, 2014. [Google Scholar]
  31. Fraport AG. Frankfurt Airport—Luftverkehrsstatistik 2019 [Frankfurt Airport—Air Transport Statistics 2019]; Technical Report; Fraport AG: Frankfurt am Main, Germany, 2019. [Google Scholar]
  32. Vespermann, J.; Wald, A. Intermodal integration in air transportation: Status quo, motives and future developments. J. Transp. Geogr. 2011, 19, 1187–1197. [Google Scholar] [CrossRef] [Scilit]
  33. Wen, T.; Mao, H.; Pan, Y.; Chen, Z.; Zhang, T.; Zhou, G.; Li, Y. Analytical model of airport passenger transportation transfer mode choice based on air travel characteristics. In Proceedings of the Seventh International Conference on Traffic Engineering and Transportation System (ICTETS 2023), Bellingham, WA, USA, 22–24 September 2023; p. 166. [Google Scholar] [CrossRef] [Scilit]
  34. Berster, P.; Wilken, D. Flughafenwahl und Einzugsgebiete der Internationalen Verkehrsflughäfen Deutschlands [Airport Choice and Catchment Areas of Germany’s International Commercial Airports]; DGLR: Bonn, Germany, 2007. [Google Scholar]
  35. Sun, X.; Wandelt, S.; Hansen, M. Airport Road Access at Planet Scale using Population Grid and Openstreetmap. Netw. Spat. Econ. 2020, 20, 273–299. [Google Scholar] [CrossRef] [Scilit]
  36. KBA. Güter VE 10, Zeitreihe 2010–2022 [Freight Transport VE 10, Time Series 2010–2022]; KBA: Flensburg, Germany, 2024. [Google Scholar] [CrossRef]
  37. Eurostat. Road Freight Transport by Maximum Permissible Laden Weight (MPLW) of Vehicle (tkm, Vehicle-km, Journeys)—Annual Data. 2024. Available online: https://ec.europa.eu/eurostat/databrowser/product/page/ROAD_GO_TA_MPLW (accessed on 22 October 2025).
  38. Wilke, P.; Schmid, K.; Gröning, S. Branchenanalyse Luftverkehr: Entwicklung von Beschäftigung und Arbeitsbedingungen [Industry Analysis Air Transport: Trends in Employment and Working Conditions]; Study/edition Hans-Böckler-Stiftung: Düsseldorf, Germany, 2016; ISBN 978-3-86593-233-4. [Google Scholar]
  39. Flughafen München GmbH. Beschäftigtenerhebung Flughafen München 2018 [Munich Airport Employment Survey 2018]; Technical Report; Flughafen München GmbH: München, Germany, 2019. [Google Scholar]
  40. Hamburg Airport. Jahresstatistik 2021 [Statistical Report 2021]; Technical Report; Hamburg Airport: Hamburg, Germany, 2021. [Google Scholar]
  41. Flughafen Köln/Bonn GmbH. Nachhaltigkeitsbericht 2018 [Sustainability Report 2018]; Technical Report; Flughafen Köln/Bonn GmbH: Köln, Germany, 2018. [Google Scholar]
  42. MDF AG. Pressemitteilung—Weiter Steigende Beschäftigungszahlen an den Mitteldeutschen Flughäfen Leipzig/Halle und Dresden [Press Release—Continuing Increase in Employment at Leipzig/Halle and Dresden Airports]; MDF AG: Leipzig, Germany, 2019. [Google Scholar]
  43. Ammerl, H.; Seufert, T.; Daniel, P.; Krsak, V. Prognose der Landseitigen Verkehre für den Flughafen Köln/Bonn [Forecast of Landside Traffic for Cologne/Bonn Airport]; Technical Report; Obermeyer Group: München, Germany, 2016. [Google Scholar]
  44. bpb Federal Agency for Civic Education. Arbeitszeit und Arbeitsvolumen [Working Hours and Workload]; bpb Federal Agency for Civic Education: Bonn, Germany, 2020. [Google Scholar]
  45. Bazargan, M. Airline Operations and Scheduling, 2nd ed.; Ashgate: Burlington, VT, USA, 2010. [Google Scholar] [CrossRef] [Scilit]
  46. Pompl, W. (Ed.) Luftverkehr: Eine ÖKonomische und Politische Einführung [Air Transport: An Economic and Political Introduction], 5th ed.; Springer: Berlin/Heidelberg, Germany, 2007. [Google Scholar] [CrossRef] [Scilit]
  47. Nobis, C.; Kuhnimhof, T.; Follmer, R.; Bäumer, M. Mobilität in Deutschland—Zeitreihenbericht 2002–2008–2017 [Mobility in Germany—Time Series Report 2002–2008–2017]; Technical Report; BMVI: Berlin, Germany, 2019. [Google Scholar]
  48. Mennicken, E.; Lemoy, R.; Caruso, G. Road network distances and detours in Europe: Radial profiles and city size effects. Environ. Plan. B Urban Anal. City Sci. 2024, 51, 174–194. [Google Scholar] [CrossRef] [Scilit]
  49. Munich Airport. Integrated Report 2022; Munich Airport: Munich, Germany, 2024. [Google Scholar]
  50. Umweltbundesamt; Bünger, D.B.; Matthey, D.A. Methodenkonvention 3.0 zur Ermittlung von Umweltkosten—Methodische Grundlagen [Methodological Convention 3.0 for the Assessment of Environmental Costs—Methodological Foundations]; Technical Report; Umweltbundesamt: Dessau, Germany, 2018. [Google Scholar]
  51. INFRAS. Aktualisierung der Berechnungen von Umwelt-, Unfall- und Gesundheitseffekten des Strassen-, Schienen-, Luft- und Schiffsverkehrs 2010 bis 2015 [Update of the Calculations of Environmental, Accident and Health Effects of Road, Rail, Air and Waterborne Transport, 2010–2015]; Technical Report; INFRAS: Bern, Switzerland, 2018. [Google Scholar]
Figure 1. Model scheme for determining external costs through airport-induced landside traffic.
Systems 14 01002 g001
Figure 2. Allocation of employee- and supplier-related external costs to passenger and cargo traffic units in order to calculate total external costs.
Systems 14 01002 g002
Figure 3. Marginal changes in external costs per traffic unit and in total per year by parameter variation in the German baseline scenario.
Systems 14 01002 g003
Figure 4. Share of total external costs of different scenarios compared to the baseline scenario.
Systems 14 01002 g004
Figure 5. Distribution of mode-specific external cost factors among European countries.
Systems 14 01002 g005
Table 1. External cost factors for Germany in €cent2019 per functional unit according to [16].
Transport ModeFunctional UnitGHGAPACCNOIWTTHAB
Carvkm1.971.2010.230.520.731.08
LCVvkm2.682.888.780.680.951.13
HGVvkm6.5012.2022.003.513.192.90
Busvkm8.4220.5230.383.613.891.74
Railvkm10.3736.6133.4495.7480.4150.65
Table 2. Definition of variables used in Equations (1)–(4).
SymbolDescriptionUnit
iTransport mode i–
jTransport group j–
V i j Traffic volume generated by group j using transport mode ivkm
VTotal traffic volume induced by airport-related landside transportvkm
C i j External costs by group j using transport mode i€
C j Total external costs per group j€
N j Number of traffic units of group jtu
m i j Modal split, i.e., the share of transport mode i within group j–
d i j Average one-way trip distancekm
t f i j Trip factor (number of trips per traffic unit)–
b i j Average vehicle load factor (traffic units transported per vehicle)tu/vehicle
c f i External cost factor of transport mode i€/vkm
MSet of transport modes–
GSet of transport groups–
Table 3. Definition of variables used in Equations (5)–(7).
SymbolDescriptionUnit
T j Number of transfer traffic units of group jtu
H j Number of total handled traffic units of group jtu
HNumber of total handled traffic unitstu
C j total Total external costs per group j after allocation of total costs for employees and suppliers€
CTotal external costs of originating passengers and cargo€
c j External costs per originating traffic unit of group j€/tu
Note: In these equations, j ∈ { Passengers , Cargo } .
Table 4. Mobility parameters of originating passengers used in the German baseline scenario.
Motor. Indiv. Transp.Public TransportSourceYearStatus *
Self-Driven Car, Taxi, Rental CarCar Drop-OffBus and OthersLocal and Long-Distance Rail
Modal split [%]35354.525.5[5,24,32]2018–2022d
Occupancy [p/veh]1.51.518.7100[9]2019d
Trip factor [-]2422--a
Single trip length [km]50[7,34]2016d
* d = derived, a = assumed.
Table 5. Mobility parameters of air cargo used in the German baseline scenario.
Heavy Goods VehicleSourceYearStatus *
Modal split [%]100[36,37]2024d
Occupancy [t/veh]12.5[16,36]2019–2024d
Trip factor [-]2--a
Single trip length [km]138[36,37]2024d
* d = derived, a = assumed.
Table 6. Employee and traffic figures at selected German airports in 2019.
AirportNumber of Employees at AirportTransported Traffic Units (Passengers and Cargo 7 in 2019)Amount of Employee Work-Years per Traffic Unit
FRA81,000 145,650,8000.00177
MUC38,090 225,872,1000.00147
DUS20,300 313,063,8900.00155
HAM15,771 48,776,3500.00180
CGN14,800 510,105,4100.00146
LEJ + DRS13,500 68,502,7800.00159
per tu weighted average0.00164
Abbreviation of the airports according to the airport designation used by IATA: Frankfurt/Main (FRA), Munich (MUC), Düsseldorf (DUS), Leipzig (LEJ), Dresden (DRS), Hamburg (HAM), Stuttgart (STR) und Cologne/Bonn (CGN). Values from: 1 [22], 2 [39], 3 (FDG 2020b, S. 2), 4 [40], 5 [41], 6 [42]; 7 Values of traffic units from: [29].
Table 7. Assumptions for the boundary conditions of airport employees in Germany.
Work days per year260
Vacation days per yer30
Public holidays and sick days per year20
Factor for part-time and remote work0.8
Total days with commute to workplace per year168
Table 8. Distribution of the one-way distance between home and workplace of employees at the Frankfurt, Munich, and Cologne/Bonn airport locations.
10 km15 km20 km25 km30 km
FRA172814041
MUC020142340
CGN05072720
Based data on the places of residence of employees at the respective airport locations from various sources. In the case of Munich Airport (MUC) and Cologne/Bonn Airport (CGN), only the names of the towns/districts were available. Therefore, the average air distance to the presumed center of the population of the district was determined, and a detour factor of 1.5 was applied. The data for Frankfurt/Main Airport (FRA) comes from [22], for MUC from: [39] and for CGN from: [41].
Table 9. Mobility parameters of airport employees used in the German baseline scenario.
Transport ModeSourceYearStatus *
CarBusTrain
Modal split [%]67528[2,21,31,43]2019d
Occupancy [p/veh]1.218.7100[9]2019d
Single trip length [km]25[22,39,41]2019d
Empl. years per tu [ewy/tu]0.00164Table 62019d
Trip factor [-]336[44]2020d
* d = derived.
Table 10. Mobility parameters of suppliers and business visitors used in the German baseline scenario.
CarLCVHGVSourceYearStatus *
Modal split [%]255025--a
Single trip length [km]50--a
Trip frequency1 trip per 100 traffic units--a
* a = assumed.
Table 11. Traffic volume (V) of induced land traffic by originating air passengers and air cargo in the German baseline scenario.
PassengersCargo
Car SelfCar Drop-OffTrainBusHGV
V per tu in vkm18.6753.330.270.282.21
Total annual V in million vkm17505000252540
Table 12. Traffic volume (V) of induced land traffic by airport employees in the German baseline scenario.
CarTrainBus
V per tu in vkm8.630.0290.030
V in million vkm128644
Table 13. Traffic volume (V) of induced land traffic by airport suppliers and business visitors in the German baseline scenario.
CarLCVHGV
V per tu in vkm0.210.420.21
V in million vkm31.2662.5131.26
Table 14. External costs of induced land traffic per traffic unit in €2019 in the German baseline scenario.
GHGAPACCNOIWTTHABTotal
Passengers1.471.027.530.650.750.9212.34
Cargo0.140.270.490.090.070.061.12
Employees0.180.120.900.070.090.111.47
Suppliers0.030.050.100.010.010.010.22
Table 15. Annual external costs of induced land traffic in Germany per traffic unit group in million €2019 in the German baseline scenario.
GHGAPACCNOIWTTHABTotal
Passengers137.7295.61706.3560.5170.6185.861156.66
Cargo2.584.858.741.581.271.1520.18
Employees26.1617.96134.3211.0413.0416.10218.61
Suppliers4.377.3815.561.831.801.9332.88
Table 16. Total external costs per traffic unit for passengers and cargo in €2019 in the German baseline scenario.
CostEmployeesSuppliersTotal
Passengers12.341.470.2214.03
Cargo1.12 2.81
Table 17. Total annual external costs for all passengers and cargo in million €2019 in the German baseline scenario.
CostEmployeesSuppliersTotal
Passengers1156.66183.4127.581367.64
Cargo20.1835.215.3060.69
1428.32
Table 18. Contribution of individual externalities to total external costs.
GHGAPACCNOIWTTHAB
12.0%8.8%60.6%5.3%6.1%7.4%
Note: Percentages may not sum to exactly 100% due to rounding of individual values.
Table 19. Relative change of external costs per externality under fundamental parameter variation in the German baseline scenario.
GHGAPACCNOIWTTHABTotal
Ewy * −10%−1.53%−1.43%−1.55%−1.47%−1.50%−1.53%−1.53%
SpV ** −10%−0.26%−0.59%−0.18%−0.24%−0.21%−0.18%−0.23%
* Ewy = Employee workyears; ** SpV = Supplier Transport Volume.
Table 20. Scenario overview for sensitivity analysis.
ScenarioGroupDescription
aPaxShift to 50% Public Transport
bPaxShift to 20% Public Transport
cPaxReduction in Car drop-off by −10%
dPax+ Empl.Shift of 10% absolute from Car to Public Transport
ePax+ Empl.Shift of 10% absolute from Public Transport to Car
fAllScenario c + d + Vehicle Occupancy (Pax, Cargo, Employees) +10% + Employee Trip Factor −10% and Supplier Distances −10%
gAllAs Scenario f but with opposite signs
Table 21. Relative change of external costs per externality under parameter variation (in %).
Scenarioabcdefg
GHG−19.0%+12.7%−2.9%−12.4%+12.4%−23.8%+30.4%
AP−10.6%+7.1%−2.4%−6.8%+6.8%−18.4%+23.3%
ACC−20.1%+13.4%−3.0%−13.1%+13.1%−24.5%+31.3%
NOI+6.4%−4.2%−1.7%+4.6%−4.6%−7.7%+9.7%
WTT−1.2%+0.8%−2.1%−0.4%+0.4%−12.5%+15.9%
HAB−11.2%+7.5%−2.6%−7.1%+7.1%−18.9%+24.1%
Total−15.9%+10.6%−2.8%−10.3%+10.3%−21.9%+27.9%
Table 22. Total external costs of scenarios (in billion €2019).
ScenarioBasicabcdefg
Totals1.431.201.581.391.281.581.121.83
Disclaimer/Publisher’s Note: The statements, opinions and data contained in all publications are solely those of the individual author(s) and contributor(s) and not of MDPI and/or the editor(s). MDPI and/or the editor(s) disclaim responsibility for any injury to people or property resulting from any ideas, methods, instructions or products referred to in the content.