1. Introduction
Green enterprises are critical drivers for China to achieve the strategic goals of “carbon peaking and carbon neutrality”, and their sound development is directly linked to the effectiveness of economic and social green transition and systemic financial stability. With the further advancement of the “dual carbon” goals, the green industry has embraced significant development opportunities, and the scale of financing instruments, such as green credit and green debt, has continued to expand. However, green enterprises are generally characterized by large investment scales, long project cycles and rapid technological iteration, leading to a more complex debt risk structure. By the end of 2024, the total accounts receivable of 228 A-share environmental protection listed companies reached nearly 349.2 billion yuan, among which 48 companies had accounts receivable exceeding their annual operating revenue. On the other hand, traditional energy-intensive enterprises actively transforming into new energy sectors face “double high” risks of policy and carbon costs. Taking Taiwan Cement Group as an example, its traditional business is under direct cost pressure from future carbon tax imposition, while its large-scale green transition strategies, including developing energy storage and low-carbon building materials, have generated considerable revenue but also brought sustained huge capital expenditures and technological iteration risks. Existing studies have pointed out that an effective risk early-warning mechanism is a prerequisite for preventing debt crises and ensuring sustainable corporate financing [
1]. Therefore, accurately predicting the financial distress risk of green enterprises is not only an inherent requirement for their own stable operation but also a crucial link in maintaining the stability of the green financial system and supporting the smooth implementation of the “dual carbon” strategy.
Existing early-warning models are mainly constructed based on macroeconomic and financial indicators, while the financing and operation activities of green enterprises are directly exposed to multiple climate-related risks [
2], such as policy adjustments, technological iteration and market fluctuations. For instance, reforms of carbon pricing mechanisms, substitution shocks from clean energy technologies, and operational disruptions caused by extreme climate events may affect corporate cash flow and asset value, thereby transmitting to debt-servicing capacity. Such risk transmission mechanisms pose substantial challenges to traditional prediction models centered on historical financial data.
Existing studies have paid attention to the impact of climate risk on green enterprises, such as analyzing its constraint on corporate leverage from the perspective of physical risk exposure [
3] or exploring risk differences among enterprises in the energy transition through transition risk scoring [
4]. In the energy sector, renewable energy enterprises are relatively less affected by climate-related capital costs, and green enterprises’ supply chains are less damaged by physical climate risks [
5]. However, most existing studies focus on external climate risk exposure and fail to fully characterize enterprises’ inherent adaptability and resilience, namely “climate resilience”. Climate resilience reflects enterprises’ proactive ability to mitigate climate shocks and seize transition opportunities through strategic adjustment, operational optimization and technological innovation, serving as a key non-financial dimension affecting long-term financial robustness. In recent years, the maturity of NLP and machine learning has made it technically feasible to quantify climate resilience from corporate annual reports and other texts, creating a new research opportunity for building more comprehensive default prediction models. Thus, this paper explores the impact mechanism and predictive value of climate resilience on the financial distress risk of green enterprises from the perspective of climate resilience.
Considering the sensitivity of green enterprises’ debt to climate risk and the forward-looking nature of climate risk, constructing climate indicators related to climate risk from corporate annual reports written by senior management is more beneficial for predicting green enterprises’ financial distress [
6]. From the perspective of the green enterprise debt market, the market is more sensitive to bad news than good news, meaning bad news exerts a greater impact. From the perspective of climate risk, first, climate risk is future-oriented and has a stronger forward-looking nature than pure financial indicators. Second, the wide influence and fast dissemination of annual report information enable the green enterprise debt market to confirm climate-related bad news in annual reports in a more timely manner. Therefore, corporate annual reports can timely and rapidly reflect the debt market’s sensitivity to bad news and better predict green enterprises’ financial distress.
How do green enterprises’ annual reports predict their financial distress? Annual reports can reflect management’s attention and attitude toward climate risk, thus exerting a predictive function on green enterprises’ financial distress. Specifically, on the one hand, high climate risk indicates an unfavorable climate environment for green enterprises. Given the debt market’s high sensitivity to bad news, creditors will pay more attention to climate risk [
7]. If green enterprises attach sufficient importance to such risk and provide detailed explanations in annual reports with more mentions of climate-related terms, it will alleviate creditors’ concerns, boost their confidence and support the stability of the debt market. Conversely, it will cause creditors to lose confidence, demand early debt redemption and increase green enterprises’ financial distress. On the other hand, when the climate environment is unfavorable to green enterprises, creditors will be more cautious in purchasing green debt [
7]. Only when green enterprises objectively describe current operational difficulties in annual reports and adopt proactive strategies to address climate risk can they regain creditors’ confidence and maintain debt financing. In contrast, a passive or indifferent attitude will make financing more difficult, leading to an oversupply of green debt and insufficient demand from debt holders, which may break the capital chain and trigger financial distress. Thus, the attention and attitude toward climate risk reflected in green enterprises’ annual reports can provide forward-looking information to predict their financial distress risk.
The potential incremental contributions of this paper are as follows:
(1) It explores and constructs a prediction framework for the impact of climate risk on green enterprises’ debt risk, broadening the analytical framework of existing Financial Distress prediction research. The existing literature mainly uses model and indicator analysis methods, both of which over-rely on financial and economic indicators and ignore the predictive role of climate risk-related information in annual reports. Incorporating climate indicators as one of the predictive indicators enriches the financial distress prediction system from different perspectives. Climate indicators can convey future changes in the debt market in a more timely manner and serve as leading indicators of market economic changes, meeting the demand for faster access to debt market change information due to the market’s higher sensitivity to bad news;
(2) It subdivides financial distress prediction into the dimension of green enterprises’ financial distress prediction. Few existing studies on corporate financial distress prediction separately focus on the green debt sector. This paper subdivides the prediction field into the green debt level, providing a new direction for the subdivision of financial distress prediction research;
(3) It provides policy implications for preventing green enterprises’ financial distress. Green enterprises’ financial distress threatens the green and sustainable development strategy, and improving the default prediction system is a key part of this strategy. This paper verifies the predictive value of the climate indicators related to climate risk for default, providing new ideas for risk early warning, helping regulators enrich early-warning data, improve prediction systems, identify default risks in a timely manner, and ensure the normal operation of green enterprises.
The structure of this study is arranged as follows:
Section 2 combs the literature related to corporate debt risk prediction, climate resilience indicator measurement and the economic consequences of climate change, reviews existing studies and constructs the research framework.
Section 3 focuses on the research design, including research methods, sample selection, variable measurement, data sources and data preprocessing.
Section 4 presents an empirical result analysis, including machine learning model comparison, model interpretability analysis and multi-dimensional analysis.
Section 5 summarizes the core conclusions of this study.
Section 6 discusses the theoretical and practical implications of this study and puts forward corresponding policy suggestions based on the conclusions.
2. Literature Review
2.1. Corporate Debt Risk Prediction
In the field of corporate debt default risk prediction, existing research models are mainly divided into traditional statistical models and machine learning methods. Traditional statistical models take financial indicators as the core inputs and focus on depicting linear relationships of debt default. Their core logic is to achieve a preliminary prediction of default risk by setting linear quantitative rules or probability distribution assumptions. Mvula analyzed 56 performing and non-performing assets of a privatized commercial bank in Tanzania, using multiple linear discriminant analysis to predict the company’s future performance and assess credit risk. However, multiple discriminant analysis requires data to follow a normal distribution, which is difficult to meet in reality, so this method has not been widely promoted [
8]. Costa et al. adopted the logistic regression model to evaluate the credit scoring data of Portuguese financial institutions and predict the default risk of consumer loans. The Logit model predicts corporate financial distress and performs significantly better than linear discriminant analysis. However, due to the high correlation of financial data, the Logit model still faces problems, such as multicollinearity in variable selection. To solve the problem of high dependence on financial data [
9], Aguilera used Principal Component Regression to address multicollinearity and outliers in financial data [
10]. Ma and Jiang predicted China’s local government debt risk based on the AHP-TOPSIS method. Sohn et al. proposed a fuzzy logistic regression model, which can predict the possibility of loan default based on enterprises’ technical conditions [
11]. Classical traditional econometric models are supported by clear economic theories and have practical value in the regulatory context, emphasizing interpretability and robustness. However, in the context of rapid data growth and high-dimensional and non-linear data structures, traditional models are prone to overfitting and poor generalization ability, limiting their further application. Therefore, to compensate for this defect, artificial intelligence models have been widely used by scholars with the rapid development of intelligent technology.
Machine learning models mainly construct prediction rules by adaptively learning complex patterns in data. Their core logic is to automatically identify interactions and non-linear correlations among multiple features, such as financial indicators, market information, text public opinion and time-series behaviors, so as to achieve more refined and generalizable judgment of default risk. Wang et al. collected the financial data of 239 Chinese companies and proposed RSB-SVM, a new hybrid ensemble algorithm, to predict corporate credit risk [
12]. Zhu et al. studied the financial and non-financial data of 88 enterprises, compared the prediction results of logistic regression, artificial neural network, and hybrid models for credit risk of small and medium-sized enterprises, and found that the combination of logistic regression and neural network achieved better prediction performance [
13]. Wang et al. optimized the parameters of the XGBoost model using grid search and K-fold cross-validation, and the results showed that the optimized XGBoost model had higher accuracy in predicting China’s credit debt default risk [
14]. Wang et al. established a LightGBM model to predict the financing risk profile of 186 enterprises [
15]. Zedda compared 35,535 cases across seven business sectors of Italian small and medium-sized enterprises, using traditional models (Logit model) and machine learning models (XGBoost model) to predict loan risk, and found that machine learning models had higher prediction accuracy [
16]. Mo et al. used a new ensemble learning model, SMOTE-ENN-RFE-RF-RSC, to identify corporate credit risk, and the results showed that the model could solve problems such as “misidentification” and “heterogeneity of industry credit risk characteristics” [
17]. Teles et al. compared the performance of random forest and support vector regression in corporate credit risk assessment. The results showed that random forest ran faster, was easier to operate and had higher prediction accuracy [
18].
Existing studies show that machine learning models have significant advantages in prediction accuracy, but their internal decision-making mechanisms often lack interpretability, which further restricts the reliability and acceptability of models in application scenarios such as financial risk control and debt default that emphasize interpretability and robustness. To improve the prediction ability while enhancing the model stability and interpretability, current research mostly adopts the technical path of “complementation of multiple base learners” combined with “strategic integration”. Specifically, a hybrid prediction framework can be constructed by integrating traditional econometric models and machine learning models. Such model fusion methods can not only suppress the instability of a single model but also achieve a better balance between prediction performance and mechanism interpretability, thus forming comprehensive predictive capabilities beyond single models.
2.2. Measurement Methods of Climate Resilience Indicator
Currently, there is no unified measurement method in research on climate indicator construction. Scholars have formed diverse indicator design paradigms based on different research perspectives and data types, mainly divided into the following aspects. First is measuring climate risk based on a single climate-related index. Some scholars use climate-related indices such as temperature and precipitation [
19,
20], the Palmer Drought Severity Index [
21], flood depth [
22], and sea level rise [
23] to measure climate risk. This type of measurement method has a single data source and fails to fully consider the heterogeneity of risk exposure among enterprises. Meanwhile, other studies generate dummy variables for climate risk information disclosure or use greenhouse gas emission data as proxy indicators of climate risk [
24]. Although these methods can achieve firm-level measurement, they still cannot comprehensively reflect the connotation of climate risk. Second, the climate risk disclosure system is constructed based on the Task Force on Climate-related Financial Disclosures (TCFD) [
25]. This framework divides climate resilience into physical risk and transition risk. Physical risk refers to damage to corporate assets and infrastructure caused by extreme climate events; transition risk refers to the potential impact on corporate operations and strategy due to changes in climate policies, technological innovation or market demand. With the TCFD framework, enterprises can systematically analyze the impact of climate risk on financial health and share such information with investors and regulators. Third, with the continuous development of big data technology, more and more scholars use natural language processing (NLP) technology to assess corporate climate risk. Compared with traditional content analysis methods, NLP shows excellent ability in text parsing, can more accurately capture the essence of text, and thus improve the accuracy and credibility of indicator construction. Specifically, Engle et al. took the lead in creating a climate news index based on climate change reports in media such as
The Wall Street Journal, combined with content analysis as a proxy indicator for measuring firm-level climate change risk [
26]. In addition, among NLP-based studies, some scholars take the “Management Discussion and Analysis” (MD&A) section of corporate financial reports as the core analysis text, extract expressions related to management’s attention to climate issues and quantify them to form management climate attention indicators. It is worth noting that sample enterprises disclose climate risk information not only in the MD&A section but also in chapters such as the company’s future development plan, and the practice of capturing risks through annual reports has been widely recognized in the research community. For example, Nagar and Schoenfeld constructed an indicator of enterprises’ exposure to weather by calculating the frequency of the word “weather” in corporate annual reports [
27], but this indicator mainly targets natural disasters such as hurricanes and has a single coverage. Sautner et al. and Li et al. took earnings conference call transcripts of US listed companies as text analysis sources and measured corporate climate risk by calculating the word frequency of various climate risk keywords [
28,
29]. Du et al. took A-share listed companies in China from 2007 to 2020 as research objects and constructed a climate risk dictionary suitable for the Chinese context with text analysis and machine learning technology. Berkman et al. constructed corporate climate change risk indicators by analyzing climate change-related information in 10K files of annual reports [
30]. In summary, the method of constructing climate risk measurement based on corporate annual report text information is methodologically advanced, can systematically and comprehensively measure climate risk at the micro-firm level, and provides an important reference for the measurement of climate indicators in this paper.
2.3. Economic Consequences of Climate Change Risk
Against the background of increasingly prominent climate risk, it has exerted a significant impact on corporate production and operation and promoted enterprises’ adaptive transformation, with both negative and positive effects. From the negative perspective, climate risk may exacerbate corporate loan and debt default risk in the short term, leading to investment losses and capital erosion of financial institutions, thereby affecting their stable operation. Specifically, Dessaint and Matray took hurricane events as research objects and found that corporate managers tend to overreact to climate shocks, showing a significant increase in corporate cash holdings [
31]. Huang et al. further showed that climate risk not only negatively affects corporate financial performance but also exacerbates the volatility of cash flow [
32]. Liu and Qiao focused on the Chinese local context and pointed out that the promotion of decarbonization policies has exposed carbon-intensive enterprises to higher credit risk and financing costs, ultimately exerting a significant negative impact on corporate value [
33]. Pankratz et al. pointed out that extremely high-temperature weather significantly increases enterprises’ operating costs in sales and other links, thereby eroding operating profits [
34]. Chen et al. showed that climate transition risk leads to a significant increase in the default rate by causing corporate asset stranding [
35]. Sun et al. analyzed from the perspective of managers’ psychological pressure and found that climate change risk faced by enterprises exacerbates managers’ short-sightedness and rent-seeking motivation through pressure transmission, thereby increasing the possibility of corporate violations [
36].
However, from the positive perspective, effectively responding to climate risk has also created new business opportunities and profit growth points for enterprises. Doh and Guay showed that actively responding to climate risk and participating in green finance and social responsibility investment can also improve enterprises’ social image and brand value, attracting more consumers and investors [
37]. Williams and Schaefer believed that responding to climate risk can stimulate the personal values and internal beliefs of SME managers, prompting enterprises to participate in climate actions deeply and continuously [
38]. Krueger et al. argued that active participation in risk management is a better way to respond to climate risk, making enterprises better prepared for the transition to a low-carbon economy [
39]. Yu et al. believed that, although climate change and extreme weather events pose significant risks, they also create strategic opportunities for renewable energy enterprises, such as wind and solar power, to improve investment efficiency and accelerate technological innovation by promoting policy support and stimulating market demand [
40]. Rani et al. found that, for enterprises integrating climate risk management into operations, using big data and adopting sustainable practices can not only improve their environmental footprint but also enhance financial and operational performance [
41].
2.4. Climate Narrative Disclosure and Financial Distress Prediction
The prior literature finds obvious selective bias in corporate climate narratives: enterprises frame circular economy initiatives only as green opportunities with insufficient disclosure of matching climate risks, and one-sided textual information distorts creditors’ risk judgment [
42]. Consistent with this view, banking climate reports also place more emphasis on opportunity-oriented narratives while lacking sufficient forward-looking risk information, and merely a quarter of disclosures contain detailed quantitative content [
43]. Similarly, European energy enterprises present fragmented and biased climate narratives in TCFD disclosures, as they concentrate on strategic and indicator descriptions while insufficiently disclosing climate governance and risk management content. Such incomplete textual disclosure will significantly affect investor judgment and corporate valuation, further demonstrating the value of quantifying comprehensive climate narrative features for financial risk prediction [
44]. Methodologically, textual analysis based on self-built climate risk dictionaries is widely adopted to quantify the intensity of corporate climate narratives in annual reports. Evidence from Chinese listed banks further proves that financing conditions will significantly change firms’ willingness to disclose climate risk information, which highlights that climate narrative texts are endogenous signals reflecting managerial risk judgment [
45]. Overall, the above literature confirms pervasive selective, fragmented and forward-looking-deficient bias in corporate climate narrative disclosures across manufacturing, energy and banking sectors. Managerial textual tone, information coverage and disclosure willingness are jointly shaped by firms’ operational characteristics and financing demands, and such narrative signals exert tangible impacts on the risk judgment of creditors and investors. Nevertheless, existing studies mostly conduct separate textual analysis of climate disclosure without integrating disclosure volume and sentimental tendency to construct a unified composite indicator for climate resilience. More importantly, few researchers have further tested the incremental predictive effect of textual climate narrative features on the financial distress risk of green enterprises, which leaves sufficient research space for this paper.
2.5. Research Gaps and Contributions
Synthesizing the above research results, current research in the field of corporate debt default prediction and climate risk correlation has formed a certain foundation but still has the following problems. First, most studies on corporate debt default methods adopt a single traditional econometric model or machine learning model, and few effectively integrate the complementary advantages of the two methods in theoretical rigor and prediction flexibility, leading to a limited comprehensive applicability and robustness of the model. Second, existing climate indicator design has formed diverse paths, such as micro text mining, macro policy correlation and physical feature quantification, but the core limitation lies in the failure to fully incorporate management’s attention and attitude toward climate risk into the indicator system. In the green enterprise scenario, management’s attention and attitude toward climate risk directly determine the initiative and effectiveness of corporate climate risk prevention and control, which is a dimension that cannot be covered by existing financial indicators and macro climate indicators. Third, the impact of climate risk on corporate finance has dual effects. Most existing studies either examine its negative financial consequences (such as increased default rate and costs) or emphasize transition opportunities (such as green investment opportunities), failing to systematically analyze the impact mechanism and transmission mechanism of climate risk on corporate financial risk, thus making it difficult to reveal how enterprises form differentiated debt performance capabilities in the interaction between risk shocks and transition incentives. Moreover, current climate narrative research mainly focuses on disclosure-quality evaluation and capital market valuation consequences, while rarely extending to the field of corporate financial distress and debt risk early warning. The predictive value of differentiated climate narrative characteristics for green enterprises’ debt default risk has not been effectively verified, resulting in a missing link between climate textual signal disclosure and corporate financial risk prediction.
Based on the above research limitations, this paper takes corporate annual reports as the core analysis carrier, extracts management’s attention and attitude toward climate risk to construct a climate resilience indicator. Different from previous single-dimensional textual statistics, this study integrates both the quantity and sentimental tendency of climate narrative disclosures to characterize corporate climate resilience, which effectively compensates for the selective bias and fragmented measurement defects in existing climate textual research. Meanwhile, it integrates traditional econometric models and machine learning models to build a hybrid prediction framework combining “theory-driven and data-driven”. This framework not only ensures coefficient interpretability and economic theory support through traditional models but also captures complex non-linear relationships among variables using machine learning, thereby improving prediction accuracy while enhancing model robustness and applicability. Finally, the study focuses on the impact mechanism of climate risk on green enterprises’ debt default, aiming to reveal the regulatory role of climate resilience in the debt performance process and provide empirical evidence for enterprise risk management and green financial policy formulation.
3. Research Design
3.1. Research Methods
This paper integrates text mining, ensemble machine learning, model interpretability tools and binary Logit regression for empirical analysis. Annual report texts and word frequency statistics, together with SnowNLP sentiment calculation, are adopted to construct the climate resilience indicator. Four ensemble models, including random forest, XGBoost, LightGBM, and AdaBoost, are established. Two data division strategies (random sampling and time-series extrapolation) are applied to compare the prediction performance of three groups of feature sets. Grid search combined with 5-fold cross-validation is used for hyperparameter tuning, and ACC, F1, AUC, and the DeLong test are utilized to evaluate model performance. SHAP values and partial dependence plots are adopted to interpret the nonlinear relationships between variables. Furthermore, polynomial Logit regression, interaction term regression and industry-grouped regression are performed to examine nonlinear effects, synergistic effects and industrial heterogeneity, so as to reveal the risk prediction characteristics of the climate resilience indicator from multiple perspectives.
3.2. Sample Selection
The research selects enterprises engaged in electric passenger vehicles, electric power and water conservancy, photovoltaic and wind power, wind–solar power generation equipment, lithium batteries and fuel cells, and the environmental protection sectors to form the sample of green enterprises, covering key green industries, including clean energy development, new energy equipment manufacturing, new energy vehicles, energy conservation, and environmental protection. There are sufficient theoretical and empirical rationales for integrating multi-industry firms into a unified prediction sample. First, all sampled enterprises take green low-carbon development and energy conservation and emission reduction as their core businesses, falling within the scope of key green low-carbon sectors supported by national policies. Second, firms across these industries are jointly constrained and incentivized by policy frameworks such as green credit, carbon regulation and low-carbon subsidies, sharing highly consistent underlying logic in the formation and transmission of green value. Third, the cross-industry mixed sample expands observation dimensions, makes up for the limited sample size of single-industry datasets, reduces model bias caused by industry-specific characteristics, and improves the generalizability and external validity of prediction results.
3.3. Variable Measurement
3.3.1. Independent Variable
This paper constructs a climate resilience indicator based on the textual content of listed companies’ annual reports. The indicator incorporates two types of information, namely the total frequency of climate risk disclosures and the managerial textual sentiment tendency, to characterize the comprehensive features of firms in terms of climate narratives. The specific construction procedures of the indicator are outlined as follows.
First, according to the English vocabulary of climate risk in the literature of Sautner et al. and Li et al. [
28,
29], Chinese–English translation is carried out using translation tools (Google Translate), combined with manual comparison of more than 100 annual financial reports of enterprises in different years and industries. Secondary confirmation is conducted on semantically vague vocabulary to form an initial climate risk word set. Then, the Word2Vec model, a neural network-based NLP machine learning model, is used to expand the initial word set from two dimensions of enterprises’ climate risk and climate transition risk, and the top 100 most similar climate risk vocabulary words are obtained as the final climate risk word set according to similarity ranking. Combined with the actual word frequency distribution of annual report data in this study, the top 91 vocabulary words with high frequency are screened to finally form the climate word set
for constructing the climate resilience indicator. Finally, the word frequency method is used to count the corporate climate risk word frequency, and the sum is logarithmically processed to construct the Total Frequency of Climate Risk Disclosure. The specific process is:
In Formula (1),
represents the comprehensive word frequency count of the climate risk of enterprise i in year t, and
represents the frequency of vocabulary
in the annual report of enterprise i in year t. To reduce the interference of word frequency magnitude on the research results and optimize the data structure, this paper adopts a logarithmic form to de-magnify the data and obtain the Logarithmic Total Frequency of Climate Risk Disclosure
, as shown in Formula (2):
Second, all paragraphs containing vocabulary in the climate word set W in the annual report are screened. The SnowNLP (version 0.12.3) tool is used to calculate the sentiment value of each screened paragraph, and the average sentiment value of all paragraphs is taken to obtain the average sentiment value
of the company’s annual report. The specific process is:
In Formula (3), represents the average sentiment value of climate risk in the annual report of enterprise i in year t, represents the total number of paragraphs containing vocabulary in the climate word set in the annual report of enterprise i in year t, and represents the sentiment value of the j climate-related paragraph in the annual report of enterprise i in year t, where corresponds to the j climate-related paragraph in the annual report of enterprise i for year t.
The climate resilience indicator is obtained by multiplying the above-calculated
and
with the specific calculation formula:
In Formula (4), measures the scale of corporate climate-related disclosure, while depicts management’s narrative tendency toward climate issues. The product of the two terms, , serves as a comprehensive proxy variable for firms’ climate risk-related disclosure. Integrating disclosure volume and textual sentiment, this indicator distinguishes four combinations of disclosure characteristics: high disclosure volume with positive sentiment, high disclosure volume with negative sentiment, low disclosure volume with positive sentiment, and low disclosure volume with negative sentiment, which jointly reflect firms’ comprehensive attributes reflected in climate narratives.
3.3.2. Control Variables
This paper mainly adopts financial indicators reflecting the basic operation of listed companies to construct control variables and divides corporate financial indicators into four aspects: debt-servicing capacity, operating capacity, profitability and cost and expense control capacity. The data are derived from the Financial Indicator Analysis Database under the Company Research Series of the CSMAR database, and 74 indicators are initially selected.
Meanwhile, the obtained financial indicators are input into the green enterprise financial distress risk prediction model as features. Whether the company is ST is taken as the binary label, and the features are sorted in descending order according to feature importance. Considering the impact of feature importance on the model, features with an importance less than 0.001 are eliminated as unimportant features, and 33 financial features are screened.
Considering the high correlation between some financial indicators, to reduce information redundancy while retaining the original data information, this paper compresses highly correlated variable groups. First, variables with correlation ∣r∣ > 0.8 are identified, and then, highly correlated variable groups are constructed based on the transitivity of correlation. Dimension reduction is conducted separately for each highly correlated variable group, with the standard that the newly generated comprehensive variable can explain more than 85% of the information of the original variable group. Finally, a data set containing financial data and comprehensive variables is formed, which reduces information redundancy while retaining original information. Taking the variables of this data set as control variables and the climate resilience indicator as independent variables, a feature preprocessing summary table is constructed, as shown in
Table 1.
3.4. Data Sources
Financial indicators are derived from A-share green enterprise listed companies in the CSMAR database, with a research time span of 10 years from 2015 to 2024. For companies not marked as ST (non-ST companies), the categorical variable Y = 0. Companies marked as “Special Treatment (ST)” are taken as a sign of financial distress, recorded as ST companies, and given the categorical variable Y = 1. After data cleaning of the obtained financial data, a total of 2066 data points are obtained, including 1574 non-ST company data points and 492 ST company data points, with a ratio of approximately 3:1. Non-financial indicators are derived from annual reports of A-share green enterprise listed companies.
4. Empirical Analysis
4.1. Machine Learning Model Comparison
4.1.1. Determination of Optimal Model Parameters
Parameter design can optimize the model, adjust classifier performance, and achieve the goals of improving model performance and training speed. This study divides the full data set into a training set and a test set at a ratio of 7:3 using random sampling. Grid search and 5-fold cross-validation are adopted to optimize the hyperparameters of the model, with the maximum F1 score as the standard, and the optimal parameter combination is taken as the final parameter to improve model performance. The optimal parameter combinations of each model are shown in
Table 2.
4.1.2. Model Performance Comparison
This paper classifies the obtained features into three categories: “climate resilience indicator”, “financial indicator” and “financial indicator and resilience indicator”, and inputs the data of these three categories into random forest, XGBoost, LightGBM and AdaBoost models, respectively, to predict the financial distress risk, with the binary label being whether the company is ST. Four indicators (accuracy, precision, recall and F1 score) of the four models on the training set and test set are output to evaluate model performance.
Table 3 shows the comparison of prediction effects between machine learning models constructed using listed company data. The rows of
Table 3 represent different models with only resilience indicators, only financial indicators and both a resilience indicator and a financial indicator. Columns 3 to 6 represent the performance of the model on the training set, including accuracy, precision, recall and F1 score. Columns 7 to 10 represent the performance of the model on the test set.
A horizontal comparison of the overall performance of the four models on the test set shows that XGBoost achieves relatively superior fitting results under all three feature combinations. This indicates that, under the random grouping setting, the serially iterative ensemble tree model has stronger adaptability to unstructured derived features such as annual report texts.
Vertical comparison within each individual model reveals a consistent pattern across all four models: the feature set combining financial indicators and the climate resilience indicator generally delivers better predictive performance than the set containing financial indicators alone. This preliminary result indirectly demonstrates that the text-based climate resilience indicator carries incremental feature information not reflected in traditional financial data and can improve model fitting under the random-split experimental framework.
The outstanding performance of XGBoost in this comparative experiment is closely tied to its underlying algorithmic properties. Composed of multiple serially connected decision trees, XGBoost optimizes subsequent trees iteratively based on the residuals of previous ones. It excels at handling high-dimensional and nonlinear data and effectively captures complex interaction relationships among features. The dataset of this paper contains both structured financial indicators such as asset–liability ratio and current ratio, as well as unstructured climate resilience features derived from annual report texts. Given the high dimensionality and weak linear correlations of the variables, XGBoost’s inherent advantages in processing such data grant it better predictive adaptability within the current experimental framework.
4.1.3. Robustness Test Based on Time-Series Extrapolation Framework
Random data splitting mixes time-series information and allows future data to leak into the training set, which artificially inflates the out-of-sample performance of models. The perfect training set metrics of XGBoost and LightGBM in the previous table also signal severe overfitting risks, so this approach is only suitable for preliminarily verifying the incremental predictive value of the climate indicator. Therefore, this paper further establishes a rigorous time-series extrapolation framework, where samples from 2015 to 2021 are used for training and independent samples from 2022 for testing. The prediction performance of all machine learning models under this temporal segmentation rule is detailed in
Table 4. The AUC, PR-AUC metrics, calibration curves and threshold sensitivity graphs for all models, together with four evaluation charts of XGBoost after rolling the sample time window forward two periods, are provided in
Supplementary Tables S1 and S2 and
Supplementary Figures S1–S24.
The time-series test results reveal that the model AUC rises slightly after adding the climate resilience indicator. Nevertheless, only the performance improvement of LightGBM passes the statistical significance test via the DeLong test, while the incremental gains of the other three models are statistically insignificant. Random data splitting mixes samples across different time periods, weakening the textual signal noise arising from industrial and annual heterogeneity, making it easier to capture the marginal benefits of the climate indicator. By contrast, the time-series extrapolation design is more consistent with real-world risk control scenarios. Disturbances such as divergent operating models across green sub-sectors and mixed incentives for corporate climate disclosure dilute the incremental predictive power of climate texts, and only several ensemble learning algorithms can extract robust risk signals.
Combining the two groups of experiments, the textual climate resilience indicator indeed contains forward-looking risk information that cannot be reflected by traditional financial indicators, yet its signal is low-purity and susceptible to external disturbances. Although the improvement margin is limited under the standard time-series prediction framework, identifiable incremental warning effects still exist. This verifies that standardizing mandatory corporate climate narrative disclosure and mining unquantified textual information from annual reports carry practical significance for credit risk management.
4.2. Model Interpretability
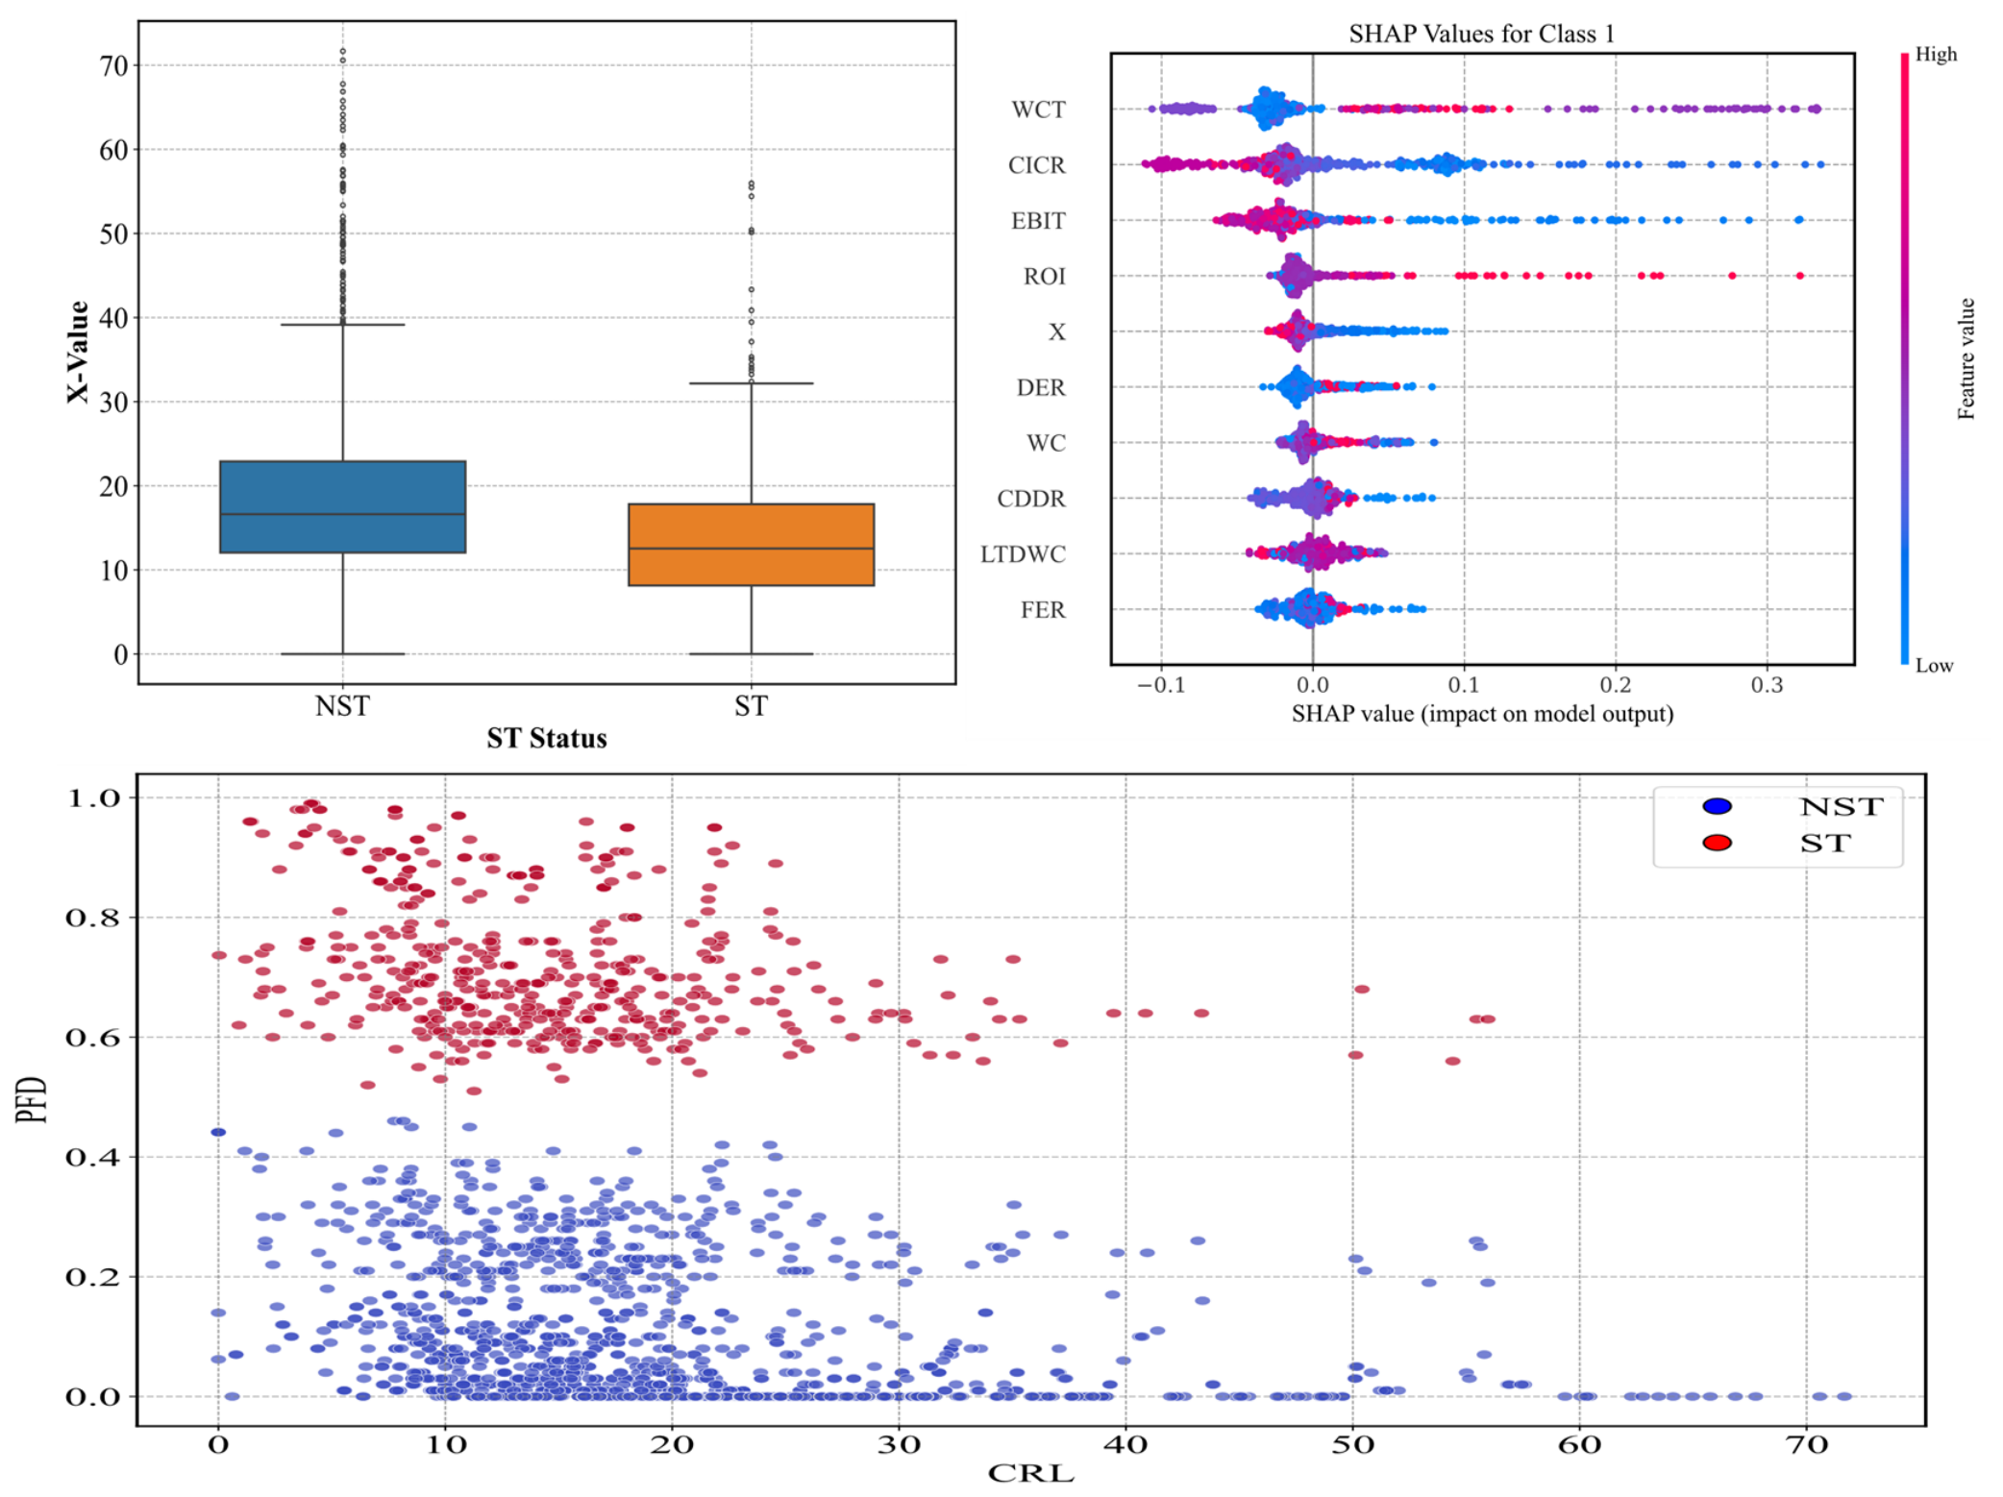
The following analyzes the mechanism of the resilience indicator from the perspective of multi-dimensional model interpretability, as shown in
Figure 1:
From the overall data distribution, ST enterprises and non-ST enterprises differ in the distribution of the climate resilience indicator, which endows the resilience indicator with the potential to be a risk indicator.
According to the feature importance ranking derived from the SHAP model, the text-based climate resilience indicator contributes considerably among all predictive variables, ranking fifth and serving as a vital input feature for the financial distress prediction model. In terms of sample distribution, the value of the climate resilience indicator has a significant statistical correlation with the model’s predicted risk score. Samples with low climate resilience generally correspond to higher predicted probabilities of financial distress, whereas samples with high climate resilience tend to have lower predicted risk levels.
Partial dependence plots further illustrate the nonlinear correlation between the climate resilience indicator and financial distress prediction outcomes. Within the low climate resilience range, the model generally yields higher predicted financial distress risks, yet a small number of low-risk samples still exist in this interval. This implies that corporate fundamental financial indicators jointly determine risk assessment, and a single textual climate feature cannot fully dominate the prediction results. In the medium climate resilience interval, the sample risks are evenly distributed, and no simple monotonic relationship exists between climate resilience and predicted risks, presenting a more intricate correlation pattern. In the high climate resilience range, the overall predicted probability of financial distress decreases, reflecting the positive marginal contribution of the climate resilience indicator to model fitting. Overall, the partial dependence results only reflect the nonlinear correlation pattern of the variable within the model prediction system.
Combining the findings from box plots, SHAP feature contributions, and partial dependence plots, the annual report text-based climate resilience indicator boasts strong model interpretability and sample discrimination capacity. As an incremental predictive feature supplementary to traditional financial indicators, it expands the feature dimension of financial risk early-warning models. Combined with the rigorous time-series prediction results mentioned above, it can be further concluded that the textual climate resilience indicator contains forward-looking unquantifiable information rarely captured by conventional financial data, though textual signals are vulnerable to disturbances from corporate disclosure behaviors, industrial attributes and external environments.
4.3. Multi-Dimensional Analysis
This paper conducts a multi-dimensional analysis from four dimensions: non-linearity, synergistic effect, heterogeneity and transmission mechanism. Meanwhile, to eliminate the interference of dimensional differences on regression results, all variables are standardized using a Z-score.
4.3.1. Non-Linearity Test
To identify the nonlinear relationship between climate resilience and debt default risk, this paper constructs a polynomial Logit model by sequentially incorporating the linear, quadratic and cubic terms of climate resilience. All variables are standardized via Z-score transformation, and the model controls for two-way fixed effects of industry and year simultaneously. The regression results are presented in
Table 5, which reports the coefficients and standard errors of core variables at each order, along with the model-fitting indicators, including McFadden pseudo-R
2, log-likelihood, AIC and BIC.
This paper adopts a polynomial Logit model to examine the nonlinear impact of the climate resilience indicator on corporate financial distress risk. Stepwise regression is carried out by sequentially introducing the linear term
X, the quadratic term
X2 and the cubic term
X3. Each column reports coefficients, standard errors, and fit indicators tailored for binary discrete choice models, including McFadden pseudo-R
2, log-likelihood, AIC, and BIC. The regression results are shown in
Table 5.
The Univariate regression results indicate that the linear and cubic terms can independently and significantly reduce the probability of financial distress, while the standalone quadratic term exerts no significant effect. When both linear and quadratic terms are included, the linear term is significantly negative, and the quadratic term is significantly positive, jointly forming a U-shaped relationship. After further adding the cubic term, its coefficient turns insignificant. The above findings verify that climate resilience exerts a nonlinear effect on corporate financial distress risk, and a purely linear specification would overlook dynamic changes in the marginal effect of the variable.
4.3.2. Synergistic Relationship Analysis
To test the synergistic effect between climate resilience and the financial indicators, this paper establishes two groups of binary Logit regression models. All sample variables are standardized by Z-score, and the two-way fixed effects of industry and year are controlled uniformly in all models. The first column corresponds to the benchmark model containing only financial control variables and the climate resilience indicator, while the second column further introduces interaction terms between climate resilience and core financial indicators. The regression results of statistically significant variables as well as model fitting indices including McFadden pseudo-R2, log-likelihood, AIC and BIC are reported in
Table 6, which only displays partial findings. Complete full-sample regression results can be found in
Tables S2 and S3 of the Supplementary Materials tables.
In the benchmark model, the coefficient of climate resilience X is 0.5055 and significantly negative at the 1% level. After incorporating interaction terms, the absolute value of the X coefficient rises to −0.8891 and remains significantly negative at the 1% level. A comparison of the two sets of results shows that climate resilience is steadily negatively correlated with corporate financial distress risk, regardless of whether interactive moderating variables are included, demonstrating the strong robustness of this statistical correlation. In addition, the absolute value of the X coefficient increases remarkably after controlling for interaction terms between the financial indicators and climate resilience, which implies that omitting such interaction relationships will underestimate the risk early-warning effect of climate resilience.
In terms of model-fitting performance, the McFadden pseudo R2 rises to 0.1881 after the inclusion of interaction terms, indicating enhanced explanatory power compared with the benchmark model containing only financial variables and X. The log-likelihood value is also improved correspondingly, which confirms the existence of interaction relationships between financial indicators and climate resilience.
4.3.3. Industrial Heterogeneity Test
To examine whether the impact of climate resilience on debt default risk exhibits industrial heterogeneity, this paper divides the full sample into manufacturing and non-manufacturing groups and conducts binary Logit regressions separately. All variables are standardized via Z-score transformation, and the two-way fixed effects of industry and year are controlled in the models. The regression results of statistically significant variables together with model fitting indices including McFadden pseudo-R2, log-likelihood, AIC and BIC are presented in
Table 7. which only shows partial results. Comprehensive complete regression results are provided in
Tables S4 and S5 of the Supplementary Materials.
The coefficient of climate resilience X is significantly negative in both subsamples, yet there are marked disparities in the significance levels and marginal effects. For manufacturing firms, the coefficient of X equals −0.4785 and is significant at the 1% level, while for non-manufacturing firms, the coefficient of X is −0.3958 and is only significant at the 5% level. A comparison of absolute coefficient values reveals that the marginal effect of climate resilience in mitigating financial distress risk is stronger within the manufacturing sector. Such discrepancies stem from inherent industrial characteristics: manufacturing sectors face greater exposure to extreme weather and low-carbon policy constraints across fixed assets, production capacity and supply chains. Accordingly, climate narratives in annual reports that reflect risk response strategies and low-carbon transitions deliver more prominent predictive value for operational risks. In contrast, non-manufacturing firms bear less climate-related operational exposure, and the incremental risk discrimination capacity of the climate resilience indicator is relatively weaker.
Fitting indicators show that the McFadden Ps.R2 of non-manufacturing firms (0.2830) is higher than that of manufacturing firms (0.2010). This goodness-of-fit metric captures the overall explanatory power jointly offered by financial control variables and the climate resilience indicator, suggesting that the combination of these two types of variables achieves superior comprehensive identification of financial distress among non-manufacturing enterprises. Nevertheless, comparison of the core variable X’s coefficients indicates that climate resilience exerts a stronger marginal mitigating effect with higher statistical significance in manufacturing firms. This implies that textual climate information contributes more to risk identification for manufacturers, whereas fundamental financial indicators play a more powerful discriminatory role in non-manufacturing subsamples.
4.3.4. Transmission Mechanism Analysis
This paper constructs a financial distress prediction system integrating traditional financial indicators and textual climate resilience features. With the aid of SHAP analysis, it systematically characterizes the statistical correlation patterns among climate resilience features, multi-dimensional financial features and corporate financial distress risk.
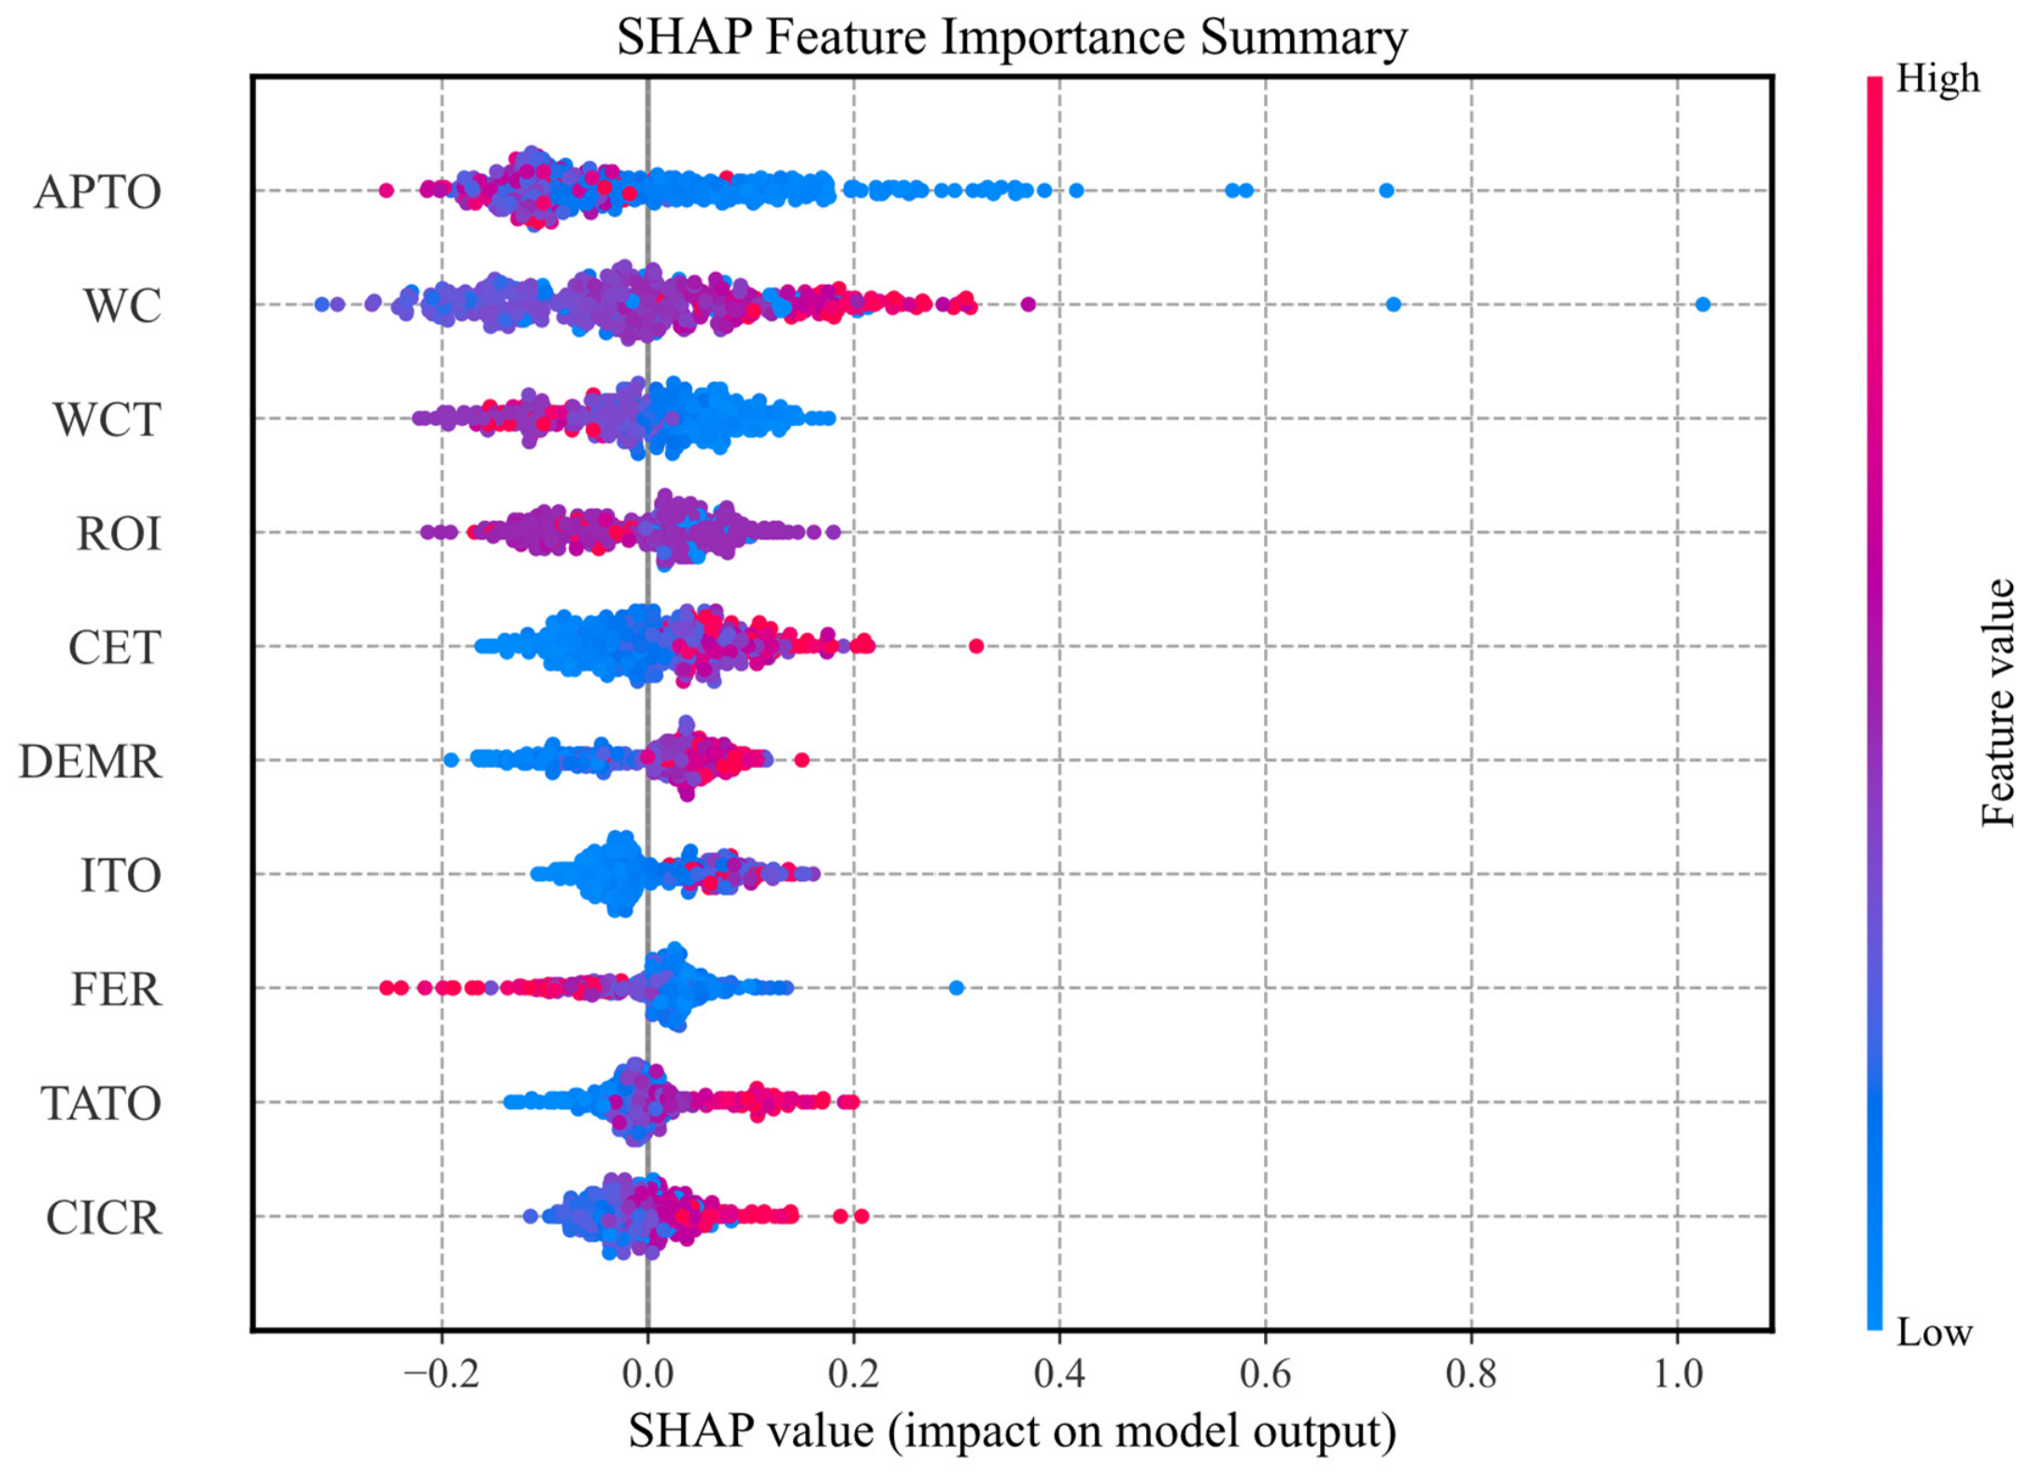
In terms of the correlation patterns between climate resilience and various financial dimensions,
Figure 2 shows that, within the solvency dimension, indicators including WC, DEMR and CICR show consistent patterns in the SHAP distribution, and the climate resilience feature is positively correlated with corporate solvency indicators in model fitting. For the operating capacity dimension, APTO and WCT present negative correlations with climate resilience, while CET, ITO and TATO show positive correlations, which demonstrate significant nonlinear relationships between climate resilience and corporate operational indicators. In the profitability dimension, ROI is negatively associated with climate resilience, reflecting differentiated fitting relationships between textual climate information and corporate investment returns. Regarding the cost control dimension, FER is positively correlated with the climate resilience indicator, indicating a consistent fitting trend between climate resilience and corporate cost management performance.
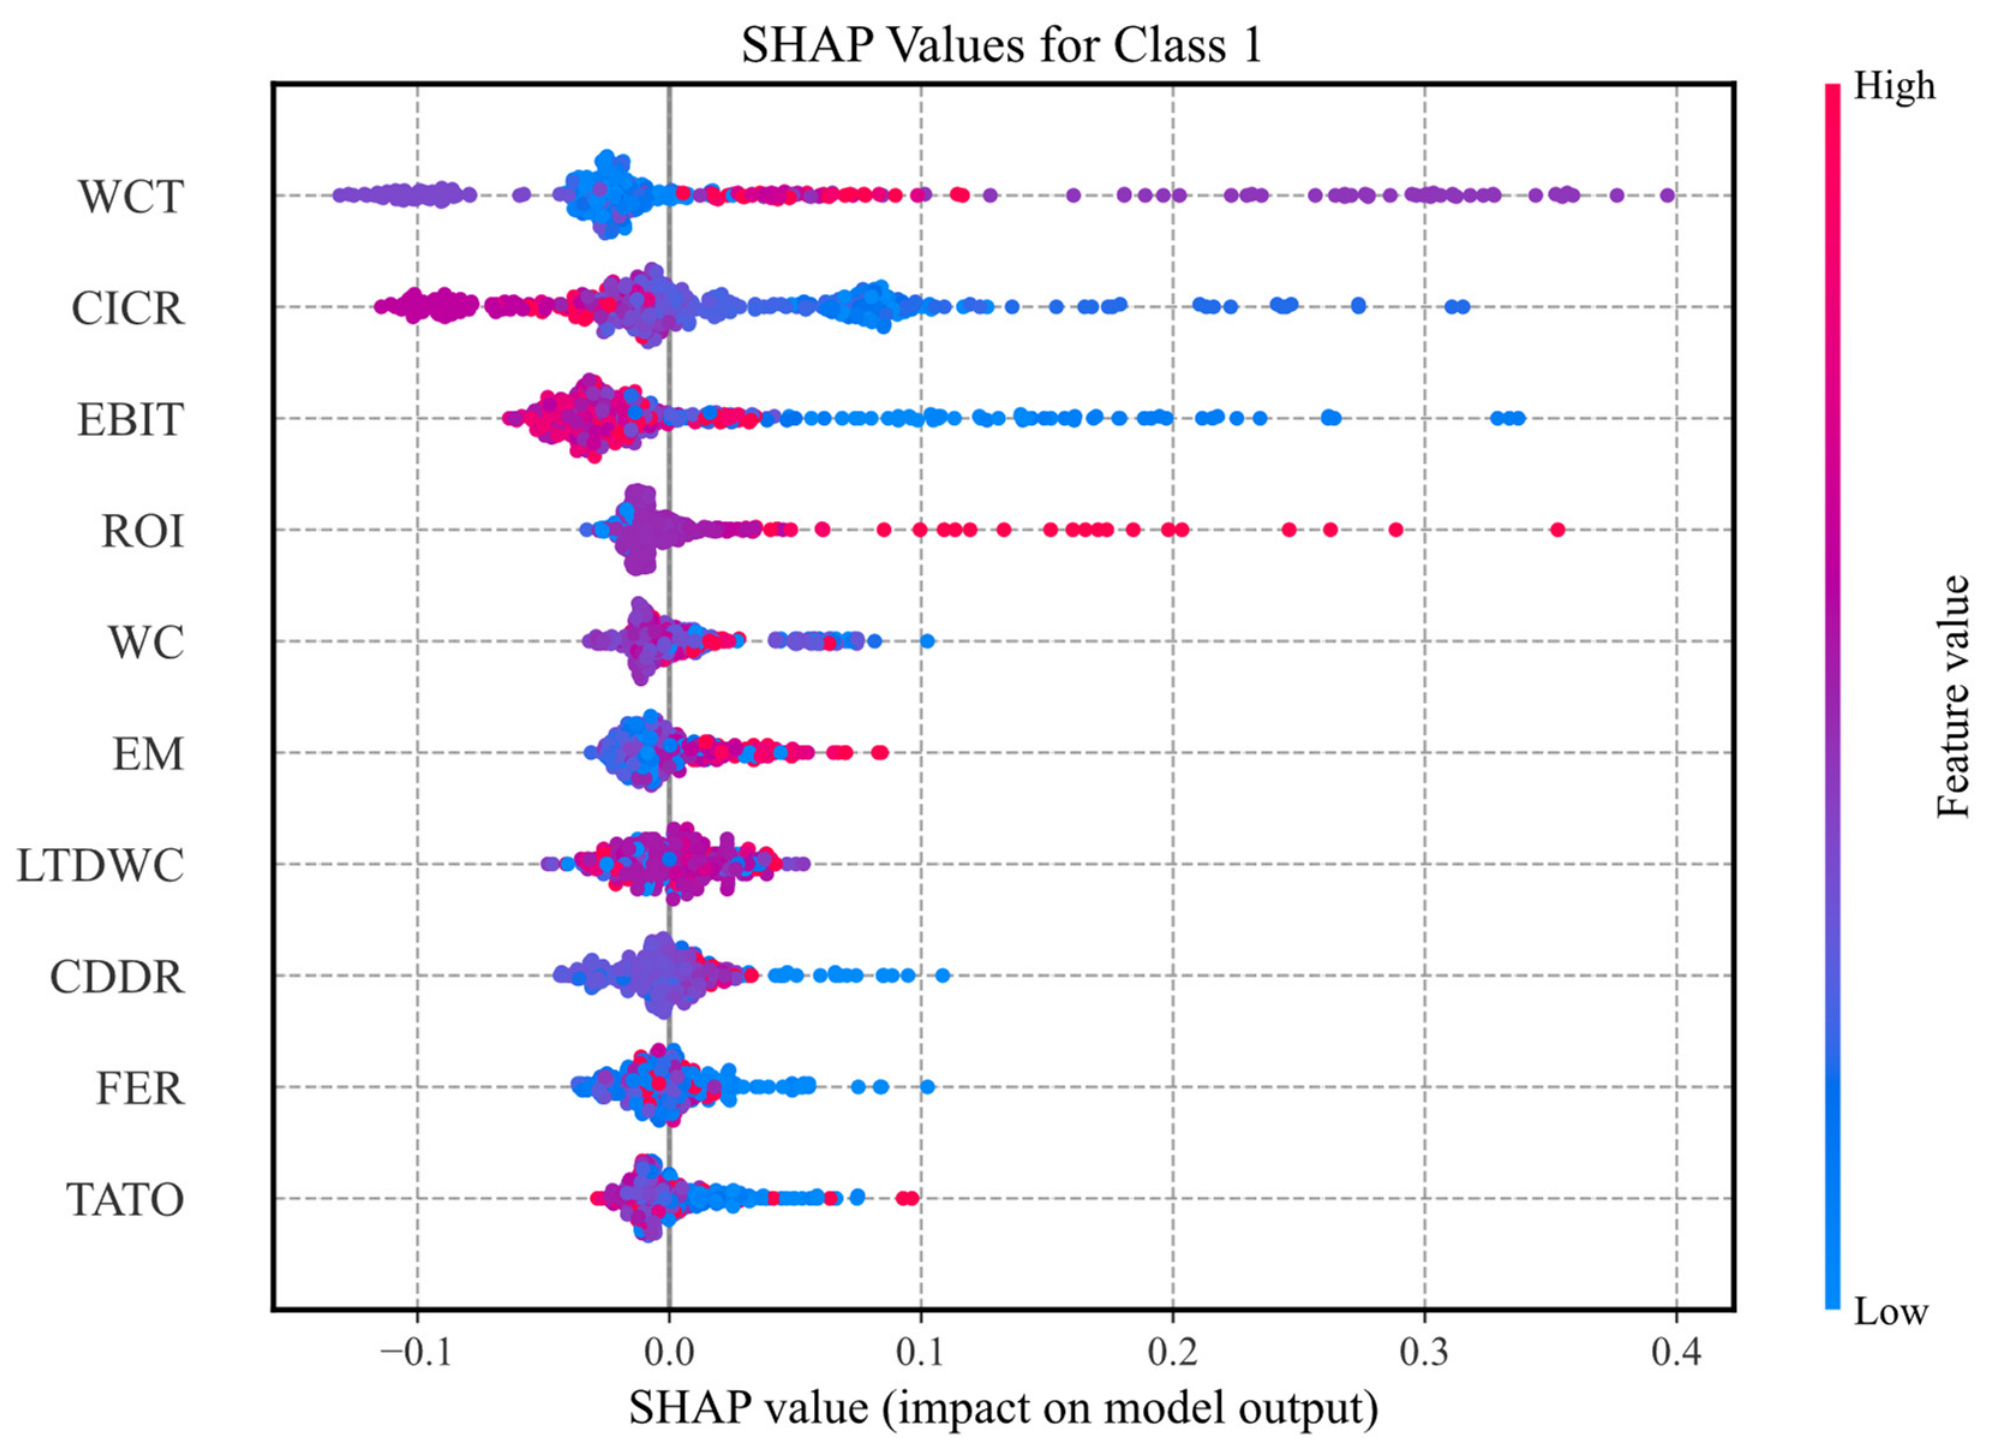
Further analysis is conducted on the model correlation patterns between financial features and financial distress risk, as shown in
Figure 3.
In the operating capacity dimension, WCT presents nonlinear fitting characteristics with financial distress risk. The distribution of model features indicates that excessively high or low capital turnover levels correspond to higher predicted risk values, and only turnover efficiency within a moderate range delivers the optimal risk identification effect in the model. In the profitability dimension, EBIT and ROI exert opposite feature contributions. Stable operating profit scales help reduce the model’s predicted risk scores, while excessively high investment income levels correspond to greater cash flow uncertainty and risk exposure. In the cost control dimension, FER is negatively correlated with financial distress risk in the fitting results, and reasonable financing structure and scale serve as key features for the model to identify low-risk enterprises.
The overall comparative feature results reveal that four categories of financial indicators, namely solvency, operating capacity, profitability and cost control, differ significantly in their contribution directions and magnitudes within the risk prediction model. All financial features constrain one another and jointly form the core fundamental system for identifying corporate financial risks.
Combining the above interpretability results of the models, the climate resilience feature extracted from annual report texts can effectively complement multi-dimensional corporate financial fundamentals and maintain a stable nonlinear statistical correlation with corporate financial performance and risks. Combined with the prior time-series prediction results, it can be further inferred that textual climate information contains forward-looking risk warning signals that cannot be captured by traditional financial indicators and carries independent incremental predictive value. Accordingly, mining unquantified information embedded in climate narratives of annual reports can provide an effective auxiliary judgment basis for financial risk early warning of green enterprises.
5. Discussion
Focusing on the core research question of whether mandatory climate narrative texts in annual reports can deliver incremental predictive information regarding corporate credit deterioration beyond traditional accounting indicators, this paper draws on cutting-edge research in green finance. The corporate climate resilience indicator constructed through text mining acts as a core incremental non-financial feature for identifying financial distress risks of green enterprises. As China’s dual carbon policies are fully implemented and climate information disclosure of listed companies gradually becomes mandatory and standardized, extracting soft climate information contained in annual reports and quantifying climate resilience to optimize the credit risk early-warning system carry important theoretical expansion value and practical guiding significance for the industry.
To systematically clarify the predictive power, internal mechanism and applicable boundary of the climate resilience indicator on the financial distress risks of green enterprises, this paper selects A-share listed companies in segmented green industries from 2015 to 2024 as research samples. It constructs the climate resilience indicator via NLP technology applied to annual report texts and adopts two machine learning prediction schemes: random data splitting for preliminary testing and a time-series extrapolation framework for robust verification. SHAP values and partial dependence plots are utilized to decompose model interpretability, while polynomial Logit regression, interaction effect tests and grouped subsample regressions are conducted for in-depth mechanism analysis. This paper comprehensively examines the incremental predictive value, nonlinear relationships, synergistic effects with financial indicators, industrial heterogeneity and risk transmission channels of the climate resilience indicator, providing empirical evidence and operable references for financial institutions’ financial distress risk prediction and the optimization of regulatory climate disclosure systems. The core empirical conclusions are summarized as follows:
(1) The climate resilience indicator synthesized from annual report texts has independent incremental predictive power for financial distress beyond traditional financial indicators. Consistent results from random-split experiments of four ensemble learning models demonstrate that the composite feature set combining financial indicators and the climate resilience indicator outperforms the benchmark model with financial indicators alone in all predictive dimensions. Further time-series extrapolation tests consistent with real-world risk control scenarios confirm that the overall AUC of the models rises slightly after incorporating the climate resilience indicator. Among them, the performance improvement of the LightGBM model passes the DeLong statistical significance test. This proves that climate narrative texts contain forward-looking credit risk information not reflected in financial statements and can steadily improve the accuracy of corporate financial distress identification;
(2) The XGBoost ensemble tree model has the best adaptability to the composite prediction framework integrating financial indicators and textual climate resilience features. Horizontal comparison of the test-set performance of four models, including random forest, XGBoost, LightGBM and AdaBoost, shows that XGBoost achieves superior fitting results under all three feature combinations: climate indicators only, financial indicators only, and composite financial–climate indicators. Relying on its underlying algorithm of iterative residual optimization through serial decision trees, XGBoost efficiently captures complex nonlinear interactions between structured financial variables and unstructured textual climate features extracted from annual reports, making it well-suited for the high-dimensional dataset with weak linear correlations adopted in this paper;
(3) The climate resilience indicator exerts significant synergistic moderating effects with core corporate financial indicators, and its impacts show industrial heterogeneity between manufacturing and non-manufacturing sectors. Interaction regression results reveal that omitting the linkage relationships between climate resilience and financial indicators such as inventory turnover ratio, EBIT and tangible net worth debt ratio will substantially underestimate the risk mitigation effect of climate resilience, and the model goodness-of-fit improves remarkably after adding interaction terms. Grouped regressions show that climate resilience significantly restrains financial distress risks in both subsamples, yet the marginal effect is stronger and more statistically significant for manufacturing firms. Restricted by smaller climate-related operational exposure, non-manufacturing enterprises exhibit weaker discriminatory power of the climate indicator in risk identification.
(4) The climate resilience indicator has a nonlinear correlation with financial distress risk and presents differentiated distribution patterns with financial features covering solvency, operating capacity, profitability and cost control. This paper characterizes correlation patterns among variables based on visualized results of SHAP feature importance and partial dependence plots. Polynomial Logit regression verifies the nonlinear linkage between climate resilience and financial distress probability. Visual analysis objectively describes variable distribution within samples, showing that climate resilience presents diverse correlation patterns with multi-dimensional financial indicators, including positive correlation, negative correlation and piecewise nonlinear relationships.
6. Conclusions
6.1. Theoretical Significance
(1) This paper expands the scope of feature sources for corporate credit risk prediction. Most existing studies on financial distress are confined to structured accounting indicators from balance sheets and income statements, while few explore unquantified soft information embedded in the mandatory disclosure texts of annual reports. This paper expands the climate risk lexicon via Word2Vec and constructs a climate resilience indicator integrating word frequency and sentiment values. It verifies that mandatory climate narratives carry independent incremental predictive power, enriches the feature system for credit risk early warning of green enterprises, and offers a standardized construction framework for embedding textual information into risk measurement models. The research conclusions are not limited to the segmented field of green finance and can be extended to studies on climate disclosure and credit evaluation across all industries;
(2) It supplements the theoretical evidence regarding the nonlinearity, synergies and industrial heterogeneity between climate risks and corporate financial distress. Most of the prior literature adopts simple linear models to examine the relationship between climate factors and corporate risks, neglecting the dynamic marginal effects of variables, the moderating effects of financial indicators and inter-industry disparities. This paper comprehensively characterizes multi-layered influence mechanisms through polynomial discrete choice models, interaction effect tests and grouped regressions. Meanwhile, SHAP values and partial dependence plots are adopted to endow the black-box machine learning model with economic interpretability, bridging the research gap between machine learning prediction and traditional econometric mechanism analysis;
(3) It clarifies the boundary conditions for the validity of textual climate information under time-series constraints. Most previous relevant studies randomly split the training and test samples, which overestimates the practical risk control value of textual indicators. This paper adopts a rigorous time-series extrapolation test to distinguish the signal strength of climate narratives under ideal random splitting and real-world time-series risk control scenarios. It identifies disturbances to the predictive capacity of climate indicators arising from industrial heterogeneity and noise in corporate disclosure behaviors, defines applicable scenarios and limitations where climate texts can generate warning effects, and improves the theoretical boundary of research on the value of climate information.
6.2. Practical Significance
(1) Market participants, including commercial banks and bond rating agencies, may incorporate climate narrative texts from listed firms’ annual reports into credit evaluation systems. Quantitative climate resilience indicators can be added to conventional financial scorecards. With NLP tools, institutions can automatically extract the frequency of climate risk disclosures and managerial sentiment from annual reports, so as to build composite financial distress prediction models that combine structured financial data and unstructured textual information. Ensemble tree algorithms such as XGBoost and LightGBM are recommended to capture complex interactions between climate indicators and financial variables. For green manufacturing enterprises, the weight assigned to climate resilience indicators should be raised to fully exploit the forward-warning function of textual information against credit deterioration. In addition, risk control models should adopt time-series extrapolation training logic to avoid overfitting bias caused by random sample splitting and objectively assess the actual risk discrimination capacity of climate texts;
(2) Enterprises engaged in green manufacturing, new energy, energy conservation and environmental protection shall standardize and elaborate their disclosures on climate transition and climate risks in annual reports. They should actively release positive narrative information concerning low-carbon renovation, responses to extreme climate events and carbon emission reduction arrangements to elevate their climate resilience and ease negative expectations of future cash flow deterioration and financial distress held by markets and financial institutions. Manufacturing firms are especially advised to improve the disclosure of climate-related operational information to give full play to the risk-mitigating function of climate narratives. Corporate management needs to strike a balance between investment in climate transition and the stability of profitability and turnover indicators, and leverage sound financial fundamentals to amplify the synergistic risk-mitigation effect of climate resilience;
(3) Climate-related disclosure of listed companies in China is gradually becoming mandatory. The empirical findings of this paper provide empirical evidence for optimizing regulatory rules on climate information disclosure. Regulators can further refine detailed provisions for climate narrative disclosure in annual reports and unify disclosure requirements for climate risk keywords, so as to reduce the textual signal noise resulting from selective disclosure and vague expressions by enterprises and improve the readability and quantifiable value of climate information in annual reports. Meanwhile, regulators can guide the financial industry to establish a standardized measurement framework for corporate climate resilience, integrate textual climate indicators into the access and ongoing risk monitoring systems of green credit and green bonds, and improve the risk prevention and control mechanism for investment and financing in green industries by virtue of forward-looking climate warning information.
6.3. Limitations and Future Prospects
The sample of this paper only covers A-share listed green enterprises, excluding unlisted small and medium-sized green firms. The annual report disclosure standards of small and medium-sized entities are relatively inadequate, and whether there are differences in the risk prediction effect of climate texts remains to be further verified. Second, this paper constructs a single-dimensional climate resilience indicator solely based on annual report texts. Future research can integrate multi-channel textual data, including corporate social responsibility reports, management performance briefings and public news opinions, to build a comprehensive multi-source climate risk indicator. In particular, leveraging advanced natural language-processing techniques, such as large language models, could enhance the extraction and aggregation of risk-related signals from heterogeneous textual sources [
46]. Third, this paper only distinguishes industrial heterogeneity between manufacturing and non-manufacturing sectors. Subsequent studies can further subdivide other green sub-sectors, such as new energy, environmental protection equipment, and carbon trading services, to compare differentiated mechanisms of climate narratives across segmented industries, thereby uncovering sector-specific transmission channels that are masked under broad binary classifications. Finally, this paper focuses on short-term financial distress prediction. The impact of long-term climate transition risks on corporate long-term financial stability and the recovery period after falling into financial distress can serve as directions. Moreover, future work could adopt dynamic panel models or survival analysis to trace the persistent effects of climate discourse over multiple years and incorporate similar LLM-based assessment approaches to improve forward-looking capacity, especially under evolving regulatory and physical climate scenarios.