Article

When More Is Less: The Inverted U-Shaped Impact of Digital-Intelligent Transformation on Value Co-Creation


School of Economics and Management, Northwest University, Xi’an 710127, China
*
Author to whom correspondence should be addressed.
Systems 2026, 14(7), 805; https://doi.org/10.3390/systems14070805
Submission received: 2 June 2026 / Revised: 24 June 2026 / Accepted: 4 July 2026 / Published: 8 July 2026

Abstract

This study explores the nonlinear impact of digital-intelligent transformation on enterprise value co-creation. It examines the mediating role of organizational agility and investigates the influence of network embeddedness on the effectiveness of digital-intelligent transformation. This article draws on a sample of 418 manufacturing enterprises and employs a questionnaire survey and hierarchical regression analysis to test the hypotheses. It divides digital-intelligent transformation into two dimensions: digital-intelligent technology level and digital-intelligent application scope. Organizational agility is used as the mediating variable, and network embeddedness is used as the moderating variable. This study reveals an inverted-U relationship between digital-intelligent transformation and value co-creation. The impact of digital-intelligent technology level and digital-intelligent application scope on value co-creation is mediated through organizational agility. Network embeddedness is associated with a wider range over which digital-intelligent transformation relates positively to value co-creation before returns diminish. The findings indicate that firms reporting excessive digital-intelligent transformation tend to report lower value co-creation. This research enriches the literature on digital-intelligent transformation. It points out that digital-intelligent transformation has a nonlinear impact on value co-creation. The study uses organizational agility as the mediating mechanism and network embeddedness as the boundary condition. These findings provide a reference for enterprises seeking to implement digital-intelligent transformation in a balanced and sustainable way.

1. Introduction

In the past ten years, the global economy has undergone structural changes. These changes have been driven by the deep integration of digital-intelligent technologies. These technologies have changed the way enterprises create, deliver, and acquire value. The traditional model of competition and cooperation has gradually become outdated [1]; the product life cycle has continuously shortened, and the boundaries between industries have become blurred. Global enterprises are facing the pressure of digital-intelligent transformation. Enterprises need to improve cross-organizational efficiency, flexibility, and value creation capabilities through transformation. Some economies have launched strong policy support, such as Made in China 2025, Germany’s Industry 4.0, and the United States’ Advanced Manufacturing Partnership. Other economies rely more on market-driven technology applications, but the core challenge of managing the intensity of technology adoption is widespread. By the end of 2024, the adoption rate of digital research and development tools among major industrial enterprises in developed economies had exceeded 80%, and billions of devices around the world had connected to the industrial Internet platforms. These data reflect the accelerating trend of digital technology adoption. Digital-intelligent transformation is no longer an optional strategy but a necessary condition for the survival and development of modern enterprises.
Value co-creation is an emerging value creation model that requires the collaborative participation of multiple stakeholders, such as enterprises, customers, suppliers, and partners. All parties jointly create and share value through resource integration, knowledge exchange, and collaborative innovation [2]. Traditional business models are largely confined to the scope of a single organization. Digital-intelligent transformation, however, breaks down these boundaries. Enterprises can expand value creation throughout the entire value network. This helps them establish stable and lasting competitive advantages in a complex and ever-changing market. Digital-intelligent transformation has changed the logic of traditional value co-creation. Digital platforms, intelligent technologies, and data-driven decision-making systems all play a crucial role. These technologies facilitate enhanced collaboration among enterprises, restructure the value chain, and give rise to new co-creation models [3]. These changes make enterprise cooperation more efficient and transparent. They also provide new directions for deepening cooperation and enhancing market value.
Following the earlier analysis, we ask: How exactly does digital-intelligent transformation affect value co-creation? Specifically, we focus on three aspects: (1) What is the relationship between them? (2) What mechanism enables the transformation to function? (3) What conditions influence the magnitude of this effect? Organizational information-processing theory frames the firm as a system whose performance depends on the fit between its information-processing requirements and its information-processing capacity, and it is this fit, rather than technology investment as such, that governs value creation. This study argues that when the collaborative complexity brought about by digital-intelligent transformation matches the organization’s information-processing capabilities, it is associated with higher levels of value co-creation. However, when transformation intensity exceeds the organization’s processing capacity, information overload suppresses value co-creation. Accordingly, this study proposes that there is an inverted U-shaped relationship between digital-intelligent transformation and value co-creation. Network embeddedness, as an external resource, plays a moderating role and delays the emergence of negative impacts by expanding the effective range of digital-intelligent transformation.
This study advances four adjacent studies rather than merely extending them. The IT productivity paradox documents that IT spending does not reliably raise productivity but leaves the functional form unspecified; we show that the relationship is not merely noisy but systematically non-monotonic, and we locate the turning point. The digital paradox and value co-creation/co-destruction literature argues that digitalization can both create and destroy value but treats this as a qualitative tension; we model the tension as a single continuous curve and identify where creation turns into destruction. The technology-overload literature establishes overload at the individual level; we move the mechanism to the organizational level by grounding it in the firm’s information-processing capacity. The digital-complexity literature describes rising complexity as a state; we specify it as the moving requirement side of a demand–capacity balance whose imbalance produces the downturn. Building on these distinctions, this study makes three contributions: (1) it separates transformation depth from breadth and shows that each has an independent inverted U-shaped effect with a different turning point; (2) it identifies organizational agility as the capability that transmits the effect; and (3) it shows that network embeddedness shifts the turning point outward, extending the range over which transformation pays off.

2. Theoretical Foundation and Research Hypotheses

Research on digital-intelligent transformation and value creation falls into three strands that have developed largely in parallel: one treats transformation as capability building and stresses its positive effects; one documents the costs of digitalization, such as information overload, coordination burden, and complexity, and argues that returns are bounded; and one studies the organizational and relational conditions under which digital investment is actually converted into value. The unresolved question across these strands is whether the effect on value co-creation is monotonic: the first strand implies that more is better, whereas the second suggests that transformation can be self-defeating. Because most studies estimate linear models and treat transformation as a single construct, the turning point is never located, and the conversion mechanism, namely how digital inputs become collaborative value, remains a black box. Evidence from Chinese firms is consistent with a mechanism-based interpretation, in which a transformational posture shapes development outcomes through intervening organizational processes rather than directly [4].
We close this gap by making the conversion logic explicit as a single chain: digital-intelligent transformation changes a firm’s information-processing requirements, organizational agility turns those requirements into responsiveness, and network embeddedness determines how far the chain extends before returns turn negative. The fact that the returns to transformation are bounded by external conditions rather than being uniformly positive is consistent with evidence beyond the firm level, where external risk and policy uncertainty constrain the extent to which organizational transformation generates benefits [5]. At the firm level, this pattern is reflected in the outer boundary imposed by network embeddedness in our model. The three strands, the studies grounding each link of this chain, and the resulting hypotheses are developed in Section 2.1, Section 2.2 and Section 2.3, drawing on organizational information-processing theory, dynamic capabilities theory, embeddedness theory, and service-dominant logic.

2.1. The Impact of Digital-Intelligent Transformation on Value Co-Creation

Digital-intelligent transformation alters the interaction patterns between enterprises and their partners and reshapes the model of collaborative value creation [6]. Existing studies have pointed out that digital-intelligent transformation is a multi-dimensional process. Enterprises need to not only enhance their own technological capabilities but also promote relevant technologies across more business scenarios [7,8,9]. This paper divides digital-intelligent transformation into two dimensions: digital-intelligent technology level (DITL) and digital-intelligent application scope (DIAS). DITL emphasizes the depth of technology adoption. It measures the degree to which enterprises integrate technologies such as artificial intelligence, big data, cloud platforms, and the Internet of Things [10,11]. The higher the DITL of an enterprise, the more valuable analytical insights it can obtain. It can also better understand the complex and changing market environment [12]. DIAS measures the breadth of technology adoption. It reflects the penetration of digital technologies into enterprises’ research and development, production, marketing, and service processes [13]. When these core business functions all use digital technologies, information transmission between departments and processes becomes smoother [14,15]. Digital-intelligent transformation enables enterprises to better collect and analyze data. However, it also has limitations. Information flow becomes more complex, and the difficulty of cross-departmental coordination also increases.
We focus on these two dimensions to understand how they affect an organization’s ability to create value within the overall system. Working across organizations requires stable data and resources, as well as decision-making with external partners. Digital tools can support this process, enhance collaboration transparency, and reduce coordination barriers [16,17]. Maintaining a moderate level of digital-intelligent transformation helps improve the information-processing capacity of the organization. The application of digital tools across different business functions enables enterprises to collect data more efficiently and gain deeper insights. This change is associated with higher-quality communication between the organization and its partners. It is also associated with more efficient and sustainable value creation.
The benefits of digital-intelligent transformation are not unlimited [18]. As technology becomes more complex and its application scope expands, the digitalization of enterprises becomes particularly cumbersome. Managers must handle information of greater scale, variety, and uncertainty. The burden imposed by such information may eventually exceed the processing capacity of the enterprise, making it impossible for the enterprise to operate normally and efficiently [19].
If digital tools are overly complex or their application scope exceeds the enterprise’s tolerance limit, enterprises will encounter bottlenecks in information processing. Such excessive expansion often has a counterproductive effect. It generates a large amount of redundant data and makes cross-departmental collaboration extremely difficult. As coordination becomes more cumbersome, the cost of managing external partners rises. This is a classic example of a mismatch between demand and capability. Enterprises’ data-processing requirements far exceed their actual processing capabilities [20]. While continuously advancing digital transformation is often associated with greater efficiency, an excessive pursuit of technological depth and breadth is associated with a surge in data volume that can surpass the organization’s information-processing capacity. As this demand–capacity gap widens, communication between the enterprise and its partners is disrupted. Consequently, the value that was originally intended to be created through co-creation is gradually consumed.
Organizational information-processing theory provides the formal framework for the pattern described above. The theory holds that performance depends on the fit between an organization’s information-processing requirements and its information-processing capacity. Digital-intelligent transformation raises both sides of this balance, but at different rates. In the early stage, transformation expands capacity faster than it raises requirements: data become more accessible, partner signals are captured earlier, and coordination is more transparent, so the fit improves and value co-creation rises. As transformation deepens and widens, however, requirements grow super-linearly. Additional technologies generate more data with greater variety and ambiguity, and additional application domains multiply the cross-functional and cross-firm interfaces that must be reconciled. Beyond a threshold, requirements exceed capacity: managers face redundant and conflicting outputs, decision latency increases, and coordination with partners is disrupted rather than enabled, so the same investment that created value begins to consume it. Because the requirement curve is convex, whereas the capacity curve flattens, the net effect first rises and then falls, resulting in an inverted U-shaped relationship rather than a plateau.
This logic implies three linked propositions: (i) within the fit region, transformation improves processing fit and therefore raises value co-creation; (ii) there exists a threshold at which marginal requirements equal marginal capacity; and (iii) beyond the threshold, the requirement–capacity gap widens and value co-creation declines. Propositions (i)–(iii) jointly describe an inverted U-shaped relationship. Based on this reasoning, this study proposes the following hypotheses:
H1. 
Digital-intelligent transformation has an inverted U-shaped relationship with value co-creation.
H1a. 
Digital-intelligent technology level has an inverted U-shaped relationship with value co-creation because deepening technology primarily raises analytical and cognitive processing load.
H1b. 
Digital-intelligent application scope has an inverted U-shaped relationship with value co-creation because widening application primarily raises cross-functional and cross-firm coordination load.

2.2. The Mediating Role of Organizational Agility

Organizational agility is an organization’s ability to perceive environmental changes, identify opportunities, and rapidly adjust its internal resources [21,22,23]. Digital transformation focuses on technology deployment. Organizational agility is more concerned with translating these technologies into the organization’s flexible responsiveness. In this study, organizational agility is defined as the organization’s information-processing capability. It serves as the mediating mechanism connecting digital inputs with value co-creation outcomes [24]. Lu and Ramamurthy (2011) [22] divided organizational agility into two dimensions: market agility and operational agility. Market agility refers to capturing and interpreting external signals. Operational agility relates to internal process reengineering. We believe that these two dimensions influence the relationship between digital-intelligent transformation and value co-creation through different mechanisms. Simply investing in technology is not necessarily linked to higher levels of organizational agility. The success of transformation depends on whether the organization can turn the potential of technology into actionable measures [25]. Organizations should integrate digital-intelligent technologies into daily processes, decision-making, and management, as well as leverage their adaptive capabilities [26].

2.2.1. Market Agility as a Mediating Mechanism

By leveraging artificial intelligence and machine learning for analysis, enterprises can identify patterns in the dynamically changing customer demand and predict the behaviors of competitors [27,28]. By using digital tools, enterprises can process multi-source data in real time and extract valuable information from complex market signals. This enables them to accurately predict customer demand [29]. Companies that use digital technologies in research and development, production, and customer service can align market information with operational activities, enabling timely responses to market changes [30]. When the marketing system directly transmits customer information to the R&D and production processes, enterprises can quickly adjust products and proactively upgrade services. However, market agility does not increase continuously with technological investment. Overly complex data analysis can instead become a burden. Managers faced with large volumes of algorithmic output are prone to decision fatigue. Filtering useful information from massive datasets becomes significantly more difficult [31,32]. This analytical challenge reduces enterprises’ ability to identify partner needs and capture value co-creation opportunities. Excessive application of digital technology and overly standardized processes can weaken organizational flexibility. Once market trends deviate from expectations, existing digital systems can instead become constraints [33]. We propose:
H2a. 
Market agility mediates the inverted U-shaped relationship between digital-intelligent technology level and value co-creation.
H2b. 
Market agility mediates the inverted U-shaped relationship between digital-intelligent application scope and value co-creation.

2.2.2. Operational Agility as a Mediating Mechanism

Enterprises can achieve rapid resource allocation and workflow adjustments through real-time monitoring, automated processes, and resource allocation algorithms [34,35]. Advanced intelligent analytics can identify issues that managers tend to overlook. Automation can also facilitate operational reform. Enterprises use digital technologies across various departments, streamlining information flow. This not only reduces conflicts between departments but also significantly improves execution speed [36]. When production data and procurement processes are integrated, customer feedback can be directly transmitted to the service department. Enterprises can then more efficiently seize cooperation opportunities. At this stage, operational agility can ensure the successful realization of cooperation commitments. Even if the needs of partners change, enterprises can quickly adjust and maintain the partnership. This agility effectively supports value co-creation.
However, excessive digital-intelligent transformation may make operations rigid. When technology becomes overly complex, systems relying on fixed processes find it difficult to cope with temporary adjustments. Existing digital systems are ill-equipped to meet non-standard and experimental cooperation needs. This limits the organization’s adaptability [37]. When digital applications become too widespread, excessive integration becomes a burden. Maintaining cross-departmental digital systems diverts managers’ attention. If managers focus only on technical issues, this can instead undermine the flexibility of the system [38]. Once digital-intelligent processes permeate the organization, even small changes can trigger chain reactions. This reduces the operational responsiveness of the enterprise. This study proposes the following hypotheses:
H2c. 
Operational agility mediates the inverted U-shaped relationship between digital-intelligent technology level and value co-creation.
H2d. 
Operational agility mediates the inverted U-shaped relationship between digital-intelligent application scope and value co-creation.

2.3. The Moderating Role of Network Embeddedness

Network embeddedness refers to an enterprise’s position within a cooperative network and the closeness of its relationships with other organizations [39]. It reflects the depth of collaboration between the enterprise and its stakeholders, such as suppliers, customers, and partners [40]. It is difficult for an enterprise to complete digital-intelligent transformation alone. In a complex collaborative network, the exchange of resources, knowledge, and information affects the strategic choices and innovation effects of the enterprise [41]. From this perspective, the success of digital-intelligent transformation not only depends on internal capabilities but is also influenced by the external network structure and quality. Network embeddedness is not an inherent capability of the enterprise. It is a relationship environment gradually formed by the enterprise through long-term interactions. This relationship helps the enterprise effectively acquire external knowledge and technology. By relying on these external connections, the enterprise can promptly grasp market and technological trends and make more reasonable decisions in complex environments [42,43]. These external resources can make up for the enterprise’s own technological deficiencies and promote a better combination of technology and business. The relationship is also associated with lower levels of data redundancy arising from excessive digital-intelligent transformation, as well as lower cognitive pressure and fewer management conflicts. Therefore, network embeddedness, as a situational condition, affects the specific path for value co-creation in the realization of digital-intelligent transformation.
Network embeddedness can help enterprises leverage the knowledge of their partners to overcome obstacles in technological integration. Such cooperation not only enhances the impetus for value creation in digital transformation but also improves the efficiency of enterprises in absorbing and transforming digital technologies [44,45]. However, fundamentally, excessive embeddedness can have negative impacts. On one hand, overly relying on stable partnership networks can make organizations rigid and slow in responding to new technological opportunities. On the other hand, the more partners there are, the more communication and coordination costs there will be to maintain the network’s operation [46]. In such cases, when enterprises make decisions, they can only prioritize the interests of existing partners rather than choosing the best option in the market. This makes enterprises more resistant to technological upgrades and inhibits innovation [47]. When network embeddedness exceeds a certain level, its promoting effect on digital-intelligent transformation will weaken due to various conflicts of interest canceling each other out.
Hence, network embeddedness plays a moderating role between digital-intelligent transformation and value co-creation. Enterprises with low levels of network embeddedness have difficulty obtaining external support during the transformation process. Even a slight increase in investment may coincide with resource shortages and rapidly diminishing returns. Companies with high levels of network embeddedness have stronger risk resistance and a longer period of profitability. In this case, the turning point of declining transformation returns is delayed, and the overall gain process is more stable. This paper proposes the following hypotheses:
H3a. 
Network embeddedness moderates the inverted U-shaped relationship between digital-intelligent technology level and value co-creation, meaning that higher network embeddedness expands the scope of benefits brought by digital-intelligent transformation.
H3b. 
Network embeddedness moderates the inverted U-shaped relationship between digital-intelligent application scope and value co-creation, meaning that higher network embeddedness expands the beneficial scope of digital-intelligent transformation.
Figure 1 presents the conceptual model of this study. Digital-intelligent transformation consists of two dimensions: digital-intelligent technology level and digital-intelligent application scope. Both dimensions affect value co-creation through direct and indirect mechanisms via organizational agility. Market agility and operational agility together play a mediating role in these relationships. Network embeddedness serves as a boundary condition and moderates the relationship between digital-intelligent transformation and value co-creation. The paths in the figure correspond to hypotheses H1–H3.

3. Research Design

3.1. Data Sources and Sample

This study focuses on manufacturing firms because they are deeply embedded in complex supply chain networks, where close inter-firm collaboration makes value co-creation particularly salient. In addition, manufacturing was among the earliest sectors to adopt digital-intelligent transformation, providing an appropriate context for examining the relationship between digital-intelligent transformation and value co-creation. Focusing on a single industry also helps reduce inter-industry heterogeneity and improves the comparability of empirical results. Data were collected from May to August 2025. The sampling frame consisted of middle and senior managers of manufacturing enterprises across China, who are well positioned to evaluate both digital-intelligent transformation and cross-firm collaboration. Respondents were approached through a combination of online and offline channels. The online survey was mainly administered through Wenjuanxing, whereas the offline survey relied on enterprise visits and professional contacts. A total of 585 questionnaires were distributed, and 476 were returned, yielding a response rate of 81.37%. After excluding questionnaires with incomplete responses, logical contradictions, or implausibly short completion times, 418 valid responses remained, corresponding to an effective response rate of 71.45%. The sample covered approximately eight manufacturing sub-sectors, including equipment manufacturing, electronics, automotive, chemical, textile, food processing, pharmaceutical, and metal products industries. Firms from different regions and of different sizes were included, providing sufficient heterogeneity for empirical analysis. Firm size was classified according to the criteria issued by the Ministry of Industry and Information Technology of China. Firms with more than 500 employees were assigned to the larger-firm group; those with 500 employees or fewer were assigned to the smaller-firm group.

3.2. Variable Measurement

All variables were measured using a 5-point Likert scale.
Independent variables: Following the research of Nambisan et al. (2017) [48] and Yang et al. (2022) [49], we measured digital-intelligent transformation from two dimensions: digital-intelligent technology level (DITL) and digital-intelligent application scope (DIAS).
Dependent variable: This paper used the scale developed by Akter et al. (2022) [50] to measure value co-creation (VCC).
Mediating variables: We divided organizational agility (OA) into two dimensions: market agility (MA) and operational agility (OPA) [51].
Moderating variable: Network embeddedness (NE). We used the scale proposed by Xie et al. [52] to measure the degree of embeddedness of firms in market relationships and technology cooperation networks.
To control for potential heterogeneity at the firm level, we included variables such as firm age, firm size, annual revenue, ownership type, industry, and province as control variables in the model.

3.3. Common Method Bias and Validity Tests

3.3.1. Common Method Bias

Common method variance was addressed both procedurally and statistically. Procedurally, the questionnaire guaranteed anonymity, randomized item order, and used clearly distinct response anchors so that respondents could not easily infer the hypothesized relationships. Statistically, we first applied Harman’s single-factor test. As shown in Table 1, the first unrotated component explained 31.25% of the variance, below the commonly used threshold of 40% [53]. We recognize that Harman’s test alone cannot completely rule out common method bias. As shown in Table 2, the hypothesized six-factor model exhibited a satisfactory fit (χ2/df = 1.74, CFI = 0.946, TLI = 0.939, RMSEA = 0.042), whereas the single-factor model fit the data poorly (χ2/df = 7.78, CFI = 0.547, TLI = 0.511, RMSEA = 0.129), suggesting that a single method factor could not adequately account for the covariation among the variables. Finally, common method bias may inflate linear associations but is unlikely to generate the significant quadratic and interaction effects central to this study, because respondents are unlikely to report data in an interaction-consistent pattern. Taken together, these findings suggest that common method variance is unlikely to pose a serious threat to the findings.

3.3.2. Reliability and Validity Tests

Table 3 reports the results of the reliability and validity tests. The Cronbach’s α coefficients for all constructs were above 0.84. CR values exceeded 0.85, and AVE values were above the critical threshold of 0.54. This indicates that the scale has good internal consistency and convergent validity.

4. Empirical Results and Analysis

4.1. Descriptive Statistics and Correlation Analysis

Table 4 presents the mean values, standard deviations, and correlation coefficients of the main variables. The results show that there was a positive correlation between DITL and DIAS, with a correlation coefficient of 0.637 (p < 0.001). This value is below the collinearity threshold of 0.70, indicating that there are no serious multicollinearity problems between the variables.
Both dimensions were positively correlated with value co-creation. The correlation coefficient between DITL and VCC was 0.524, and that between DIAS and VCC was 0.561, and both were significant at the p < 0.001 level. DITL and DIAS were also positively correlated with MA and OPA, providing preliminary evidence for subsequent analyses. NE was significantly correlated with all core variables. This lays the foundation for further testing of its moderating effect.

4.2. Hierarchical Regression Analysis

4.2.1. Test of Direct Effects

Table 5 reports the hierarchical regression results. Model 1, which included only the control variables, explained 14.9% of the variance in VCC. Model 2 introduced linear terms for DITL and DIAS, both of which were significantly positive (DITL: β = 0.318, p < 0.001; DIAS: β = 0.283, p < 0.001), significantly enhancing model explanatory power (ΔR2 = 0.288, p < 0.001). Model 3 included the quadratic term of DITL. The results show that the coefficient of DITL2 was significantly negative (β = –0.094, p < 0.001). This suggests an inverted U-shaped relationship between DITL and VCC. Model 4 included the corresponding quadratic terms for both DITL and DIAS dimensions. DITL2 (β = –0.086, p < 0.001) and DIAS2 (β = –0.078, p < 0.01) remained significantly negative, further supporting the inverted U-shaped relationship hypothesized in H1a and H1b.
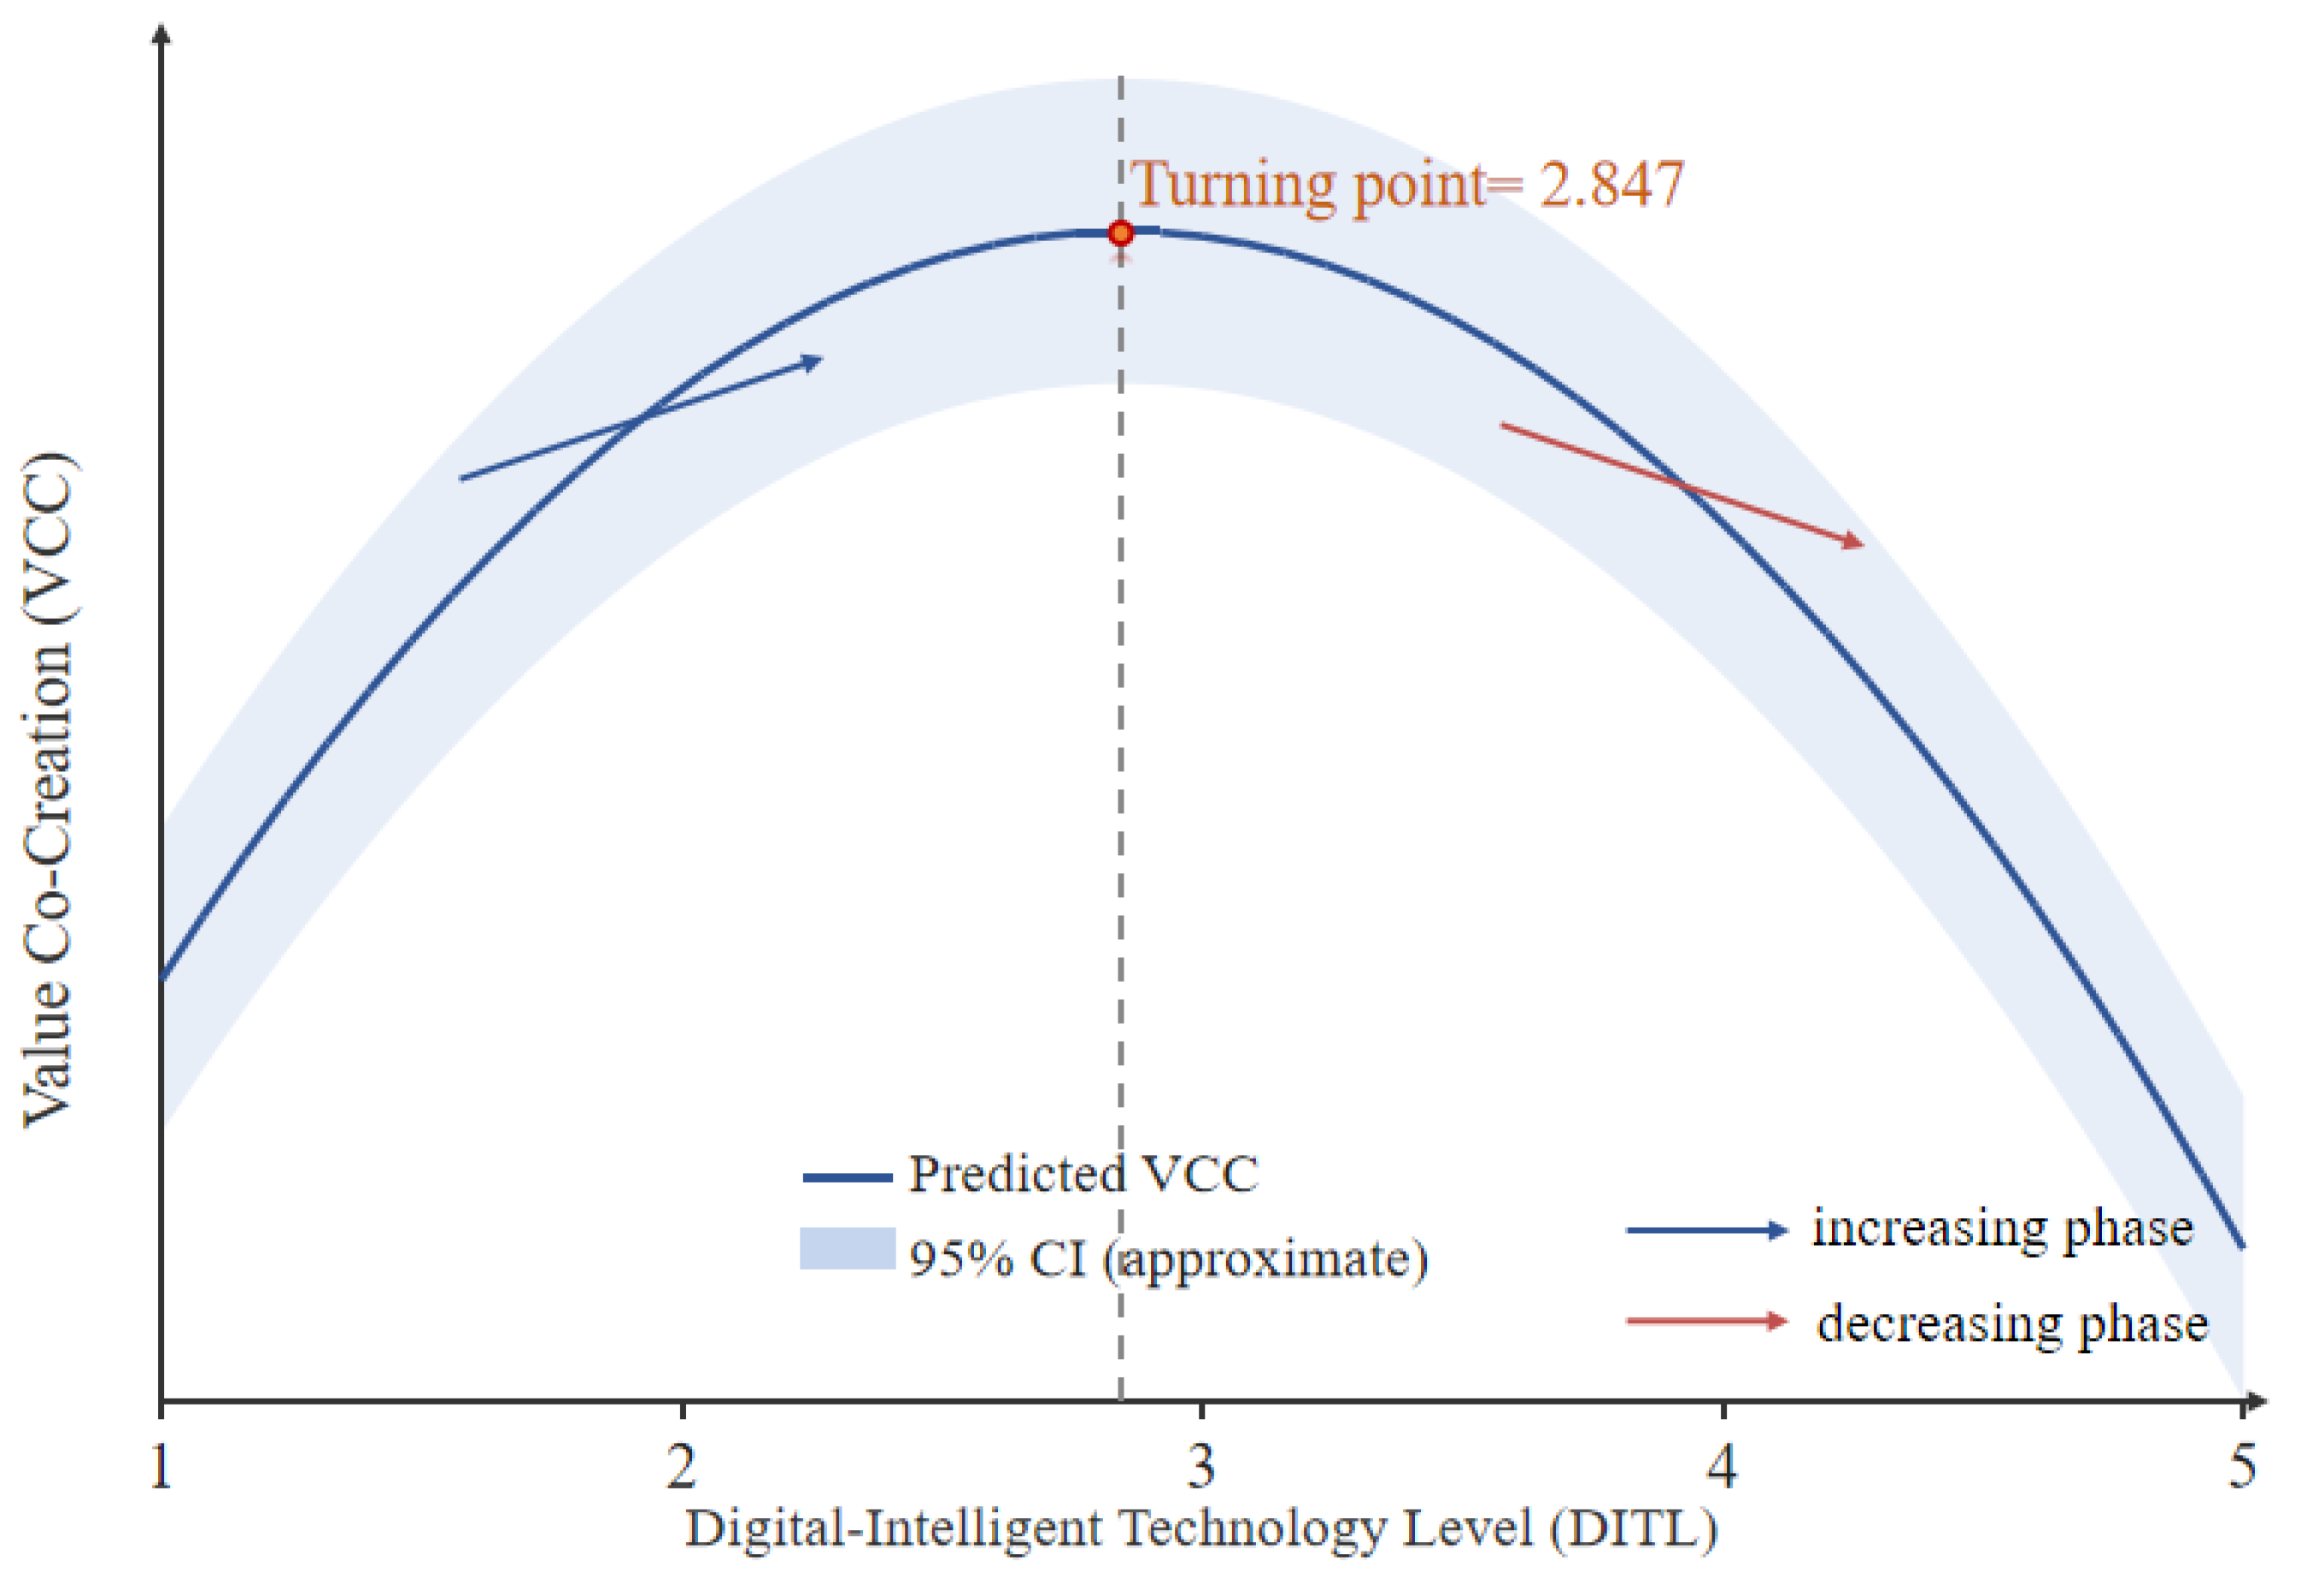
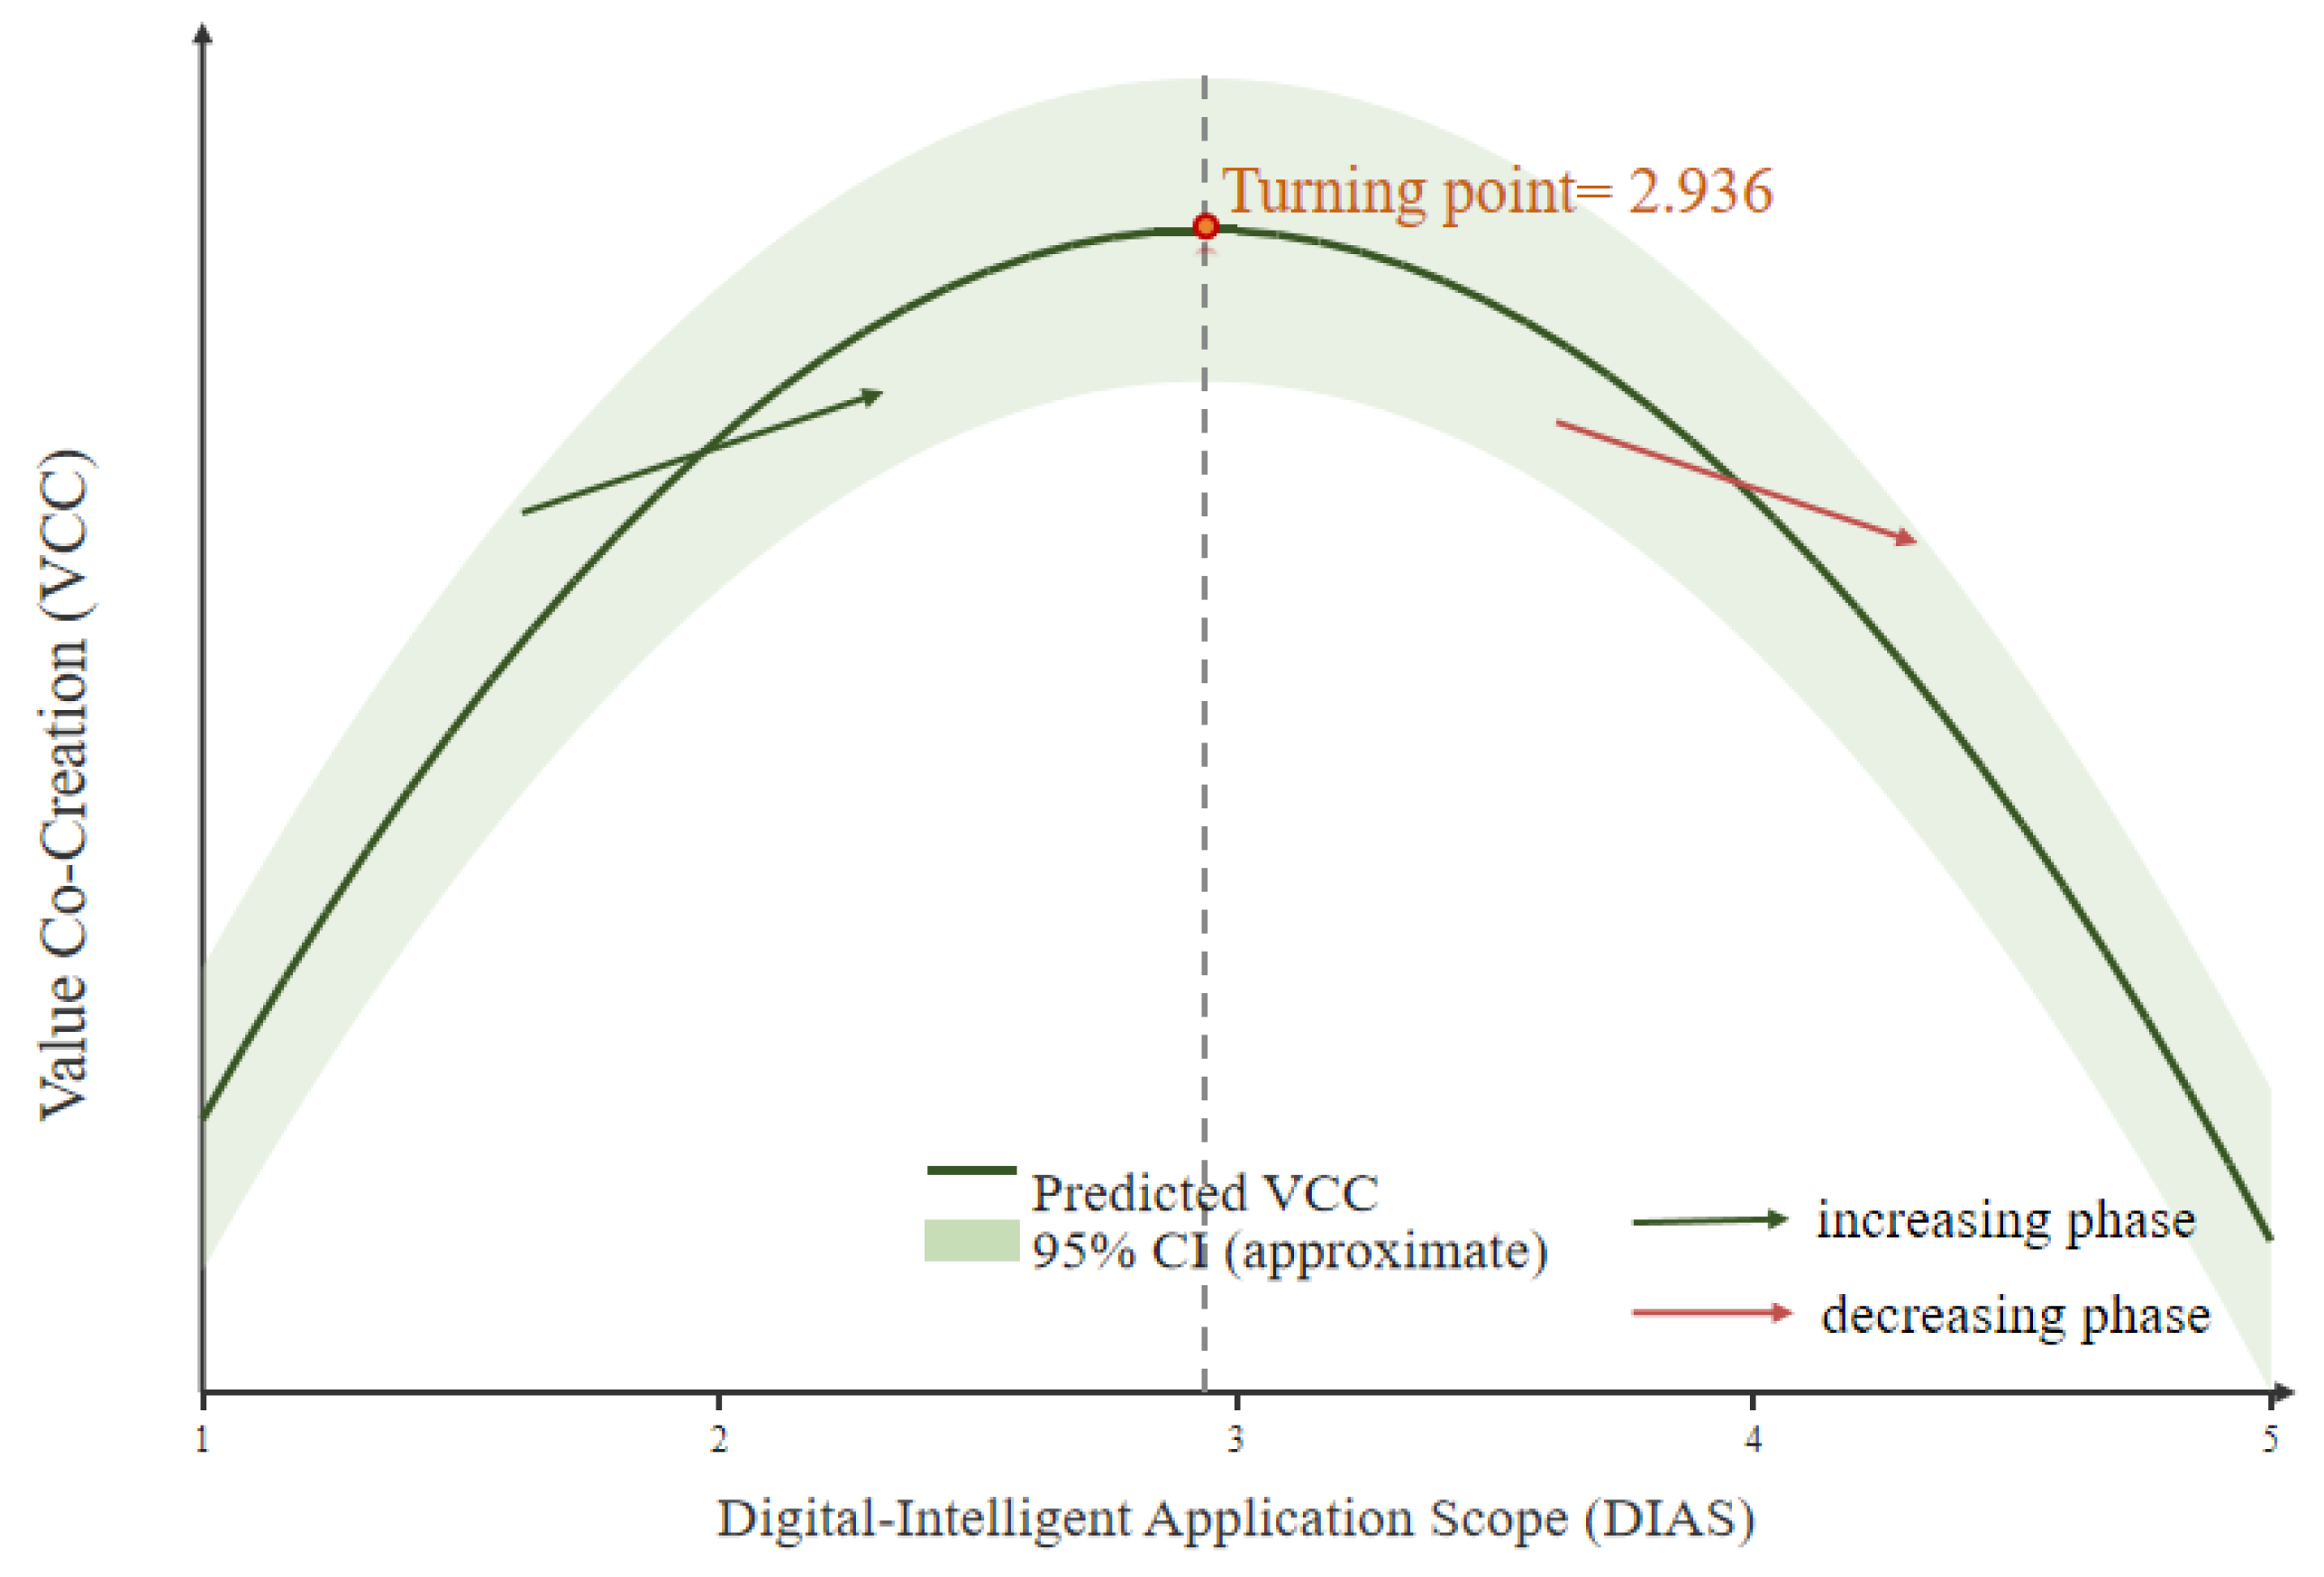
This paper employed the utest method to verify the conclusion and to examine the relationship between DITL and VCC more intuitively. In Figure 2 and Figure 3, it can be seen that both curves exhibit an inverted U-shaped trend. This indicates that in the initial stage of transformation, the level of value co-creation by enterprises will increase accordingly. However, when the transformation intensity exceeds a certain critical point, value co-creation will instead decline. Specifically, the inflection point of DITL appears at 2.847, and its 95% confidence interval is [2.634, 3.060], which is within the sample range [1.00, 5.00]. The slope to the left of the inflection point is 0.426 (p < 0.001), and the slope to the right is −0.267 (p < 0.001). This further verifies the inverted U-shaped relationship between DITL and value co-creation. In Figure 3, the inflection point of DIAS is 2.936, and its 95% confidence interval is [2.718, 3.154], which is also within the valid observation range. The slope to the left of the inflection point is 0.398 (p < 0.001), and the slope to the right is −0.241 (p < 0.01). These findings provide further empirical support for Hypothesis 1, indicating that both dimensions of digital-intelligent transformation exert significant inverted U-shaped effects on value co-creation.
The two inflection points carry a concrete managerial meaning. The turning point for technology depth (2.847) is slightly lower than that for application breadth (2.936), both near the midpoint of the five-point scale, which indicates that firms tend to exhaust their capacity to absorb deeper analytics before they exhaust their capacity to coordinate broader deployment. In practice, a firm that layers advanced analytics onto a unit faster than its staff can interpret the output reaches diminishing returns sooner than a firm that extends a stable tool set across more processes. The steeper left-side slopes (0.426 and 0.398) relative to the right-side slopes (−0.267 and −0.241) further show that early gains exceed later losses, so transformation remains worthwhile up to, but not beyond, the turning point.

4.2.2. Test of Mediating Effects

Table 6 reports the results of testing the mediating effect of organizational agility between digital-intelligent transformation and value co-creation. Models 5 and 6, respectively, examine the impact of DITL and DIAS on the two dimensions of organizational agility. Model 5 revealed that DITL exerted a significant positive effect on market agility (β = 0.331, p < 0.001), but its quadratic term was significantly negative (β = −0.071, p < 0.01), indicating diminishing returns in the promotional effect of technological depth on market agility. Similarly, DIAS exhibited a positive linear effect (β = 0.305, p < 0.001) and a negative quadratic effect (β = −0.063, p < 0.05). These results support H2a and H2b, indicating an inverted U-shaped relationship between both dimensions and market agility. Model 6, which examined operational agility, revealed a similar pattern: both DITL (β = 0.368, p < 0.001) and DIAS (β = 0.341, p < 0.001) significantly and positively influenced operational agility, with both quadratic terms being significantly negative (DITL2: β = −0.058, p < 0.05; DIAS2: β = −0.051, p < 0.05), thereby supporting H2c and H2d.
Models 7 and 8 incorporated agility variables into the value co-creation regression model. The results show that both market agility (β = 0.354, p < 0.001) and operational agility (β = 0.389, p < 0.001) exerted significant positive effects on value co-creation, confirming their role as key mediating mechanisms. More importantly, after incorporating agility variables, the coefficients of the DITL and DIAS interaction terms significantly decreased, indicating that organizational agility partially mediates the effect of digital-intelligent transformation on value co-creation.
Bootstrap tests based on 5000 resamples further confirmed these mediating effects (Table 7). The indirect effect of DITL on value co-creation was 0.117 (95% CI [0.071, 0.174]) via market agility and 0.143 (95% CI [0.092, 0.204]) via operational agility. Similarly, DIAS influenced value co-creation through market agility (0.108, 95% CI [0.063, 0.162]) and operational agility (0.133, 95% CI [0.084, 0.191]). All confidence intervals excluded zero, supporting hypotheses H2a–H2d.
The two forms of agility did not transmit the effect equally. Technology depth acted more strongly through operational agility, with an indirect effect of 0.143, than through market agility, whose indirect effect was 0.117. This pattern is consistent with the idea that deeper analytics first reshape internal resource allocation and process execution. Application breadth transmitted through the two channels more evenly, with indirect effects of 0.108 through market agility and 0.133 through operational agility. This suggests that spreading digital tools across functions improves both external sensing and internal coordination. Market agility is the firm’s capacity to read and interpret external signals, whereas operational agility is its capacity to reconfigure internal processes; depth privileges the latter, while breadth engages both.

4.2.3. Test of Moderating Effects

Table 8 presents the results of testing the moderating effect of network embeddedness on the relationship between digital-intelligent transformation and value co-creation. Model 9 incorporated network embeddedness as an additional predictor variable based on the baseline model. The regression coefficient of network embeddedness was positive and statistically significant (β = 0.194, p < 0.001). This shows that the higher the degree of network embeddedness of an enterprise, the easier it is to achieve a higher level of value co-creation.
Model 10 tested the moderating effect of NE between DIT and VCC. The results showed that the interaction coefficient of DITL × NE was positive, and the results were statistically significant (β = 0.095, p < 0.01). This indicates that when the enterprise DITL is in the low and middle stages, NE is able to further strengthen its positive role in creating value. The DITL2 × NE interaction term was negative and significant (β = −0.025, p < 0.05), indicating that network embeddedness moderates the curvature of the inverted U-shaped curve between DITL and VCC. Specifically, high network embeddedness buffers the negative effects of excessive DITL, thereby expanding the range of positive contributions from DITL to VCC.
Model 11 examined the moderating effect of network embeddedness on the DIAS–VCC relationship. The DIAS × NE interaction term was positive and significant (β = 0.086, p < 0.05), suggesting that network embeddedness amplifies the positive influence of DIAS on VCC. The DIAS2 × NE interaction term was negative and significant (β = −0.022, p < 0.05), indicating that network embeddedness also moderates the curvature of the inverted U-shaped DIAS-VCC curve. Specifically, high network embeddedness mitigates the negative effects of excessive DIAS.
Model 12 incorporated all interaction terms, and the moderating effects remained significant. Collectively, network embeddedness significantly moderated the inverted U-shaped relationship between digital-intelligent transformation and value co-creation. Firms embedded in stronger networks can more effectively leverage digital technologies and expand their application scope while mitigating the coordination complexity and resource constraints arising from excessive transformation. Therefore, hypotheses H3a and H3b are supported.

4.3. Robustness Test

To further examine the robustness of the empirical results, this study employed bootstrap estimation and subsample regression analysis. For the subsample analysis, firms were divided into larger-firm and smaller-firm groups according to the number of employees. Firms with more than 500 employees were assigned to the larger-firm group, whereas those with 500 employees or fewer were assigned to the smaller-firm group. As shown in Table 9, the results based on 5000 bootstrap resamples indicate that the direct effects of DITL and DIAS on value co-creation remained significant in both the full sample and the two subsamples. The quadratic terms also remained significantly negative, consistent with the inverted U-shaped relationship identified in the main analysis. The indirect effects through market agility and operational agility remained significant in most cases, and the corresponding bootstrap confidence intervals did not include zero. No substantial differences in the mediation effects were observed across the two size groups. Overall, the bootstrap and subsample analyses suggest that the relationships identified in the main model remain stable under different sample structures, providing further support for the robustness of the findings.

5. Conclusions and Discussion

5.1. Summary of Findings

The central implication of our findings is that the value of digital-intelligent transformation is bounded: in a sample of 418 Chinese manufacturing firms, transformation is associated with value co-creation in an inverted U-shaped pattern, so the managerial question is not whether to transform, but how to locate and stay within the productive range. Crucially, this bound is not a fixed technological ceiling: where a firm sits relative to the turning point depends on how effectively organizational agility converts digital inputs into responsiveness, and network embeddedness can push the turning point outward, so two firms with comparable technological capability can fall on opposite sides of it. The manifestations of digital-intelligent overload vary significantly. Excessive technological investment is more likely to lead to cognitive burdens, while overly broad application scenarios exacerbate the complexity of internal and external collaboration. Enterprises cannot adopt a uniform approach to addressing digital-intelligent overload; they must adopt targeted identification and governance measures based on specific causes.
When explaining the inverted U-shaped relationship discovered in this study, it is necessary to discuss it in the context of China’s manufacturing system. In recent years, China has continuously advanced policy-guided digitalization strategies, such as “Made in China 2025” and the construction of industrial Internet platforms. These policies have significantly enhanced the impetus for enterprises to undergo digital-intelligent transformation in the short term. Driven by these policies, many manufacturing enterprises have made high-intensity digital technology investments in the short term. Their technological adoption may be expanding faster than their organizational capacity can absorb it. When there is a temporal mismatch between technological expansion and capability accumulation, enterprises will reach the boundary of information-processing capabilities earlier, causing the inverted U-shaped inflection point to occur at a lower transformation intensity. The empirical results of this study also support this pattern, indicating that some Chinese enterprises may approach or enter an over-transformation state in the early stage of transformation. From the perspective of cross-context comparison, the digital transformation of enterprises in developed economies such as Germany and the United States relies more on market signals and competitive pressures. The transformation pace is more gradual, and enterprises have more time to enhance technology and organizational capabilities simultaneously. In such contexts, the inverted U-shaped relationship may still exist, but the turning point usually occurs at a higher transformation intensity. In emerging economies with incomplete institutional environments and digital infrastructure, the role of external cooperation networks is more significant. Enterprises can rely on industrial networks to make up for their resource shortcomings and alleviate the negative effects of transformation. Overall, although the position of the turning point varies in different institutional contexts, the core mechanism proposed in this study has cross-context applicability. When the depth and breadth of digital transformation exceed the organizational information-processing capabilities, the positive effect will gradually turn negative. Future research can test the model in more institutional and industrial scenarios to systematically analyze the influence of contextual factors on the inverted U-shaped relationship and the turning point.
Three alternative explanations deserve consideration. First, reverse causality: firms already strong in value co-creation may invest more in transformation. This cannot be excluded using cross-sectional data; however, reverse causation would predict a monotonic relationship, not the downturn we observe, so the inverted U is difficult to generate through reverse causation alone. Second, capability-driven selection: more capable firms may both transform more and co-create more, so transformation could proxy for underlying capability. We control for firm age, size, revenue, and ownership, and the curvature survives; however, fully separating transformation effects from pre-existing capability would require a longitudinal or quasi-experimental design, which we identify as a priority for future work. Third, industry heterogeneity: although we restrict the sample to manufacturing to hold industry broadly constant, sub-sector differences in digital maturity may shift the turning point. The subsample results by firm size are stable, which is reassuring, but a cross-industry test remains an important robustness check for future work.

5.2. Theoretical Contributions

The theoretical contributions of this study are mainly reflected in three aspects:
(1)
This study deconstructs the dimensions of digital-intelligent transformation and reveals different failure mechanisms in the transformation process. Existing studies mostly regard digital-intelligent transformation as a single dimension and fail to pay attention to the differentiated mechanisms behind over-transformation. This paper empirically finds that DITL and DIAS each exhibit independent inverted U-shaped relationships. The quadratic terms of both have a significant effect on the model. This shows that transformation optimization needs to be based on precise policies tailored to different dimensions. This study also finds that the inflection point threshold of technology level is slightly lower than that of application breadth, indicating that the former is more likely to cause cognitive fatigue, while the latter is more likely to exacerbate coordination complexity. This study expands the theoretical boundaries of digital transformation and confirms that the digital paradox is not a single phenomenon but rather has differentiated manifestations in different transformation dimensions.
(2)
This study reveals the capability transmission mechanism behind the digital-intelligent transformation curve through mediation effect analysis. The level and scope of digital-intelligent technologies both influence value creation through organizational agility. Both dimensions have an inverted U-shaped effect on market agility and operational agility, transmitting the promoting or constraining effects of digital-intelligent transformation to the value co-creation outcomes. After incorporating overall agility into the model, the secondary effects of digital-intelligent technology level and application scope on value co-creation decrease or even become insignificant, verifying the partial mediating role of organizational agility. Comparing the action paths of different dimensions reveals differences in the capability formation mechanism between the two transformation approaches. The level of digital-intelligent technological adoption has a relatively stronger impact on operational agility, indicating that the improvements in technological depth are mainly reflected in the enterprise’s internal resource restructuring and process adjustment capabilities. In contrast, the driving effect of the breadth of digital-intelligent applications on the two types of agility is roughly equivalent. After digital technologies are implemented in various business processes, they effectively break down departmental barriers. By leveraging cross-functional integration, enterprises can more accurately seize external opportunities and significantly enhance internal collaboration efficiency. The research conclusions of this article expand the scope of the dynamic capability theory. Different dimensions of digital-intelligent transformation pass through different types of organizational agility and thereby shape the quality of both internal and external collaboration, ultimately influencing value co-creation. Beyond this internal transmission mechanism, the outer boundary of beneficial transformation is not fixed by the firm’s internal capacity alone but is shaped by its relational context.
(3)
This study found that network embeddedness plays a buffering role in the digital-intelligent transformation process. It expands the boundaries of enterprises’ transformation activities. Network embeddedness integrates the relational resources of enterprises in market and technological networks. Enterprises can access more external knowledge, experience references, and collaborative support when promoting digital-intelligent transformation. Empirical analysis found that network embeddedness has a significant moderating effect on the level and scope of digital-intelligent technology, extending the effective range of value co-creation to the right as a whole. The moderation results assign network embeddedness a distinct theoretical role rather than a secondary one. In information-processing terms, embeddedness is an external extension of the firm’s processing capacity. The positive interaction terms (DITL × NE = 0.095; DIAS × NE = 0.086) show that, in the rising region, well-embedded firms convert transformation into value more effectively because partners supply interpretive knowledge and practical experience that the firm lacks internally. The negative quadratic interactions (DITL2 × NE = −0.025; DIAS2 × NE = −0.022) show that embeddedness also flattens the downturn, that is, it moves the turning point to the right. Theoretically, this means that the boundary of beneficial transformation is not fixed by the firm’s internal capacity alone but is co-determined by its relational position: embeddedness externalizes part of the processing load onto the network, through shared knowledge that reduces analytical burden and through trust-based informal coordination that absorbs the rigidity of digital systems. This reframes network embeddedness from a background variable into a strategic lever for extending the safe range of transformation. Beyond information processing, network embeddedness also carries significance for the service-dominant logic framing of value co-creation: embeddedness is not merely a resource-access mechanism but a relational precondition for the trust and reciprocity that multi-actor resource integration requires. Firms with deeper network ties are better positioned to enact the collaborative, iterative value-creation process that service-dominant logic describes, and this relational readiness amplifies the productive range of digital-intelligent transformation rather than merely buffering its excesses. Taken together, these two mechanisms, namely external supplementation of information-processing capacity and the relational foundations of value co-creation, provide network embeddedness with a theoretical role that is comparable to, rather than secondary to, that of organizational agility.

5.3. Managerial Implications

(1)
Enterprises need to identify and manage the turning points of digital-intelligent transformation. Managers should not assume that increasing technology investment will necessarily improve collaborative performance. Instead, they should proactively identify signals that the enterprise is approaching the transformation threshold and dynamically adjust the pace of transformation. Enterprises can establish a digital-intelligent performance monitoring mechanism to capture signs of over-transformation. Regarding the depth of technology, if managers find that large volumes of data do not yield useful insights, or that the conclusions given by different platforms conflict with one another, it means that the analytical capabilities are no longer keeping up. At this stage, the enterprise should stop purchasing new systems. Enterprises should focus their efforts on data governance and employee training. They should fully assimilate existing technologies. From the perspective of application scope, when a company launches a large number of systems in multiple departments simultaneously, cross-departmental collaboration becomes extremely complex. If employees are tired because of frequent platform changes, it means that the pace of transformation is too fast. In this case, managers should integrate existing platforms and simplify internal business processes. Before starting a new round of technology expansion, enterprises must first ensure that the current system operates stably. In order to truly realize efficient digital-intelligent transformation, the focus is not to constantly increase technology investment, but to find a reasonable balance between the depth and breadth of technology application.
(2)
Enterprises need to find a suitable balance between digital transformation and improvement of organizational agility. Organizational agility is the key for enterprises to achieve value co-creation. However, it should be noted that such agility cannot be automatically achieved merely through digital technology; rather, it requires meticulous design and cultivation by enterprises. When managers evaluate digital technology investments, they should not only consider the capabilities of the technology itself, but also whether these investments enhance the enterprise’s ability to perceive and respond to market changes. Throughout system implementation, enterprises must maintain their own agility. When managers design work processes, they should be able to accommodate abnormal situations and avoid forcing strict adherence to fixed rules. Enterprises should grant authorization to front-line teams and, when necessary, allow them to deviate from standardized processes to promote collaboration. Regularly assess digital tools should be regularly assessed to determine whether they accelerate decision-making speed or add bureaucratic obstacles. When enterprises find that excessive transformation is risky, they should refrain from introducing new digital technologies. The focus should be on enhancing the organization’s ability to absorb and utilize existing systems. For example, prioritize optimizing data management and work processes, enhancing employee skills, and integrating fragmented platforms, so that the existing technologies can fully realize their potential. Enterprises should implement technological transformation in stages and not blindly expand into multiple areas simultaneously. Only by giving the organization sufficient time to learn and adapt can true capabilities be accumulated. This gradual transformation approach enables enterprises to fully leverage their technological advantages and avoids the extra coordination costs and organizational burdens that excessive transformation imposes.
(3)
Enterprises can alleviate the negative effects of digital transformation by strengthening network embeddedness. Network embeddedness is associated with a stronger positive relationship between transformation and value creation. This enables enterprises to benefit continuously from higher technological investment while delaying the emergence of negative effects. This buffering effect is mainly manifested in two aspects. The first is the supplementation of external capabilities. Enterprises can leverage the cooperative network to draw on the technical experience of partners. When their internal data analysis capabilities are insufficient, they can obtain technical support from partners. If the digital system makes the internal processes overly rigid, the enterprise can also flexibly respond based on trust relationships formed through long-term cooperation, reducing operational obstacles. The second is the improvement of organizational adaptability. Long-term and stable cooperative relationships can promote the formation of trust among enterprises. This enables enterprises to have greater resilience when dealing with technical challenges and transformation risks. More importantly, this flexible informal coordination can compensate for the rigidity constraints brought by digital systems, leaving more room for managerial discretion. Enterprises with strong external networks can rely on cooperative relationships to promote deeper digital-intelligent transformation. Enterprises with weaker external networks should be more cautious and clearly define their transformation boundaries. Such enterprises can first establish stable cooperative relationships and then carry out large-scale digital investment. In this way, even if there are problems with the internal system, external cooperation can provide sufficient flexibility as support during the transformation process. During the transformation, enterprises should actively build open cooperative relationships by collaborating with technology providers, upstream and downstream enterprises, and platform parties. By leveraging external resources, enterprises can maximize the effectiveness of their digital-intelligent transformation.

5.4. Limitations and Future Research

This study has several limitations. In the future, these can be further addressed in three aspects:
(1) The design is single-wave: each firm is measured at one point in time. A credible second wave would require tracking the same firms over an extended period, and combining data of different provenance would compromise the consistency of the sample; longitudinal evidence is therefore left as a priority for future work. Subsequent studies should use multi-wave panel data on the same firms or exploit a staged policy, such as the smart-manufacturing pilot programs, as a quasi-natural experiment to track the turning point over time and to separate transformation effects from pre-existing firm capability.
(2) The research sample is concentrated in China’s manufacturing industry, and the external validity of the findings is limited. In the future, similar studies can be conducted across more industries, and the effects of digital-intelligent transformation in different institutional environments can also be compared.
(3) The mechanism is captured only through organizational agility. Subsequent studies should introduce additional mediating constructs, such as absorptive capacity, data governance maturity, and innovation heterogeneity, and should directly measure information-processing load rather than infer it to further open the black box through which digital-intelligent transformation influences value co-creation.

Author Contributions

Conceptualization, R.M.; methodology, R.M.; formal analysis, R.M.; investigation, R.M.; data curation, R.M.; writing—original draft preparation, R.M.; writing—review and editing, R.M. and X.W.; supervision, R.M.; project administration, R.M.; validation, X.W. All authors have read and agreed to the published version of the manuscript.

Funding

This research received no external funding.

Institutional Review Board Statement

Ethical review and approval were waived for this study due to an official statement issued by the School of Economics and Management of Northwest University, which confirms that the present study meets the exemption criteria set forth in Article 32 of the Measures for Ethical Review of Life Science and Medical Research Involving Humans (2023) and therefore does not require formal ethical review approval. The official regulation is available at https://www.nhc.gov.cn/qjjys/c100016/202302/6b6e447b3edc4338856c9a652a85f44b.shtml, accessed on 1 July 2026.

Informed Consent Statement

Informed consent was obtained from all subjects involved in the study.

Data Availability Statement

The data that support the findings of this study are available from the corresponding author upon reasonable request.

Acknowledgments

The authors would like to thank all respondents who participated in this survey for their valuable time and support. The authors also express their gratitude to the colleagues and experts who provided helpful comments and suggestions during the development of this study.

Conflicts of Interest

The authors declare that they have no known competing financial interests or personal relationships that could have appeared to influence the work reported in this paper.

References

  1. Hannah, D.P.; Eisenhardt, K.M. How Firms Navigate Cooperation and Competition in Nascent Ecosystems. Strateg. Manag. J. 2018, 39, 3163–3192. [Google Scholar] [CrossRef]
  2. Vargo, S.L.; Lusch, R.F. Institutions and Axioms: An Extension and Update of Service-Dominant Logic. J. Acad. Mark. Sci. 2016, 44, 5–23. [Google Scholar] [CrossRef]
  3. von Briel, F.; Recker, J.; Davidsson, P. Not All Digital Venture Ideas Are Created Equal: Implications for Venture Creation Processes. J. Strateg. Inf. Syst. 2018, 27, 278–295. [Google Scholar] [CrossRef]
  4. Zhang, C.; Zhang, S.; Zhou, Z.; He, B. Merging Economic Aspirations with Sustainability: ESG and the Evolution of the Corporate Development Paradigm in China. Sustainability 2025, 17, 9108. [Google Scholar] [CrossRef]
  5. Ding, W.C.; Keoy, K.H. Green Growth at Risk: The Role of Geopolitical Risk and Economic Policy Uncertainty on Green Production Practices. Humanit. Soc. Sci. Commun. 2026. advance online publication. [Google Scholar] [CrossRef]
  6. Hanelt, A.; Bohnsack, R.; Marz, D.; Antunes Marante, C. A Systematic Review of the Literature on Digital Transformation: Insights and Implications for Strategy and Organizational Change. J. Manag. Stud. 2021, 58, 1159–1197. [Google Scholar] [CrossRef]
  7. Yoo, Y.; Henfridsson, O.; Lyytinen, K. Research Commentary—The New Organizing Logic of Digital Innovation: An Agenda for Information Systems Research. Inf. Syst. Res. 2010, 21, 724–735. [Google Scholar] [CrossRef]
  8. Yoo, Y.; Boland, R.J., Jr.; Lyytinen, K.; Majchrzak, A. Organizing for Innovation in the Digitized World. Organ. Sci. 2012, 23, 1398–1408. [Google Scholar] [CrossRef]
  9. Fichman, R.G.; Dos Santos, B.L.; Zheng, Z. Digital Innovation as a Fundamental and Powerful Concept in the Information Systems Curriculum. MIS Q. 2014, 38, 329–354. [Google Scholar] [CrossRef]
  10. Kliestik, T.; Nica, E.; Durana, P.; Popescu, G.H. Artificial Intelligence-Based Predictive Maintenance, Time-Sensitive Networking, and Big Data-Driven Algorithmic Decision-Making in the Economics of Industrial Internet of Things. Oecon. Copernic. 2023, 14, 1097–1138. [Google Scholar] [CrossRef]
  11. van der Vlist, F.; Helmond, A.; Ferrari, F. Big AI: Cloud Infrastructure Dependence and the Industrialisation of Artificial Intelligence. Big Data Soc. 2024, 11, 20539517241232630. [Google Scholar] [CrossRef]
  12. Vermesan, O.; Bacquet, J. (Eds.) Cognitive Hyperconnected Digital Transformation: Internet of Things Intelligence Evolution; River Publishers: Gistrup, Denmark, 2022; ISBN 978-87-7022-478-5. [Google Scholar]
  13. Ekman, P.; Thilenius, P.; Thompson, S.; Whitaker, J. Digital Transformation of Global Business Processes: The Role of Dual Embeddedness. Bus. Process Manag. J. 2020, 26, 570–592. [Google Scholar] [CrossRef]
  14. Li, L.; Wang, Z.; Ye, F.; Chen, L.; Zhan, Y. Digital Technology Deployment and Firm Resilience: Evidence from the COVID-19 Pandemic. Ind. Mark. Manag. 2022, 105, 190–199. [Google Scholar] [CrossRef]
  15. Bai, B. Understanding the Role of Demand and Supply Integration in Achieving Retail Supply Chain Agility: An Information Technology Capability Perspective. Manag. Decis. Econ. 2024, 45, 554–570. [Google Scholar] [CrossRef]
  16. Zheng, J.; Zhang, J.Z.; Kamal, M.M.; Mangla, S.K. A Dual Evolutionary Perspective on the Co-Evolution of Data-Driven Digital Transformation and Value Proposition in Manufacturing SMEs. Int. J. Prod. Econ. 2025, 282, 109561. [Google Scholar] [CrossRef]
  17. Hauke-Lopes, A.; Ratajczak-Mrozek, M.; Wieczerzycki, M. Value co-creation and co-destruction in the digital transformation of highly traditional companies. J. Bus. Ind. Mark. 2023, 38, 1316–1331. [Google Scholar] [CrossRef]
  18. Park, Y.; Mithas, S. Organized Complexity of Digital Business Strategy: A Configurational Perspective. MIS Q. 2020, 44, 85–128. [Google Scholar] [CrossRef]
  19. Mao, H.; Liu, S.; Zhang, J.; Zhang, Y.; Gong, Y. Information Technology Competency and Organizational Agility: Roles of Absorptive Capacity and Information Intensity. Inf. Technol. People 2021, 34, 421–451. [Google Scholar] [CrossRef]
  20. Srinivasan, R.; Swink, M. An Investigation of Visibility and Flexibility as Complements to Supply Chain Analytics: An Organizational Information Processing Theory Perspective. Prod. Oper. Manag. 2018, 27, 1849–1867. [Google Scholar] [CrossRef]
  21. Teece, D.J. Explicating Dynamic Capabilities: The Nature and Microfoundations of (Sustainable) Enterprise Performance. Strateg. Manag. J. 2007, 28, 1319–1350. [Google Scholar] [CrossRef]
  22. Lu, Y.; Ramamurthy, K. Understanding the Link Between Information Technology Capability and Organizational Agility: An Empirical Examination. MIS Q. 2011, 35, 931–954. [Google Scholar] [CrossRef]
  23. AlNuaimi, B.K.; Singh, S.K.; Ren, S.; Budhwar, P.; Vorobyev, D. Mastering Digital Transformation: The Nexus Between Leadership, Agility, and Digital Strategy. J. Bus. Res. 2022, 145, 636–648. [Google Scholar] [CrossRef]
  24. Teece, D.J. A Dynamic Capabilities-Based Entrepreneurial Theory of the Multinational Enterprise. In The Eclectic Paradigm; Cantwell, J., Ed.; Palgrave Macmillan: London, UK, 2015; pp. 95–116. [Google Scholar] [CrossRef]
  25. Tan, F.T.C.; Pan, S.L.; Zuo, M. Realising Platform Operational Agility Through Information Technology–Enabled Capabilities: A Resource-Interdependence Perspective. Inf. Syst. J. 2019, 29, 582–608. [Google Scholar] [CrossRef]
  26. Tallon, P.P.; Queiroz, M.; Coltman, T.; Sharma, R. Information Technology and the Search for Organizational Agility: A Systematic Review with Future Research Possibilities. J. Strateg. Inf. Syst. 2019, 28, 218–237. [Google Scholar] [CrossRef]
  27. Cai, Z.; Liu, H.; Huang, Q.; Liang, L. Developing Organizational Agility in Product Innovation: The Roles of IT Capability, KM Capability, and Innovative Climate. R&D Manag. 2019, 49, 421–438. [Google Scholar] [CrossRef]
  28. Ambroise, L.; Prim-Allaz, I.; Teyssier, C.; Peillon, S. The Environment-Strategy-Structure Fit and Performance of Industrial Servitized SMEs. J. Serv. Manag. 2018, 29, 301–328. [Google Scholar] [CrossRef]
  29. Wamba-Taguimdje, S.; Fosso Wamba, S.; Kala Kamdjoug, J.R.; Tchatchouang Wanko, C.E. Influence of Artificial Intelligence (AI) on Firm Performance: The Business Value of AI-Based Transformation Projects. Bus. Process Manag. J. 2020, 26, 1893–1924. [Google Scholar] [CrossRef]
  30. Pagani, M.; Pardo, C. The Impact of Digital Technology on Relationships in a Business Network. Ind. Mark. Manag. 2017, 67, 185–192. [Google Scholar] [CrossRef]
  31. Gupta, S.; Kumar, S.; Kamboj, S.; Bhushan, B.; Luo, Z. Impact of IS Agility and HR Systems on Job Satisfaction: An Organizational Information Processing Theory Perspective. J. Knowl. Manag. 2019, 23, 1782–1805. [Google Scholar] [CrossRef]
  32. Seppänen, S. Digital Transformation in SMEs: Drivers, Challenges, and the Impact of Emerging Technologies on Decision-Making and Management Control. Master’s Thesis, Tampere University, Tampere, Finland, 2025. Available online: https://urn.fi/URN:ISBN:978-952-412-269-6 (accessed on 1 June 2026).
  33. Liu, R.; Long, J.; Liu, L. Seeking the Resilience of Service Firms: A Strategic Learning Process Based on Digital Platform Capability. J. Serv. Mark. 2023, 37, 371–391. [Google Scholar] [CrossRef]
  34. Tan, F.T.C.; Tan, B.; Wang, W.; Sedera, D. IT-Enabled Operational Agility: An Interdependencies Perspective. Inf. Manag. 2017, 54, 292–303. [Google Scholar] [CrossRef]
  35. Wu, L.; Liu, H.; Bao, Y. Outside-In Thinking, Value Chain Collaboration and Business Model Innovation in Manufacturing Firms. J. Bus. Ind. Mark. 2022, 37, 1745–1761. [Google Scholar] [CrossRef]
  36. Paiola, M.; Gebauer, H. Internet of Things Technologies, Digital Servitization and Business Model Innovation in BtoB Manufacturing Firms. Ind. Mark. Manag. 2020, 89, 245–264. [Google Scholar] [CrossRef]
  37. Khuat, T.T.; Kedziora, D.J.; Gabrys, B. The Roles and Modes of Human Interactions with Automated Machine Learning Systems: A Critical Review and Perspectives. Found. Trends Hum.-Comput. Interact. 2023, 17, 195–387. [Google Scholar] [CrossRef]
  38. Kallinikos, J.; Aaltonen, A.; Marton, A. The Ambivalent Ontology of Digital Artifacts. MIS Q. 2013, 37, 357–370. [Google Scholar] [CrossRef]
  39. Lin, P.; Wu, J. Does Knowledge Network Dual Embeddedness Promote Inter-Firm Technological Collaboration? A Multilevel Network Analysis of the Artificial Intelligence Industry. Technovation 2026, 153, 103512. [Google Scholar] [CrossRef]
  40. Kim, D.-Y. Understanding Supplier Structural Embeddedness: A Social Network Perspective. J. Oper. Manag. 2014, 32, 219–231. [Google Scholar] [CrossRef]
  41. Granovetter, M. Economic Action and Social Structure: The Problem of Embeddedness. Am. J. Sociol. 1985, 91, 481–510. [Google Scholar] [CrossRef]
  42. Tsai, W. Social Structure of “Coopetition” Within a Multiunit Organization: Coordination, Competition, and Intraorganizational Knowledge Sharing. Organ. Sci. 2002, 13, 179–190. [Google Scholar] [CrossRef]
  43. Peng, H.; Shen, N.; Liao, H.; Wang, Q. Multiple Network Embedding, Green Knowledge Integration and Green Supply Chain Performance—Investigation Based on Agglomeration Scenario. J. Clean. Prod. 2020, 259, 120821. [Google Scholar] [CrossRef]
  44. Dong, M.C.; Liu, Z.; Yu, Y.; Zheng, J. Opportunism in Distribution Networks: The Role of Network Embeddedness and Dependence. Prod. Oper. Manag. 2015, 24, 1657–1670. [Google Scholar] [CrossRef]
  45. Yang, B.; Li, X.; Kou, K. Research on the Influence of Network Embeddedness on Innovation Performance: Evidence from China’s Listed Firms. J. Innov. Knowl. 2022, 7, 100210. [Google Scholar] [CrossRef]
  46. Sthapit, E.; Del Chiappa, G.; Coudounaris, D.N.; Björk, P. Determinants of the Continuance Intention of Airbnb Users: Consumption Values, Co-Creation, Information Overload and Satisfaction. Tour. Rev. 2020, 75, 511–531. [Google Scholar] [CrossRef]
  47. Niesten, E.; Stefan, I. Embracing the Paradox of Interorganizational Value Co-Creation–Value Capture: A Literature Review Towards Paradox Resolution. Int. J. Manag. Rev. 2019, 21, 231–255. [Google Scholar] [CrossRef]
  48. Nambisan, S.; Lyytinen, K.; Majchrzak, A.; Song, M. Digital Innovation Management: Reinventing Innovation Management Research in a Digital World. MIS Q. 2017, 41, 223–238. [Google Scholar] [CrossRef]
  49. Yang, Z.N.; Hou, Y.F.; Li, D.H.; Wu, C. The Balancing Effect of Open Innovation Networks in the “Dual Circulation” of Chinese Enterprises: An Investigation Based on Digital Empowerment and Organizational Flexibility. Manag. World 2022, 38, 194–205. (In Chinese) [Google Scholar]
  50. Akter, S.; Babu, M.M.; Hossain, M.A.; Hani, U. Value Co-Creation on a Shared Healthcare Platform: Impact on Service Innovation, Perceived Value and Patient Welfare. J. Bus. Res. 2022, 140, 95–106. [Google Scholar] [CrossRef]
  51. Cheng, C.; Zhong, H.; Cao, L. Facilitating Speed of Internationalization: The Roles of Business Intelligence and Organizational Agility. J. Bus. Res. 2020, 110, 95–103. [Google Scholar] [CrossRef]
  52. Xie, X.; Sun, J.; Zhou, M.; Yan, L.; Chi, M. Network Embeddedness and Manufacturing SMEs’ Green Innovation Performance: The Moderating Role of Resource Orchestration Capability. Bus. Process Manag. J. 2024, 30, 884–908. [Google Scholar] [CrossRef]
  53. Podsakoff, P.M.; MacKenzie, S.B.; Podsakoff, N.P. Sources of Method Bias in Social Science Research and Recommendations on How to Control It. Annu. Rev. Psychol. 2012, 63, 539–569. [Google Scholar] [CrossRef] [PubMed]
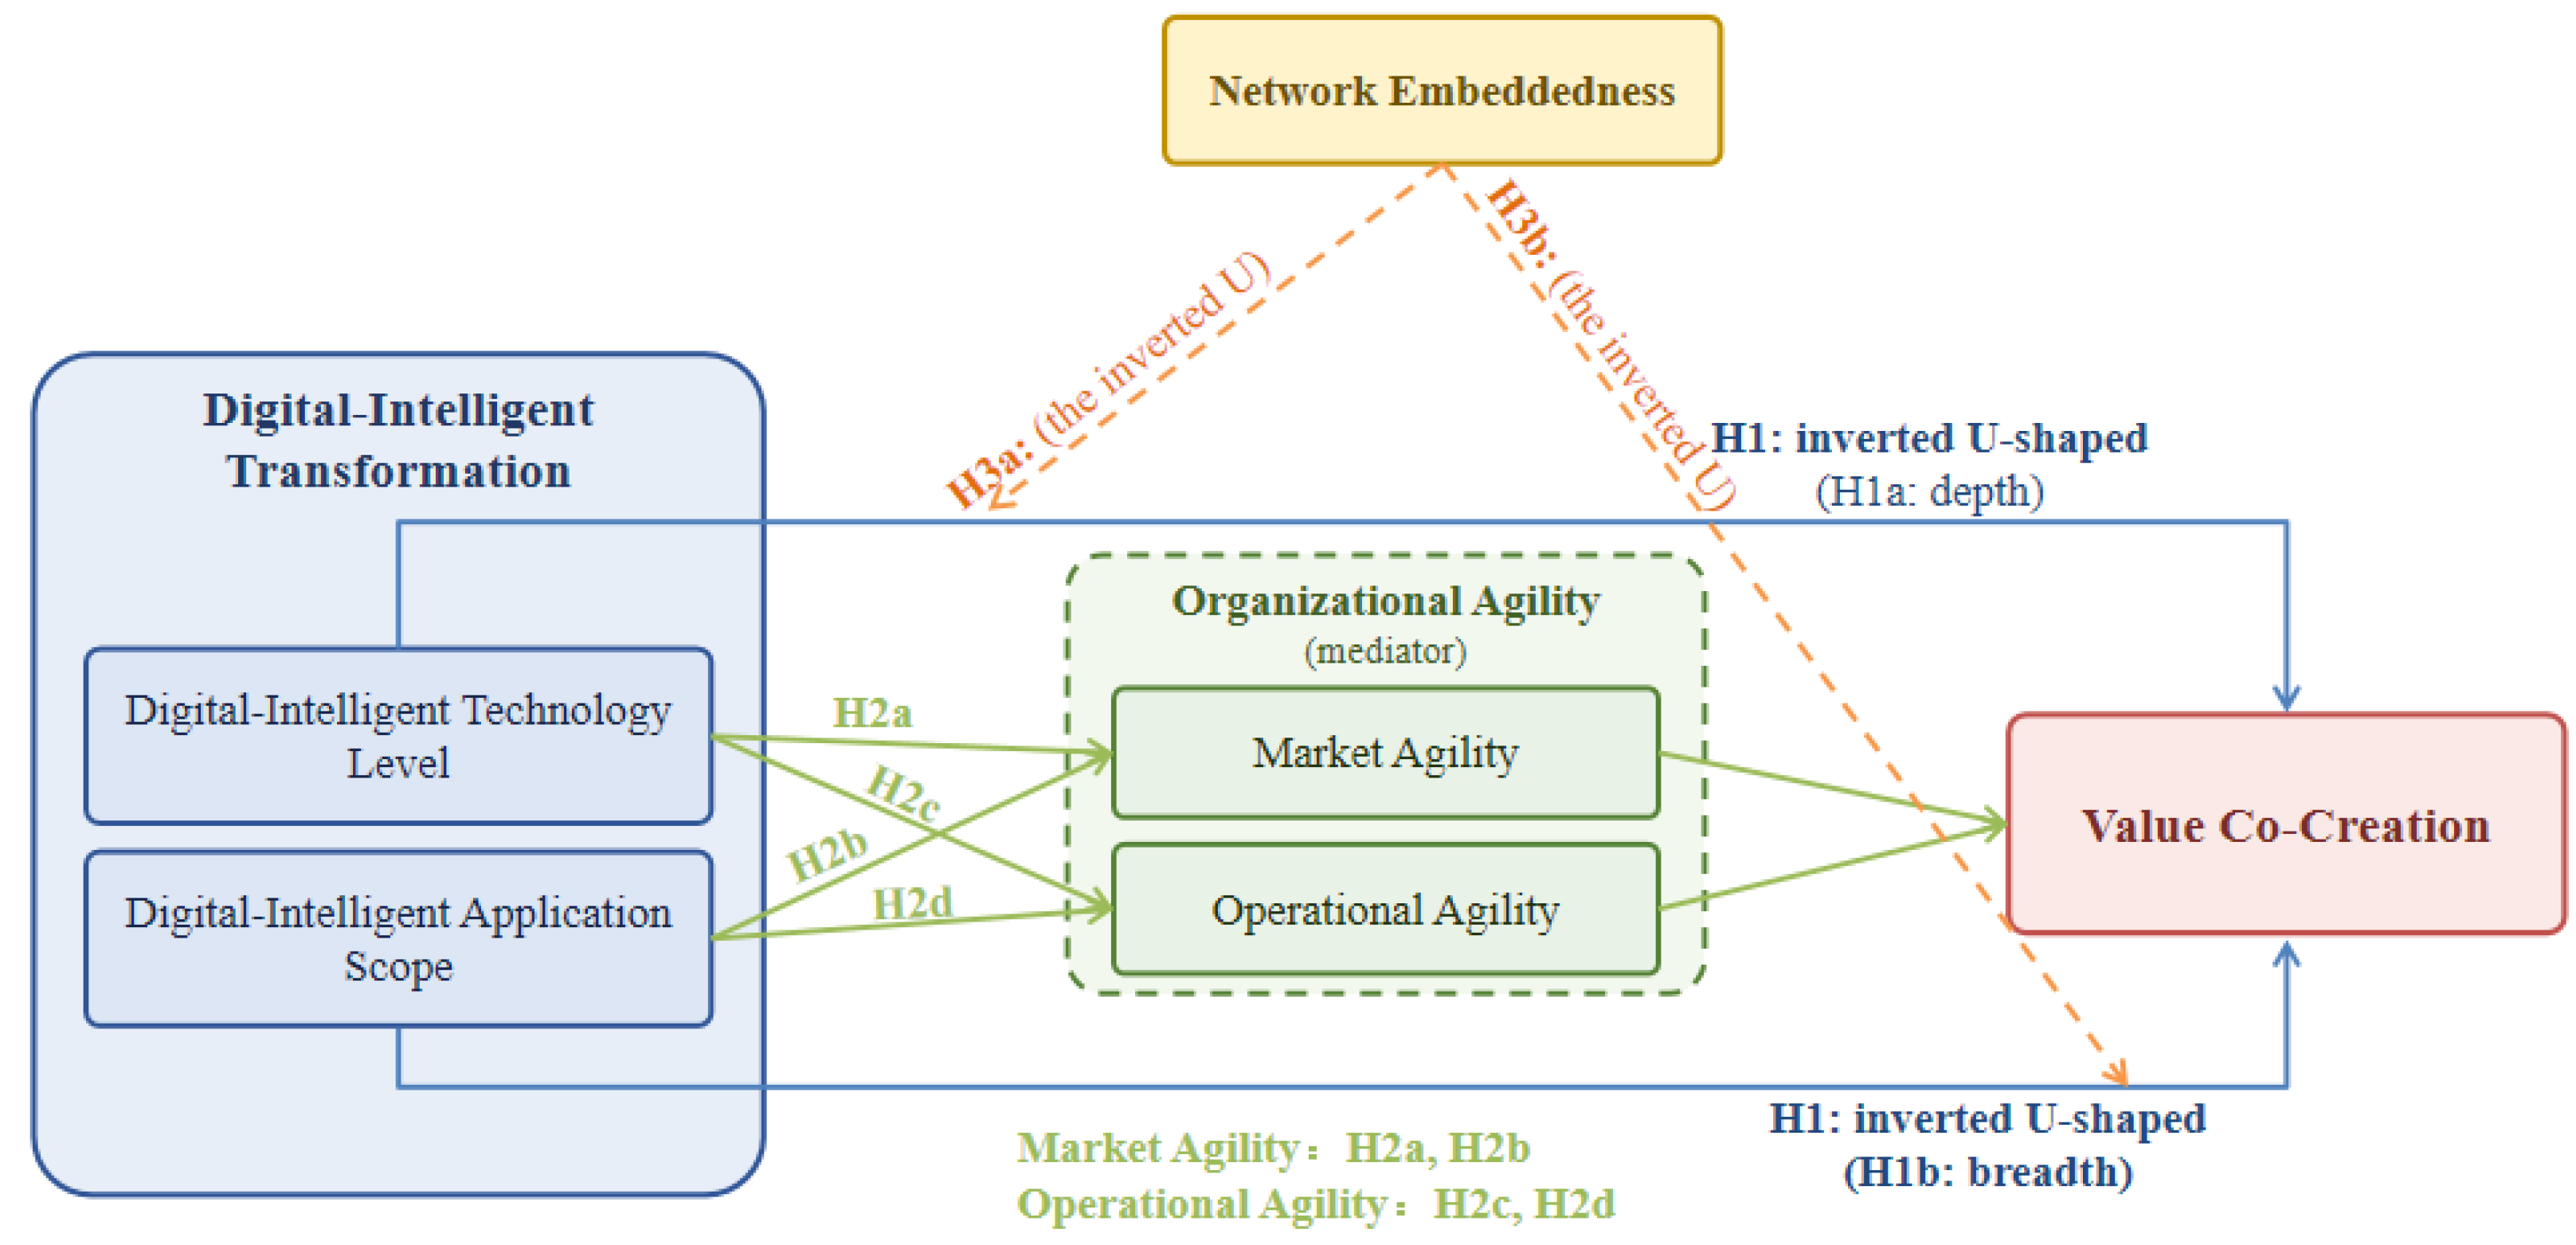
Figure 1. Conceptual model and hypothesized relationships.
Systems 14 00805 g001
Figure 2. The inverted U-shaped relationship between the level of digital-intelligent technology and value co-creation.
Systems 14 00805 g002
Figure 3. The inverted U-shaped relationship between the scope of digital-intelligent application and value co-creation.
Systems 14 00805 g003
Table 1. Results of the common method bias test.
ComponentEigenvalueExplained Variance (%)Cumulative Variance (%)
13.42131.24731.247
22.15619.63850.885
31.83416.71967.604
41.24511.32978.933
50.9878.99787.93
Table 2. Confirmatory factor analysis results.
Modelχ2dfχ2/dfCFITLIRMSEA
Six-factor model731.544201.740.9460.9390.042
Five-factor model1043.874252.460.8920.8810.059
Four-factor model1389.264293.240.8360.8210.076
Three-factor model1824.634324.220.7620.7410.091
Two-factor model2467.484345.680.6630.6380.108
Single-factor model3385.924357.780.5470.5110.129
Table 3. Reliability and validity test results.
VariableItemsCronbach’s αCRAVEAverage Loading
DITL70.8840.8890.5710.756
DIAS70.8670.8720.5450.738
VCC70.9150.9180.6480.805
MA30.8510.8540.6610.813
OPA30.8470.8510.6560.810
NE80.8970.9020.5730.757
Table 4. Descriptive statistics and Pearson correlation matrix.
VariableMSD123456
DITL2.9140.7281
DIAS3.0450.6950.637 ***1
MA3.1871.2640.483 ***0.521 ***1
OPA3.2711.1820.507 ***0.548 ***0.749 ***1
NE3.1121.2060.421 ***0.457 ***0.589 ***0.594 ***1
VCC3.3411.0950.524 ***0.561 ***0.603 ***0.621 ***0.507 ***1
Note: N = 418; *** p < 0.001.
Table 5. Test of the direct effect of digital-intelligent transformation on enterprise value co-creation.
VariableModel 1Model 2Model 3Model 4
Control variablesControlControlControlControl
DITL0.318 ***
(0.042)
0.304 ***
(0.044)
0.293 ***
(0.046)
DITL2−0.094 ***
(0.026)
−0.086 ***
(0.027)
DIAS0.283 ***
(0.044)
0.281 ***
(0.045)
0.271 ***
(0.046)
DIAS2−0.078 **
(0.028)
R20.1490.4370.4510.463
Adjusted R20.1340.4230.4360.447
ΔR20.288 ***0.014 ***0.012 **
F-statistic9.87 ***31.45 ***32.84 ***33.51 ***
Note: Standardized coefficients, with standard errors in parentheses. Model 1 includes controls only; Model 2 adds the linear terms of DITL and DIAS; Models 3–4 add the quadratic terms. ** p < 0.01, *** p < 0.001.
Table 6. Mediation effect test of organizational agility.
VariablesModel 5Model 6 Model 7 Model 8
DITL0.331 ***
(0.051)
0.368 ***
(0.047)
0.128 **
(0.045)
0.101 *
(0.043)
DITL2−0.071 **
(0.025)
−0.058 *
(0.023)
−0.021
(0.023)
−0.023
(0.022)
DIAS0.305 ***
(0.054)
0.341 ***
(0.049)
0.121 **
(0.047)
0.094 *
(0.045)
DIAS2−0.063 *
(0.027)
−0.051 *
(0.024)
−0.018
(0.025)
−0.020
(0.024)
MA0.354 ***
(0.052)
OPA0.389 ***
(0.046)
R20.3540.4330.4710.485
ΔR20.008 *0.022 **
Note: Standardized coefficients, with standard errors in parentheses. Models 5–6 regress market and operational agility on DITL and DIAS; Models 7–8 add each agility variable to the value co-creation model. * p < 0.05, ** p < 0.01, *** p < 0.001.
Table 7. Bootstrapped indirect effects of digital-intelligent transformation on value co-creation.
PathIndirect Effect95% CI Lower95% CI UpperResult
DITL → MA → VCC0.1170.0710.174Supported
DIAS → MA → VCC0.1080.0630.162Supported
DITL → OPA → VCC0.1430.0920.204Supported
DIAS → OPA → VCC0.1330.0840.191Supported
Table 8. Test of the moderating effect of network embeddedness.
VariablesModel 9Model 10Model 11Model 12
DITL0.293 ***
(0.041)
0.289 ***
(0.042)
0.291 ***
(0.041)
0.287 ***
(0.043)
DITL2−0.086 ***
(0.019)
−0.083 ***
(0.020)
−0.084 ***
(0.019)
−0.081 ***
(0.021)
DIAS0.271 ***
(0.039)
0.269 ***
(0.040)
0.267 ***
(0.039)
0.265 ***
(0.041)
DIAS2−0.078 **
(0.031)
−0.076 **
(0.032)
−0.074 **
(0.031)
−0.072 **
(0.033)
NE0.194 ***
(0.036)
0.187 ***
(0.038)
0.190 ***
(0.037)
0.183 ***
(0.039)
DITL × NE0.095 **
(0.044)
0.092 **
(0.046)
DITL2 × NE−0.025 *
(0.014)
−0.023 *
(0.015)
DIAS × NE0.086 *
(0.045)
0.083 *
(0.047)
DIAS2 × NE−0.022 *
(0.013)
−0.020 *
(0.014)
R20.4790.5020.4940.511
ΔR20.016 ***0.039 ***0.031 **0.048 ***
F-statistic35.28 ***37.84 ***36.51 ***38.72 ***
Note: Standardized coefficients, with standard errors in parentheses. * p < 0.05, ** p < 0.01, *** p < 0.001.
Table 9. Robustness test results.
PathFull Sample
(Bootstrap 5000)
Larger FirmsSmaller Firms
Direct Effects
DITL → VCC0.176 ***
[0.091, 0.261]
0.195 ***
[0.105, 0.285]
0.142 **
[0.040, 0.243]
DITL2 → VCC−0.030 **
[−0.054, −0.005]
−0.031 **
[−0.056, −0.007]
−0.026 *
[−0.052, −0.001]
DIAS → VCC0.134 **
[0.047, 0.222]
0.148 **
[0.058, 0.237]
0.115 *
[0.009, 0.220]
DIAS2 → VCC−0.027 *
[−0.050, −0.004]
−0.028 *
[−0.052, −0.005]
−0.024 *
[−0.047, −0.001]
Indirect Effects
DITL → MA → VCC0.063 **
[0.022, 0.104]
0.072 **
[0.029, 0.115]
0.042 *
[0.006, 0.078]
DITL → OPA → VCC0.075 ***
[0.038, 0.111]
0.084 ***
[0.047, 0.120]
0.052 **
[0.018, 0.085]
DIAS → MA → VCC0.049 *
[0.006, 0.093]
0.057 *
[0.010, 0.104]
0.034
[−0.008, 0.076]
DIAS → OPA → VCC0.053 **
[0.019, 0.088]
0.061 **
[0.024, 0.098]
0.037 *
[0.003, 0.072]
R20.3160.3410.288
ΔR20.3020.3270.273
F-value13.622 ***15.035 ***11.925 ***
Note: Firm-size groups are based on the number of employees, following the criteria of the Ministry of Industry and Information Technology of China (>500 employees = larger-firm group; ≤500 employees = smaller-firm group). The 95% bootstrap confidence intervals are reported in brackets. * p < 0.05, ** p < 0.01, *** p < 0.001.
Disclaimer/Publisher’s Note: The statements, opinions and data contained in all publications are solely those of the individual author(s) and contributor(s) and not of MDPI and/or the editor(s). MDPI and/or the editor(s) disclaim responsibility for any injury to people or property resulting from any ideas, methods, instructions or products referred to in the content.