Article

Modelling Mediated Vulnerability and Reversible Social Exclusion: An Exploratory Agent-Based Model Inspired by Deafblindness


by
Enrique Fernández-Vilas
1,*,
Marcos Iglesias Carrera
2 and
Juan R. Coca
1
1
Social Research Unit on Health and Rare Diseases, University of Valladolid, Campus Universitario of Soria, 42004 Soria, Spain
2
School of Labor Relations, University of Salamanca, San Torcuato 43, 49014 Zamora, Spain
*
Author to whom correspondence should be addressed.
Systems 2026, 14(7), 781; https://doi.org/10.3390/systems14070781
Submission received: 8 May 2026 / Revised: 24 June 2026 / Accepted: 2 July 2026 / Published: 4 July 2026
(This article belongs to the Section Systems Practice in Social Science)

Abstract

This paper develops an exploratory agent-based model of mediated vulnerability in deafblindness-related social exclusion. The revised model treats exclusion as a relational process shaped by multidimensional mediation, education, income and local interaction. Access to social-health mediation is defined as a composite construct that can be decomposed into communication support, mobility and orientation support, health-care continuity, educational and assistive support, and administrative recognition. The reported NetLogo implementation analyses the aggregate access variable generated in BehaviourSpace, while the revision makes explicit the subdimensional update rules required for future empirical calibration. The simulation begins with 1000 agents and runs for 500 ticks. The analysed export contains 1593 runs across six values of risk threshold, with 300 runs for each threshold from 0.1 to 0.5 and 93 runs for threshold 0.6. The results distinguish mediated vulnerability, continuous exclusion, binary exclusion, episodic exclusion and consolidated exclusion. Peak exclusion remains substantial across threshold conditions, whereas final binary exclusion is almost absent under the implemented averaging rules. One-way and Welch ANOVA show that risk-threshold does not significantly affect peak exclusion, mean exclusion or final exclusion, but it has a very strong effect on education and derived social power. Regression models indicate that mean access and mean income are the strongest predictors of exclusion severity, while risk-threshold has no significant direct effect after these variables are included. External validation is treated as a pattern-oriented comparison rather than a prevalence prediction: the model is consistent with the empirical claim that exclusion among persons with deafblindness is mediated by communication, mobility, education, health-care and economic barriers, but it should not be read as an estimate of real-world prevalence.

1. Introduction

Social exclusion is a relational process through which persons or groups lose effective access to institutions, resources, recognition and social participation. This definition is necessary because exclusion has a wider analytical structure than poverty, impairment or individual disadvantage. Poverty concerns restricted material resources. Impairment concerns bodily, sensory or cognitive conditions. Social exclusion concerns the social organisation of access, participation and recognition across institutional fields. In the case of deafblindness, this distinction has direct theoretical importance. Deafblindness combines hearing and visual impairment, but its social consequences depend on communicative support, accessible information, mobility arrangements, educational opportunities, health care continuity, professional knowledge, income security and recognition by public institutions. The social problem, therefore, lies in the relationship between the person and the mediating structures through which participation becomes possible.
The recent literature on deafblindness supports this relational formulation. Jaiswal et al. [1] show that participation among people with deafblindness or dual sensory loss is shaped by communication, mobility, daily living, social relationships and access to services. The World Federation of the Deafblind [2] describes persons with deafblindness as a group at risk of exclusion from disability and development programmes because deafblindness remains poorly recognised, poorly measured and frequently unsupported by adequate services. Research on inclusive education also identifies limited communication opportunities, weak awareness of deafblindness, insufficient adaptations and restricted access to specialised supports as barriers to academic and social success [3]. These findings indicate that deafblindness becomes socially exclusionary through failures of mediation rather than through sensory condition alone.
This article uses an agent-based model to analyse this problem as a dynamic process. Agent-based modelling allows researchers to formalise heterogeneous agents, bounded local interactions, feedback effects and emergent aggregate outcomes. The value of this method lies in generative explanation. A simulation specifies a theoretical mechanism and then observes the macro-level patterns produced by that mechanism. This methodological approach is relevant for social exclusion because exclusion rarely emerges from one isolated factor. It tends to arise through the interaction of access, resources, institutional classification, social support and cumulative disadvantage. The updated ODD protocol (see Appendix A) stresses that agent-based models require a transparent description of entities, state variables, process scheduling and design concepts, since replication and structural realism depend on explicit documentation [4]. The recent validation literature similarly argues that sampling, visualisation, docking, empirical validation and causal analysis support a more robust interpretation of agent-based simulations [5].
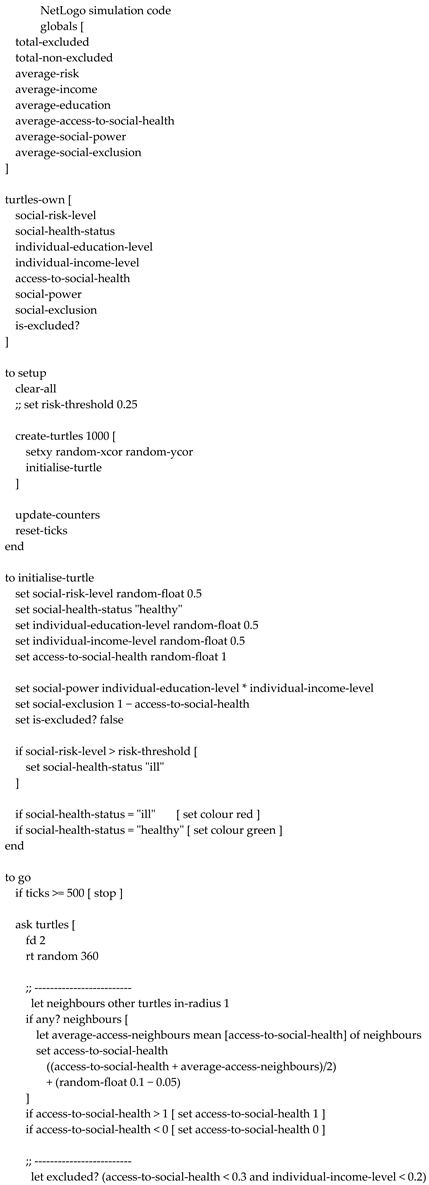
The article analyses a NetLogo model (see Appendix B) and a social experiment through BehaviourSpace. The output file records 1593 runs, each summarised by final, minimum, maximum and mean values for the relevant reporters. The experimental parameter is risk-threshold. The measured variables include access to social health, social exclusion, binary excluded status, binary non excluded status, income, education and social power. The code clarifies the model architecture. Social exclusion is the inverse of access to social health. Binary exclusion requires both access to social health below 0.3 and individual income below 0.2. Social power equals individual education multiplied by individual income. Education accumulates during the first thirty ticks, with larger gains among agents classified as healthy. Health status depends on whether social risk exceeds the risk threshold. Local interaction averages access, risk, education and income with neighbouring agents. These rules allow the article to interpret the simulation as a formal sociology of mediated vulnerability.
This article asks whether an agent-based model can distinguish between temporary episodes of exclusion and consolidated exclusion when exclusion is defined as the intersection between restricted access to social health and low income. The central modelling hypothesis is that exclusion becomes binary only when access deprivation and economic vulnerability coincide, while persistence depends on whether local interaction and educational accumulation are sufficient to move agents away from that conjunction.

2. Theoretical Framework: Deafblindness and Mediated Vulnerability

The concept of mediated vulnerability provides the theoretical centre of the article. Vulnerability means exposure to harm under conditions of dependency, reduced access or fragile capacity for self-protection. Mediated vulnerability means that this exposure depends on chains of social mediation. In deafblindness, those chains include communication support, accessible information, assistive technology, mobility resources, health care, specialist education, income, family and community support, and administrative recognition. The person becomes vulnerable when these mediations are weak, discontinuous or inaccessible. The person becomes excluded when the fragility of mediation becomes a durable restriction of participation.
This approach avoids an individualising interpretation of deafblindness. The combined sensory condition matters because it intensifies dependence on communicative, educational and health-related supports. Its social meaning, however, emerges inside institutional and relational environments. The World Health Organisation [6] frames ear and hearing care through integrated people-centred systems across the life course, which reinforces the idea that care works as an institutional mediation rather than as a punctual clinical act. The same logic applies to deafblindness in a wider sense. Communication, learning, mobility, health care and recognition have to be coordinated over time (Table 1). A single intervention can improve a situation, but sustained inclusion requires a structure that converts need into usable access and then converts access into agency.
The distinction between vulnerability, episodic exclusion and consolidated exclusion is therefore essential. Vulnerability describes exposure. Episodic exclusion describes a temporary state in which the person or agent crosses a threshold of restricted participation. Consolidated exclusion describes the stabilisation of that state across time. This distinction has methodological consequences. A cross-sectional measure may confuse a temporary episode with a persistent condition. A simulation can separate these dynamics by recording peaks, temporal means and final states. The model analysed here is especially useful because it produces high intermediate peaks of exclusion while showing almost no exclusion at the final step. The sociological problem is therefore the mechanism that transforms an exclusion episode into recovery rather than persistence (Figure 1).
The model operationalises this theory through two linked but analytically distinct indicators. The continuous score of social exclusion equals one minus access to social health. This variable represents relational deprivation of access. The binary status of being excluded is more restrictive, since it requires low access and low income at the same time. This specification is sociologically meaningful because exclusion seldom results from one isolated deficiency. It emerges more plausibly when disadvantages intersect. In this model, restricted access to social health becomes exclusionary when it coincides with low income. The model, therefore, represents exclusion as a conjunctural condition produced by access deprivation and economic vulnerability.

3. Model Description and Method

The simulation begins with 1000 turtles. Each agent receives an initial social-risk level drawn from a uniform distribution between 0 and 0.5, an initial education level drawn from a uniform distribution between 0 and 0.5, an initial income level drawn from a uniform distribution between 0 and 0.5, and an initial access-to-social-health value drawn from a uniform distribution between 0 and 1. Health status is assigned by comparing social risk with the experimental parameter risk-threshold. Agents with social risk above the threshold are classified as ill, whereas agents at or below the threshold are classified as healthy. This classification becomes important because healthy agents receive larger educational increments during the first thirty ticks.
The dynamic rules give the model a convergence structure. During each tick, agents move and update access to social health by averaging their own access with the mean access of neighbouring agents within radius 1, followed by bounded random variation. Agents also update social risk, education and income through local averaging with neighbouring agents. The code clamps risk, education, income and access within the interval [0, 1]. Income receives an additional random perturbation with probability 0.1 at each tick. The population also includes renewal, since a new turtle may be created with probability 0.02 at each tick. This rule introduces new heterogeneity into the system after the initial population has begun to converge.
Three formulas are central to the interpretation of the model. First, the continuous exclusion score is defined as the inverse of access to social health. Second, the binary condition of being excluded is defined as the simultaneous presence of low access and low income. Third, social power is defined as the product of education and income. These definitions mean that several variables are derived rather than independent. Social exclusion and access to social health are mathematically coupled. Social power is mainly driven by education when income remains stable. The article, therefore, avoids treating these variables as independent empirical predictors and instead interprets them as formal components of a generative model.
social-exclusioni = 1 − access-to-social-healthi
is-excludedi = 1 if access-to-social-healthi < 0.3 and incomei < 0.2
social-poweri = educationi × incomei
The experiment includes 1593 runs and 500 ticks per run. The design includes six values of risk-threshold: 0.1, 0.2, 0.3, 0.4, 0.5 and 0.6. There are 300 runs for each threshold from 0.1 to 0.5, and 93 runs for threshold 0.6. The smaller number of replications at threshold 0.6 is retained for transparency, but the inferential analysis therefore reports both conventional one-way ANOVA and Welch ANOVA where appropriate. This is necessary because Welch ANOVA is more robust when group sizes are unequal, and variances are not assumed to be identical. For agent i at time t, let Ci(t) denote communication support, Mi(t) mobility and orientation support, Hi(t) health-care continuity, Ei(t) educational and assistive support, and Ri(t) administrative recognition (Table 2). The composite access variable is defined as:
A i t = C i t + M i t + H i t + E i t + R i t / 5
The continuous exclusion score, binary exclusion status and social power are then defined as:
  • X i t = 1 A i t ;
  • B i t = 1 if A i t < 0.3 and I i t < 0.2 , and 0 otherwise;
  • P i t = E i t × I i t .
The analysis uses descriptive, distributional and inferential indicators. Descriptive statistics include final excluded agents, percentage of runs ending with any excluded agent, mean excluded agents per tick, agent-ticks excluded, median peak exclusion, 95th percentile of peak exclusion and maximum observed peak. Inferential analysis uses one-way ANOVA to test whether the risk threshold significantly affects each outcome. Welch ANOVA is reported as a robustness check for outcomes where unequal replications could matter, especially because the threshold 0.6 has 93 runs rather than 300. Effect size is reported through η2 and ω2 for ANOVA and Cohen’s d for selected threshold contrasts. Regression analysis uses ordinary least squares with HC3 robust standard errors to quantify the association between exclusion severity and risk-threshold, mean access and mean income. Social power is not included as an independent predictor in the regression models because it is mathematically defined as education multiplied by income; including it alongside its components would produce mechanical dependency rather than an independent causal estimate.
Validation is treated as a pattern-oriented comparison rather than a prevalence prediction. This choice is necessary because the model is an exploratory mechanism model, not a calibrated demographic simulation of persons with deafblindness. External empirical evidence is therefore used to assess whether the simulated mechanism is directionally coherent with known patterns of exclusion, not to claim that the number of excluded agents estimates real world prevalence. WFDB evidence [7] indicates that people with deafblindness represent approximately 0.2% to 2% of the population and are more likely to be poor, unemployed and educationally disadvantaged than people without disabilities or people with other disabilities (Table 3). A later prevalence review confirms the 0.2% to 2% range and stresses that prevalence estimates vary considerably across definitions, countries and age groups [8]. These data provide an empirical boundary: the model should reproduce the mechanism of mediated exclusion, but not the prevalence of deafblindness itself.

4. Results

4.1. Exclusion Appears as a Severe Episode While Final Persistence Remains Almost Absent

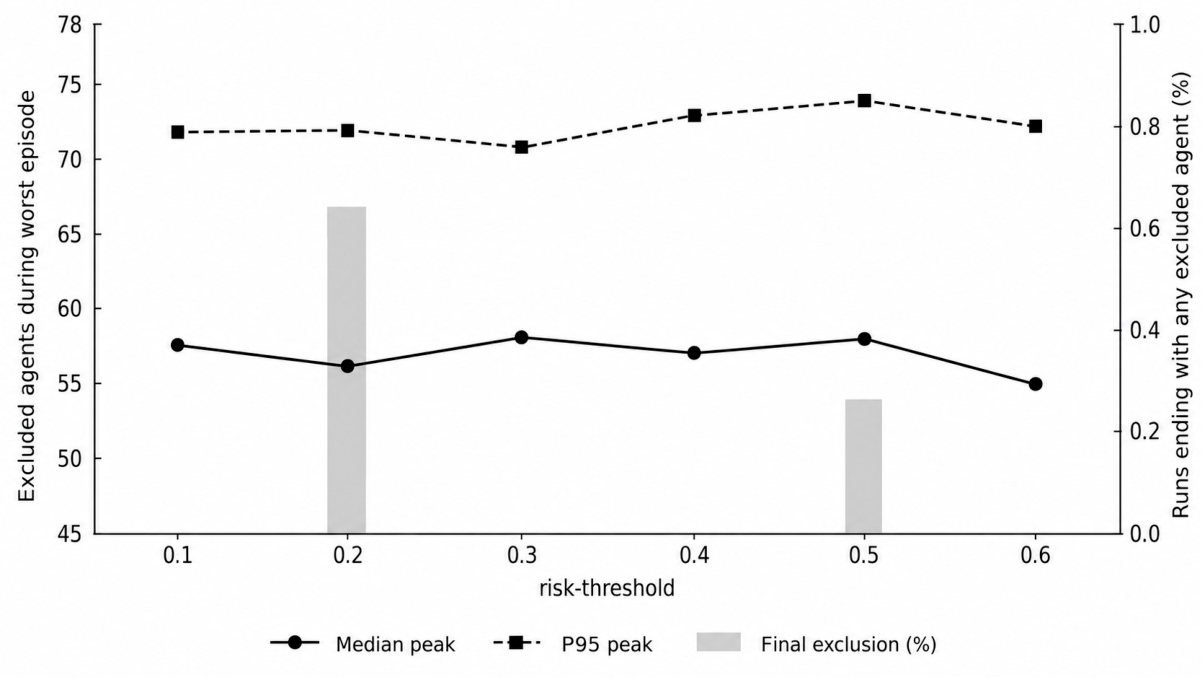
The strongest empirical pattern is the separation between episodic severity and final persistence. Across all threshold conditions, the median peak of excluded agents remains high, between 55 and 58 agents. The 95th percentile of the peak remains between 71.0 and 74.0. The observed maximum ranges between 80 and 87 agents. These numbers show that the model generates relevant exclusion episodes. At the same time, final exclusion is virtually absent. The percentage of runs ending with any excluded agent is 0% in four threshold conditions, 0.667% at risk-threshold = 0.2 and 0.333% at risk-threshold = 0.5 (Table 4). The model, therefore, produces exclusion as a critical episode and then tends to reverse it before the final tick.
A model interpreted through final means alone would suggest that exclusion is almost absent. A model interpreted through maximum values alone would suggest that exclusion is severe (Figure 2). The combined indicators produce a more precise conclusion: exclusion appears, reaches high short-term intensity and then usually dissolves. The low mean number of excluded agents per tick, which remains around 0.152 to 0.157, indicates that the high peak has limited temporal weight. The burden is therefore concentrated rather than continuous.

4.2. Risk-Threshold Does Not Significantly Affect Exclusion Severity

Inferential testing qualifies the descriptive results (Table 5). Conventional one-way ANOVA shows that risk-threshold does not significantly affect peak excluded agents, mean excluded agents per tick or final excluded agents. Welch ANOVA leads to the same conclusion for peak and mean exclusion (Table 6). The effect sizes are negligible. This means that the analysed threshold parameter is not the main driver of exclusion severity in the current implementation. The finding is important because it prevents a misleading interpretation of the descriptive differences between thresholds. Peak and mean exclusion occur across the full experimental range, but their variation is too small and too irregular to support a threshold effect.

4.3. Access and Income Predict Exclusion Severity More Strongly than Risk-Threshold

Regression models clarify (Table 7) which variables account for exclusion severity. In both models, mean access and mean income are significant negative predictors of exclusion. Risk-threshold remains non-significant after these predictors are included. For peak excluded agents, the model explains 10.8% of the variance. For the mean excluded agents per tick, it explains 13.9% of the variance. These values are modest, but they are consistent with the model architecture: exclusion is produced by the conjunction of restricted access and low income, while risk-threshold primarily affects educational accumulation rather than exclusion severity directly.

4.4. Education and Social Power Show a Clear Threshold Transition

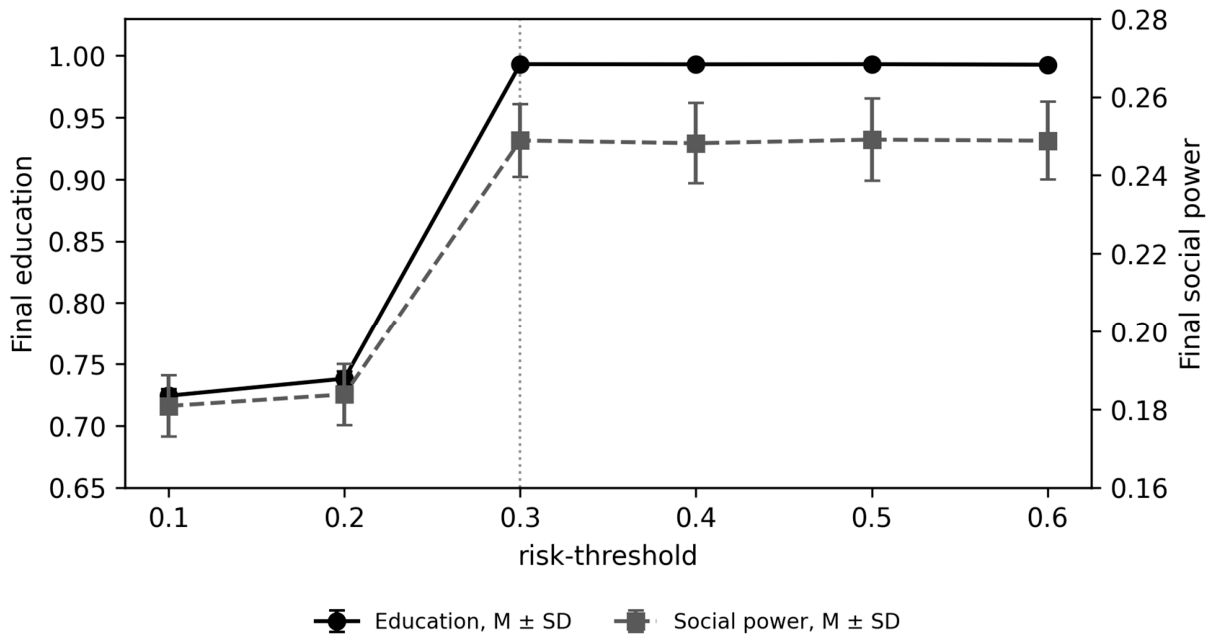
The clearest sensitivity pattern appears in education. Final education remains around 0.724 and 0.738 at thresholds 0.1 and 0.2 (Table 8). It then rises to approximately 0.993 from threshold 0.3 onwards. The distributional separation is almost complete. This shift is not the effect of a few atypical runs; it represents a regime transition produced by the model rules. The code explains the result. Education grows only during the first thirty ticks, and healthy agents receive larger educational increments than ill agents. Since health classification depends on the comparison between social risk and the risk-threshold (Figure 3), the move from 0.2 to 0.3 classifies many more agents as healthy and allows faster educational accumulation.
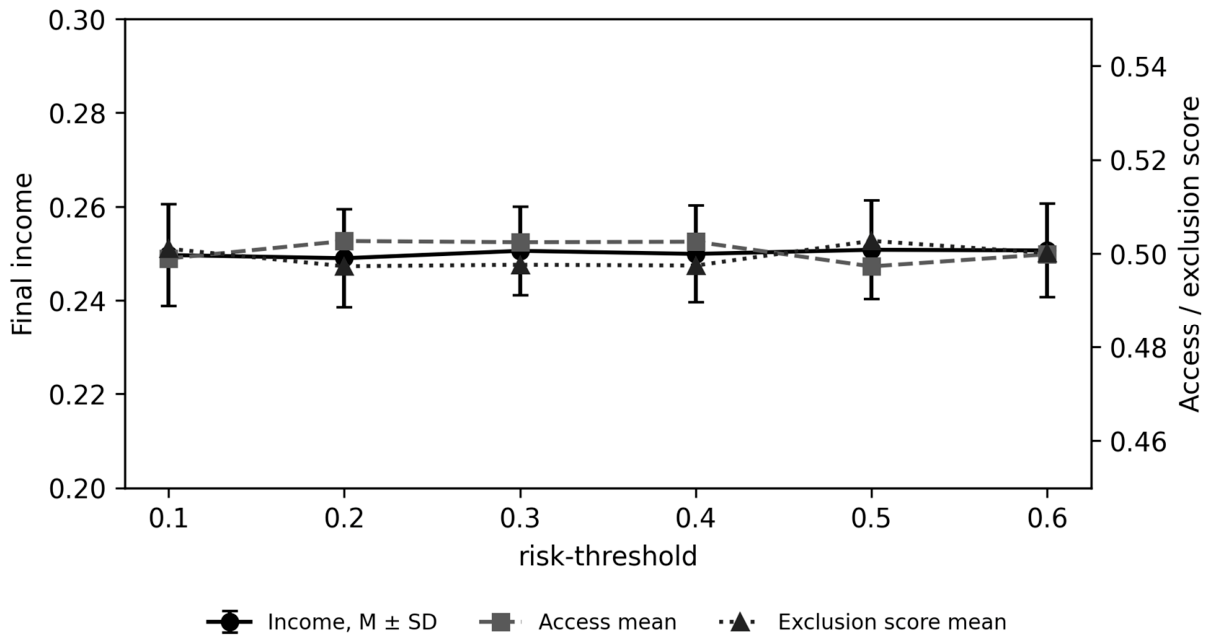
Social power follows the same transition as education, although its range is smaller. It rises from approximately 0.181 and 0.184 at the two lowest thresholds to approximately 0.249 from threshold 0.3 onwards. This pattern follows from the formula social power = education × income. Since income remains stable across thresholds and ANOVA shows no significant income effect, the increase in social power is driven primarily by education. The model, therefore, gives education a central formal role in the production of agent capacity. This is not an empirical claim that education alone explains real-world inclusion among people with deafblindness. It is a claim about the formal logic of this model: when more agents are classified as healthy during the initial educational accumulation window, education rises sharply, and social power rises as a derived consequence (Figure 4).

5. Discussion

The model formalises social exclusion as an episodic process under convergence-oriented rules. This interpretation follows from the contrast between substantial exclusion peaks and almost absent final exclusion. The simulation generates critical episodes when agents combine low access to social health with low income. These episodes then tend to recede because local interaction averages access, income and other attributes with neighbouring agents. This result should be read as a generative outcome of the implemented mechanism. It shows how exclusion may emerge from intersecting disadvantages and decline when relational environments restore access and resources. [8] This interpretation is consistent with agent-based modelling approaches that use explicit micro-level rules to examine emergent macro-level patterns rather than to estimate direct empirical prevalence [4,5,9].
This structure is sociologically relevant because it separates impairment from exclusion. Deafblindness involves combined sensory impairment, but the literature shows that its social consequences are shaped by communication, mobility, education, health care, service access, social relationships and institutional recognition [1,2,10]. Participation barriers among persons with deafblindness or dual sensory loss are repeatedly linked to communication, daily living, mobility and access to services [1]. Global deafblindness reports also stress weak recognition, lack of specific support services and exclusion from disability and development programmes [2,10]. The model translates this relational view into a formal mechanism in which vulnerability increases when mediation becomes fragile or discontinuous.
The code-based interpretation clarifies the internal logic of the model. The continuous social exclusion score is an inverse measure of access to social health. It should be read as a formal indicator of relational deprivation. The binary variable is-excluded? is more restrictive, since it requires both low access and low income. This distinction prevents the model from treating exclusion as a single deficit. Restricted access increases the continuous exclusion score, while binary exclusion appears when restricted access intersects with economic vulnerability. This compounded mechanism is compatible with disability research that treats exclusion as multidimensional and shaped by health, education, work, social participation and access to services [3,11,12,13].
The transition in education and social power from risk-threshold = 0.3 follows from the implemented rules. The threshold classifies agents as healthy or ill. Healthy agents accumulate education more rapidly during the first thirty ticks. Since the initial risk is drawn between 0 and 0.5 and then averaged locally, the movement from 0.2 to 0.3 changes the health classification of many agents. Education then rises sharply. Social power rises with it because it is calculated as the product of education and income. Since income remains stable across thresholds, the transition in social power is mainly an educational effect.
This result supports a cautious theoretical reading of education as a protective capacity. In social contexts related to deafblindness, the corresponding mechanisms would include specialist educational support, accessible communication, adapted curricula, assistive technologies, trained professionals and coordination between families, schools and services. Recent scoping reviews on deafblind education identify limited communication opportunities, low awareness of deafblindness, insufficient adaptations and restricted access to specialised support as barriers to academic and social success [3,12]. The broader health literature also supports the idea that inclusion depends on accessible, people-centred and coordinated systems rather than isolated interventions [6,11,13]. The model does not estimate the effect of these mechanisms. It provides a formal setting in which early capacity accumulation changes later vulnerability.
The interpretation of reversibility requires caution. The simulation shows what occurs under a specific set of rules. Local averaging, bounded variables and stable income favour recovery from extreme states. The observed decline of exclusion should therefore be understood as an outcome of the model architecture. The simulation shows how exclusion can appear when low access and low income coincide, and how it can recede when local interaction and educational accumulation move agents away from that conjunction.
The model also clarifies what it does not yet represent. Income remains stable because the code gives it limited fluctuation and no cumulative stratification. The simulation is therefore a model of relational access, local influence and educational accumulation under a bounded income distribution. A future version should introduce stronger income dynamics, structural barriers to income recovery, unequal access to support services, labour-market segmentation and cumulative resource depletion. These additions would bring the model closer to disability evidence showing that health inequity, poverty, educational barriers, employment exclusion and weak service systems interact across the life course [13,14].
A more developed version should also distinguish mediating supports more explicitly. The current variable access-to-social-health condenses several mechanisms into one formal dimension. Future models could separate communication support, health care continuity, educational access, income security, mobility support, assistive technology and administrative recognition [15]. This would allow the model to test whether different forms of mediation produce different exclusion trajectories. Such a development would align more closely with deafblindness research, where inclusion depends on specific support services, recognition of deafblindness as a distinct disability, accessible communication and coordinated provision across institutional fields [16].

Limitations and Directions for Model Development

The study has a limitation concerning variable dependency. Social exclusion is defined as the inverse of access to social health. Social power is defined as education multiplied by income. These definitions are coherent for a formal model, but they mean that correlation analysis among these variables has limited causal meaning. Future versions could include empirically distinct indicators of social exclusion, such as communication access, social network density, service navigation capacity, educational participation, labour-market attachment and administrative recognition.

6. Conclusions

The analysis shows that the model generates social exclusion as an intense but episodic condition under the implemented rules. Binary exclusion appears when low access to social health and low income coincide. The continuous exclusion score represents the inverse of access to social health. Social power is derived from education and income. These definitions clarify the mechanism behind the statistical results. Peak exclusion remains substantial across threshold conditions, while final exclusion almost disappears. Education and social power show a marked transition from risk-threshold = 0.3, driven by the health classification rule that regulates early educational accumulation. Income remains stable and functions mainly as a condition in the binary exclusion rule.
The sociological contribution lies in the distinction between vulnerability, episodic exclusion and consolidated exclusion. The model suggests that exclusion can arise from intersecting disadvantages and decline when local interaction and educational accumulation restore protective capacities. For the analysis of deafblindness, this supports a relational interpretation of exclusion. Communication support, accessible health care, specialist education, income security and social power are mechanisms through which vulnerability may become a persistent exclusion or remain an episodic condition. The model offers a formal framework for studying mediated vulnerability and for developing more precise simulations of exclusion in contexts related to deafblindness.

Author Contributions

Conceptualization, J.R.C.; methodology, J.R.C. and E.F.-V.; software, J.R.C.; formal analysis, J.R.C. and E.F.-V.; data curation, E.F.-V.; writing—original draft preparation, M.I.C. and E.F.-V.; writing—review and editing, E.F.-V. and J.R.C. All authors have read and agreed to the published version of the manuscript.

Funding

This research received no external funding.

Data Availability Statement

The model can be replicated using the NetLogo code in Appendix B and a BehaviourSpace experiment with the risk-threshold values reported in the manuscript. The analysed export contains run-level summaries and does not include full tick-by-tick trajectories.

Conflicts of Interest

The authors declare no conflicts of interest.

Abbreviations

The following abbreviations are used in this manuscript:
AbbreviationMeaning
ABMAgent-based model
ANOVAAnalysis of variance
CRPDConvention on the Rights of Persons with Disabilities
ODDOverview, design concepts and details protocol
SDStandard deviation
SDGsSustainable development goals
WFDBWorld Federation of the Deafblind

Appendix A

The model is described according to the ODD protocol in order to make explicit its purpose, entities, state variables, scheduling, design concepts, initialisation, submodels and interpretive boundaries. This description is necessary because the model is not intended as a direct empirical simulation of deafblind lives, but as a formal abstraction of mediated vulnerability. Its analytical purpose is to examine how binary exclusion may emerge when restricted access to social-health mediation intersects with low income, and how such exclusion may become episodic rather than consolidated under local recovery dynamics.
Table A1. ODD components and description.
ODD
Components
Description for the Manuscript
PurposeThe model is designed to formalise, in exploratory terms, the emergence and reversibility of social exclusion in a population of agents exposed to mediated vulnerability. It does not estimate the real prevalence of exclusion among people with deafblindness. It represents an abstract sociological mechanism in which exclusion emerges when limited access to social-health mediation coincides with low income. The analytical aim is to distinguish vulnerability, episodic exclusion and consolidated exclusion under explicit rules of local interaction, educational accumulation and relative income stability.
EntitiesThe main entities are individual agents implemented as turtles in NetLogo. Each agent represents an abstract social unit exposed to different levels of risk, education, income and access to social-health mediation. The spatial environment is the two-dimensional NetLogo world, used as a relational space for local interaction. It should not be interpreted as an empirical geography.
State
variables
Each agent has the following state variables: social-risk-level, which indicates individual social risk; social-health-status, which classifies the agent as healthy or ill according to the comparison between risk and threshold; individual-education-level, which represents educational accumulation or formative capacity; individual-income-level, which represents available economic resources; access-to-social-health, which represents effective access to social, health-related and communicative mediations; social-power, calculated as the product of education and income; social-exclusion, calculated as the inverse of access to social health; and is-excluded?, which identifies the binary exclusion condition. At the global level, the model records total-excluded, total-non-excluded, average-risk, average-income, average-education, average-access-to-social-health, average-social-power and average-social-exclusion.
ScalesThe model starts with an initial population of 1000 agents and runs for a maximum of 500 ticks. Risk, education, income, access, social power and exclusion values are bounded within the closed interval [0, 1]. The NetLogo space functions as a relational scale for local interaction. The neighbourhood radius used in the influence rules is 1. A tick does not correspond to a defined empirical unit of chronological time; it represents a discrete step in the updating of the system.
Process overview and schedulingAt the beginning of each simulation, the setup procedure clears the environment, creates 1000 agents, initialises their variables and calculates the global indicators. The go procedure is then repeated until 500 ticks have elapsed. At each tick, agents move, update their access to social health through neighbourhood interaction, recalculate their exclusion condition, adjust risk, education and income through local influence, accumulate education during the first 30 ticks, undergo limited random income fluctuation, reassess their social-health status and update their colour. At each tick, a new agent may also be created with probability 0.02. Global counters are updated at the end of each tick.
Design concepts: basic principlesThe basic principle of the model is that social exclusion is not reducible to an individual attribute. It emerges from the relationship between access, economic resources, education and social interaction. The model formalises vulnerability as relational exposure and binary exclusion as a conjunctive condition. An agent becomes excluded only when low access to social health coincides with low income. This rule represents the sociological proposition that disadvantage becomes more severe when it is compounded across domains.
Design concepts: emergenceAggregate exclusion emerges from local rules applied to individual agents. The total number of excluded agents is not imposed externally. It results from the initial distribution of access and income, local interaction, random perturbation and the binary rule combining low access and low income. The distinction between exclusion peaks and final exclusion is an emergent outcome of the model dynamics.
Design concepts: adaptationAgents do not maximise utility and do not make strategic decisions. Adaptation is mechanical and relational. Each agent modifies access, risk, education and income through averaging with neighbouring agents. Adaptation, therefore, represents local social influence, exposure to relational environments and partial diffusion of social conditions.
Design concepts: objectivesAgents have no explicit objectives. The model includes no preferences, deliberation or rational choice. The analytical objective belongs to the researcher and consists of observing how states of exclusion are generated and reversed under specified rules.
Design concepts: learningThe model includes a limited form of learning or capacity accumulation through the increase in individual-education-level during the first 30 ticks. Agents classified as healthy receive larger educational increments than agents classified as ill. This rule represents, in abstract form, the idea that agents placed in less adverse conditions accumulate educational capacity more rapidly.
Design concepts: predictionAgents do not predict future states and do not anticipate consequences. All updates depend on current values, local neighbourhood and stochastic perturbations.
Design concepts: sensingAgents only “sense” the aggregated values of neighbours located within radius 1. Operationally, the model calculates neighbourhood means for access, risk, education and income. This rule does not represent subjective perception. It represents formalised local influence.
Design concepts: interactionInteraction occurs through local averaging. If an agent has neighbours within radius 1, its access to social health moves towards the neighbours’ mean access value, with a small random perturbation. Risk, education and income are similarly moved towards the mean values of the immediate relational environment. Interaction, therefore, functions as a mechanism of relational convergence.
Design concepts: stochasticityThe model contains stochasticity in the initialisation of risk, education, income, access and spatial position. It also includes stochasticity in movement, variation in access to social health, occasional income fluctuation and the creation of new agents. This stochasticity produces variability between BehaviourSpace runs.
Design concepts: collectivesThe model does not include organised collectives, differentiated institutions, families, formal networks, organisations, services or explicit social groups. Collectivity appears only as an aggregate structure generated by interaction among individual agents.
Design concepts: observationThe model observes outcomes through global counters. At each tick, it records the number of excluded agents, the number of non-excluded agents and the population means of risk, income, education, access to social health, social power and social exclusion. BehaviourSpace exports run-level summaries, including final, minimum, maximum and mean values for the selected reporters.
InitialisationIn setup, the model creates 1000 agents. Each agent receives a random position, a social-risk-level drawn from a uniform distribution between 0 and 0.5, an individual-education-level drawn from a uniform distribution between 0 and 0.5, an individual-income-level drawn from a uniform distribution between 0 and 0.5, and an access-to-social-health value drawn from a uniform distribution between 0 and 1. Social-health-status is initially set to healthy, but changes to ill if the social-risk-level exceeds the risk-threshold. The initial social-power is calculated as education multiplied by income. The initial social-exclusion is calculated as one minus access to social health. is-excluded? is initially set to false and then updated during the simulation.
Input dataThe model uses no external empirical input data. Initial values are generated through random distributions specified in the code. The external experimental parameter is risk-threshold, manipulated in BehaviourSpace with six values: 0.1, 0.2, 0.3, 0.4, 0.5 and 0.6.
Submodel: social-health status classificationThe social-health status is determined by comparing the social-risk-level with the risk-threshold. If an agent’s risk exceeds the threshold, the agent is classified as ill; if the risk is equal to or below the threshold, the agent is classified as healthy. This category should not be interpreted as a clinical diagnosis. It is an internal modelling classification that regulates the rate of educational accumulation.
Submodel: access-to-social-health updateAt each tick, each agent identifies neighbours within radius 1. If neighbours are present, the agent calculates the mean neighbourhood value of access-to-social-health and updates its own access as the average between its previous value and the neighbourhood mean, plus a random perturbation between −0.05 and 0.05. The resulting value is bounded within [0, 1]. This rule represents local influence on effective access to social and health-related mediations.
Submodel: binary exclusionBinary exclusion is calculated through a conjunctive rule. An agent is classified as excluded when access-to-social-health < 0.3 and individual-income-level < 0.2. If either condition is not met, the agent is not classified as excluded. This rule formalises the idea that severe exclusion emerges when restricted access coincides with economic vulnerability.
Submodel: continuous exclusion scoreThe continuous social exclusion score is calculated as social-exclusion = 1 − access-to-social-health. This variable represents relational deprivation of access. By mathematical construction, its relationship with access is perfectly complementary. It should therefore be interpreted as a derived formal indicator rather than as an empirically independent variable.
Submodel: neighbourhood influenceAgents update the social-risk-level, individual-education-level and individual-income-level through averaging with neighbours within radius 1. This rule tends to reduce extreme values and produce partial convergence among nearby agents. Values are then bounded within [0, 1].
Submodel: educational accumulationDuring the first 30 ticks, agents increase their education level. Agents classified as healthy receive a random increment between 0 and 0.05. Agents classified as ill receive a random increment between 0 and 0.025. This rule introduces an early cumulative advantage for agents below the risk threshold.
Submodel: income fluctuationAt each tick, each agent has a probability of 0.1 of undergoing a random income change. The variation ranges from −0.05 to 0.05. Income is then bounded within [0, 1]. This rule introduces limited economic fluctuation, but it does not model structural stratification, unemployment, labour-market discrimination or asset accumulation.
Submodel: social powerSocial power is calculated as social-power = individual-education-level individual-income-level. This rule defines social power as a composite capacity produced by education and income. Since income remains relatively stable in the model, the main variations in social power are primarily driven by educational accumulation.
Submodel: population renewalAt each tick, there is a probability of 0.02 that one new agent will be created. The new agent is initialised according to the same rules as the initial population. This rule introduces additional heterogeneity during the simulation and prevents the population from being completely closed.
Output measuresThe main outputs are total-excluded, total-non-excluded, average-risk, average-income, average-education, average-access-to-social-health, average-social-power and average-social-exclusion. The article analyses final exclusion, peak exclusion, mean exclusion, cumulative burden, education, income, access, social exclusion and social power across BehaviourSpace runs.
Experimental designBehaviourSpace runs the model for six values of risk-threshold: 0.1, 0.2, 0.3, 0.4, 0.5 and 0.6. The analysed export contains 1593 runs: 300 runs for each threshold from 0.1 to 0.5, and 93 runs for 0.6. Each run lasts for 500 ticks. The 0.6 condition should be interpreted cautiously because it includes fewer repetitions.
Model assumptionsThe model assumes that risk, education, income, access, social power and exclusion can be represented through continuous variables bounded between 0 and 1. It also assumes that local interaction can be approximated through neighbourhood averaging. Binary exclusion is assumed to emerge from the conjunction of low access and low income. Education functions as an early cumulative capacity, while income functions as a relatively stable vulnerability condition.
Model boundariesThe model does not include differentiated institutions, public policies, labour markets, families, specialised services, assistive technology, interpreters, mobility support, tactile communication, administrative recognition or real-life course trajectories. It therefore does not simulate the empirical lives of people with deafblindness. It represents a formal abstraction of mediated vulnerability inspired by sociological problems documented in deafblindness.
VerificationInternal verification requires checking that all bounded variables remain within [0, 1], that global counters correspond to individual states, that binary exclusion is activated only under the defined conjunctive condition, that social-exclusion maintains the relation 1 − access-to-social-health, and that social-power is recalculated after education and income updates. The current code should adjust the order of the social-power calculation to avoid within-tick lag.
Validation strategyValidation should be understood as a mechanism validation rather than an empirical prediction. The model can be assessed through sensitivity analysis of risk-threshold, inspection of trajectories, comparison between exclusion peaks and final states, replication of runs, code review and qualitative comparison with the literature on deafblindness, participation, inclusive education, service access and disability. A future version could incorporate empirical calibration using external indicators of access, education, employment, communicative support and social participation.
Interpretive statusThe model should be interpreted as an exploratory sociological simulation. Its results show what occurs under the implemented rules, not what necessarily occurs in social reality. The observed reversibility of exclusion depends on local convergence, educational accumulation and relative income stability. The main contribution is therefore conceptual and generative: the formal distinction between vulnerable exposure, episodic exclusion and consolidated exclusion.

Appendix B

Systems 14 00781 i001
Systems 14 00781 i002

References

  1. Jaiswal, A.; Aldersey, H.; Wittich, W.; Mirza, M.; Finlayson, M. Participation experiences of people with deafblindness or dual sensory loss: A scoping review of global deafblind literature. PLoS ONE 2018, 13, e0203772. [Google Scholar] [CrossRef] [Scilit]
  2. World Federation of the Deafblind. Second Global Report on the Situation of de Persons with Deafblindness. Good Practices and Recommendations for the Inclusion of Persons with Deafblindness; World Federation of the Deafblind: Brussels, Belgium, 2023. [Google Scholar]
  3. Manford, C.; Rajasingam, S.; Allen, P.M.; Beukes, E. The barriers to and facilitators of academic and social success for deafblind children and young people: A scoping review. Br. J. Spec. Educ. 2024, 51, 332–346. [Google Scholar] [CrossRef] [Scilit]
  4. Grimm, V.; Railsback, S.F.; Vincenot, C.E.; Berger, U.; Gallagher, C.; DeAngelis, D.L.; Edmonds, B.; Ge, J.; Giske, J.; Groeneveld, J.; et al. The ODD protocol for describing agent-based and other simulation models: A second update to improve clarity, replication and structural realism. J. Artif. Soc. Soc. Simul. 2020, 23, 7. [Google Scholar] [CrossRef] [Scilit]
  5. Collins, A.; Koehler, M.; Lynch, C. Methods that support the validation of agent-based models: An overview and discussion. J. Artif. Soc. Soc. Simul. 2024, 27, 11. [Google Scholar] [CrossRef] [Scilit]
  6. World Health Organization. World Report on Hearing; World Health Organization: Geneva, Switzerland, 2021. [Google Scholar]
  7. World Federation of the Deafblind. At Risk of Exclusion from CRPD and SDGs Implementation: Inequality and Persons with Deafblindness: Initial Global Report on Situation and Rights of Persons with Deafblindness; World Federation of the Deafblind: Brussels, Belgium, 2018; Available online: https://www.wfdb.eu/wp-content/uploads/2019/04/WFDB-global-report-2018.pdf (accessed on 5 March 2026).
  8. Minhas, R.; Jaiswal, A.; Chan, S.; Trevisan, J.; Paramasivam, A.; Spruyt-Rocks, R. Prevalence of individuals with deafblindness and age-related dual-sensory loss. J. Vis. Impair. Blind. 2022, 116, 36–47. [Google Scholar] [CrossRef] [Scilit]
  9. Zhang, P.; Gao, X.; Li, Z.; Xin, T. The Impact of Exclusion from Close Versus Distant Relationships on Inhibitory Control: An ERP Study. Behav. Sci. 2025, 15, 1305. [Google Scholar] [CrossRef] [Scilit] [PubMed]
  10. Fischbach, K. Agent-based modelling in social sciences. J. Bus. Econ. 2021, 91, 1263–1270. [Google Scholar] [CrossRef] [Scilit]
  11. Gréaux, M.; Moro, M.F.; Kamenov, K.; Russell, A.M.; Barrett, D.; Cieza, A.; Holloway, C. Health equity for persons with disabilities: A global scoping review on barriers and interventions in healthcare services. Int. J. Equity Health 2023, 22, 236. [Google Scholar] [CrossRef] [Scilit] [PubMed]
  12. Masuku, K.P.; Khumalo, G.; Moroe, N. Barriers and facilitators to inclusive education for learners who are deafblind: A scoping review. Educ. Sci. 2024, 14, 1072. [Google Scholar] [CrossRef] [Scilit]
  13. United Nations Department of Economic and Social Affairs. Disability and Development Report: Realizing the Sustainable Development Goals by, for and with Persons with Disabilities; United Nations: New York, NY, USA, 2018. [Google Scholar]
  14. World Health Organization. Global Report on Health Equity for Persons with Disabilities; World Health Organization: Geneva, Switzerland, 2022; Available online: https://www.who.int/publications/i/item/9789240063600 (accessed on 8 March 2026).
  15. Junaid, S.B.; Imam, A.A.; Balogun, A.O.; De Silva, L.C.; Surakat, Y.A.; Kumar, G.; Abdulkarim, M.; Shuaibu, A.N.; Garba, A.; Sahalu, Y.; et al. Recent Advancements in Emerging Technologies for Healthcare Management Systems: A Survey. Healthcare 2022, 10, 1940. [Google Scholar] [CrossRef] [Scilit] [PubMed]
  16. Warnicke, C.; Wahlqvist, M.; Anderzén-Carlsson, A.; Sundqvist, A.S. Interventions for adults with deafblindness—An integrative review. BMC Health Serv. Res. 2022, 22, 1594. [Google Scholar] [CrossRef] [Scilit] [PubMed]
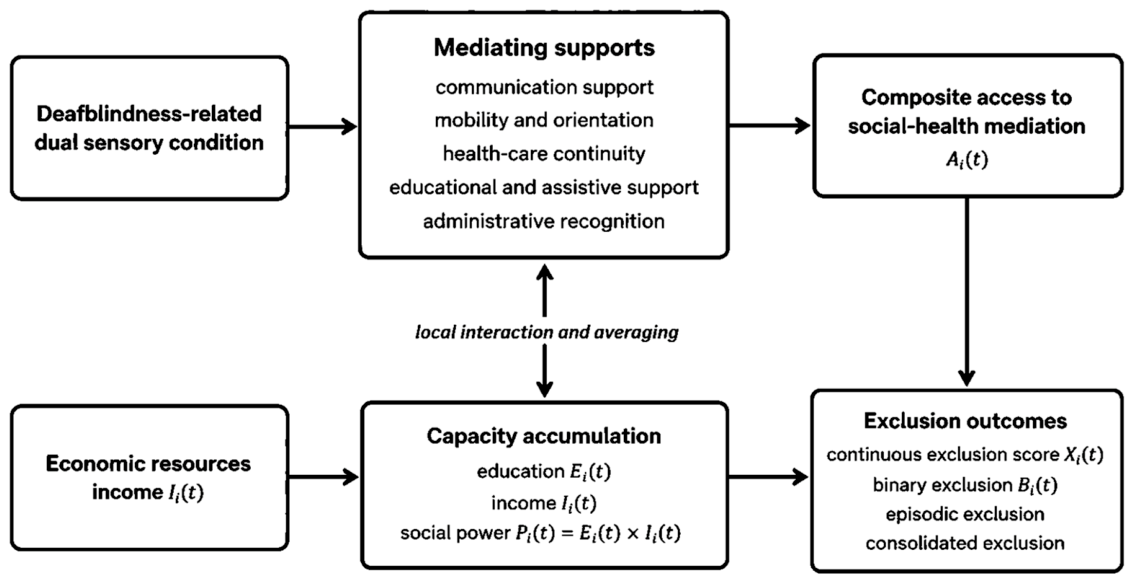
Figure 1. Research framework linking deafblindness-related impairment, mediating supports, access, economic vulnerability, social power and exclusion outcomes.
Systems 14 00781 g001
Figure 2. Peak exclusion remains substantial across threshold conditions, whereas final exclusion remains almost absent. Note. Final exclusion is represented as the percentage of runs ending with at least one excluded agent.
Systems 14 00781 g002
Figure 3. Education and social power show a regime transition from risk threshold = 0.3. Note. Error bars represent standard deviations across runs.
Systems 14 00781 g003
Figure 4. Income remains stable, whereas access and the exclusion score remain complementary by construction. Note. Error bars for income represent standard deviations; access and exclusion scores are mirror variables by definition.
Systems 14 00781 g004
Table 1. Glossary of conceptual and model terms.
TermDefinition Used in This ArticleModel Representation
Mediated vulnerabilityExposure to social harm produced or intensified by discontinuous supports, inaccessible services or weak institutional recognition.Conceptual condition preceding exclusion.
Access to social-health mediationComposite access to communicative, mobility-related, health-care, educational/assistive and administrative supports.Aggregate variable Ai(t) is formally decomposed into five subdimensions.
Continuous exclusionDegree of relational deprivation generated by restricted access to social-health mediation.Xi(t) = 1 − Ai(t).
Binary exclusionA restrictive status is reached when low access and low income coincide.Bi(t) = 1 if Ai(t) < 0.3 and Ii(t) < 0.2.
Episodic exclusionA temporary crossing of the binary exclusion threshold that later recedes.Detected through peak and mean excluded agents when final exclusion is absent or rare.
Consolidated exclusionPersistence of binary exclusion at the final state or over a sustained trajectory.Approximated in this export by final excluded agents; full duration would require tick-by-tick trajectories.
Note. The table standardises terminology used across the abstract, theoretical framework, model description and results. Bi(t) denotes binary exclusion, Ai(t) access to social-health mediation, Xi(t) continuous exclusion, and Ii(t) income.
Table 2. Operational decomposition of social-health mediation.
SubdimensionInterpretationDistinct Update Rule for Future Calibration
C i t : communication supportAvailability and usability of tactile, sign, speech-to-text, interpreter-guide or other communication mediation. C i t + 1 = c l i p 1 λ C C i t + λ C m e a n C j t + ε C .
M i t : mobility and orientation supportAccess to guiding, environmental orientation, safe movement and spatial participation. M i t + 1 = c l i p 1 λ M M i t + λ M m e a n M j t μ M r i s k i t + ε M .
H i t : health-care continuityContinuity, affordability and accessibility of health and rehabilitation services. H i t + 1 = c l i p 1 λ H H i t + λ H m e a n H j t + η H s t a t u s i t μ H r i s k i t + ε H .
E i t : educational and assistive supportAdapted curricula, trained professionals, assistive technology and accessible learning resources. E i t + 1 = c l i p 1 λ E E i t + λ E m e a n E j t + η E i t + ε E .
R i t : administrative recognitionOfficial recognition, service eligibility and ability to navigate institutional procedures. R i t + 1 = c l i p 1 λ R R i t + λ R m e a n R j t + ε R .
Note. clip confines values to [0, 1]. λ parameters represent local influence, μ parameters represent risk penalties, η parameters represent status or educational gains, and ε terms represent bounded stochastic variation. The present BehaviourSpace export uses the aggregate Ai(t); the subdimension equations specify the measurement decomposition required for future empirical calibration.
Table 3. External empirical anchoring of the exploratory model.
Empirical ReferenceEmpirical Statistic or PatternModel AnalogueValidation Judgement
WFDB [7] Severe deafblindness is estimated at around 0.2% of the population, with milder forms around 2%.The model begins with 1000 abstract agents.Not a prevalence validation; used as a boundary against overinterpretation.
WFDB [7]Persons with deafblindness are ten times less likely to be employed than non-disabled persons and 30% less likely than persons with other disabilities.Binary exclusion requires low access and low income; regression shows income predicts exclusion severity.Directionally consistent with economic vulnerability as a mediator.
WFDB [7]Children with deafblindness are 17 times less likely to be in school than non-disabled children and twice as likely as children with other disabilities.Education drives the threshold transition in social power.Directionally consistent with education as a protective capacity, but not calibrated.
Jaiswal et al. [1] and WFDB [7]Communication, mobility, social relationships, service access and recognition shape participation.The model decomposes access into subdimensions.Mechanism-level validation supports the multidimensional mediator structure.
Note. The validation comparison is qualitative and pattern-oriented. It does not assert that the simulation estimates population prevalence or real-world exclusion rates.
Table 4. Final persistence, cumulative burden and episodic severity of exclusion.
Risk-ThresholdNFinal
Excluded Mean
Final
Exclusion %
Mean
Excluded per Tick
Agent-Ticks ExcludedMedian PeakP95 PeakMax Peak
0.13000.0000.0000.15577.5657.572.0087
0.23000.0070.6670.15276.2356.072.0580
0.33000.0000.0000.15376.7258.071.0080
0.43000.0000.0000.15577.5657.073.0584
0.53000.0030.3330.15778.5058.074.0085
0.6930.0000.0000.15477.1555.072.4081
Note. Final excluded M is the mean number of excluded agents at the final tick. Runs with final exclusion (%) = runs with final_excluded > 0 divided by N and multiplied by 100. Agent-ticks excluded = mean excluded agents per tick × 500. The 0.6 condition has fewer replications and is interpreted cautiously. Source: own elaboration.
Table 5. ANOVA and Welch ANOVA by risk-threshold.
OutcomeF(5, 1587)pη2ω2Welch FWelch df2Welch p
Peak excluded agents0.8550.5110.0030.0000.821564.500.535
Mean excluded agents per tick0.9360.4570.0030.0000.903564.290.478
Final excluded agents1.1720.3210.0040.001
Final education315,756.529 ***<0.0010.9990.999228,558.207 ***570.26<0.001
Final social power3844.603 ***<0.0010.9240.9234323.244 ***559.63<0.001
Final income1.2490.2840.0040.0011.237566.100.290
Final access1.6550.1420.0050.0021.615562.860.154
Final exclusion score1.6410.1460.0050.0021.599562.840.158
Note. Welch ANOVA is reported where calculable as a robustness check for unequal group sizes. *** p < 0.001.
Table 6. Selected Cohen’s d contrasts.
OutcomeContrastM (First Threshold)M (Second Threshold)Cohen dN
Peak excluded agents0.2 → 0.356.76357.3170.065300/300
Peak excluded agents0.1 → 0.657.75356.731−0.119300/93
Mean excluded agents per tick0.2 → 0.30.1520.1530.036300/300
Mean excluded agents per tick0.1 → 0.60.1550.154−0.030300/93
Final education0.2 → 0.30.7380.99355.489300/300
Final education0.1 → 0.60.7240.99354.960300/93
Final social power0.2 → 0.30.1840.2497.545300/300
Final social power0.1 → 0.60.1810.2498.094300/93
Final income0.2 → 0.30.2490.2510.158300/300
Final income0.1 → 0.60.2500.2510.093300/93
Note. Positive d indicates that the second threshold has a higher mean than the first. The 0.2 to 0.3 contrast is reported because the descriptive transition in education and social power occurs there. The 0.1 to 0.6 contrast is reported as a full-range comparison.
Table 7. Regression models predicting exclusion severity.
OutcomePredictorBRobust SEβtP
Peak excluded agentsIntercept165.8338.84018.759<0.001
Peak excluded agentsRisk-threshold0.4431.3490.0080.3290.742
Peak excluded agentsMean access−132.61510.393−0.297−12.760<0.001
Peak excluded agentsMean income−168.76229.552−0.136−5.711<0.001
Mean excluded agents per tickIntercept0.5340.02819.313<0.001
Mean excluded agents per tickRisk-threshold0.0040.0040.0251.0550.292
Mean excluded agents per tickMean access−0.4820.032−0.340−14.859<0.001
Mean excluded agents per tickMean income−0.5600.091−0.143−6.133<0.001
Note. Ordinary least squares models were estimated with HC3 robust standard errors. For peak excluded agents, R2 = 0.108 and adjusted R2 = 0.107. For mean excluded agents per tick, R2 = 0.139 and adjusted R2 = 0.137. β = standardised coefficient.
Table 8. Education, social power, income, access and exclusion score by risk-threshold.
Risk-ThresholdNEducation MEducation SDSocial Power MSocial Power SDIncome MIncome SDAccess MExclusion Score M
0.13000.72430.00540.18080.00790.24970.01080.49900.5010
0.23000.73810.00600.18380.00780.24900.01050.50270.4973
0.33000.99310.00250.24890.00930.25060.00940.50240.4976
0.43000.99300.00260.24820.01020.24990.01030.50250.4975
0.53000.99310.00240.24910.01050.25080.01050.49730.5027
0.6930.99270.00250.24880.00990.25070.01000.49990.5001
Note. Social power is calculated as education × income. The exclusion score is calculated as 1 − access. These mathematical dependencies mean that social power and the exclusion score should not be interpreted as independent empirical variables.
Disclaimer/Publisher’s Note: The statements, opinions and data contained in all publications are solely those of the individual author(s) and contributor(s) and not of MDPI and/or the editor(s). MDPI and/or the editor(s) disclaim responsibility for any injury to people or property resulting from any ideas, methods, instructions or products referred to in the content.