1. Introduction
Against the backdrop of China’s strategic transition to a new development paradigm, one that places a domestic grand circulation at the center and treats the domestic and international circulations as mutually reinforcing, understanding how this strategy interacts with green development is of fundamental importance for reconciling high-quality economic growth with effective environmental stewardship [
1]. The smooth functioning of the national value chain (NVC) is the backbone of the domestic economy, while the ongoing restructuring of the global value chain (GVC) underpins the international economy [
2]. Although a body of literature has examined the respective impacts of NVCs and GVCs on carbon dioxide emissions, as well as their complementary roles [
3], the coupling and coordinating effects of NVCs and GVCs on green development have received far less attention. Under the dual circulation strategy, domestic and global value chains do not operate in isolation; their synergies or tensions may exert complex influences on the green transition, yet few studies have approached this from a coupling coordination perspective. Moreover, existing work grounded in that perspective typically measures the coupling coordination between two systems without establishing causal identification or testing mechanisms—a gap that partly reflects the difficulty of finding suitable instrumental variables. Identifying valid instruments to achieve causal identification thus constitutes a pressing methodological frontier in this field.
A global value chain is a transnational production network in which multinational firms collaborate across borders with partners, suppliers, and customers, encompassing value-creating activities from design and R&D through production, marketing, and services [
4,
5]. A national value chain, by contrast, refers to value-creating processes contained within a specific country or region, with emphasis on optimizing the allocation of domestic resources [
2,
6]. Over the past 2 decades, Chinese manufacturing achieved rapid growth through deep integration into GVCs, while the building of a unified domestic market simultaneously strengthened the NVC. However, this dual embeddedness, though conducive to economic expansion, has also intensified resource consumption and environmental stress [
7]. Two urgent questions follow: In what respects does NVC–GVC coupling coordination promote green development, and in what respects does it hinder it? What are the underlying mechanisms?
A useful analogy is the bench press. The NVC is the right arm, the GVC is the left, and their coupling coordination is the pectoralis major, which is responsible for synchronizing the direction and force applied by both arms. Just as an efficient bench press requires both arms working in concert with the pectoral muscles leading the movement, genuine progress in regional green development requires the NVC and GVC to form a productive synergy, with the NVC playing the leading role. Whether this synergistic mechanism holds empirically, and what its magnitude and transmission pathways are, must be established through rigorous causal identification and mechanism testing.
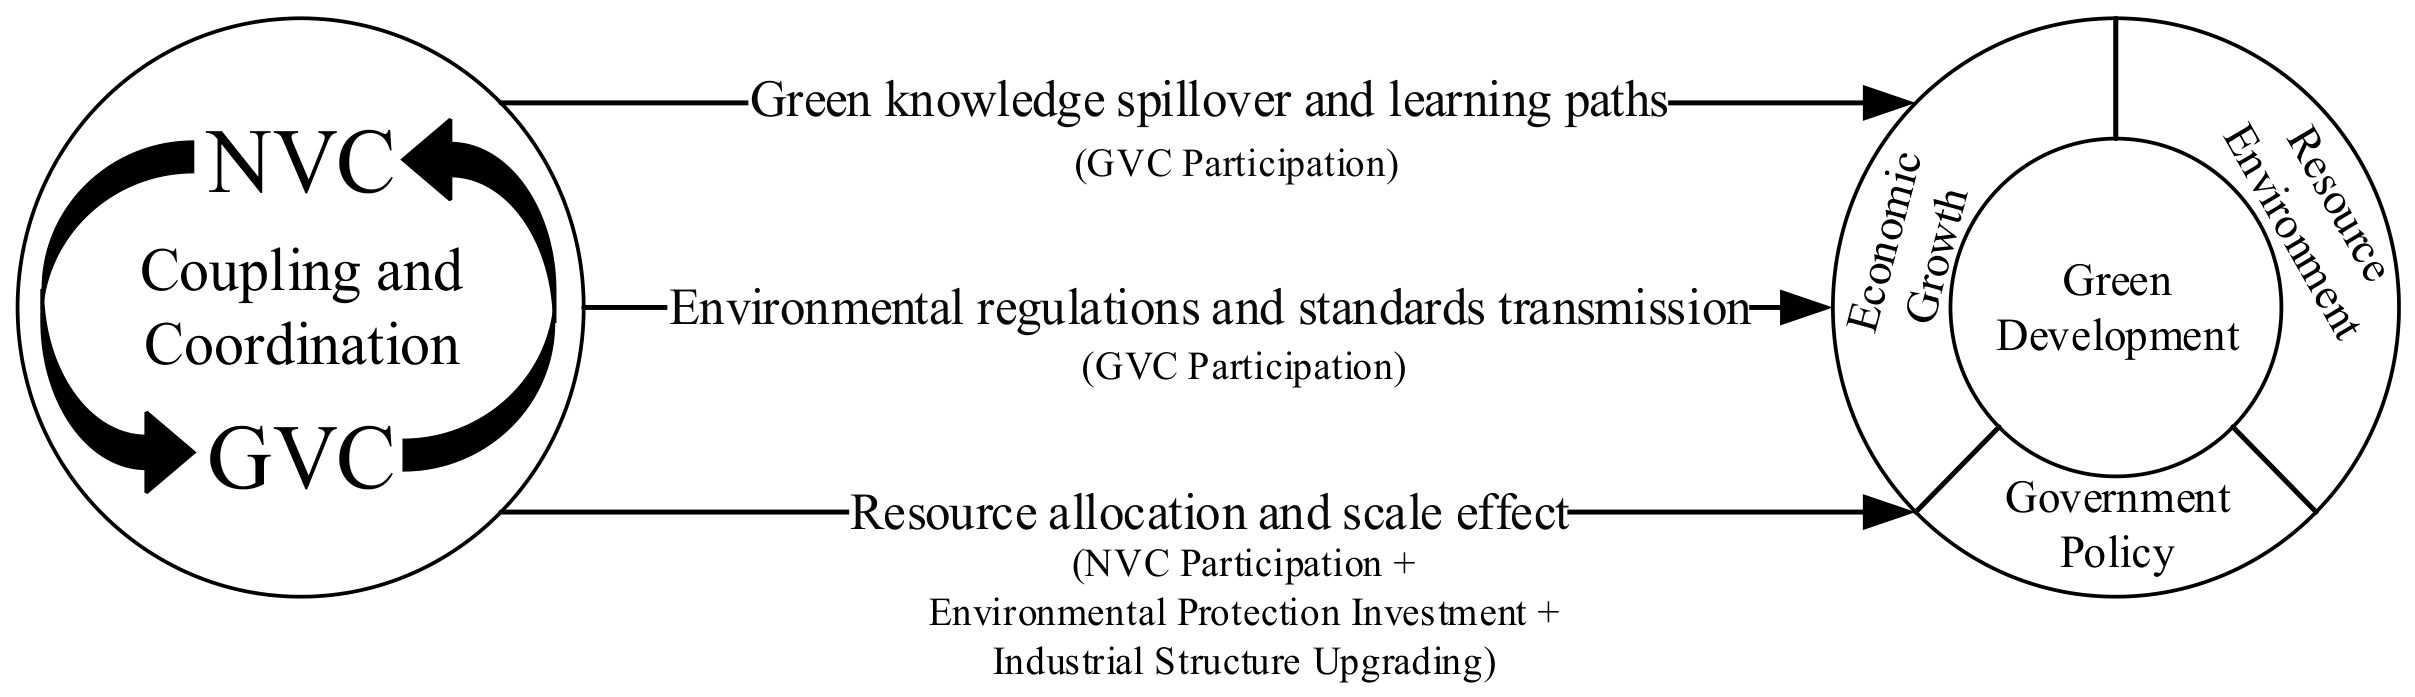
This study aims to analyze theoretically and test empirically the effects of NVC–GVC coupling coordination on regional green development in Chinese manufacturing, to provide appropriate instrumental variables for capturing the underlying causal relationships, and to offer a new perspective on how dual chain dynamics shape green development. Drawing on coupling coordination analysis and provincial pooled cross-sectional data for Chinese manufacturing, we examine how NVC–GVC coupling coordination affects regional green development. The paper makes three principal contributions. First, adopting a dual-chain “coupling coordination” rather than a single-chain lens, we provide a novel perspective and new empirical evidence on the green effects of the dual circulation strategy. Second, we supply two suitable instrumental variables and employ 2SLS to identify the causal effect of NVC–GVC coupling coordination on green development, addressing endogeneity and offering a methodological template for further research in this area. Third, we propose and empirically test three transmission mechanisms—Green Knowledge Spillover and Learning Paths, Environmental Regulations and Standards Transmission, and Resource Allocation and Scale Effect—thereby clarifying the pathways through which dual chain coupling coordination shapes regional green development.
The remainder of the paper proceeds as follows.
Section 2 develops the theoretical framework and states the research hypotheses.
Section 3 describes the empirical methods, data, variables, and the measurement of NVC–GVC coupling coordination.
Section 4 presents and discusses the empirical results.
Section 5 concludes and outlines directions for future research.
3. Methodology and Data
3.1. Measurement Methods for NVCs and GVCs
Meng et al. [
39] and Meng et al. [
40] suggest integrating China’s inter-regional and international input–output tables to measure NVC and GVC participation within a unified framework. This method clarifies their linkages and allows direct comparison. However, because this study uses the NVC–GVC coupling coordination degree as an explanatory variable, a unified accounting framework may cause endogeneity. To avoid this issue, we measure NVC and GVC participation using separate accounting frameworks.
China’s NVC participation is measured using multiregional input–output (MRIO) tables from the CEADs database, while GVC participation is measured using world input–output tables from the OECD. To ensure consistency, we harmonize industry classifications across both datasets and aggregate manufacturing into 17 sectors. The NVC data cover 29 provincial regions, excluding Taiwan, Hong Kong, Macao, Tibet, and Xinjiang. Moreover, the latest versions of publicly available China’s MRIO tables are only available for 2012, 2015, and 2017. Therefore, our analysis is limited to these 3 years.
We adopt the GVC decomposition method proposed by Wang et al. [
41] to calculate NVC and GVC participation in China’s manufacturing sector. The simplified formulas are shown in Equations (1) and (2).
denotes region
national value chain participation in year
.
measures upstream participation, indicating the extent to which the region supplies intermediate inputs to other regions.
measures downstream participation, indicating the use of intermediate inputs sourced from other regions. Similarly,
denotes global value chain participation.
and
measure upstream and downstream participation in global value chains, respectively, following the same definitions as for NVC. NVC and GVC participation are defined in Equations (3) and (4).
In Equations (3) and (4), , , .
Specifically, denotes time (3 years), denotes regions (29 provinces), and denotes industries (17 manufacturing sectors).
3.2. Coupling Coordination Degree Model
Because NVC and GVC participation in China’s manufacturing sector influence each other, we treat them as a coupled system. Following Zhang et al. [
42], we construct a coupling coordination degree model based on coupling coordination theory to measure their coordination level. The model is specified in Equations (5)–(7).
In Equations (5)–(7),
and
denote participation in national and global value chains, respectively.
is the coordination index, while
and
are their weights. Following Zhang et al. [
42] and Tan et al. [
43], the sum of the weights
and
should equal 1. Given the importance of both NVC and GVC participation for China’s economic and green development [
42,
44], we set
to avoid weighting bias.
In Equations (6) and (7),
denotes the coupling degree between NVC and GVC participation in China’s manufacturing, with higher values indicating stronger mutual influence.
denotes the coupling coordination degree. Higher values of
indicate stronger interaction, greater synergy, and better alignment between NVC and GVC development [
42,
43].
3.3. Model Specification
3.3.1. High-Dimensional Fixed Effects Model
To examine the effect of NVC–GVC coupling coordination level in Chinese manufacturing on regional green development, we employ a high-dimensional fixed effects model that controls for industry fixed effects, time fixed effects, and their interaction. The model is specified as follows:
In Equation (8), denotes the manufacturing industry, and denotes the year. denotes the green development level of industry in year , and denotes the coupling coordination degree of NVC and GVC participation. includes all control variables. and represent industry and time fixed effects, respectively. represent the interaction term of industry and time fixed effects. is the error term, is the intercept, and and are slope coefficients.
3.3.2. Mediation Testing Method
This study tests whether GVC participation, NVC participation, environmental protection investment (Envir), and industrial structure upgrading (Isu) mediate the effect of NVC–GVC coupling coordination on green development in Chinese manufacturing. Bootstrap mediation testing procedures are applied throughout [
45].
3.4. Variables and Data
The study draws on mixed cross-sectional data from 2012, 2015, and 2017.
3.4.1. Dependent Variable
Data are sourced from the
2019 China Green Development Index Report: Regional Comparison [
46]. We use the aggregate index together with three sub-indices: (1) economic growth greening, (2) resource–environmental carrying capacity; and (3) government policy support. Each year’s aggregate green development index equals the sum of the three sub-indices.
The green development index provides a composite assessment of regional performance across resource utilization, environmental governance, ecological protection, and growth quality. The Ecogreen sub-index measures the degree to which regional economic development is greened. The Resgreen sub-index gauges the capacity of a region’s resource endowment, ecological protection, environmental stress, and climate conditions to support future economic activity and human welfare. The Polgreen sub-index reflects the degree to which local governments prioritize and support green development [
46,
47].
3.4.2. Independent Variable
NVC–GVC Coupling Coordination. We calculate this variable to measure the degree of coupling and coordination between NVC and GVC participation across 17 manufacturing industries. Based on theoretical analysis, we expect higher NVC–GVC coordination level to be associated with better green development performance. Accordingly, NVC–GVC coupling coordination is expected to be positively related to the green development index. For robustness check, we use the coupling degree and coordination index of NVC and GVC as alternative independent variables.
3.4.3. Mediator
The study employs four mediating variables: GVC participation, NVC participation, environmental protection investment, and industrial structure upgrading. Based on the theoretical analysis in
Section 2, NVC–GVC coupling coordination encourages Chinese manufacturing to deepen both domestic and global value chain participation. A higher GVC participation rate exposes firms to greater volumes of green knowledge and technology, but also subjects them to larger shocks from international environmental regulations and standards, raising compliance costs and, in the early stages, actually suppressing regional green development. We therefore expect GVC participation to exert a negative indirect effect.
Higher NVC participation improves resource allocation efficiency across China’s provincial economies, stimulates local government environmental protection investment, and enhances regional economic and environmental performance, driving industrial structure upgrading. We therefore expect NVC participation, environmental protection investment, and industrial structure upgrading each to generate a positive indirect effect.
The measurement of NVC and GVC participation follows the procedure set out in
Section 3.1. This study uses forward participation only for both NVC and GVC, for three reasons. First, as a theoretical focus, the paper centers on the role of Chinese manufacturing as a “supplier”—providing intermediate goods that influence both domestic and foreign production networks—which is precisely what forward participation captures. Second, regarding the Chinese reality, China’s manufacturing sector integrates deeply into international fragmentation primarily by supplying intermediate and capital goods to the world, making forward participation the more representative measure. Third, to avoid confounding, total participation encompasses the backward component, which more closely reflects the technology content of imports and is less germane to the supply-side resource allocation and scale effect mechanisms on which this paper focuses.
Environmental protection investment. This variable is measured by provincial spending on industrial pollution control. Data are drawn from the EPS China Data platform and the China Environment Statistical Yearbook. Existing research confirms that environmental investment supports sustainable development [
48]. Consistent with the theoretical analysis in
Section 2, we expect this variable to be positively associated with the green development index.
Industrial structure upgrading. Following Zhang et al. [
49], this variable is measured using an industrial structure upgrading index. Prior research establishes a mutually reinforcing relationship between industrial upgrading and green development [
49]. Consistent with the theoretical analysis in
Section 2, we expect this variable to be positively associated with the green development index.
3.4.4. Control Variables
To enhance the robustness of the results, four control variables are included alongside industry fixed effects, year fixed effects, and their interaction.
Wastewater treatment capacity. We measure this variable using the volume of industrial wastewater discharges that meet regulatory standards. Data are from the China Environmental Statistical Yearbook (Regional Edition). Following Su and Sheng [
37] and Yao and Niu [
50], higher compliant discharge volumes indicate stronger treatment capacity. We therefore expect a positive association with the green development index.
Waste gas emissions. This variable is measured using total industrial waste gas from fuel combustion based on data from the China Environmental Statistical Yearbook (Regional Edition). Higher emissions indicate more severe pollution. We therefore expect a negative association with the green development index.
Solid waste recycling. We measure this variable by the comprehensive utilization of industrial solid waste, using data from the China Environmental Statistical Yearbook (Regional Edition). Higher utilization reflects less material waste and better resource efficiency. We therefore expect a positive association with the green development index.
Industrial water use. This variable is measured using total industrial water consumption, reflecting natural resource use based on data from the China Statistical Yearbook. Manufacturing green development relies on massive water inputs. We therefore expect a positive association with the green development index.
Please refer to the
Supplementary Materials or the GitHub repository noted in the Data Availability Statement for the Stata datasets and do-files used in this study.
4. Results and Discussion
4.1. Descriptive Statistics and Correlation Matrix
All analyses were conducted in Stata MP 17.
Table 2 presents descriptive statistics and variable abbreviations.
Table 3 shows the correlation matrix for the 15 variables.
4.1.1. Correlation Between the Dependent and Core Independent Variables
Table 3 reveals significant correlations between NVC–GVC coupling coordination and the aggregate green development index as well as its three sub-indices. Specifically, coupling coordination is significantly and positively correlated with Green (b = 0.105,
p < 0.01), Ecogreen (b = 0.125,
p < 0.01), and Polgreen (b = 0.112,
p < 0.01). By contrast, coupling coordination is significantly and negatively correlated with Resgreen (b = −0.098,
p < 0.01). These patterns indicate that greater NVC–GVC coupling coordination tends to advance regional green development, raise the greenness of economic growth, and encourage local governments to adopt environmental protection policies; however, simultaneously places greater pressure on natural resources and environmental carrying capacity.
In addition, Green is significantly and positively correlated with the coordination index T (b = 0.113, p < 0.01) but bears no significant relationship with the coupling degree C (b = −0.024, p > 0.1). This suggests that within the NVC–GVC system, the coordination dimension—not the coupling dimension—is the operative driver. From an economic standpoint, regions in which NVC and GVC participation are better coordinated exhibit higher levels of green development, whereas the sheer intensity of their interaction has no discernible effect.
As the aggregate index is the sum of the three sub-indices, positive correlations with each component are expected and confirmed. Green is strongly and positively correlated with Ecogreen (b = 0.889, p < 0.01) and Polgreen (b = 0.828, p < 0.01), indicating that overall green development is primarily driven by green economic growth and policy support. However, Green is significantly and negatively correlated with Resgreen (b = −0.136, p < 0.01), reflecting a common pattern in China whereby regions with larger resource and environmental endowments tend to have lower levels of economic development and rely on less efficient resource use, which pulls down their aggregate green development index. The negative correlation between Ecogreen and Resgreen (b = −0.393, p < 0.01) further points to a trade-off between economic greening and resource–environmental carrying capacity.
Table 3 also reveals a significant negative correlation between the coordination index T and the coupling degree C (b = −0.325,
p < 0.01). This implies that when NVC–GVC coordination is high, the coupling intensity tends to be low, and vice versa. This motivates a further robustness check using T and C separately as independent variables.
4.1.2. Multicollinearity Diagnosis for Control Variables and Mediators
Correlation coefficients below 0.6 are generally acceptable [
51]. High correlations among the aggregate index and its sub-indices, and among the coordination index, coupling degree, and coupling coordination degree, are to be expected. Following Jiang et al. [
52], we computed variance inflation factors (VIFs) after estimation; results are reported in
Table 4. The mean VIF is 2.12, and the maximum VIF is 3.60. Both of these values are comfortably below the threshold of 10 [
53], confirming the absence of serious multicollinearity. The VIF structure is identical across the four dependent variable models, further validating that the diagnostic conclusions are invariant to the choice of outcome.
4.2. Baseline Regression
Baseline regressions are estimated using a high-dimensional fixed effects model incorporating industry fixed effects, year fixed effects, and their interaction, together with four control variables, as in Equation (9). Results using the aggregate green development index and each of its three sub-indices as dependent variables are reported in
Table 5.
Hypothesis H1 predicts that NVC–GVC coupling coordination in Chinese manufacturing promotes regional green development. All models in
Table 5 display satisfactory fit, with R-squared values in the range [0.206, 0.575]. NVC–GVC coupling coordination exerts a significant and positive effect on Green (b = 0.147,
p < 0.01), Ecogreen (b = 0.137,
p < 0.01), and Polgreen (b = 0.093,
p < 0.01). It does, however, exert a significant and negative effect on Resgreen (b = −0.083,
p < 0.01), revealing that dual value chain coupling coordination simultaneously imposes transitional pressure on natural resources and the environment even as it drives regional green transformation—a structural divergence in the interior dimensions of green development. Because the aggregate index Green equals the sum of the three sub-indices for each year, it captures China’s overall regional green development level. Consequently, even though NVC–GVC coupling coordination weakens regional resource–environmental carrying capacity, the net effect on aggregate green development remains positive. These results provide statistical support for Hypothesis H1.
4.3. Robustness Check
A series of robustness checks are conducted to validate the findings.
4.3.1. Replacement of Independent Variables
(1) Coordination index (T)
First, we substitute the coordination index T—the degree of coordination between NVC and GVC participation—for the coupling coordination degree as the explanatory variable in robustness check 1. Results are reported in
Table 6.
As
Table 6 shows, the coefficient on T is consistent in sign with the baseline results across all four models and is statistically significant at the 1% level, providing additional support for Hypothesis H1.
(2) Coupling degree (C)
Second, we substitute the coupling degree C, which is the intensity of interaction between NVC and GVC participation, for the key independent variable in robustness check 2. Results are reported in
Table 7.
As
Table 7 shows, the coefficients for C are statistically significant across all four models but reverse in sign relative to the baseline. This is consistent with the significant negative correlation between T and C documented in the correlation matrix. These results confirm that the positive effect of NVC–GVC coupling coordination on green development operates primarily through coordination effects, as captured by the coordination index T, rather than through coupling intensity alone, as captured by C. This conclusion is corroborated by robustness checks 1 and 2 jointly.
4.3.2. Winsorization Test (1–99%)
To limit the influence of extreme outliers and sharpen the robustness of the conclusions, all variables are winsorized at the 1st and 99th percentiles, and regressions are re-estimated. Results are reported in
Table 8.
As
Table 8 shows, the coefficients for the core explanatory variable are consistent in sign with the baseline and remain significant at the 1% level, indicating that the findings are not driven by extreme observations. Hypothesis H1 receives further support.
4.3.3. Alternative Weights for the Coordination Index
To rule out sensitivity to the weighting scheme used in constructing the coordination index, we recompute the coupling coordination degree under two alternative weight configurations. Setting α = 0.7, β = 0.3 yields NVC–GVC_1, with results reported in
Table 9. Setting α = 0.3, β = 0.7 yields NVC–GVC_2, with results reported in
Table 10.
In both sets of estimates, the sign of the core explanatory variable is entirely consistent with the baseline and remains significant at the 1% level. These results confirm that the conclusions of the paper are insensitive to the choice of weights for the coordination index, demonstrating strong robustness.
4.3.4. Adding Province Fixed Effects
Given that the effect of NVC–GVC coupling coordination on green development is partly realized through NVC participation, which is itself strongly correlated with inter-provincial differences in economic development levels, policy environments, and resource endowments, the treatment of province fixed effects warrants careful consideration. The baseline regression and preceding robustness checks already incorporate industry fixed effects, year fixed effects, and their interaction. Adding province fixed effects to this high-dimensional specification risks absorbing large volumes of cross-sectional variation in both the core explanatory variable (NVC–GVC coupling coordination) and the key mediating channel (NVC participation) that carry genuine economic content, potentially eliminating the identifying variation and introducing attenuation bias. Notwithstanding these concerns, and to further probe the robustness of the baseline results, province fixed effects (Id) are added alongside the existing fixed effects, and regressions are re-run. Results are reported in
Table 11.
The estimates in Models 1.6 and 4.6 indicate that, after controlling for province fixed effects, the coefficient on NVC–GVC coupling coordination remains statistically significant at the 1% level and preserves the sign established in the baseline, further underscoring the robustness of the core findings. The modest narrowing of the absolute magnitude of the NVC–GVC coefficient is consistent with the theoretical expectation that province fixed effects absorb part of the cross-sectional identifying variation. Notably, the coefficient sign reversal for NVC–GVC in Models 2.6 and 3.6 does not undermine the core conclusions; we return to this point in
Section 4.6. Overall, Hypothesis H1 receives further statistical support.
4.4. Endogeneity Test
We employ two-stage least squares (2SLS) to address the potential endogeneity between NVC–GVC coupling coordination and green development. Valid instruments must satisfy both a relevance condition and an exclusion restriction. We select Terrain Ruggedness (Topo) and the Historical Count of Confucian Academies (Academy) as instruments for the following reasons.
Regarding terrain ruggedness, the relevance condition holds because topography shapes the cost of transport infrastructure construction and the accessibility of regions, systematically influencing industrial location and factor mobility. Here, flatter terrain implies better developed transport networks, lower logistics costs, and a greater likelihood of deep value chain embeddedness and integration. The exclusion restriction holds because terrain features are determined by geological history, do not change with economic activity over the sample window, and do not directly affect current green development levels [
54,
55].
Regarding Confucian academy counts, the relevance condition holds because the Confucian cultural tradition shapes social norms, business ethics, and trust mechanisms, influencing the cooperative orientation of regional firms, contract enforcement efficiency, and openness to external exchange, and thereby their willingness to participate in value chain specialization. Historically denser concentrations of academies are associated with deeper Confucian cultural accumulation, effects that continue to permeate the behavioral logic of local economic agents through intergenerational transmission [
56]. The exclusion restriction holds because academy counts are historical cultural relics formed centuries ago and bear no direct relationship to current green development levels.
Table 12 reports 2SLS estimates using heteroskedasticity robust standard errors. In the first stage, the coefficient on terrain ruggedness (Topo) is significantly negative at the 1% level across all four specifications (coefficient approximately −0.017, t = −6.467), indicating that flatter regions exhibit higher levels of value chain coupling coordination. This finding is consistent with theoretical expectations. The coefficient of academy is also negative but fails to reach conventional significance (t = −0.921), suggesting limited independent explanatory power over the endogenous variable. Nevertheless, the joint F-statistic for both instruments is 21.225, substantially exceeding the Stock–Yogo critical value of 10 at the 10% significance level, confirming that the instrument set provides sufficient collective explanatory power and is free from weak instrument concerns.
Instrument validity is supported by Hansen J over-identification test p-values of 0.223, 0.151, 0.428, and 0.163 across the four specifications. All of these values far exceed 0.1, so the null hypothesis that the instruments satisfy the exclusion restriction cannot be rejected, confirming both instruments meet the exogeneity requirement. Endogeneity test p-values are uniformly 0.000, rejecting the null hypothesis that the key explanatory variable is exogenous at the 1% level and confirming that NVC–GVC coupling coordination is endogenous in its effect on green development, establishing the necessity of 2SLS correction.
In the second stage, the fitted value coefficients for NVC–GVC coupling coordination are 1.126 *** (z = 5.914), 1.262 *** (z = 6.377), −0.756 *** (z = −6.236), and 0.618 *** (z = 5.786) for Green, Ecogreen, Resgreen, and Polgreen, respectively. All of these values are highly significant at the 1% level and entirely consistent in sign with the baseline regression. The significantly negative Resgreen coefficient may reflect structural tension between deep value chain integration and the resource utilization efficiency dimension, a matter warranting further investigation. On the whole, the positive and robust effect of NVC–GVC coupling coordination on regional green development persists after accounting for endogeneity bias, providing further support for Hypothesis H1.
4.5. Mechanism Test (Bootstrap Mediation Analysis)
4.5.1. GVC Participation as Mediator
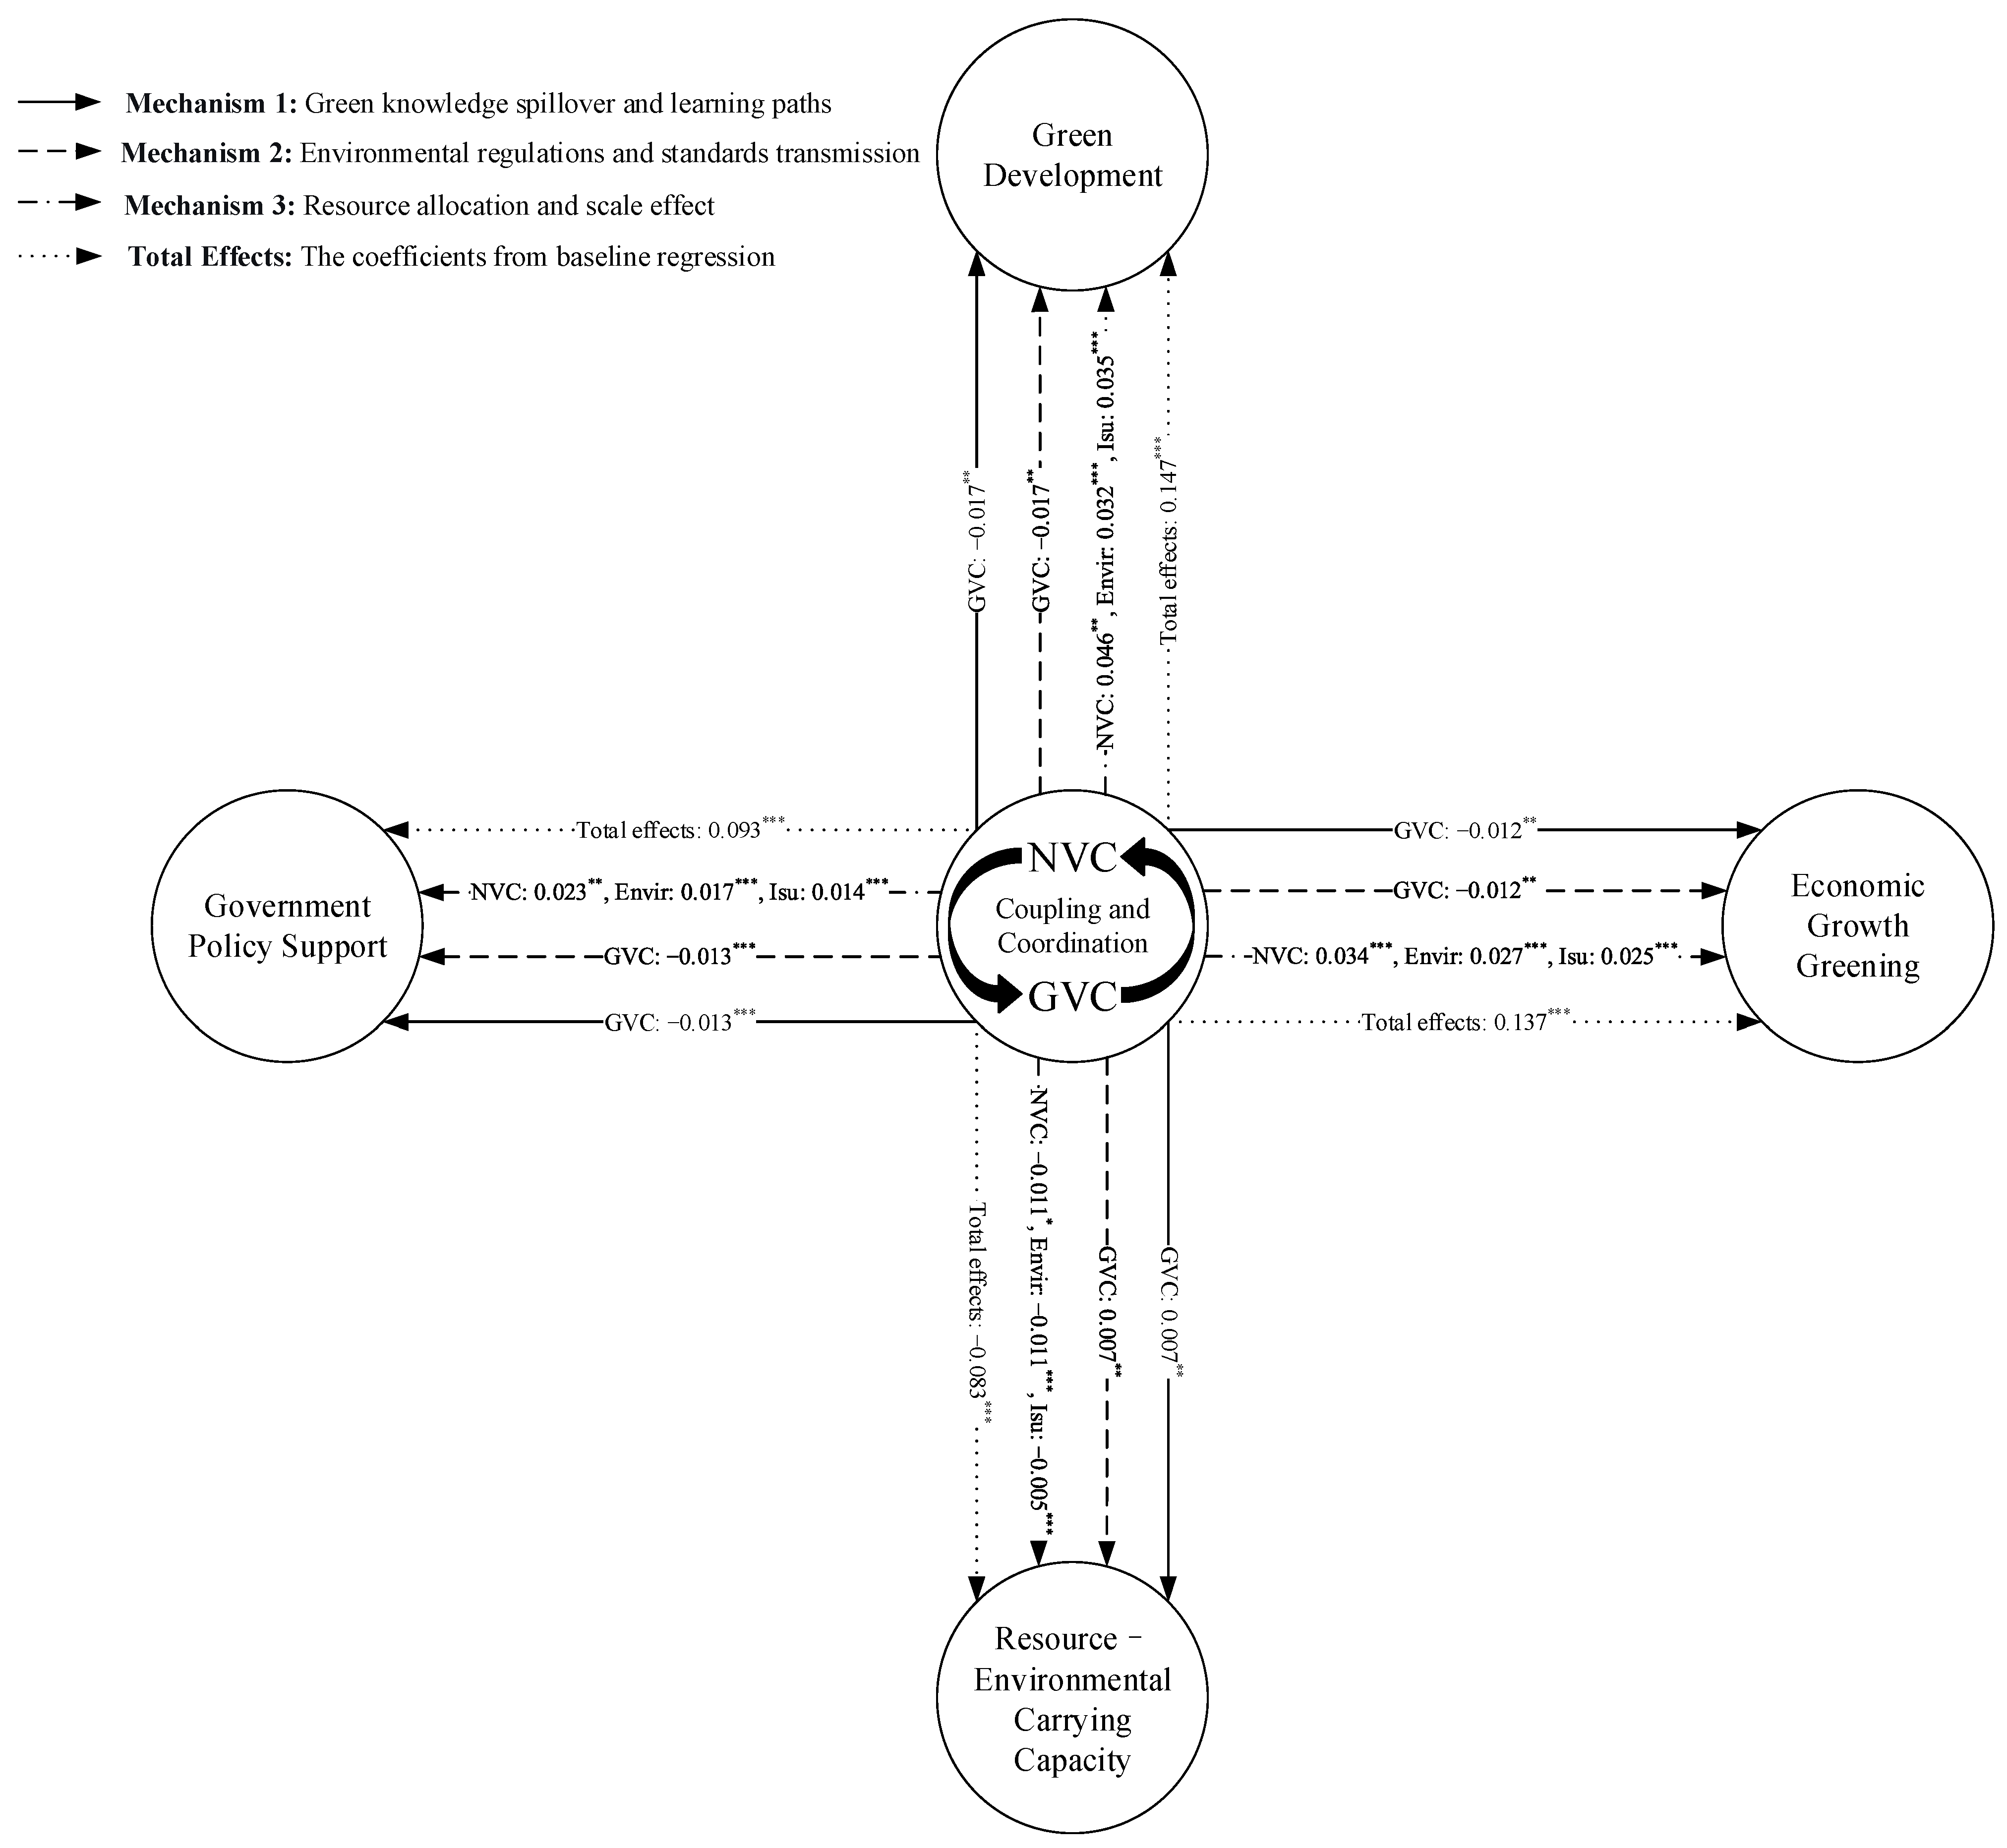
Table 13 reports results with GVC participation (GVC_Pat_f) as the mediator. Regarding indirect effects, the NVC–GVC → GVC_Pat_f → Green indirect effect coefficient is −0.017 (
p = 0.023), with a 95% confidence interval of [−0.032, −0.002] that excludes zero, indicating a statistically significant negative indirect effect at the 5% level. The NVC–GVC → GVC_Pat_f → Ecogreen coefficient is −0.012 (
p = 0.013), which is significant and negative. The NVC–GVC → GVC_Pat_f → Polgreen coefficient is −0.013 (
p = 0.003), which is significant at the 1% level and negative. Of particular interest, the NVC–GVC → GVC_Pat_f → Resgreen indirect effect coefficient is 0.007 (
p = 0.014), which is significantly positive and opposite in sign to the other three green dimensions. These findings suggest that the GVC channel does provide some positive transmission for resource utilization efficiency, potentially linked to technological spillovers from GVC embeddedness. Regarding direct effects, after controlling for GVC_Pat_f, the direct effect of NVC–GVC coupling coordination on all four dependent variables remains highly significant at the 1% level (coefficients 0.093, 0.071, −0.046, and 0.068), indicating partial mediation across all four dimensions. These results confirm that NVC–GVC coupling coordination exerts significant negative indirect effects on Green, Ecogreen, and Polgreen through the GVC participation channel, supporting Hypothesis H2.
4.5.2. NVC Participation as a Mediator
Table 14 reports bootstrap mediation test results with NVC participation (NVC_Pat_f) as the mediator. Regarding indirect effects, the NVC–GVC → NVC_Pat_f → Green indirect effect coefficient is 0.046 (
p = 0.019), with a 95% confidence interval of [0.008, 0.085] that excludes zero, indicating a significant positive indirect effect at the 5% level. The NVC–GVC → NVC_Pat_f → Ecogreen coefficient is 0.034 (
p = 0.005) and is significantly positive at the 1% level. The NVC–GVC → NVC_Pat_f → Polgreen coefficient is 0.023 (
p = 0.047) and significantly positive at the 5% level. The NVC–GVC → NVC_Pat_f → Resgreen coefficient is −0.011 (
p = 0.081), which is marginally significant and negative at the 10% level, suggesting that the NVC channel exerts some suppressive effect on Resgreen, possibly related to resource consumption pressures accompanying domestic value chain deepening. Regarding direct effects: after controlling for NVC_Pat_f, the direct effect of NVC–GVC on Green (
p = 0.267) and Ecogreen (
p = 0.132) is no longer significant, indicating full mediation for these two dimensions. The direct effects on Resgreen and Polgreen remain significant, indicating partial mediation. These results confirm that NVC–GVC coupling coordination exerts a positive indirect stimulus on regional green development via the NVC participation channel, supporting Hypothesis H3a.
4.5.3. Environmental Protection Investment as a Mediator
Table 15 reports results with environmental protection investment (Envir) as the mediator. Regarding indirect effects, the coefficients for NVC–GVC → Envir → Green (0.032,
p = 0.000), NVC–GVC → Envir → Ecogreen (0.027,
p = 0.000), and NVC–GVC → Envir → Polgreen (0.017,
p = 0.000) are all highly significant and positive at the 1% level, with 95% confidence intervals that exclude zero. The NVC–GVC → Envir → Resgreen coefficient is −0.011 (
p = 0.000) and significantly negative. This is consistent with the overall sign pattern for Resgreen. Regarding direct effects, after controlling for Envir, the direct effect of NVC–GVC on all four dependent variables remains significant across all specifications, indicating partial mediation. These results confirm that NVC–GVC coupling coordination raises regional green development levels by incentivizing greater environmental protection investment; the indirect effect is robust and highly significant, supporting Hypothesis H3b.
4.5.4. Industrial Structure Upgrading as a Mediator
Table 16 reports results with industrial structure upgrading (Isu) as the mediator. Regarding indirect effects, the coefficients for NVC–GVC → Isu → Green (0.035,
p = 0.003), NVC–GVC → Isu → Ecogreen (0.025,
p = 0.002), and NVC–GVC → Isu → Polgreen (0.014,
p = 0.003) are all significant and positive at the 1% level. The NVC–GVC → Isu → Resgreen coefficient is −0.005 (
p = 0.002) and significantly negative. Regarding direct effects, after controlling for Isu, the direct effect of NVC–GVC on all four dependent variables remains highly significant at the 1% level, confirming partial mediation across all dimensions. These results indicate that NVC–GVC coupling coordination promotes regional green development by driving industrial structure toward higher end, less resource-intensive sectors, effectively reducing the dependence of economic growth on resource consumption and pollution emissions. Hypothesis H3c is supported.
Table 17 summarizes the direction of each mediating effect and the type of mediation across all four channels, and
Figure 2 depicts the three mediating mechanisms and total effect framework. As
Table 17 shows, NVC_Pat_f exerts full mediation on Green and Ecogreen and partial mediation on Resgreen and Polgreen. GVC_Pat_f, Envir, and Isu all display partial mediation across all four green development dimensions. These results collectively corroborate the theoretical logic of NVC–GVC coupling coordination affecting regional green development through multiple channels.
4.6. Discussion
The empirical results provide support—or partial support—for all five hypotheses, while also surfacing several complexities that merit deeper discussion.
4.6.1. Core Findings and Aggregate Effect
The baseline regression (
Table 5) and the full battery of robustness checks (
Table 6,
Table 7,
Table 8,
Table 9,
Table 10 and
Table 11) consistently indicate that NVC–GVC coupling coordination exerts a significant and positive effect on Green, Ecogreen, and Polgreen, whereas it exerts a significant and negative effect on Resgreen. The 2SLS endogeneity test (
Table 12) further confirms this causal relationship, supporting Hypothesis H1. These findings indicate that, over the sample period (2012–2017), dual chain coupling coordination in Chinese manufacturing has yielded tangible gains in greening the economy and strengthening policy responsiveness, while simultaneously exerting transitional pressure on natural resource and environmental carrying systems.
4.6.2. Sign Reversals in the Robustness Check: Identifying Variation and Dimensional Heterogeneity
A notable finding is the sign reversal in the coefficients on NVC–GVC coupling coordination for Ecogreen and Resgreen after adding province fixed effects (
Table 11, Models 2.6 and 3.6). This reversal does not invalidate the core conclusions; rather, it illuminates the economic implications of alternative identification strategies.
The first economic implication is the change in identifying variation. The baseline regression exploits variation both across provinces (between province) and within individual provinces over time (within province). Adding province fixed effects restricts identification strictly to within-province temporal variation, purging the systematic cross-sectional differences (in factor endowments, industrial foundations, and policy environments) that distinguish provinces. Models 2.6 and 3.6 thus capture the within-province, year-to-year change in NVC–GVC coupling coordination and its net effect on Ecogreen and Resgreen—a fundamentally different object of inference from the cross-provincial comparison embedded in the baseline.
The second economic implication is the divergence between cross-provincial patterns and within-province dynamics. The sign reversals imply that, in cross-provincial comparisons, provinces with higher NVC–GVC coupling coordination tend to display higher Ecogreen and lower Resgreen. In within-province temporal dynamics, however, a short-run increase in coupling coordination may marginally depress Ecogreen by accelerating industrial activity and increasing resource consumption, while simultaneously improving Resgreen by incentivizing environmental technology adoption and governance investment. The cross-provincial effect reflects long-run systemic advantages; the within-province temporal effect captures transitional pressures in dynamic adjustment. The distinct behavior of these two effects across the Ecogreen and Resgreen dimensions reflects an inherent tension between cross-provincial structural differences and short-run within-province dynamics, a manifestation of the dimensional heterogeneity in how NVC–GVC coupling coordination affects green development, warranting further investigation. Crucially, the coefficients on Green and Polgreen retain their sign and merely narrow in magnitude after province fixed effects are added, confirming that the overall positive effect of NVC–GVC coupling coordination on green development is robust.
4.6.3. Coupling Degree vs. Coordination Index: Coordination Matters More than Coupling
Robustness Check 2 (
Table 7) shows that the coupling degree C produces significantly negative coefficients for Green, Ecogreen, and Polgreen—exactly the opposite sign to the coordination index T and the coupling coordination degree D. Far from being contradictory, this result validates the adoption of the coupling coordination model.
Statistically, the sign reversal is consistent with the significant negative correlation between T and C (b = −0.325,
p < 0.01) documented in the correlation matrix (
Table 3). Economically, the coupling degree C measures only the intensity of the interaction between NVC and GVC, without capturing the coherence of their developmental trajectories or the rationality of resource allocation between them. In the early stages of China’s manufacturing development, the NVC depended heavily on the GVC. Their interaction was frequent (high coupling), but the NVC was immature and coordination was low. As domestic industrial chains matured and both NVCs and GVCs developed in step with one another (rising T), their mutual dependence may have declined, and competitive dynamics may even have emerged in certain domains, driving C downward. Consequently, raw high coupling (high C) may signal dependence or competition rather than synergy, and may actually impede green development; high coordination (high T), by contrast, represents genuine systemic synergy—the true engine of green progress. This finding powerfully supports one of the paper’s central arguments: the quality of co-ordination matters more than the intensity of coupling.
4.6.4. Mediating Mechanisms: The NVC-Led Channel and the Dampening Effect of GVC
The bootstrap mediation results trace out three distinct mechanisms, which can be organized into two broad channels.
The first channel is the green knowledge spillover and environmental regulations transmission channel (GVC channel). GVC participation (GVC_Pat_f) mediates the effect of NVC–GVC coupling coordination with a significant negative partial indirect effect on Green, Ecogreen, and Polgreen, supporting Hypothesis H2. Of particular note, the GVC channel exhibits a positive indirect effect in the Resgreen dimension, implying that deepening GVC integration does, to a degree, expose Chinese manufacturers to internationally advanced green technologies and environmental standards and thereby improves the efficiency of ecological resource utilization. This is consistent with the theoretical expectation that GVC participation fosters green innovation. However, the upward compliance pressure imposed by lead firms raises the production costs of many manufacturers, and some may curtail capacity as a result. Furthermore, local governments may enforce international environmental regulations only selectively in order to protect employment and economic growth, further attenuating the positive transmission effects. In buyer-driven GVCs, lead firms capture the lion’s share of value, while Chinese manufacturing suppliers face a dual bind of cost pressure and limited functional upgrading opportunities. In some cases, high pollution production stages may even be relocated to China under “pollution haven” dynamics, generating a net drag on overall green development performance [
32]. This reflects the likelihood that, over the 2012–2017 sample period, Chinese manufacturing firms were still positioned in the mid-to-lower tier of GVCs—passive recipients whose green dividends from GVC engagement were insufficient to offset the competitive and compliance costs incurred.
The second channel is the resource allocation and scale effect channel (NVC-led channel). NVC_Pat_f fully mediates the effect of NVC–GVC coupling coordination on Green and Ecogreen and partially mediates the effect on Resgreen and Polgreen. Envir and Isu partially mediate the effect across all four green development dimensions. NVC_Pat_f, Envir, and Isu all generate significant positive indirect effects on Green, Ecogreen, and Polgreen as well as significant negative indirect effects on Resgreen. Hypotheses H3a, H3b, and H3c are all supported. This highly consistent sign pattern strongly supports interpreting these three mediators as components of a unified “resource allocation and scale effect” mechanism. Specifically, NVC deepening drives the reallocation of regional productive factors, promotes structural upgrading toward higher value added, lower pollution industries (Isu), and incentivizes environmental investment (Envir) by both local governments and firms. This process raises the greenness of economic growth and the intensity of policy support while, in the short run, crowding out environmental carrying capacity as industrial expansion and resource consumption accelerate. This is consistent with the broader GVC literature’s observation that upgrading often entails short-run costs and trade-offs [
30,
57].
Taken together, the evidence indicates that over the 2012–2017 sample period, the effect of NVC–GVC coupling coordination on green development in Chinese manufacturing is dominated by the positive impetus of the resource allocation and scale effect mechanism (NVC-led channel), overlaid by the negative dampening of the green knowledge spillover and environmental regulations transmission mechanism (GVC channel). The net aggregate effect is positive, but it is accompanied by pressure on resource–environmental carrying capacity. This finding reflects China’s current development stage. Rapid expansion of domestic circulation improves green economic performance and policy responsiveness but also increases short-term resource and environmental pressure in the absence of effective green governance. This suggests that expanding NVC–GVC coordination alone does not ensure ecological sustainability. Instead, value chain upgrading must be combined with targeted green governance to achieve both economic and environmental gains. These results have important policy implications and suggest directions for future research, discussed in
Section 5.
5. Conclusions and Future Research
This study investigates the causal effects and mechanisms through which the coupling coordination of national value chains and global value chains shapes green development in Chinese manufacturing. By quantifying NVC–GVC coupling coordination and applying a suite of econometric tools, including high-dimensional fixed effects estimation, two-stage least squares, and bootstrap mediation tests, the analysis yields a rich set of findings that provide novel empirical evidence and theoretical insight into the dynamics of green development in Chinese manufacturing under the new development paradigm.
5.1. Conclusions and Theoretical Implications
The paper establishes the following. First, NVC–GVC coupling coordination in Chinese manufacturing significantly promotes regional green development, economic green transition, and environmental policy intensity while weakening regional resource–environmental carrying capacity. Second, this effect is driven by coordination and not by coupling intensity, the sign of whose effect is opposite to that of the main finding. Third, three mediating mechanisms govern how NVC–GVC coupling coordination affects green development. Specifically, the resource allocation and scale effect mechanism aligns in sign with the main effect, while the green knowledge spillover and learning paths mechanism and the environmental regulations and standards transmission mechanism each operate in the opposite direction. In the current Chinese context, the NVC_Pat_f-led resource allocation and scale effect mechanism is dominant. This NVC-led finding implies that, when assessing the systemic influence of dual value chain dynamics on green development, the “quality of coordination” is more explanatory than the “intensity of interaction.” Furthermore, to our knowledge, this study is the first to propose reliable instrumental variables suitable for identifying the causal effect of NVC–GVC coupling coordination on green development, thereby opening a new avenue for causal inference from this vantage point.
5.2. Policy Recommendations
Returning to the bench-press analogy, the findings reveal a pronounced “right-arm dominance” in the way NVC–GVC coupling coordination drives green development in Chinese manufacturing: NVC participation and the resource allocation and scale effect mechanism it carries constitute the primary source of impetus. By contrast, the green knowledge spillover and environmental regulatory effects transmitted through GVC participation have yet to generate sufficient positive traction over the sample period. This implies that China’s manufacturing dual chain coupling currently operates in a “right-handed” mode. Future policy priorities should shift toward “strengthening the left hand”, that is, enhancing the positive green-development transmission capacity of GVC participation and guiding the dual chains from their current dominant–subordinate arrangement toward a more balanced and mutually reinforcing bilateral synergy.
5.3. Limitations and Future Research
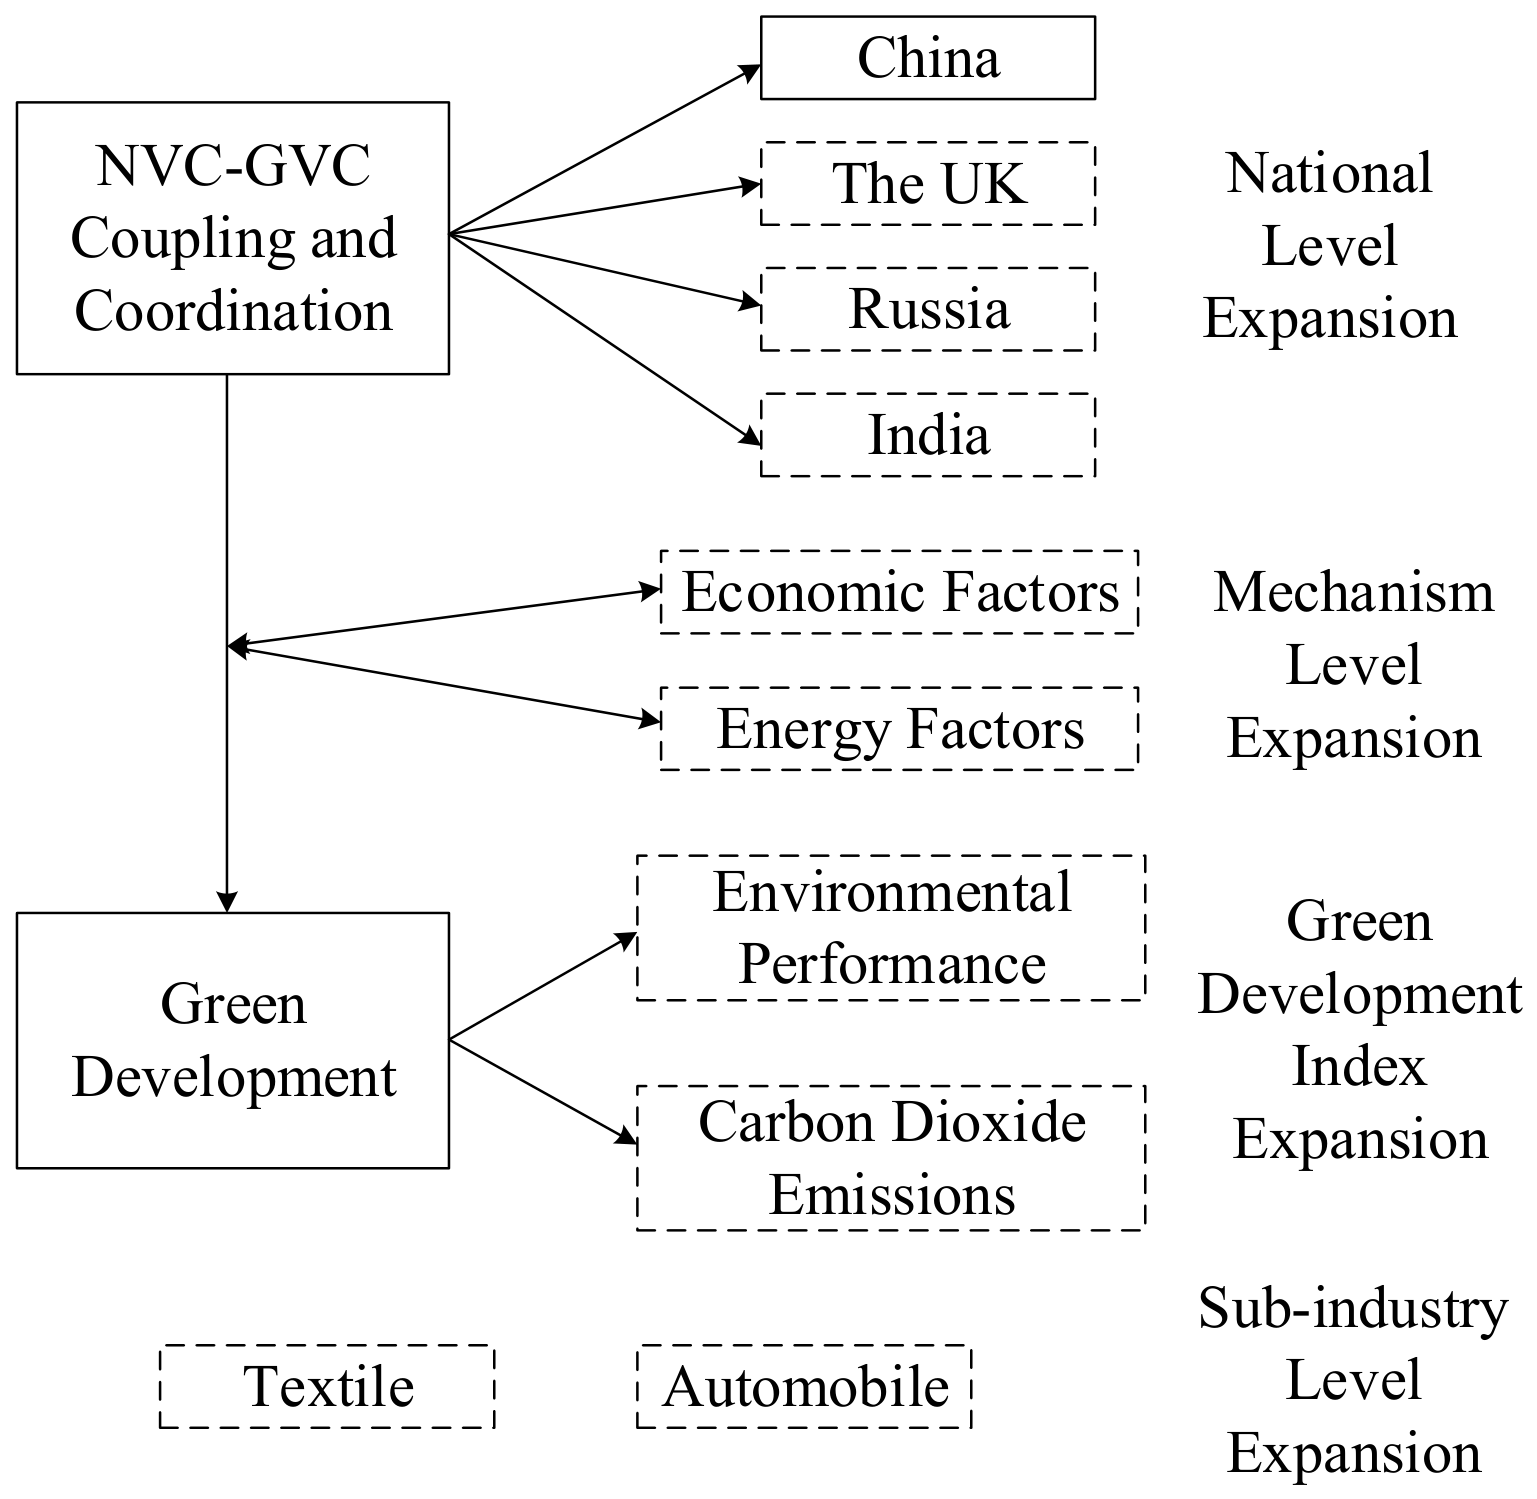
The model specification retains only four core control variables (wastewater treatment capacity, waste gas emissions, solid waste recycling, and industrial water use). This parsimonious approach is designed to keep the focus on the total effect of NVC–GVC coupling coordination and to avoid over-controlling mediating pathways that would obscure the true causal chain. Green development is, however, shaped by a complex array of factors. Future research can advance along five dimensions. First, at the country level, the analysis will be extended to three additional countries, including the United Kingdom, Russia, and India. Second, at the mechanism level, future work will examine the potential mediating roles of economic and energy-side factors such as energy structure and capital intensity in the pathway from NVC–GVC coupling coordination to green development. Third, at the level of green development indicators, the impact and mechanisms of NVC–GVC coupling coordination on environmental performance and carbon emissions will be examined. Fourth, at the industry level, the relationship between NVC–GVC coupling coordination and green development in key sectors such as textiles and automotive will be studied. Fifth, regarding effect heterogeneity, future research will investigate the dimensional heterogeneity in how NVC–GVC coupling coordination affects green development in greater depth. We also encourage scholars to pursue further investigations along multiple dimensions to deepen our collective understanding of the green development effects of dual value chain synergy. Avenues for future research are illustrated in
Figure 3.