3. Materials and Methods
The analysis uses an export of FixMyStreet Brussels reports as seen in
Table 1, containing identifiers, timestamps, hierarchical categories, responsible organizational units, status, address descriptors, free-text narratives, and point geometries. Resolution time is computed from created and closed timestamps for closed cases.
Free-text comments are cleaned by removing obvious system templates and non-informative tokens, standardizing whitespace and line breaks, and filtering empty entries. A language-normalization step produces an English field (comment_translated) used for downstream modeling. Short texts (<10 characters) are retained but flagged for robustness checks, since they provide limited semantic evidence. The gold-standard annotation scheme uses a stratified sample of 1000 reports manually labeled into three classes representing non-urgent/neutral (class 0), routine complaint/service request (class 1), and high urgency/safety risk (class 2). The high-urgency class is intentionally rare to reflect operational reality and to stress-test recall and calibration for critical cases (see
Table 2). Because this study relies only on public FixMyStreet Brussels open data, municipal dispatch logs, protected attributes, socioeconomic indicators, and non-public workflow metadata were not available. To strengthen label validation within these constraints, a second human annotator independently relabeled all 1000 gold-standard reports from a blind text-only file, without access to original labels, model scores, categories, departments, status, postal codes, or resolution-time fields. Agreement between the original labels and the second annotation was then assessed with percent agreement, Cohen’s kappa, quadratic weighted kappa, class-specific agreement, and a confusion matrix. The same annotator also reviewed 200 model-ranked high-urgency candidate reports from the existing corpus; these cases were used as a selective rare-class validation set, not as an unbiased test set. The use of percent agreement, kappa, weighted kappa, and class-specific agreement follows standard recommendations for computational-linguistic annotation reliability, where agreement coefficients must be interpreted together with task ambiguity and class prevalence [
18].
Table 3 reports the label-reliability audit for the gold-standard annotation, including the blind second annotation, agreement coefficients, class-specific agreement, and the selective high-urgency candidate review.
The label reliability audit is reported before model performance so that classification results are interpreted against the stability of the human labels.
The validation design reduces dependence on the original small gold set through a larger blind text-only annotation subset. It uses the same second human annotator and includes 500 random corpus reports, 300 model-ranked high-urgency candidate reports, and 200 borderline or uncertain candidate reports. The annotation file excludes model scores, original labels, categories, departments, status fields, postal codes, and resolution-time outcomes.
Table 4 summarizes the expanded validation subset design and separates the random corpus stratum from the rare-class and boundary-focused strata.
The random stratum is the most relevant part for generalization. The model-ranked and borderline strata deliberately increase the number of difficult or high-risk cases, so they are interpreted as validation stress tests rather than prevalence estimates.
Together with the original 1000-report gold standard and the earlier 200 high-urgency candidate review, the distinct human-reviewed evidence base now covers 2200 reports. The design still uses one second annotator and therefore does not replace adjudicated multi-annotator labeling.
A bag-of-words baseline is trained using TF-IDF features and multinomial logistic regression. Model quality is assessed with accuracy, macro-averaged F1, class-specific recall, ranking-oriented metrics, and bootstrap uncertainty intervals. Because downstream decisions require interpretable probabilities, model confidence is evaluated via reliability diagrams and expected calibration error (ECE). A calibrated variant is obtained by fitting a post hoc calibration model on held-out predictions. Confusion matrices support error analysis across classes.
The implementation uses TF-IDF features with lowercase normalization, Unicode accent stripping, sublinear term frequency, max_df = 0.95, min_df = 5, and the unigram setting selected by five-fold stratified grid search. Logistic regression is fitted with C = 2.0 and balanced class weights. The best cross-validated macro-F1 during grid search was 0.8053. Probability calibration uses sigmoid calibration with three internal folds, while the fixed test split is retained for comparability with the confusion matrices.
Supplementary transformer baselines are evaluated without new labels by extracting frozen mean-pooled embeddings from distilbert-base-multilingual-cased and xlm-roberta-base and then fitting the same balanced logistic regression classifier in five-fold stratified cross-validation. These checks compare representational alternatives under the same small gold-standard constraint; they are not full fine-tuned transformer classifiers.
To summarize recurrent problem types, reports are clustered into topics using a term-based topic representation that yields top words per topic. For each topic, the mean predicted urgency probability and an aggregate hotspot score are computed, enabling comparisons between high-volume but low-risk themes and lower-volume themes that concentrate risk.
Topic modeling is implemented as non-negative matrix factorization (NMF) over TF-IDF features, with 20 topics, 15 top words per topic, max_features = 20,000, min_df = 5, max_df = 0.95, and n-grams up to bigrams. Supplementary checks compare NMF with latent Dirichlet allocation (LDA) on a 50,000-report sample using UMass coherence and BERTopic on a 10,000-report sample using paraphrase-multilingual-MiniLM-L12-v2 embeddings, UMAP reduction, and HDBSCAN clustering. These comparisons are included because short administrative texts can produce unstable or artifact-heavy topics [
11,
19].
Reports are aggregated over spatial units and weekly time bins. Hotspot scores combine volume and urgency signals to highlight areas with persistent, high-impact demand. A z-score-based event detector is applied to aggregated time series; events are flagged only when deviations exceed a predefined threshold, reducing sensitivity to routine seasonality and noise.
For each area-week cell, the hotspot score is calculated as log(1 + volume) × (0.2 + mean predicted high-urgency probability). The event detector applies rolling z-scores to weekly volume, mean high-urgency probability, and hotspot score, using a six-week rolling window, minimum volume of three reports, and a z-threshold of 2.5. Sensitivity checks vary the z-threshold from 1.5 to 3.0 and the rolling window from 4 to 12 weeks, consistent with the broader change-point literature that treats anomaly detection as sensitive to temporal scale and thresholding choices [
20].
For the TF–IDF logistic regression model, SHAP values are computed to identify terms that increase or decrease the predicted probability of high urgency and complaint-oriented classes. Term rankings are inspected for face validity and for potential governance concerns (e.g., artifacts and overly generic tokens).
Because this is a public-service context, model outputs are treated as reviewable decision-support signals rather than automated decisions. This framing aligns with recent AI risk-management guidance that emphasizes mapping, measuring, monitoring, transparency, and governance controls for AI systems used in consequential settings [
21,
22]. No municipal deployment, staff user study, or direct comparison with internal triage workflows was available within the open-data design. The operational checks are therefore retrospective and decision-oriented, using ranking metrics, priority-decile resolution patterns, and area-week summaries as indirect evidence rather than as proof of workflow improvement.
4. Results
As seen in
Table 2, the export contained 522,132 raw reports. Exact duplicates were rare (760 records) and were collapsed using timestamp, geometry, and text keys. Closed reports represented the majority of cases (426,490) and were used to compute resolution-time outcomes. Text fields were frequently sparse: a total of 14.25% of reports had empty or null comments and were excluded from text modeling, and 15.57% contained fewer than 10 characters and were retained as low-information cases.
Table 5 shows that the calibrated TF-IDF logistic regression model reached an accuracy of 0.855 and a macro-F1 of 0.826 on the gold-standard test set, with a high-urgency class recall of 0.700. The uncalibrated model variant produced higher overall scores on this split, with an accuracy of 0.880 and a macro-F1 of 0.882, but it showed poorer probability behavior in reliability analysis.
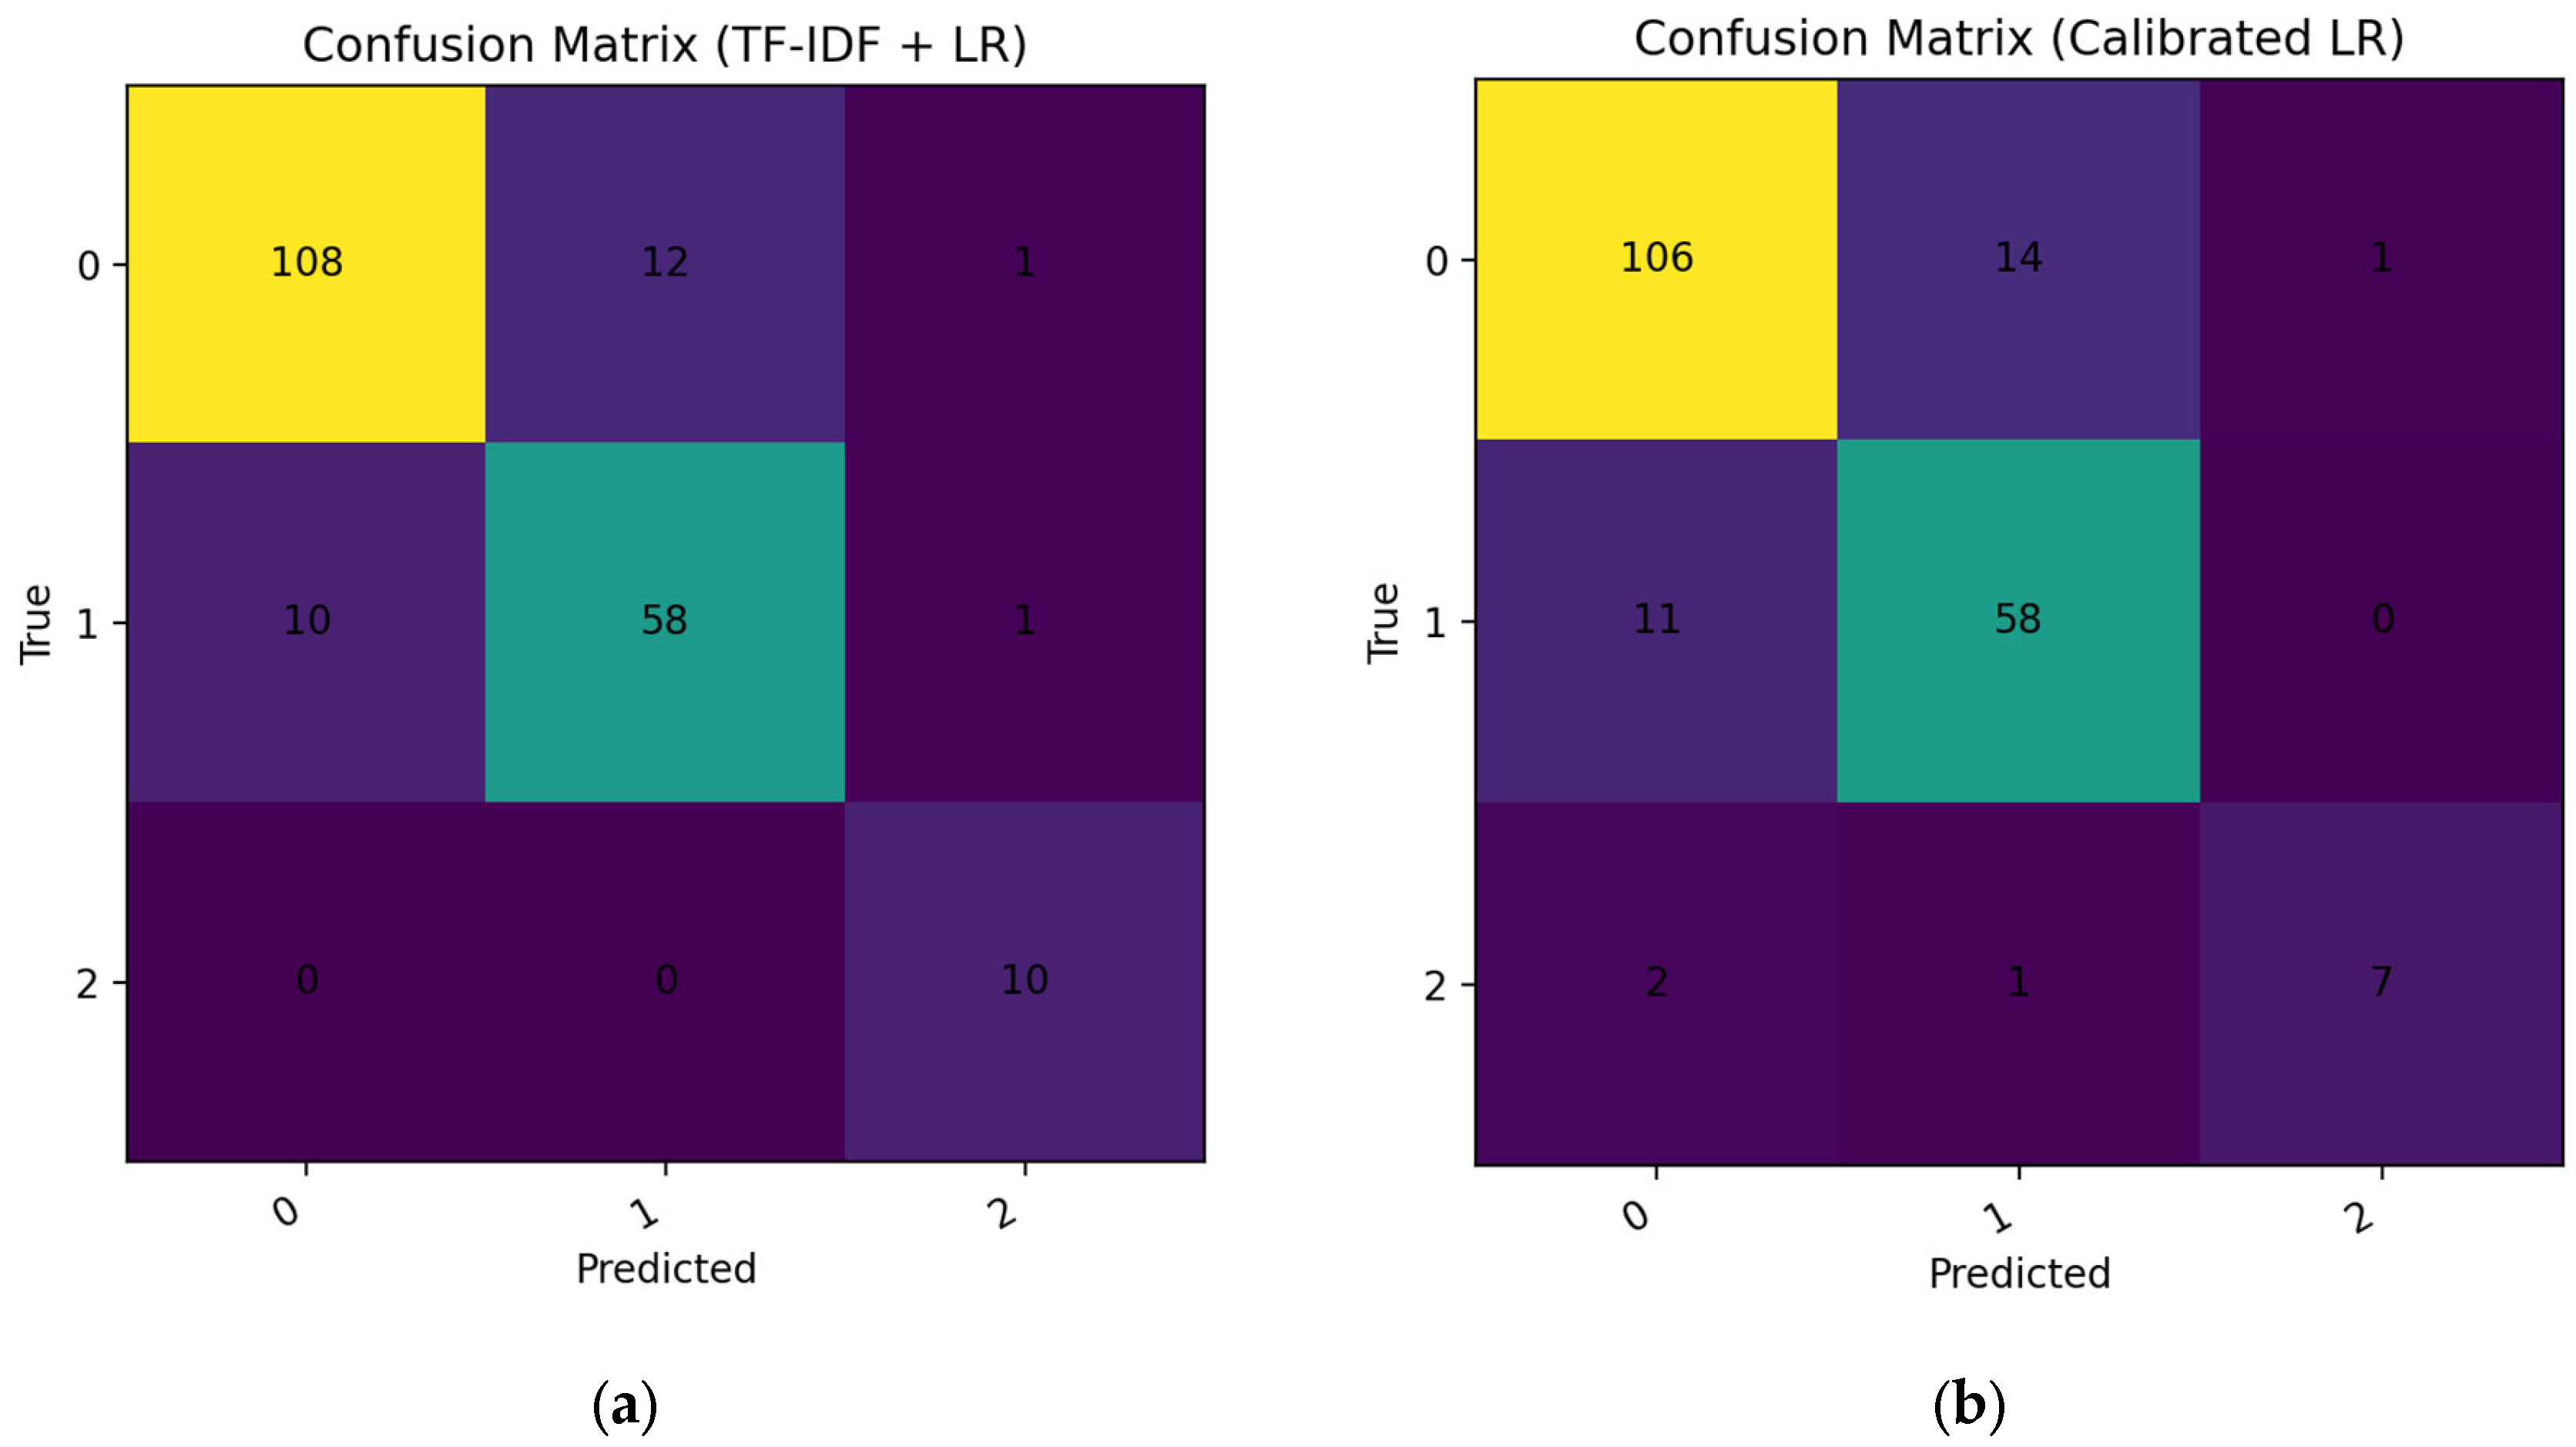
Confusion matrices (
Figure 1) indicate that most errors occur between classes 0 and 1, consistent with overlap between neutral reporting and routine complaints. High-urgency cases are typically recognized, but calibration shifts probability mass toward more conservative predictions, increasing some misses of class 2 in exchange for improved probability trustworthiness.
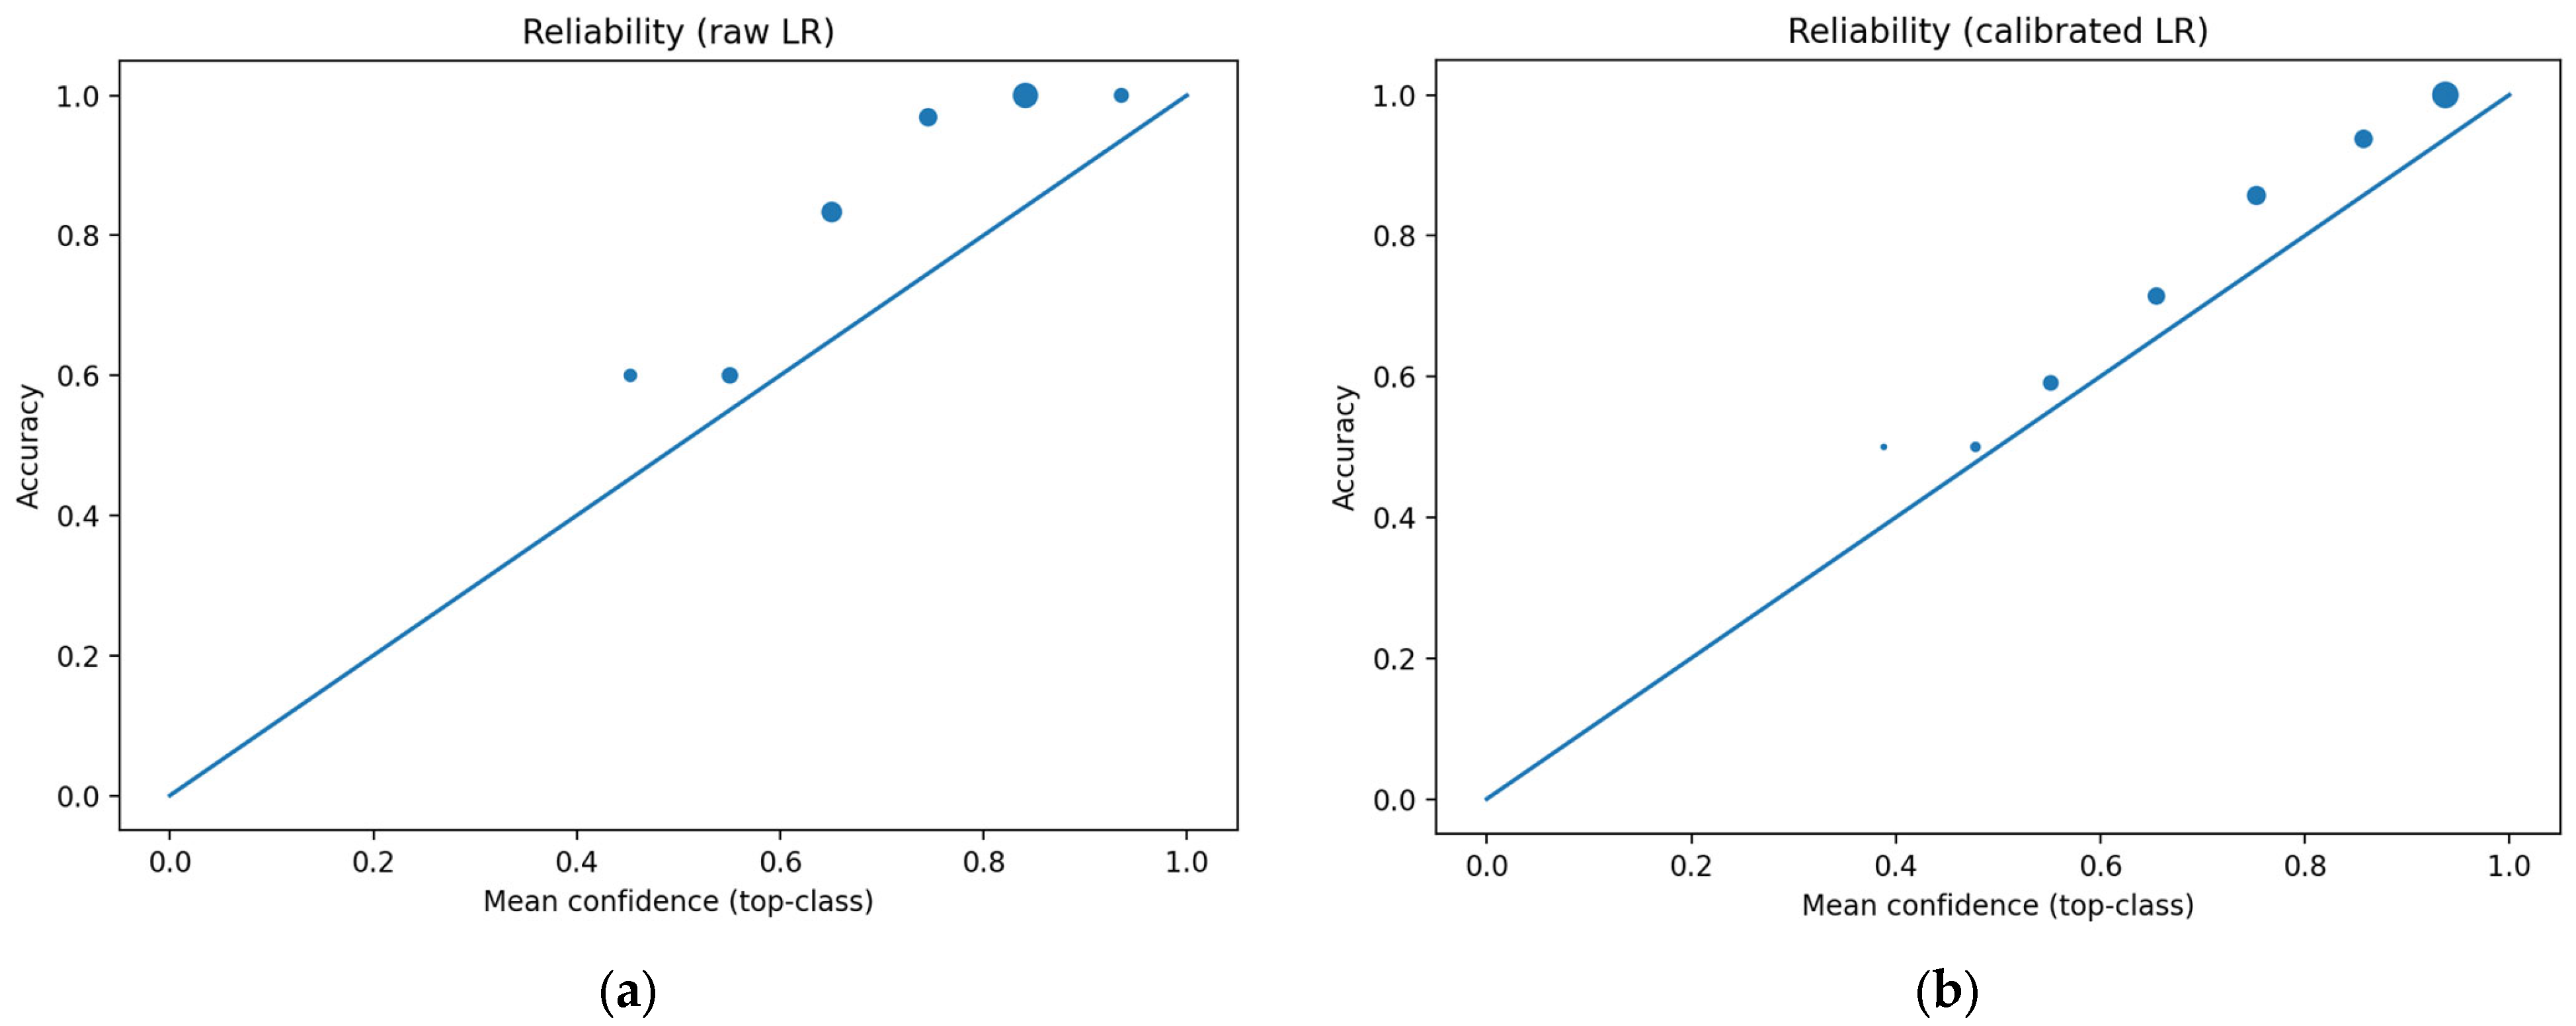
Reliability diagrams show that the calibrated model’s mean confidence aligns more closely with empirical accuracy across bins, while the raw model tends to be overconfident at higher predicted probabilities, as seen in
Figure 2. The calibrated model achieved an ECE of 0.069, supporting the use of its probabilities as decision-support scores rather than only as rankings.
Additional evaluation on the same labeled test split used ranking-oriented metrics for class 2. For the calibrated model, the top 10 reports ranked by predicted high-urgency probability contained 9 of the 10 high-urgency cases (top-10 recall = 0.900; precision at 10 = 0.900), and the top 20 contained all 10 cases. Average precision for class 2 was 0.957 for the calibrated model and 0.981 for the raw model. Bootstrap intervals on the 200-report test split indicate the uncertainty introduced by rare-class support: the calibrated accuracy was 0.855 (95% CI: 0.805–0.905), the macro-F1 was 0.826 (95% CI: 0.728–0.903), the class 2 recall was 0.700 (95% CI: 0.375–1.000), and the ECE was 0.069 (95% CI: 0.055–0.121).
Formal decision-curve analysis requires a municipal action threshold that encodes the relative cost of missed urgent cases and false alarms. No staff utility threshold, SLA threshold, or staffing-cost record was available in the public data. A workload simulation was therefore used as a reproducible open-data analogue for practical decision-support value. This is consistent with decision-curve analysis, which requires an action threshold or utility trade-off before a prediction score can be translated into net benefit [
23].
Table 6 reports the workload simulation on the gold-standard test split and compares short-list review with full manual review.
The gold-standard split is small, but it shows the intended operational use of the score. The model is used to order cases for human review, not to replace staff triage.
The simulation supports a narrow practical claim: the model can help create a compact review queue for possible high-urgency cases. It does not prove municipal workflow improvement, since no prospective user study or staff-decision comparison was available.
A five-fold comparison across alternative text baselines on the 1000 labeled reports produced mean macro-F1 values of 0.771 for TF-IDF logistic regression, 0.800 for TF-IDF linear SVM, and 0.578 for TF-IDF multinomial naive Bayes. Frozen transformer embedding baselines did not outperform the linear TF-IDF alternatives under the same label constraint: distilbert-base-multilingual-cased embeddings reached a mean macro-F1 of 0.642 and a class 2 recall of 0.460, while XLM-R embeddings reached a mean macro-F1 of 0.700 and a class 2 recall of 0.600. Each fold contained only 10 high-urgency cases. These results support the use of a linear discriminative baseline for auditability, but they do not support claims of state-of-the-art classification.
Table 7 shows that topic modeling surfaced a small number of dominant operational themes. The largest topic reflected sidewalk and road-surface hazards, with a volume of 244,568 reports, followed by templated acknowledgment or routing messages, with a volume of 144,160 reports. Across topics, mean urgency probabilities were relatively low, around 0.02 to 0.09, consistent with the rarity of high-urgency labels. Hotspot scores differentiated themes that are both frequent and spatially concentrated. Topics linked to physical hazards and obstructions, for example, sidewalk damage, bulky waste, and fallen trees, tended to show elevated hotspot scores relative to administrative or templated text. Some high hotspot values were associated with noisy tokens, for example, line-break artifacts, which shows the need for continued text hygiene in production deployment.
The supplementary topic comparison on 50,000 sampled reports produced similar UMass coherence for NMF (−3.344) and LDA (−3.355), with NMF slightly higher on this diagnostic. BERTopic on 10,000 sampled reports produced 29 non-outlier topics and assigned 30.3% of reports to the outlier cluster. Its largest themes were coherent operational categories such as bags, waste, bike paths, lighting, sidewalk holes, trees, clandestine deposits, panels, mattresses, and furniture. The comparison supports the descriptive use of topic models in this corpus, while the artifact-heavy terms and sizable BERTopic outlier share show that topic labels should remain interpretive and subject to domain review rather than being treated as stable operational categories.
The z-score-based detector did not flag events above the predefined anomaly threshold during the analysis window, indicating that fluctuations in report volume and predicted urgency remained below the chosen detection rule. This result should be read as threshold-dependent: for the evaluated period and aggregation level, the clearest operational signals are persistent hotspots and chronic issue themes rather than abrupt z-score anomalies.
Event-detection sensitivity checks show that the absence of events under the main z-threshold = 2.5 and six-week window is not invariant to parameter choices. At z-threshold = 2.5, an eight-week window flagged 151 area-metric events, and a 12-week window flagged 571. At z-threshold = 2.0 and a six-week window, 850 events were flagged. This confirms that the main result is a conservative thresholded finding rather than evidence that no temporal disruptions occurred.
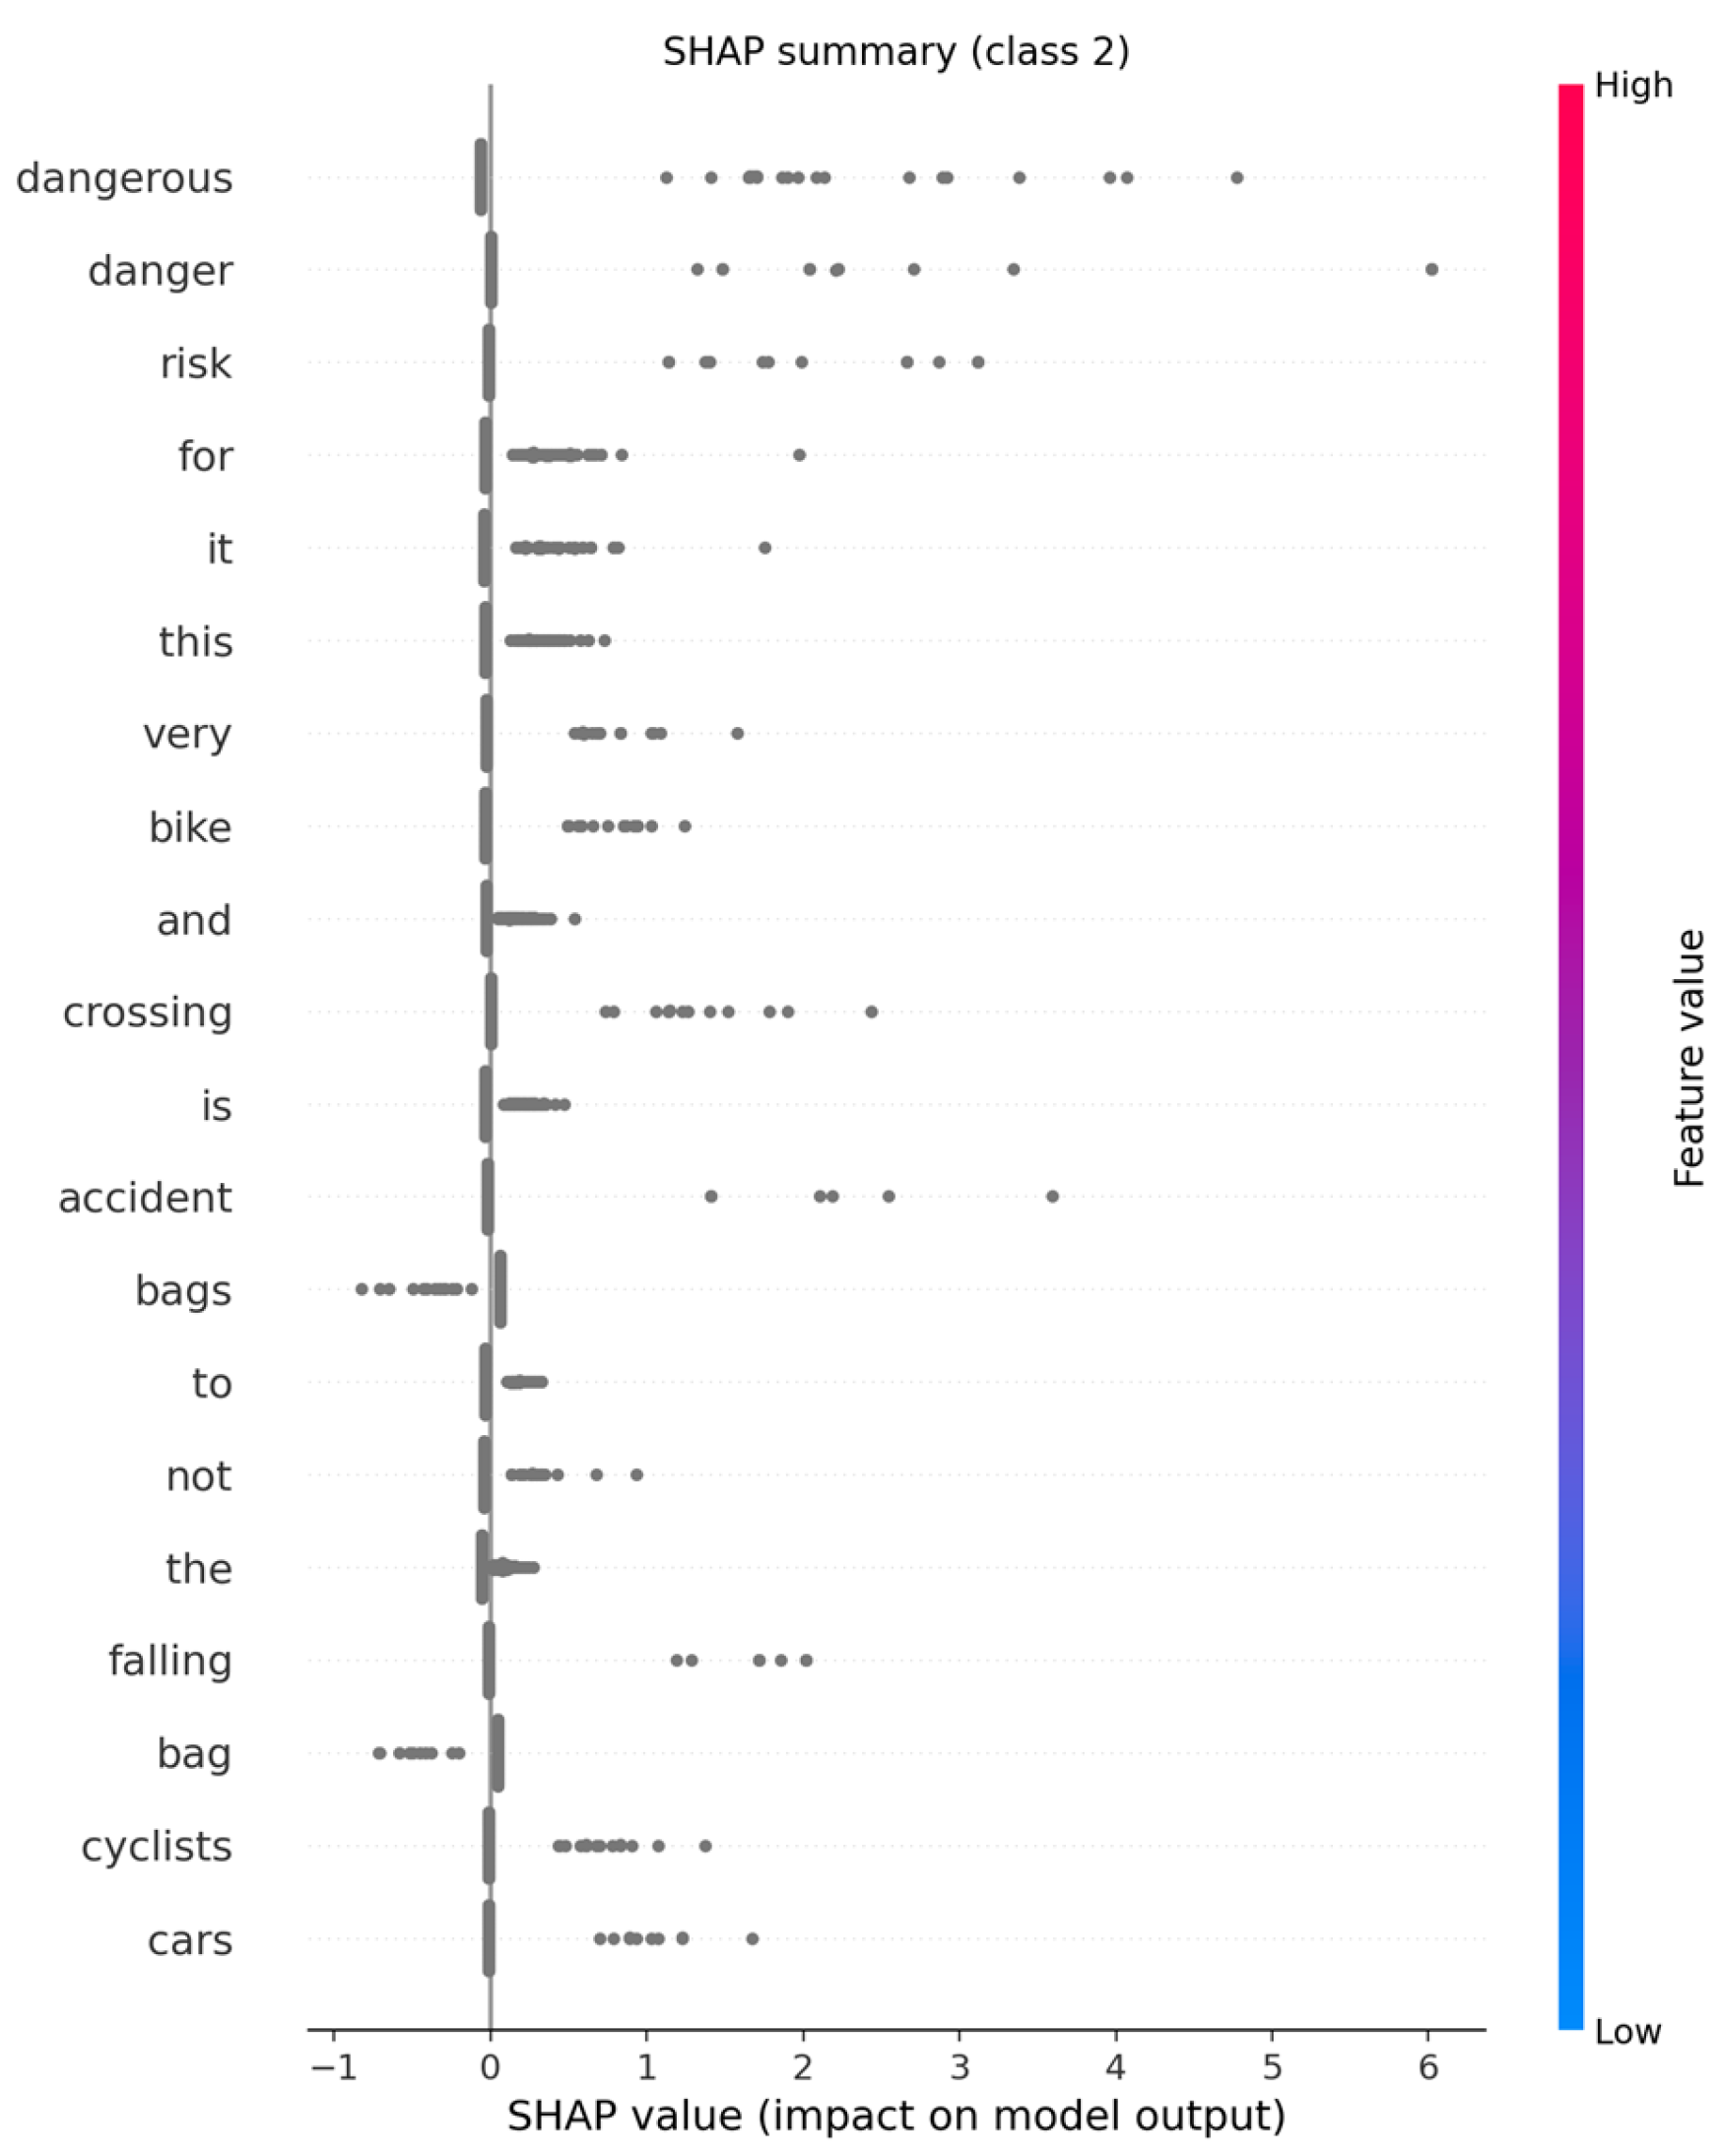
SHAP analyses for the high-urgency class emphasized terms that plausibly encode safety risks, including dangerous, danger, risk, accident, crossing, and references to vulnerable road users (e.g., cyclists and pedestrians), as seen in
Table 8. Also, for complaint-oriented reports, salient terms included abandoned, bags, clandestine, dirty, illegal, and recurrent. The resulting term lists align with expected municipal semantics and provide an audit trail that can be reviewed by domain experts (see
Figure 3).
Table 9 summarizes the supplementary robustness and comparison checks conducted with existing labeled and unlabeled open data, including alternative text baselines, transformer embeddings, ranking metrics, uncertainty estimation, topic-model comparison, event-sensitivity analysis, label validation, geographic-bias screening, and circularity checks.
These checks use existing labeled and unlabeled open data. The blind second annotation validates the existing gold file and the 200-report model-ranked high-urgency candidate set. No external dataset nor non-public municipal record is used.
The second-human annotation matched all 1000 gold-standard records. Overall agreement was 0.531. Cohen’s kappa was 0.246, and quadratic weighted kappa was 0.331. Agreement was uneven by class. The same label was assigned in 170 of 605 original class 0 reports, 322 of 345 original class 1 reports, and 39 of 50 original class 2 reports. The second annotator assigned 55 reports to class 2, close to the original 50. Many originally neutral reports moved into the routine complaint class, which indicates that the main disagreement concerned the boundary between neutral and routine complaint rather than the existence of safety-risk language.
Label reliability is therefore explicitly reported in this version. The remaining limitation is not the absence of inter-annotator agreement, but the absence of adjudicated multi-annotator labels and the small number of true high-urgency reports.
For the 200 model-ranked candidate reports, the second annotator assigned all cases to class 2, with high confidence in 195 cases and medium confidence in 5 cases. Translation issues were flagged in 12 cases, and no cases were marked unclear. Because these reports were selected by the model for high urgency, this result should be interpreted as selective rare-class enrichment rather than an unbiased estimate of model performance.
The expanded validation subset contains 1000 annotated reports. The annotator assigned 20 reports to class 0, 541 to class 1, and 439 to class 2. Confidence is high for 790 reports, medium for 197, and low for 13. Translation issues are flagged in 28 reports, and 101 reports are marked unclear. The label distribution is not a corpus prevalence estimate because two strata are intentionally enriched for urgent or borderline cases.
Table 10 reports the label distribution in the expanded validation subset and separates the random corpus stratum from the enriched strata.
The random stratum contains 42 high-urgency reports out of 500. The enriched strata add many more high-urgency examples, but they should not be read as the natural corpus distribution.
The existing calibrated model was then checked against these new human labels. On the random 500-report subset, the hard three-class predictions reached an accuracy of 0.388 and a macro-F1 of 0.382. For class 2, precision was 0.938, recall was 0.357, and average precision was 0.701. This indicates that default class decisions were conservative on new random cases, while the urgency score still ranked many safety-risk cases near the top.
Table 11 reports model performance on the expanded validation subset by stratum, avoiding a direct mixture of prevalence-oriented and enrichment-oriented evidence.
The random stratum gives the most conservative external check. It shows high class 2 precision and modest class 2 recall under hard decisions, which supports ranking-based use more than autonomous classification.
Ranking metrics give a more operational reading. In the random 500-report subset, the top 10 reports ranked by predicted urgency contained 9 class 2 reports, and the top 20 contained 18 class 2 reports. Reviewing the top 100 captured 35 of the 42 class 2 reports. This supports the use of the score for short-listing cases for human review, not as an autonomous classifier.
Table 12 reports the workload simulation for the random 500-report validation stratum and shows how many high-urgency cases are found when only the highest-ranked reports are reviewed.
This workload view is the clearest practical result from the expanded validation subset. Reviewing the top 100 cases captures most high-urgency reports in the random stratum, but the model still needs human review.
Descriptive bias screening using available postal-code fields showed material geographic variation in both model outputs and text availability. Across postal-code areas, mean predicted high-urgency probability ranged from 0.028 to 0.139, while text-presence rates ranged from 0.543 to 0.941. In the labeled subset, high-urgency shares also varied by postal code, but several areas had very small labeled counts, so these differences were treated as instability signals rather than as evidence of socioeconomic bias. Because the open dataset does not include protected characteristics, household income, population exposure, complaint access rates, or internal service standards, the analysis cannot support a substantive fairness audit.
This fairness section is empirical but bounded. Earlier Brussels FixMyStreet research found socio-demographic participation differences across districts [
24]. The current public export lacks the protected attributes, household income measures, population exposure denominators, access-rate denominators, and internal service standards needed to replicate a substantive fairness audit. The revised paper therefore reports what can be checked now: postal-code variation in predicted urgency, text availability, and labeled high-urgency shares. This limitation is consistent with 311 equity studies showing that resident-reported data can underrepresent some neighborhoods or service needs when reporting propensity differs from underlying conditions [
4,
5,
25].
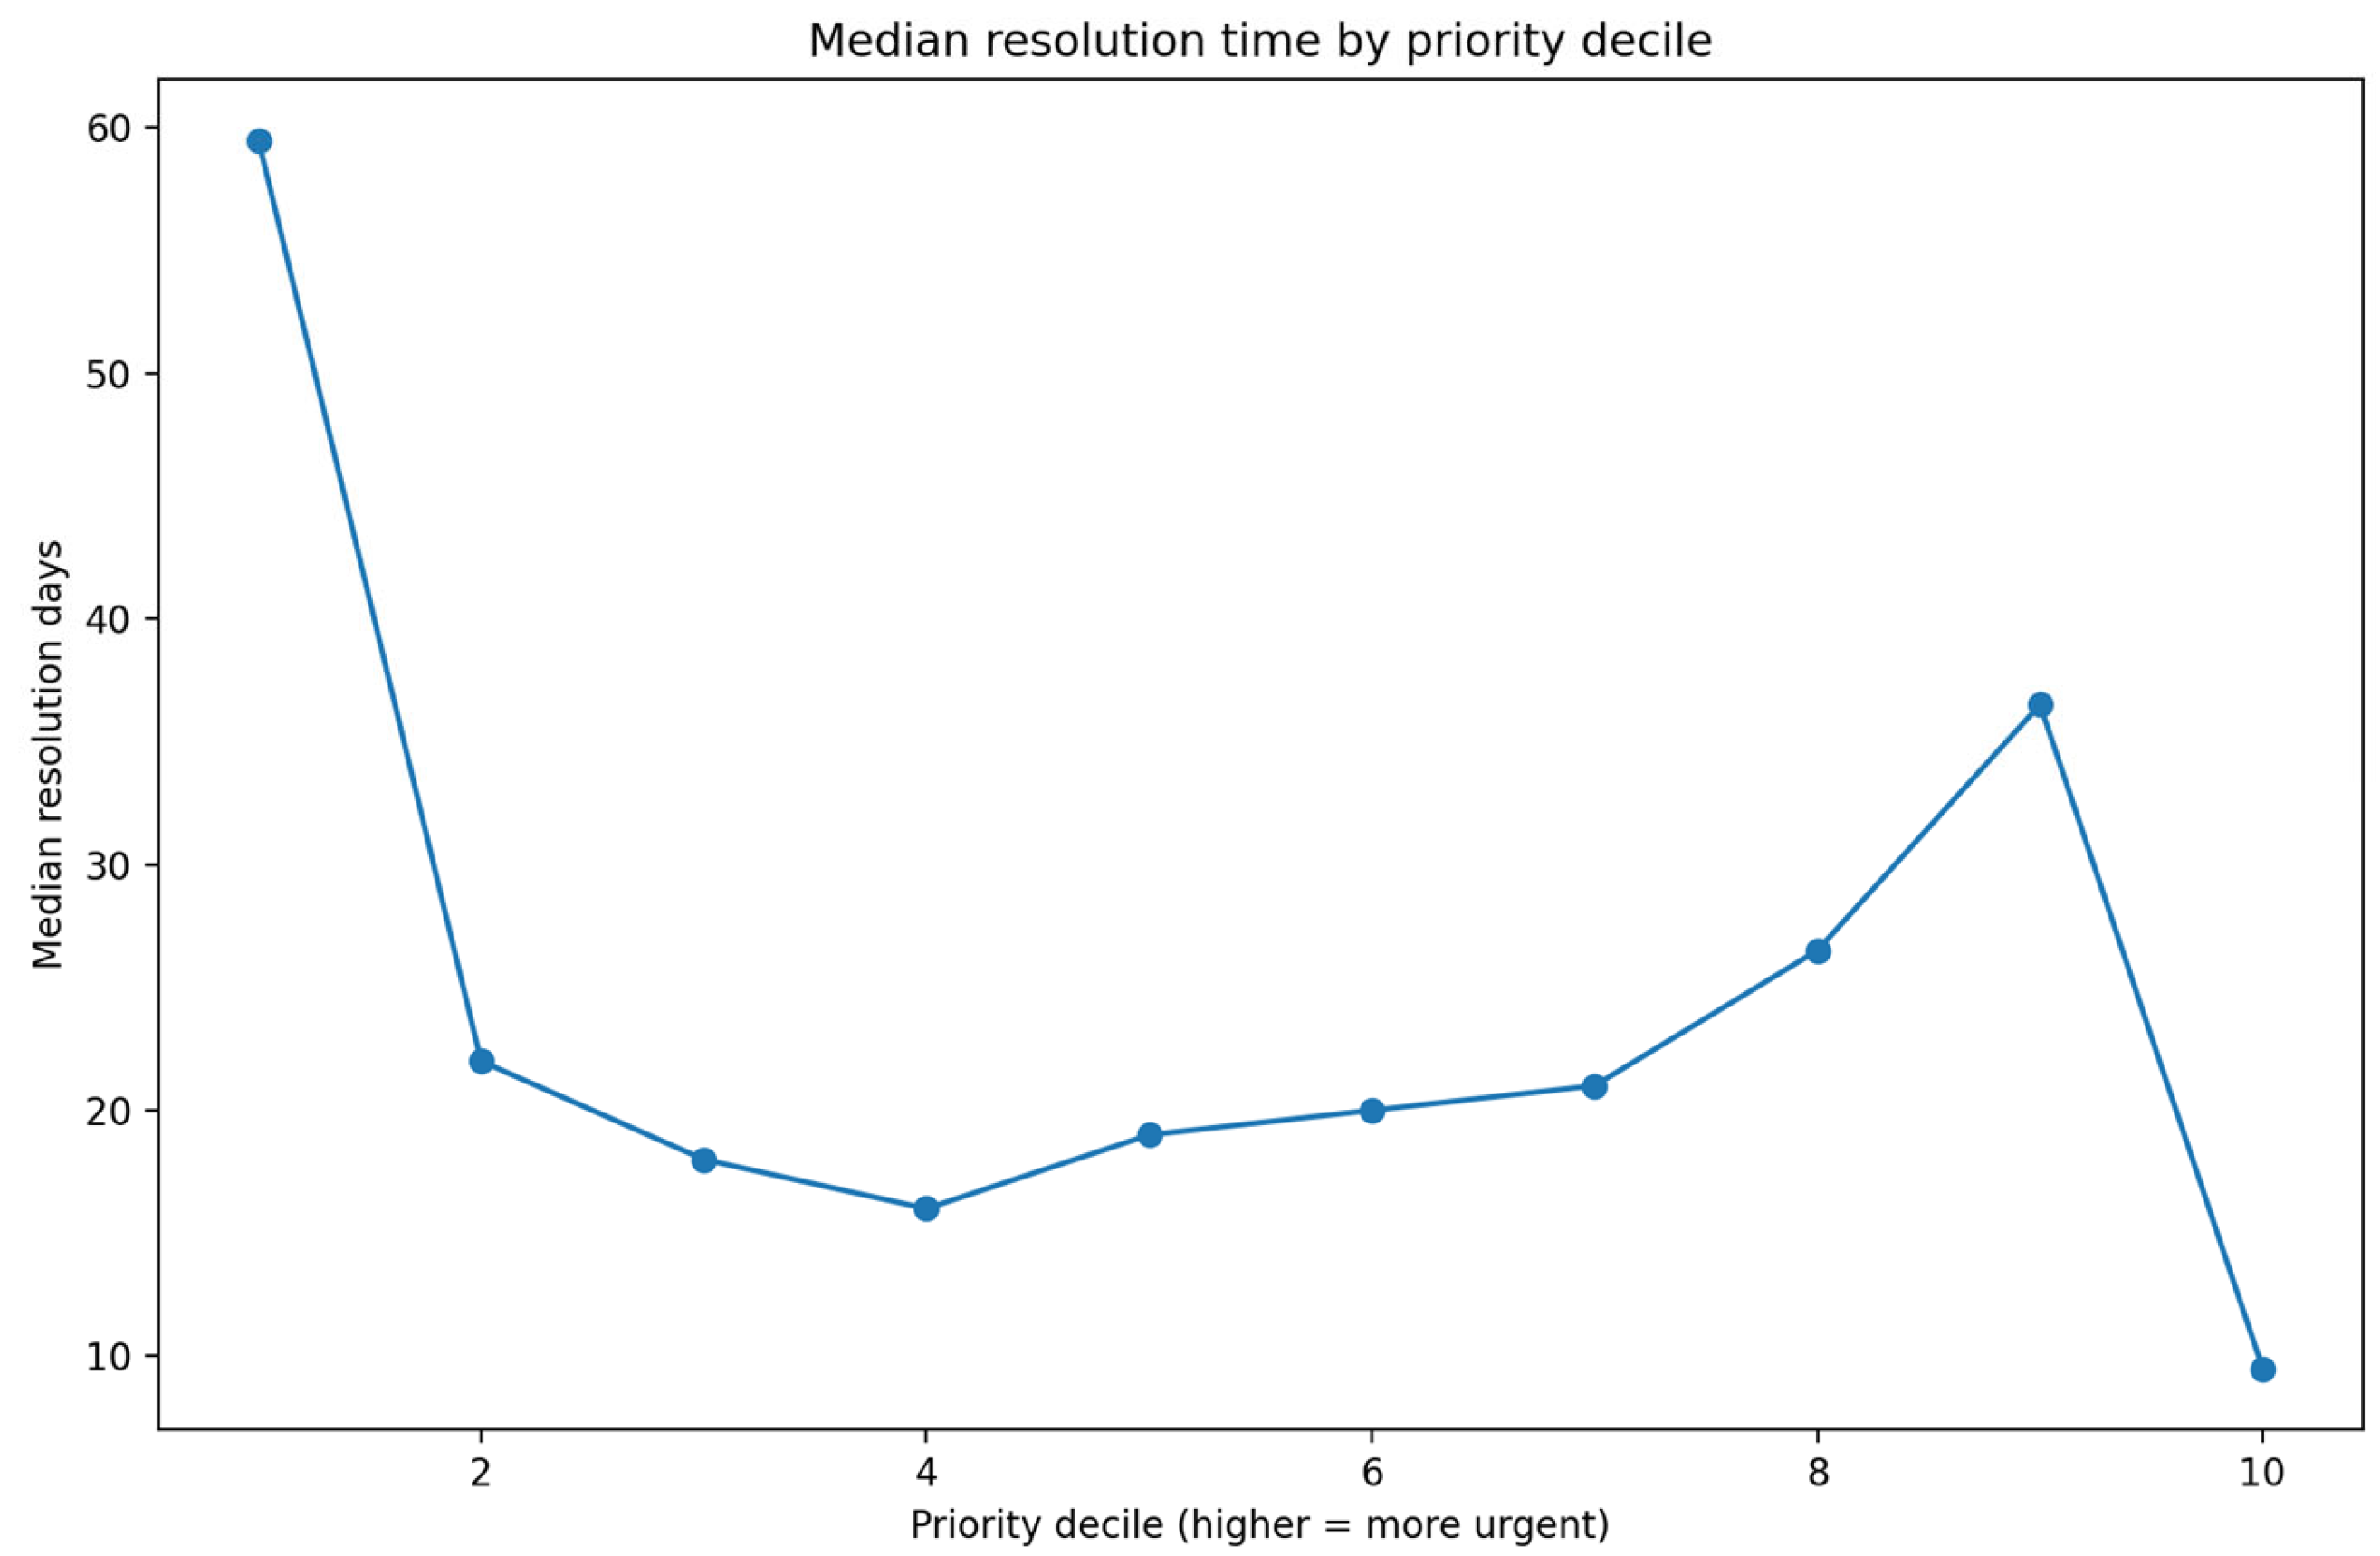
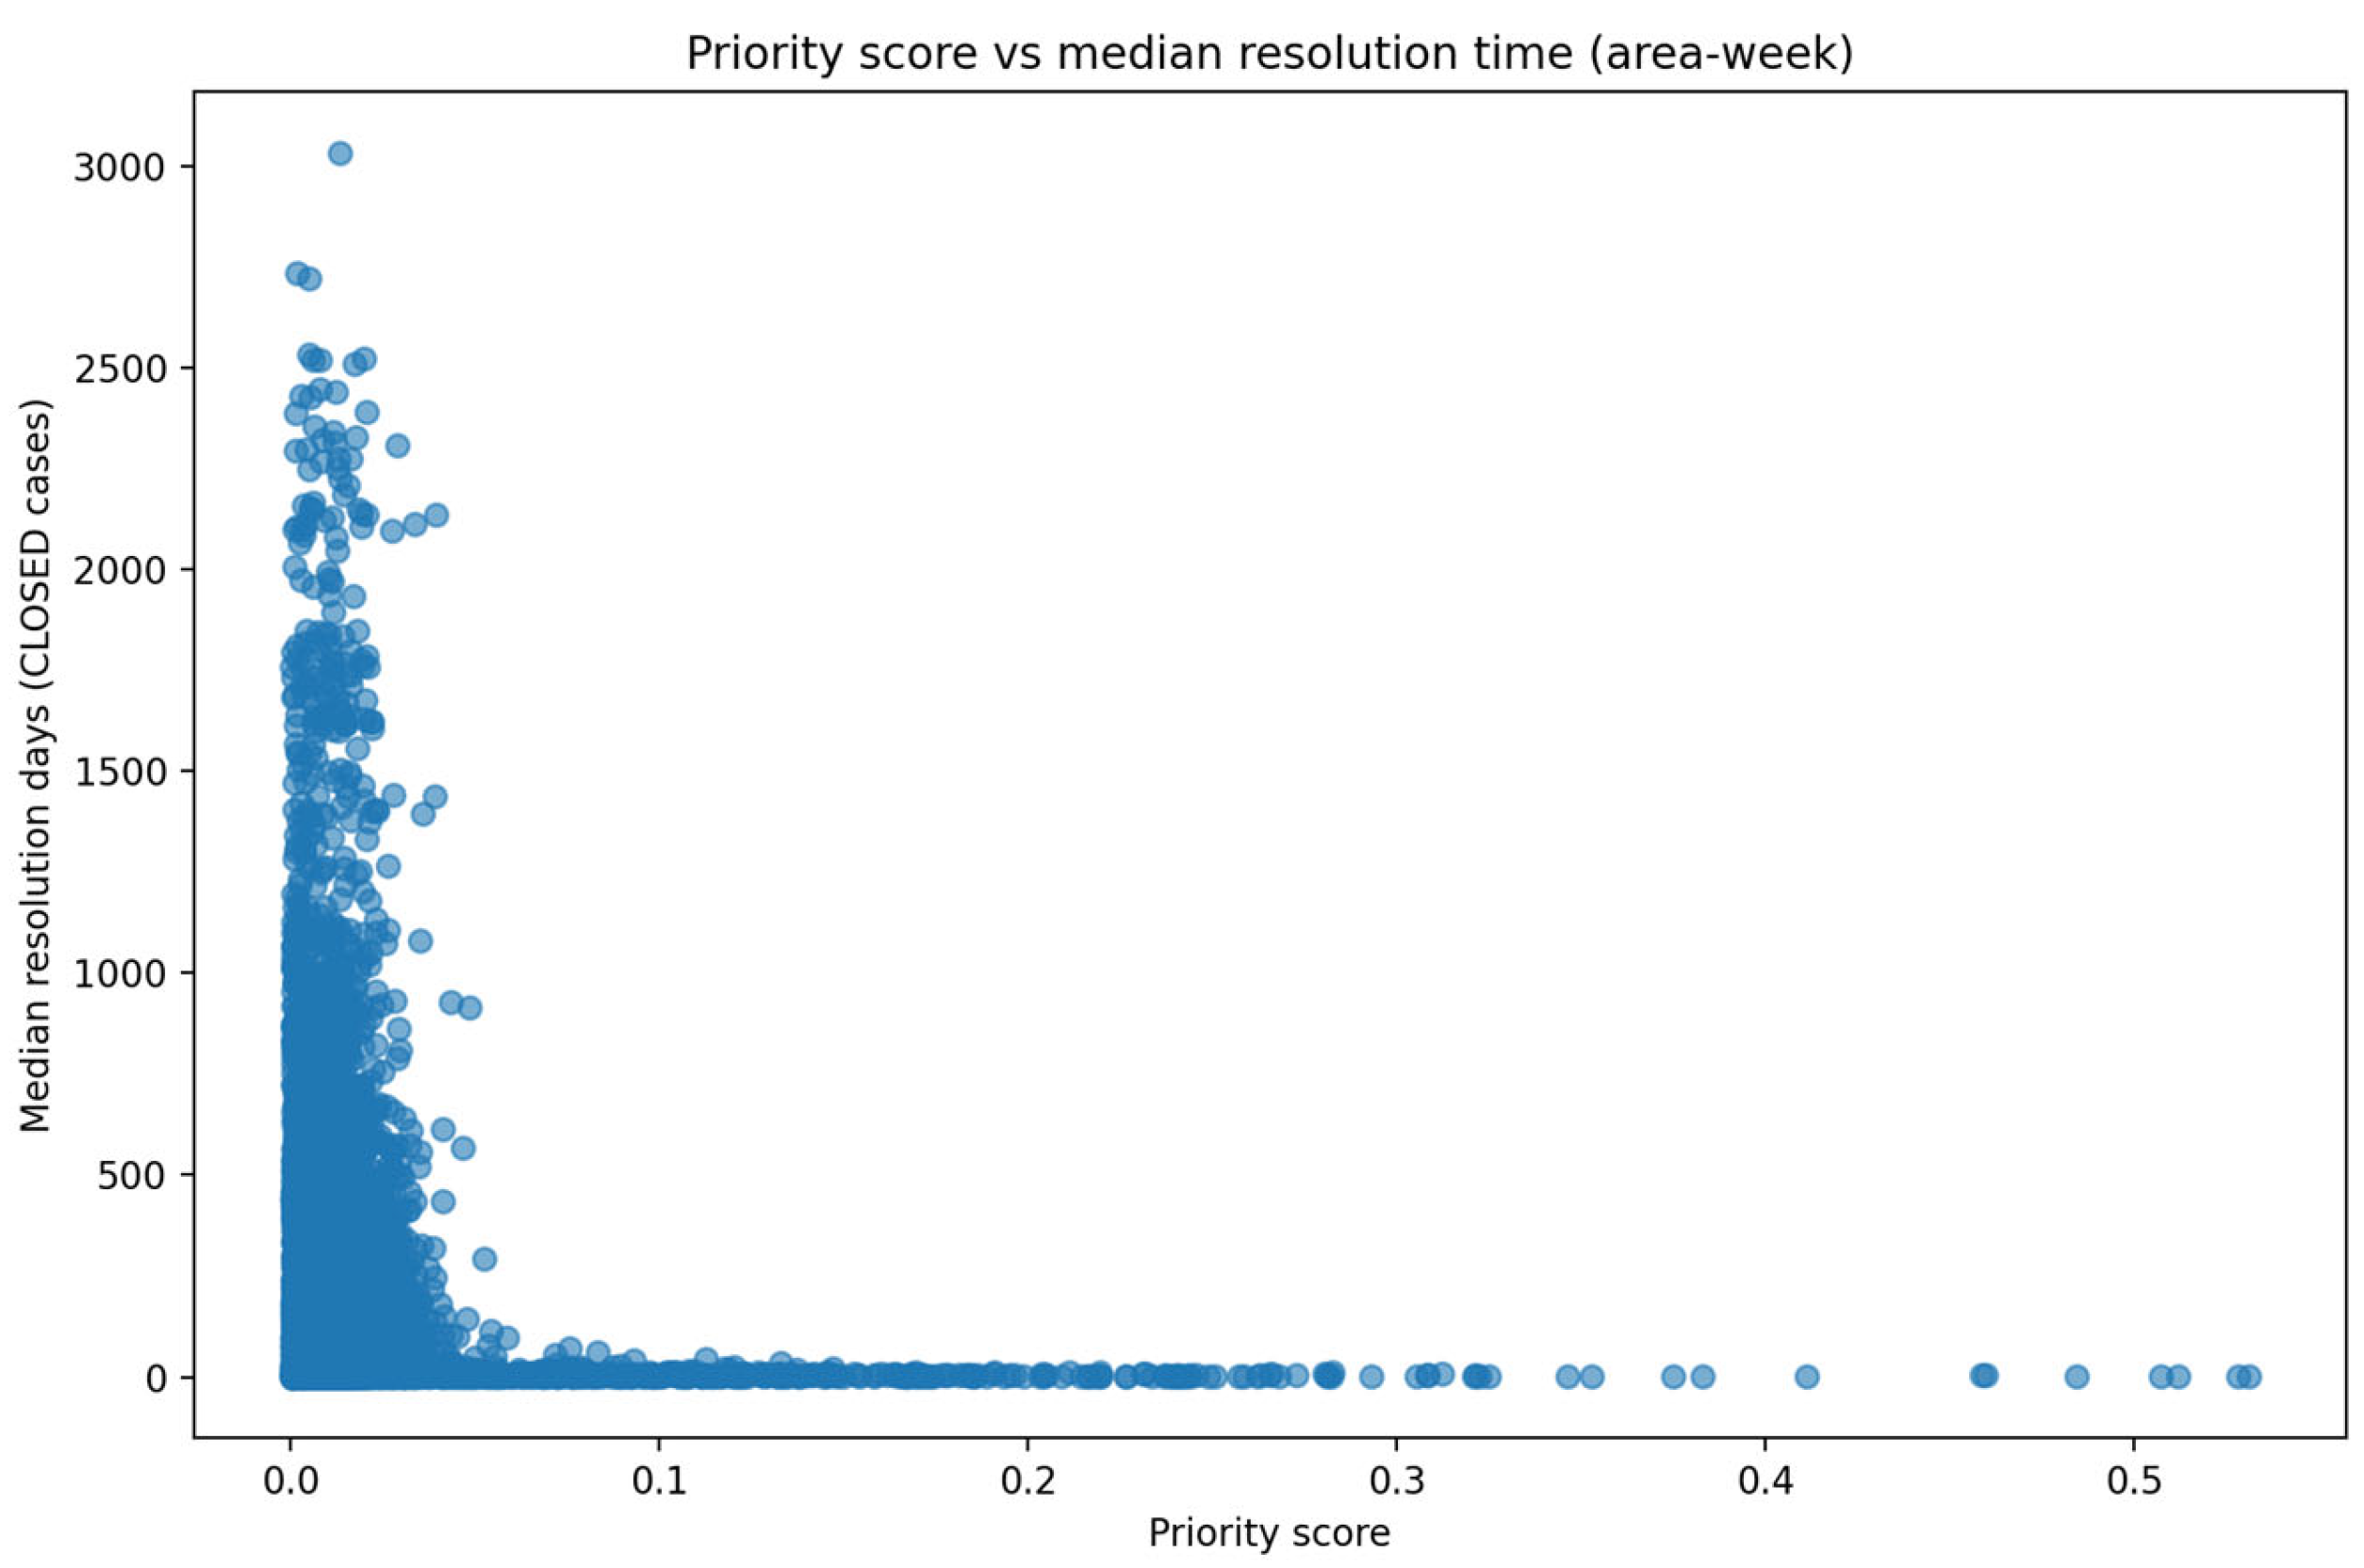
Aggregating closed cases by priority deciles revealed a non-linear relationship between predicted priority and median resolution time. The highest-priority decile showed the shortest median resolution time (approximately 9–10 days), while the lowest-priority decile exhibited the longest (approximately 59–60 days). Middle deciles clustered around 16–22 days, and the second-highest decile showed a longer median of approximately 35 days, consistent with a subset of high-salience but operationally complex cases.), consistent with a subset of high-salience but operationally complex cases. A complementary area-week scatter plot showed that very low priority scores coincide with a heavy-tailed distribution of resolution times, including extreme delays, whereas higher priority scores rarely coincide with long resolution times (see
Figure 4 and
Figure 5).
This pattern is compatible with existing triage processes, but it should be interpreted as an association rather than evidence that the model itself improves operational decisions.
The comparison with existing triage is limited to public workflow evidence. Official Brussels documentation describes FixMyStreet as a platform through which the public and authorities report incidents, monitor each step of incident resolution, and route broad issue types to actors such as Brussels Mobility, Bruxelles Proprete, and Sibelga [
26]. The present study can compare the model with visible platform fields, including category, responsible organization, status, postal code, and resolution time. It cannot compare against non-public staff decisions, dispatch rules, SLA files, or internal escalation notes.
5. Discussion
This study set out to translate high-volume, multilingual citizen reports into decision-support signals that remain auditable under municipal constraints. The results suggest that a transparent baseline can already deliver operational value when it is paired with probability calibration and explainability. This is consistent with the broader “citizens as sensors” framing of volunteered geographic information, where citizen input expands monitoring capacity but also introduces heterogeneity and bias that must be handled carefully [
1,
2]. The broader 311 literature supports this cautious stance: service requests can act as useful urban signals, but they also reflect the design of reporting channels and unequal participation patterns [
3,
4,
5,
6,
7,
25].
This study should be read as secondary analysis of publicly available civic-reporting data. This open-data scope makes the pipeline reproducible, but it also restricts what can be validated: the data do not contain annotator identities, adjudication histories, staff decisions, protected attributes, socioeconomic context, or records of how municipal officers actually used reports after submission.
Recent governance frameworks reinforce this cautious interpretation. The NIST AI Risk Management Framework emphasizes risk mapping, measurement, management, and monitoring for trustworthy AI systems, while the EU Artificial Intelligence Act places particular emphasis on fundamental-rights safeguards for high-risk AI uses [
21,
22]. The present pipeline is therefore best understood as an analytic aid for prioritization review, not as an autonomous allocation mechanism.
A central finding is the trade-off between discrimination and usable uncertainty. The raw TF–IDF + logistic regression model produced strong performance on the held-out gold split, and the confusion matrix indicates near-perfect separation for class 2 in that particular split (10/10 correct). However, the reliability analysis shows that the raw model’s confidence is not uniformly trustworthy, especially at higher predicted probabilities. In public-service settings where scores may be interpreted as risk signals (not merely ranks), miscalibration can lead to overconfident triage and brittle decision rules. Post hoc calibration improved probability–accuracy alignment (ECE = 0.069) in the expected direction [
15], but it also shifted class decisions toward more conservative predictions, reducing class 2 recall on this split (7/10). Rather than presenting this as a net “win” or “loss,” the evidence supports a more practical interpretation: calibration makes the score safer to treat as an estimated probability, while thresholding and workflow design must be tuned to municipal risk tolerance (e.g., prioritizing recall for safety hazards).
The topic and hotspot outputs support a second, complementary use case: moving from individual tickets to recurring themes and persistent spatial pressure. High-volume topics linked to sidewalks/road damage and bulky waste align with the kinds of chronic issues typically surfaced on reporting platforms. The fact that the z-score event detector did not flag shocks suggests that during the analyzed window, system dynamics were dominated by persistent patterns rather than abrupt anomalies. This is plausible for urban maintenance streams, where seasonality and backlog dominate variance and where threshold-based detectors intentionally avoid triggering on routine fluctuations. At the same time, the absence of detected events should be interpreted cautiously: aggregation choices (weekly bins and spatial units), the threshold level, and the smoothing implicit in “chronic” workflows can all reduce sensitivity to short-lived disruptions.
Explainability results provide governance-relevant face validity. SHAP attributions identified safety-related lexical cues (e.g., dangerous, risk, accident, and crossing) and complaint-oriented cues (e.g., abandoned, illegal, and dirty) as drivers of the corresponding class probabilities, which is consistent with the goal of producing reviewable “hooks” for domain experts [
17]. Importantly, explainability also highlighted text hygiene issues: template artifacts (e.g., line-break tokens) appeared in topic terms, illustrating how operational systems can inject boilerplate that contaminates downstream models. This is not merely cosmetic; it can create spurious themes and inflate volume-based signals, which matters when prioritization is tied to hotspot scoring.
The resolution-time analysis suggests an association between predicted priority and operational throughput: high-priority deciles had shorter median resolution times, while low-priority deciles exhibited longer and more variable delays. This pattern is compatible with a functioning triage pipeline, but it should not be interpreted causally. Resolution time is affected by confounding factors such as task complexity, departmental capacity, and administrative routing, and text-derived priority could correlate with these latent variables rather than drive outcomes. The area-week scatter also indicates a heavy-tailed delay regime at low predicted priority, which may reflect backlog accumulation or hard-to-resolve categories rather than systematic neglect. From a decision-support perspective, the main takeaway is that priority scores can be used to structure queues and surface risk pockets, but they should be embedded in a policy-aware workflow (e.g., SLA rules and periodic review of low-priority backlogs) rather than used as an automated dispatcher.
Several limitations bound the conclusions and indicate clear next steps. The labeled evidence base is larger than the original gold standard, but it remains bounded. This study uses the original 1000-report gold standard, a 200-report model-ranked high-urgency candidate review, and a 1000-report expanded validation subset. The expanded validation subset contains 439 class 2 labels, including 42 class 2 reports in a random 500-report subset. This directly reduces the small-labeled-dataset concern, but it does not remove uncertainty. The enriched validation strata are not prevalence-representative, and all expanded labels come from one second annotator rather than from adjudicated multi-annotator review. The random subset also shows weaker three-class generalization than the original split, with macro-F1 of 0.382 and class 2 recall of 0.357 under hard model decisions. The stronger result is ranking-oriented: the top 100 random-subset reports captured 35 of 42 class 2 cases. The current results should therefore be read as stronger evidence for human-review short-listing than for autonomous triage.
Second, English normalization is a pragmatic choice for multilingual modeling, but translation and normalization can erase nuance (especially for short texts) and can introduce systematic artifacts. Comparative work on multilingual text categorization shows that translation-based pipelines and multilingual BERT-family models can differ materially in performance and transfer behavior [
27]. In the supplementary benchmark, frozen XLM-R embeddings did not outperform the TF-IDF linear baselines on the current 1000-label gold standard. This result should not be interpreted as a general rejection of multilingual transformers, since full fine-tuning and larger rare-class support may change the comparison; it does show that transformer representations alone do not remove the present evaluation limitations.
The multilingual claim is also bounded by the preprocessing design. The model does not demonstrate native multilingual understanding; it uses English-normalized text derived from multilingual reports. The transformer embedding comparison and translation-related discussion show that multilingual representation choices matter, but they do not establish translation fidelity or cross-language equivalence. Stronger multilingual claims would require language-specific labels, source-language performance estimates, or independent assessment of translation quality, none of which were available in the public export. The second annotator flagged translation issues in 6 of the 1000 gold-standard records and 12 of the 200 additional candidate records, which reinforces the decision to treat multilingual validity as a limitation rather than as a settled result. Broader NLP evidence also cautions against treating multilingual systems as language-agnostic without language-specific evaluation, since resource asymmetries and translation quality can vary across languages [
28,
29].
Accordingly, this paper no longer makes a multilingual model-validity claim. The remaining claim is only that the pipeline analyzes English-normalized text derived from originally multilingual reports, with translation issues flagged as a limitation.
A further governance limitation concerns bias. Descriptive checks using existing fields show substantial variation in report volume, text presence, and predicted urgency across postal-code areas, but these patterns cannot be interpreted as socioeconomic bias without external covariates. The current data also do not support a full language-bias audit beyond translation-issue flags and text-source fields. These gaps matter because civic-reporting platforms reflect participation, access, administrative routing, and neighborhood visibility as much as underlying service need. The descriptive bias screen should be interpreted conservatively. Postal-code variation in text availability and predicted urgency may reflect unequal participation, different service needs, reporting habits, local infrastructure, or administrative routing. Without demographic covariates, exposure denominators, and internal service standards, the analysis can identify where bias may enter the pipeline, but it cannot estimate group fairness or disparate impact. Prior work on Boston, New York City, Brussels, and Kansas City shows that reporting volume can reflect access, propensity to complain, neighborhood resources, and resident-government interaction, not only objective service need [
4,
5,
24,
25].
Third, the hotspot score and event detector were designed for transparency, but they are not substitutes for formal spatial cluster inference. In particular, volume–urgency aggregation can confound reporting intensity with underlying incidence (e.g., participation biases across neighborhoods), a known concern in volunteered geographic information [
2]. Careful deployment would therefore combine these signals with municipal context (e.g., population, footfall proxies, and inspection cycles) and would treat hotspots as triage leads, not ground truth.
Also, platform processes themselves shape the data. FixMyStreet-style systems include administrative routing, status transitions, and templated responses that affect both text and outcomes [
30,
31]. Model monitoring should explicitly track changes in templates, category taxonomies, and departmental procedures because these can cause silent distribution shifts.
A final limitation concerns circularity between administrative labels, model targets, and operational outcomes. If the manually assigned labels were influenced by categories, status transitions, or priority concepts already embedded in the platform, the classifier may partly reproduce existing administrative logic rather than discover an independent notion of civic risk. The resolution-time association has the same limitation: faster closure for high-priority cases may reflect pre-existing triage practice, task simplicity, departmental capacity, or routing rules. Without direct access to municipal workflow records or a prospective comparison against staff decisions, the model should be interpreted as an auditable prioritization aid and diagnostic baseline, not as evidence of improved operational decision making. A proxy test directly compares text-only and metadata-only classifiers on the same 1000 labeled reports using five-fold stratified cross-validation. The text-only TF-IDF model reaches a macro-F1 = 0.764 and a class 2 recall = 0.720, while the metadata-only model using available category, department, status, postal-code, reporter, translation-issue, text-length, picture, and resolution fields reaches a macro-F1 = 0.579 and a class 2 recall = 0.620. A narrower category/department-only model reaches macro-F1 = 0.497. These results do not eliminate circularity risk, but they indicate that available administrative metadata alone do not reproduce text model performance.
The same human annotation protocol covers the 200 model-ranked high-urgency candidates drawn from unlabeled open-data reports. The annotator labels all 200 cases as class 2, with 195 high-confidence and 5 medium-confidence judgments. Translation issues are flagged in 12 records, and no cases are marked unclear. Because the queue is model-selected, this result should be interpreted as selective rare-class validation and as a reproducible route for extending rare-class annotation, not as an unbiased estimate of corpus-level performance.