Article

The Co-Evolution and Spatial Spillover Effects of the Relationship Between the Industry Chain and Innovation Chain of China’s Photovoltaic Cell: From the Patent Intelligence Perspective


1
School of Management, Hebei GEO University, Shijiazhuang 052161, China
2
Strategy and Management Base of Mineral Resources in Hebei Province, Hebei GEO University, Shijiazhuang 052161, China
*
Author to whom correspondence should be addressed.
Systems 2026, 14(6), 605; https://doi.org/10.3390/systems14060605
Submission received: 20 April 2026 / Revised: 16 May 2026 / Accepted: 19 May 2026 / Published: 25 May 2026
(This article belongs to the Special Issue Technological Innovation Systems and Energy Transitions)

Abstract

Under the dual-carbon goals and energy transition backdrop, the photovoltaic cell has become a crucial pillar for optimizing China’s energy structure and promoting green development. From the perspective of patent intelligence, this study systematically investigates the spatiotemporal evolution paths, coupling characteristics, and driving mechanisms of China’s photovoltaic cell industry and innovation chains, using nationwide photovoltaic cell enterprise and patent data from 2005 to 2024 and integrating spatial gravity center modeling, location quotient analysis, and spatial Durbin models. The findings reveal the following: (1) the spatiotemporal evolution of the dual chains exhibits distinct phases, with a notable developmental leap after 2015. The industry chain shows a pattern of “westward shift and eastern optimization,” while the innovation chain evolves from eastern dominance toward a nationally coordinated, multipolar network. (2) At the macro level, the dual chains demonstrate a coupling trend characterized by “coordinated gravity center migration and spatial distance convergence,” yet significant spatial heterogeneity and mismatch persist at the city scale. (3) Industrial agglomeration has an inverted U-shaped effect on innovation, with regional heterogeneity in its impact, driven synergistically by multidimensional factors such as economic foundation, the innovation environment, and openness. Based on these insights, this study proposes recommendations for optimizing the spatial layout of these dual chains, strengthening multifactor synergy, and implementing regionally differentiated policies, aiming to provide decision-making references for achieving sustainable and high-quality development in the photovoltaic cell.

1. Introduction

1.1. Research Background

Driven by the dual goals of achieving peak carbon emissions and realizing carbon neutrality, along with the green transformation of energy, the photovoltaic cell industry, as a core sector in the field of new energy, has become a key pillar for optimizing China’s energy structure and achieving sustainable development. After more than two decades of development, China’s photovoltaic industry has established a complete industrial chain covering “raw materials–cell manufacturing–end-user applications” [1]. However, owing to the rapid expansion of the industry, structural issues such as an uncoordinated regional division of labor and inefficient synergy between the industrial and innovation chains have become increasingly prominent. Therefore, systematically analyzing the spatiotemporal evolution paths of these two chains and their innovation-driven factors holds significant theoretical and practical importance for promoting the high-quality development of the photovoltaic industry.

1.2. Literature Review

The literature relevant to this study mainly focuses on the following aspects.
The first aspect concerns research on the photovoltaic (PV) industry itself. As a core component of the new energy sector, the development path, technological evolution, and regional distribution of the PV industry have received widespread attention. From the perspective of sustainable development strategies, some studies have systematically reviewed the technical approaches, corporate dynamics, and environmental impacts of crystalline silicon solar cell recycling [2]. With the expansion of the industry, the imbalance in regional development capacity has become increasingly prominent; accordingly, some scholars have constructed a multidimensional assessment framework to reveal the regional disparities in China’s PV development capability [3]. At the technological level, relevant studies have examined the key components and development trends of PV-integrated energy storage technologies, emphasizing the importance of technological synergy in improving system efficiency [4]. Furthermore, the environmental sustainability of the downstream PV industry chain has gradually become a research hotspot, with some scholars conducting in-depth discussions on the necessity and feasibility of PV waste recovery in China [5]. At the city level, existing research has attempted to formulate PV deployment roadmaps, thereby providing methodological support for refined planning [6]. The above studies have laid a foundation for understanding the multidimensional structure of the PV industry; however, most of them focus on a single dimension and lack a systematic examination of the synergistic evolution between the industrial chain and the innovation chain.
The second aspect involves the theoretical construction of the industrial chain and the innovation chain. The development of the industrial chain and the innovation chain has become an important topic in industrial economics and innovation research. From the perspective of collaborative division of labor in the industrial chain, some scholars have revealed the energy-saving effect of deepening division of labor, providing empirical support for understanding the organizational efficiency of industrial chains [7]. Regarding the innovation chain, relevant research has constructed an evaluation framework for urban innovation chain capacity from the perspective of efficiency improvement [8]. Other scholars have explored the supporting mechanism of the synergy between the industrial chain and the innovation chain for achieving carbon neutrality from a green finance perspective, thereby expanding the research boundaries of dual-chain integration [9]. With the proposal of the Industry 5.0 framework, research has begun to examine dual-chain integration through the lenses of resilience, sustainability, and human-centricity [10], and has proposed a roadmap for transitioning from digital manufacturing to a digital society [11].
The third aspect addresses the micro-mechanisms of dual-chain integration. Studies have indicated that technological-development-oriented supply chain innovation can achieve chain benefits through the mediating roles of transparency and embeddedness [12], while knowledge dynamics serve as a key pathway for promoting green innovation [13]. In addition, analyses of the drivers and barriers of circular economy practices among small and medium-sized enterprises in emerging economies have further enriched the theoretical foundation of dual-chain integration [14]. Simultaneously, scholars have also focused on the spatiotemporal characteristics and coupling coordination relationship between industrial green water efficiency and technological innovation [15]. Although these studies provide important insights into the dual-chain relationship at the theoretical and mechanistic levels, detailed analyses specifically targeting high-tech industries such as the PV cell industry remain insufficient.
The fourth aspect concerns spatial analysis methods and policy drivers. In recent years, scholars have begun to pay attention to the spatial coupling relationship between the industrial chain and the innovation chain. At the level of spatial analysis, relevant studies have explored the spatial dynamics and policy mechanisms of low-carbon city construction [16] and analyzed the coupling effect of carbon emission trading and tradable green certificates under electricity marketization [17]. Spatial econometric methods have gradually become important tools for analyzing the spatial pattern of industry and innovation. For example, the spatial Durbin model has been applied to estimate bicycle sharing trip activity [18] and spatiotemporal differences in energy intensity [19]. Moreover, spatial autocorrelation analysis methods such as the improved Moran’s I index have been increasingly used in the study of multidimensional spatial attributes [20]. In terms of empirical applications, relevant research has revealed the socioeconomic and spatial factors influencing distributed PV generation [21] and validated the spatial spillover effects of green technology innovation on ecological sustainability [22]. From a global perspective, the geographical distribution characteristics of knowledge flows in renewable energy innovation systems have also been thoroughly examined [23]. Finally, empirical studies on the drivers of urban green development [24] have further confirmed the applicability of spatial econometric methods in the field of sustainable development.

1.3. Research Gap and Goals

In summary, although existing research has made significant progress, the following shortcomings remain. First, the current literature lacks a systematic quantitative measurement of the photovoltaic cell industry chain and innovation chain; in particular, effective methodological support for the quantitative characterization of the interaction between the two chains is lacking. Second, research on the spatial coupling of the two chains has focused mostly on the macroregional level, with insufficient fine-grained analysis of spatial heterogeneity and matching patterns at the urban scale. Third, with respect to the identification of innovation-driving factors, existing studies rely primarily on traditional econometric models and fail to fully account for the spatial spillover effects and nonlinear characteristics of key factors such as industrial agglomeration, limiting a deeper understanding of the dual-chain synergy mechanism. Fourth, while research on dimensions such as policy, the external environment, and multi-energy synergy has begun to emerge, it remains scattered across different industrial sectors and has yet to form an integrated analytical framework tailored to the photovoltaic cell industry.
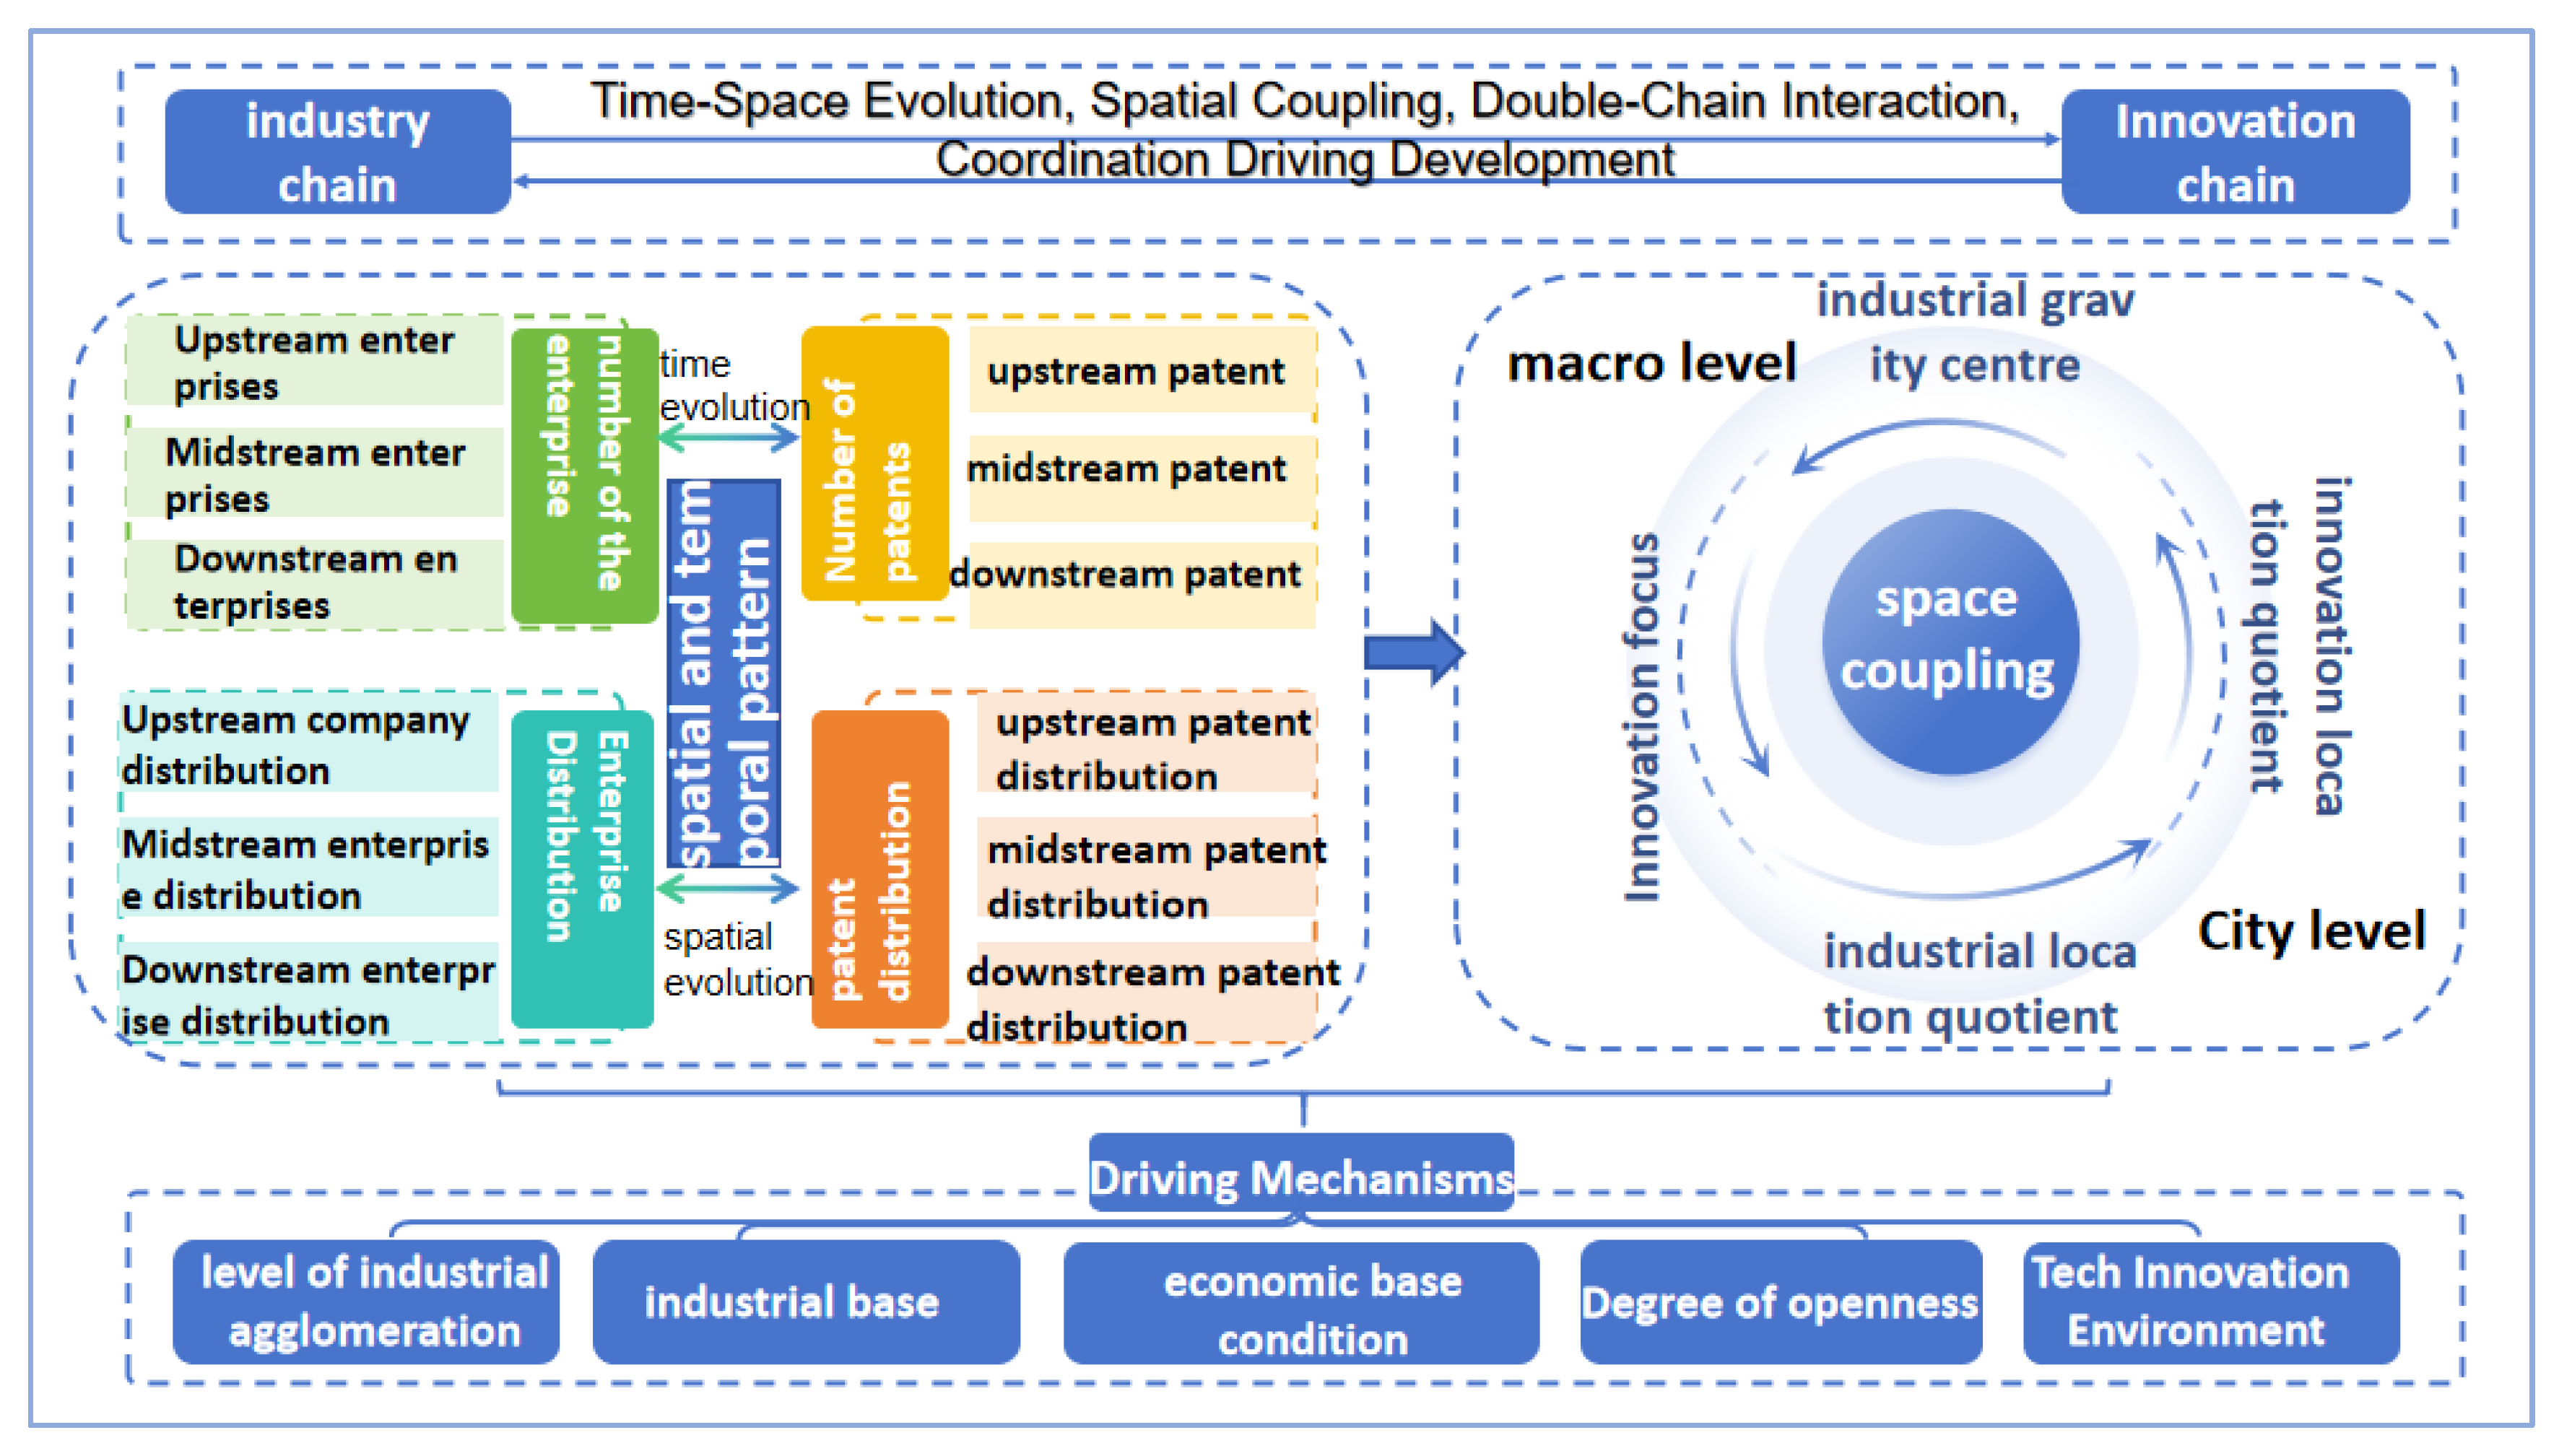
As illustrated in Figure 1, in light of the above factors, this paper first divides the industrial chain and innovation chain into segments based on the economic and technological characteristics of the photovoltaic cell industry, thereby establishing the logical foundation for the interaction between the two chains. Second, this work systematically characterizes the evolutionary paths and distribution patterns of the industrial chain and innovation chain from the perspectives of temporal evolution and spatial distribution. Third, this study introduces the spatial gravity center model and location quotient analysis to quantitatively reveal the spatial coupling characteristics of the two chains at both the macro and urban scales. Finally, by constructing a spatial Durbin model, this work verifies the driving mechanisms and spatial spillover effects of multidimensional factors such as industrial agglomeration, economic base, and innovation environment on innovation development.
To clarify the research framework, this study addresses the following three core research questions: (1) What are the spatiotemporal evolution patterns of China’s photovoltaic cell industry chain and innovation chain during 2005–2024? (2) How do the industry chain and innovation chain spatially couple and match at the city levels? (3) What driving factors and spatial spillover effects influence the innovation development of the photovoltaic cell industry?

2. Materials and Methods

2.1. Data Sources

The dataset utilized in this study is composed of the following three distinct components:
(1) Firm-level data. Firm-level data were obtained from the Qichacha business database (https://www.qcc.com, accessed on 15 October 2025). The initial sample was constructed through keyword search and conditional filtering, followed by manual cleaning and verification based on business scopes, ultimately yielding a valid sample of enterprises. As of 31 December 2024, a total of 41,995 valid enterprises were identified, comprising 7543 upstream, 4298 midstream, and 30,154 downstream firms. Specific steps are as follows: ① An advanced search was conducted using keywords grouped by industrial chain segments: upstream (“photovoltaic silicon wafer”, “cadmium telluride”, “thin film deposition”, “crystalline silicon”, “photovoltaic cell manufacturing”), midstream (“photovoltaic cell”, “perovskite cell”, “BC cell”, “TOPCon cell”, “PERC cell”), and downstream (“photovoltaic module assembly”, “photovoltaic heating”, “photovoltaic cell transportation”, “photovoltaic power station”), all using fuzzy matching. ② The search was restricted to enterprises of all sizes (large, medium, small, micro), established between 1 January 2005 and 31 December 2024, with registration status “normal”, “existing” or “in operation”, and legal forms “limited liability companies” or “joint stock companies”. ③ Exported fields included: enterprise name, province, city, district/county, enterprise size, business scope, establishment date, registration status, legal representative, registered address, valid mobile number, additional phone numbers, enterprise type, enterprise introduction, organization code, correspondence address, and postal code. ④ After export, two rounds of manual verification and cleaning were performed based on the enterprises’ registered business scopes to exclude non-photovoltaic cell related firms and remove duplicate records, ensuring that the final sample accurately reflects the distribution of market entities across the upstream, midstream, and downstream segments of the photovoltaic industry chain.
(2) Patent data. Patent data were mainly sourced from the PatSnap patent database (https://www.zhihuiya.com, accessed on 19 October 2025). The search strategy was developed in accordance with the “New Three Items” Related Technology Patent Classification System (2024) issued by the China National Intellectual Property Administration, combining International Patent Classification (IPC) codes with thematic keywords. After preliminary retrieval, patents were further classified and filtered based on patent abstracts. As of 31 December 2024, a total of 77,802 relevant patents were identified, including 42,614 upstream technology patents, 15,846 midstream patents, and 19,342 downstream patents. Specific steps are as follows: ① An advanced search was conducted using keywords for each industrial chain segment: upstream (“photovoltaic silicon wafer”, “photovoltaic silver paste”, “photovoltaic encapsulant film”, “gallium arsenide photovoltaic cell”, “cadmium telluride photovoltaic cell”, “TCO glass”, “coating machine”, “etching machine”, “thin film deposition equipment”, “modified Siemens method”, “silane fluidized bed method”, “polycrystalline silicon photovoltaic cell”, “monocrystalline silicon photovoltaic cell”, “crystal pulling”, “photovoltaic cell cleaning”, “photovoltaic cell slicing”, “perovskite photovoltaic cell”), midstream (“PERC cell”, “TOPCon cell”, “HJT cell”, “HIT cell”, “BC cell”, “IBC cell”, “perovskite cell”, “barium strontium titanate solar cell”, “single-crystal perovskite cell”, “polycrystalline perovskite cell”, “amorphous perovskite cell”, “photoelectric conversion efficiency”), and downstream (“crystalline silicon photovoltaic module”, “thin film photovoltaic module”, “conventional module”, “multi-busbar module”, “busbar-free module”, “busbar-free cell”, “photovoltaic power generation”, “sliced module”, “slicing mechanism”, “shingled module”, “shingled module connection”, “adjacent photovoltaic”, “back-contact module”, “back-contact cell”). ② The publication/public announcement date was limited to 1 January 2005 to 31 December 2024. ③ IPC exclusion criteria: Only patents whose main IPC codes belong to H01L, H01M, H02S, C23C, C30B, B05C, B05D and other directly photovoltaic-related fields were retained. Patents with main IPC codes in A, D, E, F, G (except G01, G02, G03, G06), as well as B02, B03, B07, B21–B27, B29 (except B29D, B29C), B30–B32 (except B32B), B41–B67 and other irrelevant classes were excluded. Moreover, within class H01, only subclasses L, M, G, S were retained. ④ Two rounds of manual verification were conducted on the retrieved patents based on patent titles, abstracts, and IPC codes to remove clearly irrelevant or duplicate patents. Based on the analysis of patent abstracts, patents were further assigned to upstream, midstream, or downstream technology segments, ensuring that the final sample accurately reflects the technological landscape across the photovoltaic industry chain.
(3) Panel data. Panel data were derived from the China City Statistical Yearbook and various provincial and municipal statistical yearbooks. To maintain data consistency and reliability, the sample was restricted to 285 cities at the prefecture level and above, excluding autonomous prefectures, leagues, and the Hong Kong, Macao, and Taiwan regions due to data availability constraints. Missing values in the panel were addressed using a multi-stage progressive imputation strategy. This combination of four methods was chosen to leverage their complementary strengths. The justification is twofold. First, city–year panel data simultaneously exhibit individual effects and time effects, which a single imputation method cannot adequately handle; group mean imputation and temporal interpolation exploit cross-sectional and time-series information, respectively, complementing each other. Second, as it is impossible to ascertain whether the missing data are missing completely at random (MCAR) or not missing at random (MNAR), adopting multiple methods with a progressive logic reduces the risk of model misspecification. The detailed procedure is as follows. First, group mean imputation was used based on province–year strata to exploit geographic and temporal proximity. Second, linear interpolation was applied to each city’s time series, assuming smooth annual trends in economic indicators. Third, regression imputation was performed using complete predictors (e.g., innovation output, industrial agglomeration) to capture variable co-variation. Fourth, nearest-neighbor imputation filled remaining gaps using means from cities in the same province and year to address spatial heterogeneity. Finally, any residual missing values were replaced with the global mean to ensure data completeness.

2.2. Research Methods

2.2.1. Spatial Gravity Center Model

To describe the center of gravity and coordination between the photovoltaic cell industrial chain and innovation chain at the macro scale, this paper introduces the spatial gravity center model [25]. The spatial gravity center model is a classic method in economic geography to track the spatial distribution and evolution of regional attributes. According to the theoretical framework of Grether and Mathys [26]. Unlike simple map overlays, this model computes the industrial center (weighted by enterprise counts) and the innovation center (weighted by patents), providing an objective measure of their migration trajectories and mutual relationship.
(1) This model takes cities as the basic research units and employs a weighted average method to calculate the annual gravity center coordinates of the number of photovoltaic cell enterprises and patents. The formula is as follows:
x E = i = 1 n e i   x i i = 1 n e i , y E = i = 1 n e i   y i i = 1 n e i
x P = i = 1 n p i   x i i = 1 n p i , y P = i = 1 n p i   y i i = 1 n p i
In the formula, ( x E , y E )   a n d   ( x P , y P ) represent the longitude and latitude of the geographical coordinates of the gravity center of the photovoltaic industry and the innovation gravity center, respectively, and e i   a n d   p i denote the number of photovoltaic cell enterprises and patents in city i , respectively. x i   a n d   y i are the longitude and latitude of city i , respectively, and n is the total number of cities.
(2) From the annual gravity centers, we construct two analytical metrics to move beyond purely visual interpretation:
① Spatial distance between the two centers defined as   S   = x E - x P 2   +   y E - y P 2 . A decreasing distance over time provides formal evidence that the industrial and innovation chains are converging spatially.
② Directional consistency index C calculated by Equation (3). This index measures whether the migration directions of the two centers align in a given year. Values close to 1 indicate strongly coordinated movement, while negative values indicate opposing shifts.
The calculation using this model proceeds as follows: first, the spatial distance between the gravity centers of the industry and innovation chains for each year is computed. A smaller spatial distance indicates stronger spatial coupling between them. Second, the consistency of their movement is assessed by calculating angle θ between the migration directions of the two gravity centers in adjacent years. The consistency of movement is measured by the cosine of this angle, denoted as C   . The   closer   C is to 1, the more consistent their migration directions are and the stronger the coupling is. The calculation formulas are as follows:
C = c o s θ = Δ x E Δ x P + Δ y E Δ y P Δ x E 2 + Δ y E 2 Δ x P 2 + Δ y P 2
In the formula, Δ x E   a n d   Δ y E represent the changes in the longitude and latitude of the industrial gravity center from the previous year, respectively, and Δ x P   a n d   Δ y P represent the changes in the longitude and latitude of the innovation gravity center from the previous year, respectively.

2.2.2. Location Quotient

To observe the coupling between the industrial chain and the innovation chain at the urban scale, this paper introduces the location quotient index [27]. The location quotient (LQ) is a common measure of the spatial concentration and specialization of industries. Following the seminal research on locational analysis by Haggett (1962) [28]. By calculating the relative proportion at the city level compared with the national level, the degree of specialized agglomeration in industrial or innovation activities can be measured [29]. The location quotient measures a city’s relative specialization in photovoltaic industrial or innovation activities compared with the national average, thereby providing a standardized, comparable metric across cities of different sizes. The calculation formula is as follows:
LQE m = ( e mn / e m ) / ( E n / E )
L Q I m = ( i m n / i m ) / ( I n / I )
In the formula, m denotes the city, and n denotes the photovoltaic cell industry; e m n and i m n represent the number of enterprises and the number of granted patents in the photovoltaic cell in city m , respectively; e m and i m represent the total number of enterprises and the total number of granted patents in city m , respectively; and E n and I n represent the total number of enterprises and the total number of patents in the photovoltaic cell at the national level, respectively. E and I represent the total number of all enterprises and the total number of all patents at the national level, respectively.
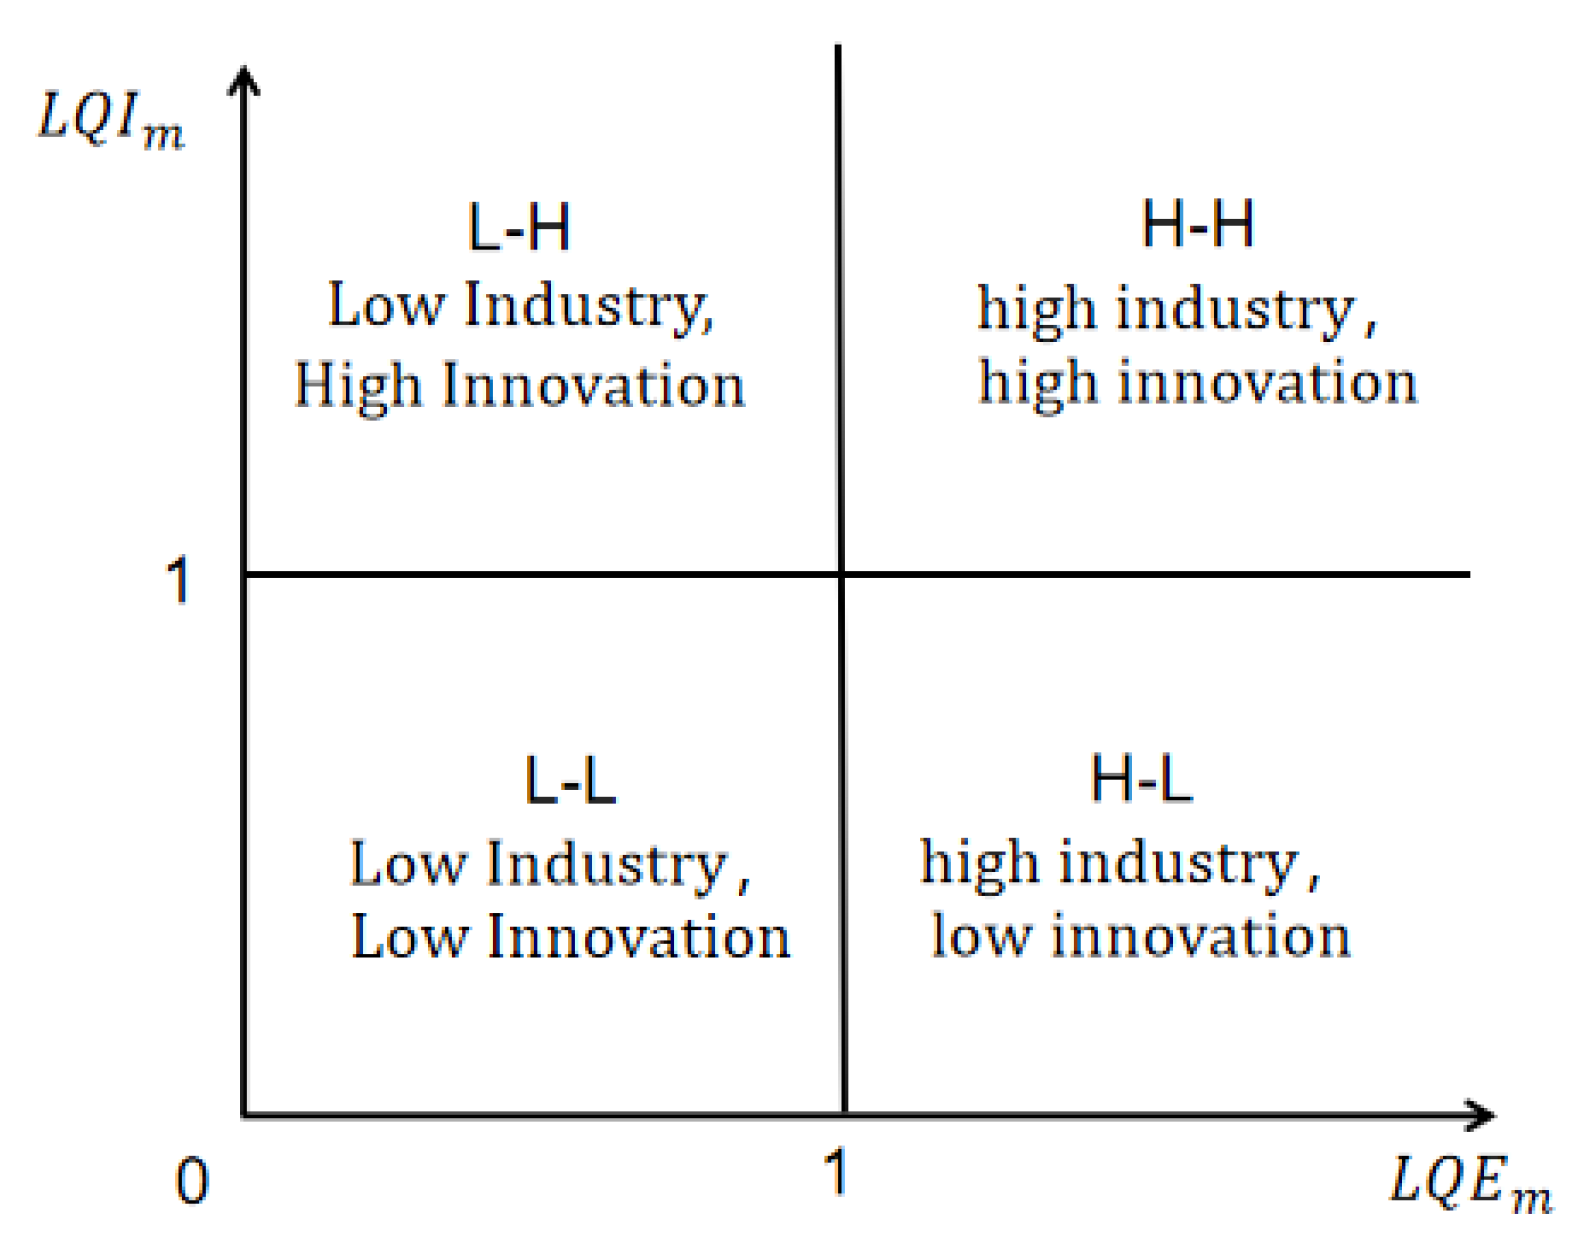
Following the standard practice, a city has a specialized agglomeration in a chain if its location quotient exceeds 1. Based on the comparative relationship between the industrial location quotient ( L Q E m ) and the innovation location quotient ( L Q I m ) relative to the benchmark value of 1.
① H-H (High-High): L Q E m > 1 and L Q I m > 1 , both chains are agglomerated, indicating effective synergy.
② H-L (High-Low): L Q E m > 1 but L Q I m 1 , industrial agglomeration without matching innovation (potential technology deficit).
③ L-H (Low-High): L Q E m 1 but L Q I m > 1 , innovation strength without industrial scale.
④ L-L (Low-Low): L Q E m 1 and L Q I m 1 , both chains are underdeveloped.

2.2.3. Spatial Econometric Model

Given the spatial interdependence between the development of the photovoltaic cell industry and innovation activities, traditional regression models cannot effectively capture the neighboring effects and economic interactions among cities [30]. To investigate the resulting spatial effects, this paper introduces a spatial econometric model to systematically analyze the driving mechanisms of regional innovation development, including the spatial lag model (SAR), spatial error model (SEM), and spatial Durbin model (SDM). As emphasized by LeSage and Pace in their definitive work on modern spatial econometrics, the SDM is superior in capturing both internal and external spatial interaction effects, providing more robust estimates than simpler spatial models [31]. The specific model specifications are as follows:
S A R :   y t = ρ W y t + β X t + ε
SEM :   y t = β X t + μ   ,   μ = λ W μ + ε
SDM :   y t = ρ W y t + β X t + θ W X t + ε
In the formula, y t represents the level of innovation development in the photovoltaic cell sector for city i . W is the spatial weight matrix, X t is the set of explanatory variables, β denotes the estimated coefficients of the explanatory variables, ε   a n d   μ are random error terms, ρ is the spatial lag coefficient of the dependent variable y t , λ is the spatial error coefficient, and θ represents the estimated coefficient of the spatial lag term of the explanatory variables.
To systematically select the most appropriate spatial econometric specification among the spatial lag model (SAR), spatial error model (SEM), and spatial Durbin model (SDM), a stepwise diagnostic procedure was conducted. First, the Lagrange multiplier (LM) tests for spatial lag and spatial error, along with their robust forms, were employed to detect the presence and type of spatial dependence in the residuals. Second, the Hausman test was implemented to determine whether a fixed-effects or random-effects specification was more suitable for the panel data. Third, after confirming the existence of spatial dependence and selecting the fixed-effects framework, the likelihood ratio (LR) tests and Wald tests were further applied to examine whether the SDM could be simplified to either the SAR or the SEM; that is, to test the hypotheses H 0 : θ = 0 (for simplification to SAR) and H 0 : θ + ρ β = 0 (for simplification to SEM). This combined testing strategy ensures the robustness and appropriateness of the final model choice for analyzing the spatial spillover effects in this study.

2.2.4. Construction and Row Standardization of Spatial Weight Matrices

To capture spatial spillover effects of photovoltaic cell innovation, this study constructs four spatial weight matrices. The economic distance matrix serves as the primary specification for the two-way fixed-effects spatial Durbin model. This approach is consistent with the logic of Quah, who argued that economic similarity is a key driver of spatial correlation and spillover effects beyond mere physical distance [32]. Let ( G D P ¯ i ) denote the average per capital GDP of city i over the sample period. For any two distinct cities   i and j   ( i j ) , the raw economic distance weight is defined as
w i j e c o n = 1 G D P ¯ i G D P ¯ j , w i i e c o n = 0
If the absolute difference equals zero, the weight is set to zero.
For robustness, we employ three alternative matrices. All are constructed based on the sequential ID numbers of cities following the Official Administrative Division Codes of China (GB/T 2260) [33], which reflect hierarchical geographic and administrative proximity. This coding system is structured by six major geographic macro-regions and provincial administrative boundaries. Cities with adjacent sequence IDs are generally located in the same or neighboring geographical regions, thus providing a reasonable proxy for macrospatial proximity.
Specifically, we consider a Sequence Contiguity Matrix where cities that are adjacent in the sequence ( | i j | = 1 ) receive a weight of one and all other pairs zero; an Inverse Square Sequence-Distance Matrix where the weight between any two distinct cities is ( 1 / ( i j ) 2 ); and a Sequence-Based 5-Nearest Neighbor Matrix where each city is connected to its five closest neighbors in the sequence (i.e., the five cities with the smallest ( | i j | ) ) , with symmetric weights assigned.
All four matrices are row-standardized so that each row sums to one. For a given matrix W , the standardized weight is
w i j s t d = w i j j = 1 N w i j
With the convention that if the row sum is zero, the row remains zero. Row standardization ensures comparability of coefficient estimates across different matrix specifications and mitigates the influence of cities with varying numbers of neighbors.

2.3. Industrial Chain Division

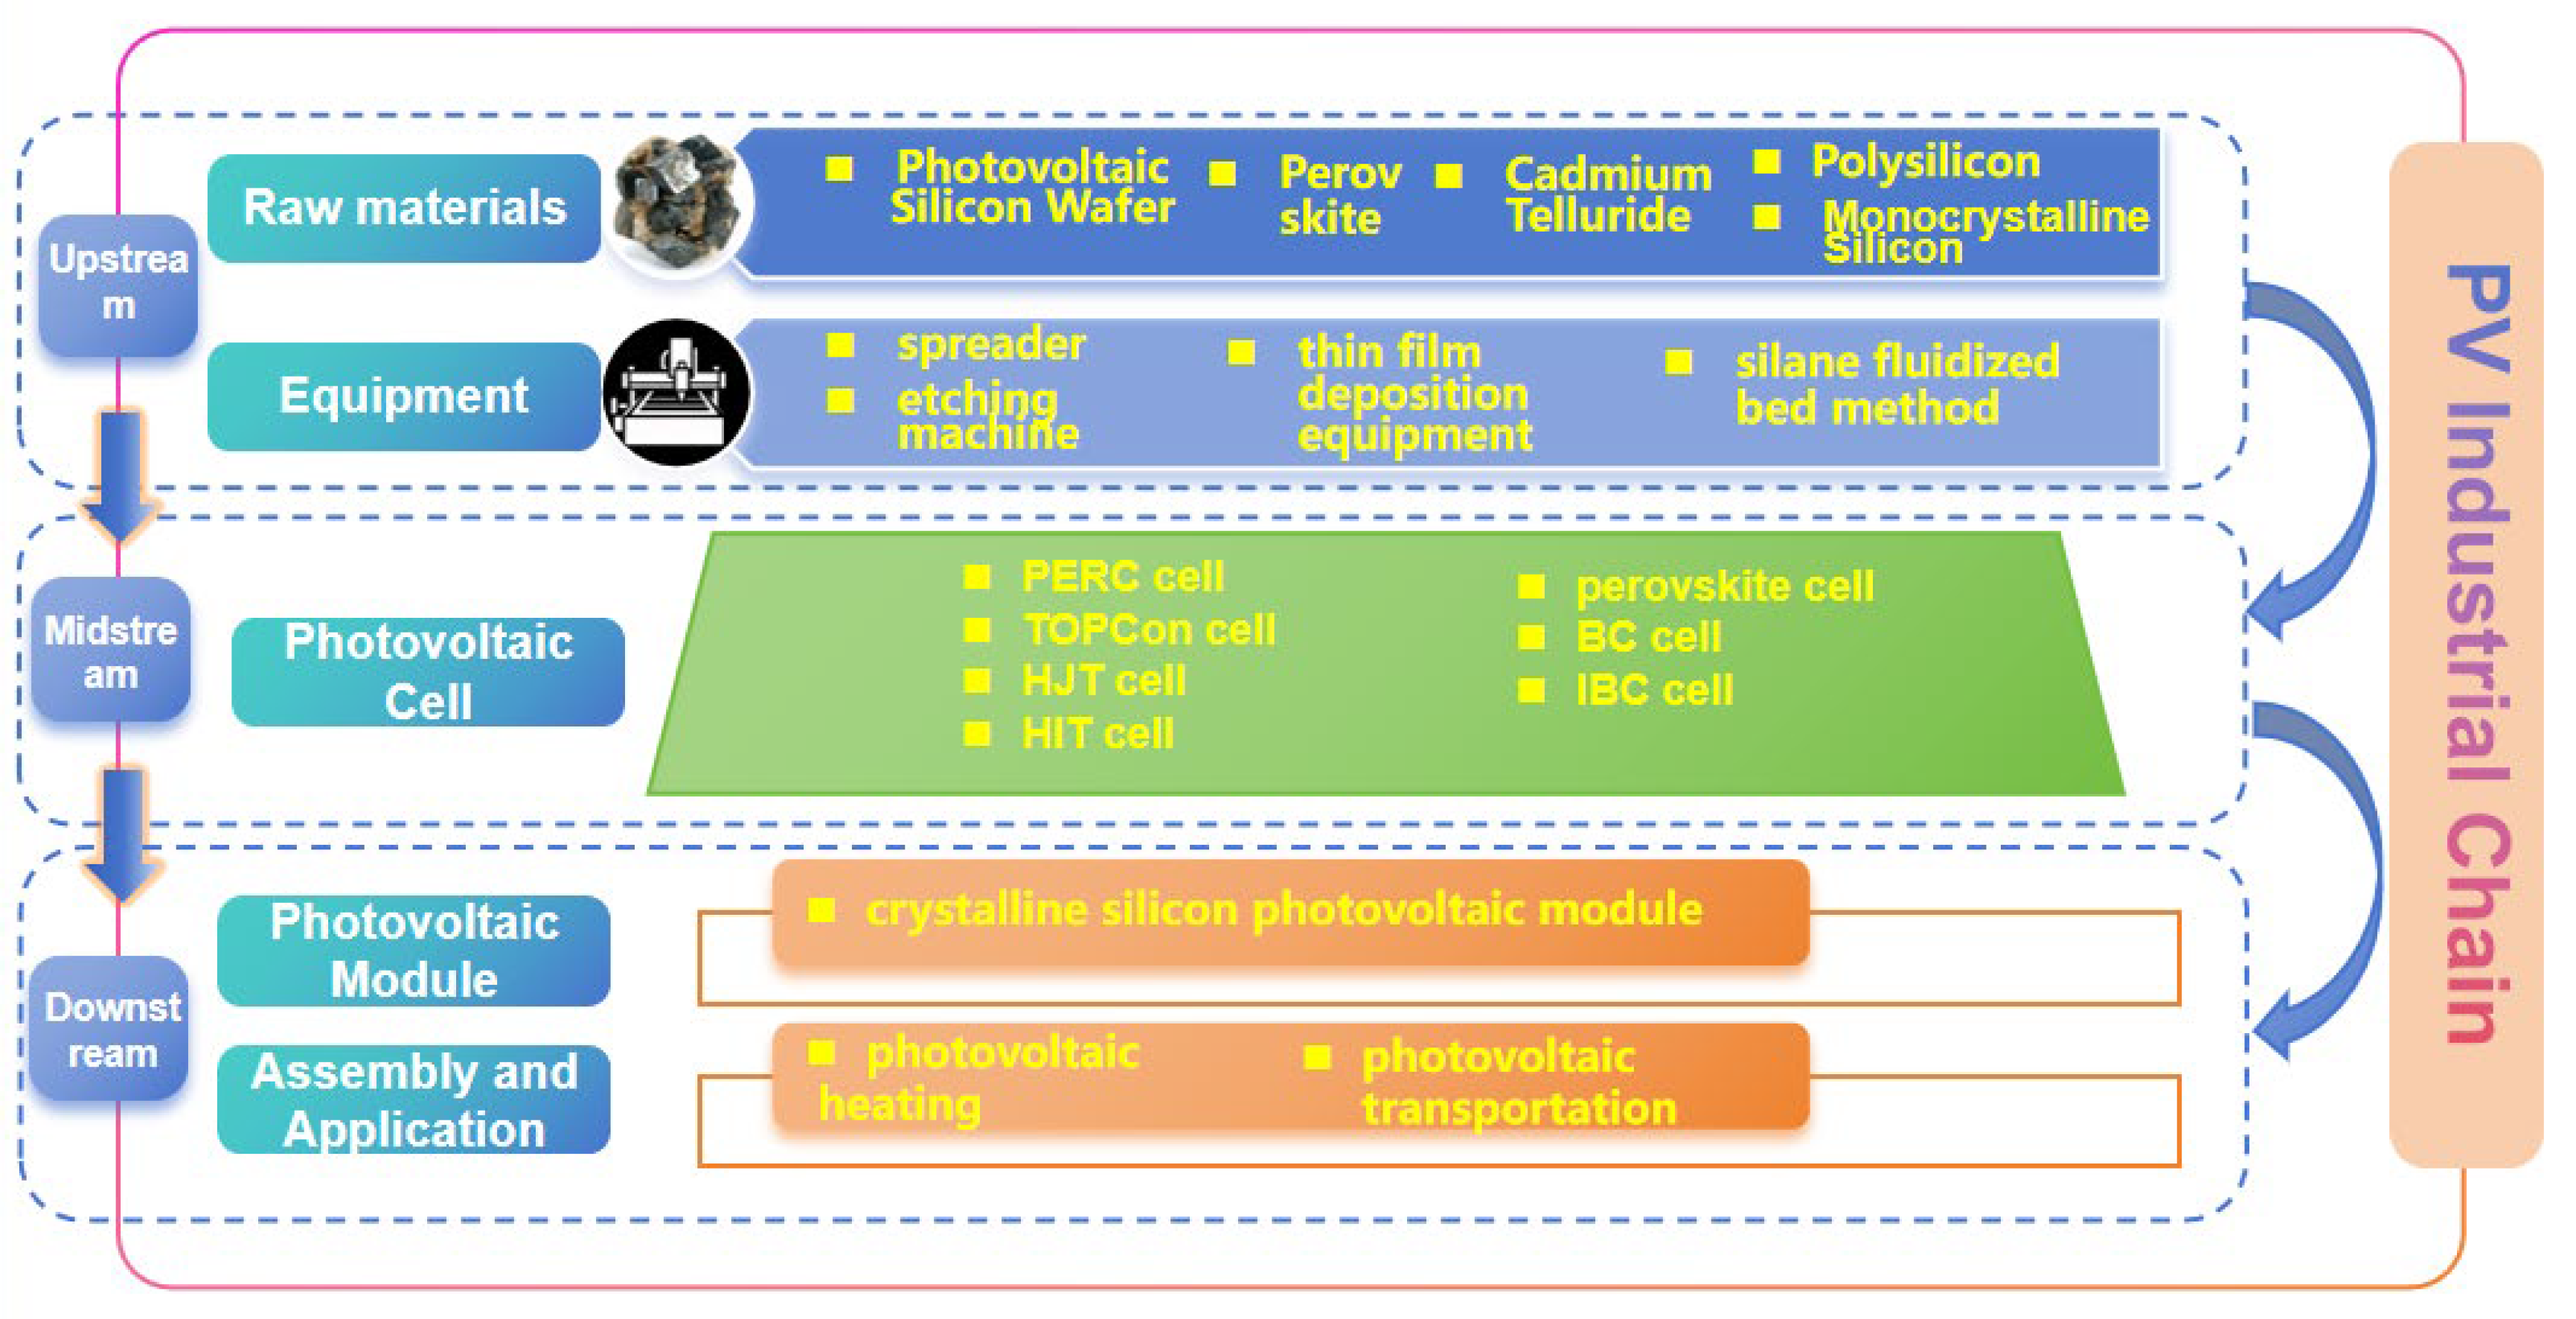
As illustrated in Figure 2, based on the characteristics of the photovoltaic cell and relevant studies, this paper defines the photovoltaic cell industrial chain as follows [34]: the upstream segment encompasses the manufacturing of core raw materials and key equipment, the midstream segment focuses on the core process of photovoltaic cell manufacturing, and the downstream segment includes system assembly and diverse application scenarios.

3. Results

To ensure analytical coherence across the successive empirical sections, this section is organized along three interconnected layers. First, we examine the temporal dynamics of enterprise and patent growth to establish the overall developmental rhythm of the photovoltaic cell sector. Second, we separately analyze the spatial evolution of the industrial chain and the innovation chain, using comparable spatial units (285 cities) and consistent cartographic representations. Third, we explicitly link these two spatial patterns through the gravity center model and location quotient analysis, thereby providing a unified framework for assessing their coupling.

3.1. Temporal Evolution Analysis of Photovoltaic Cell Enterprises and Patents

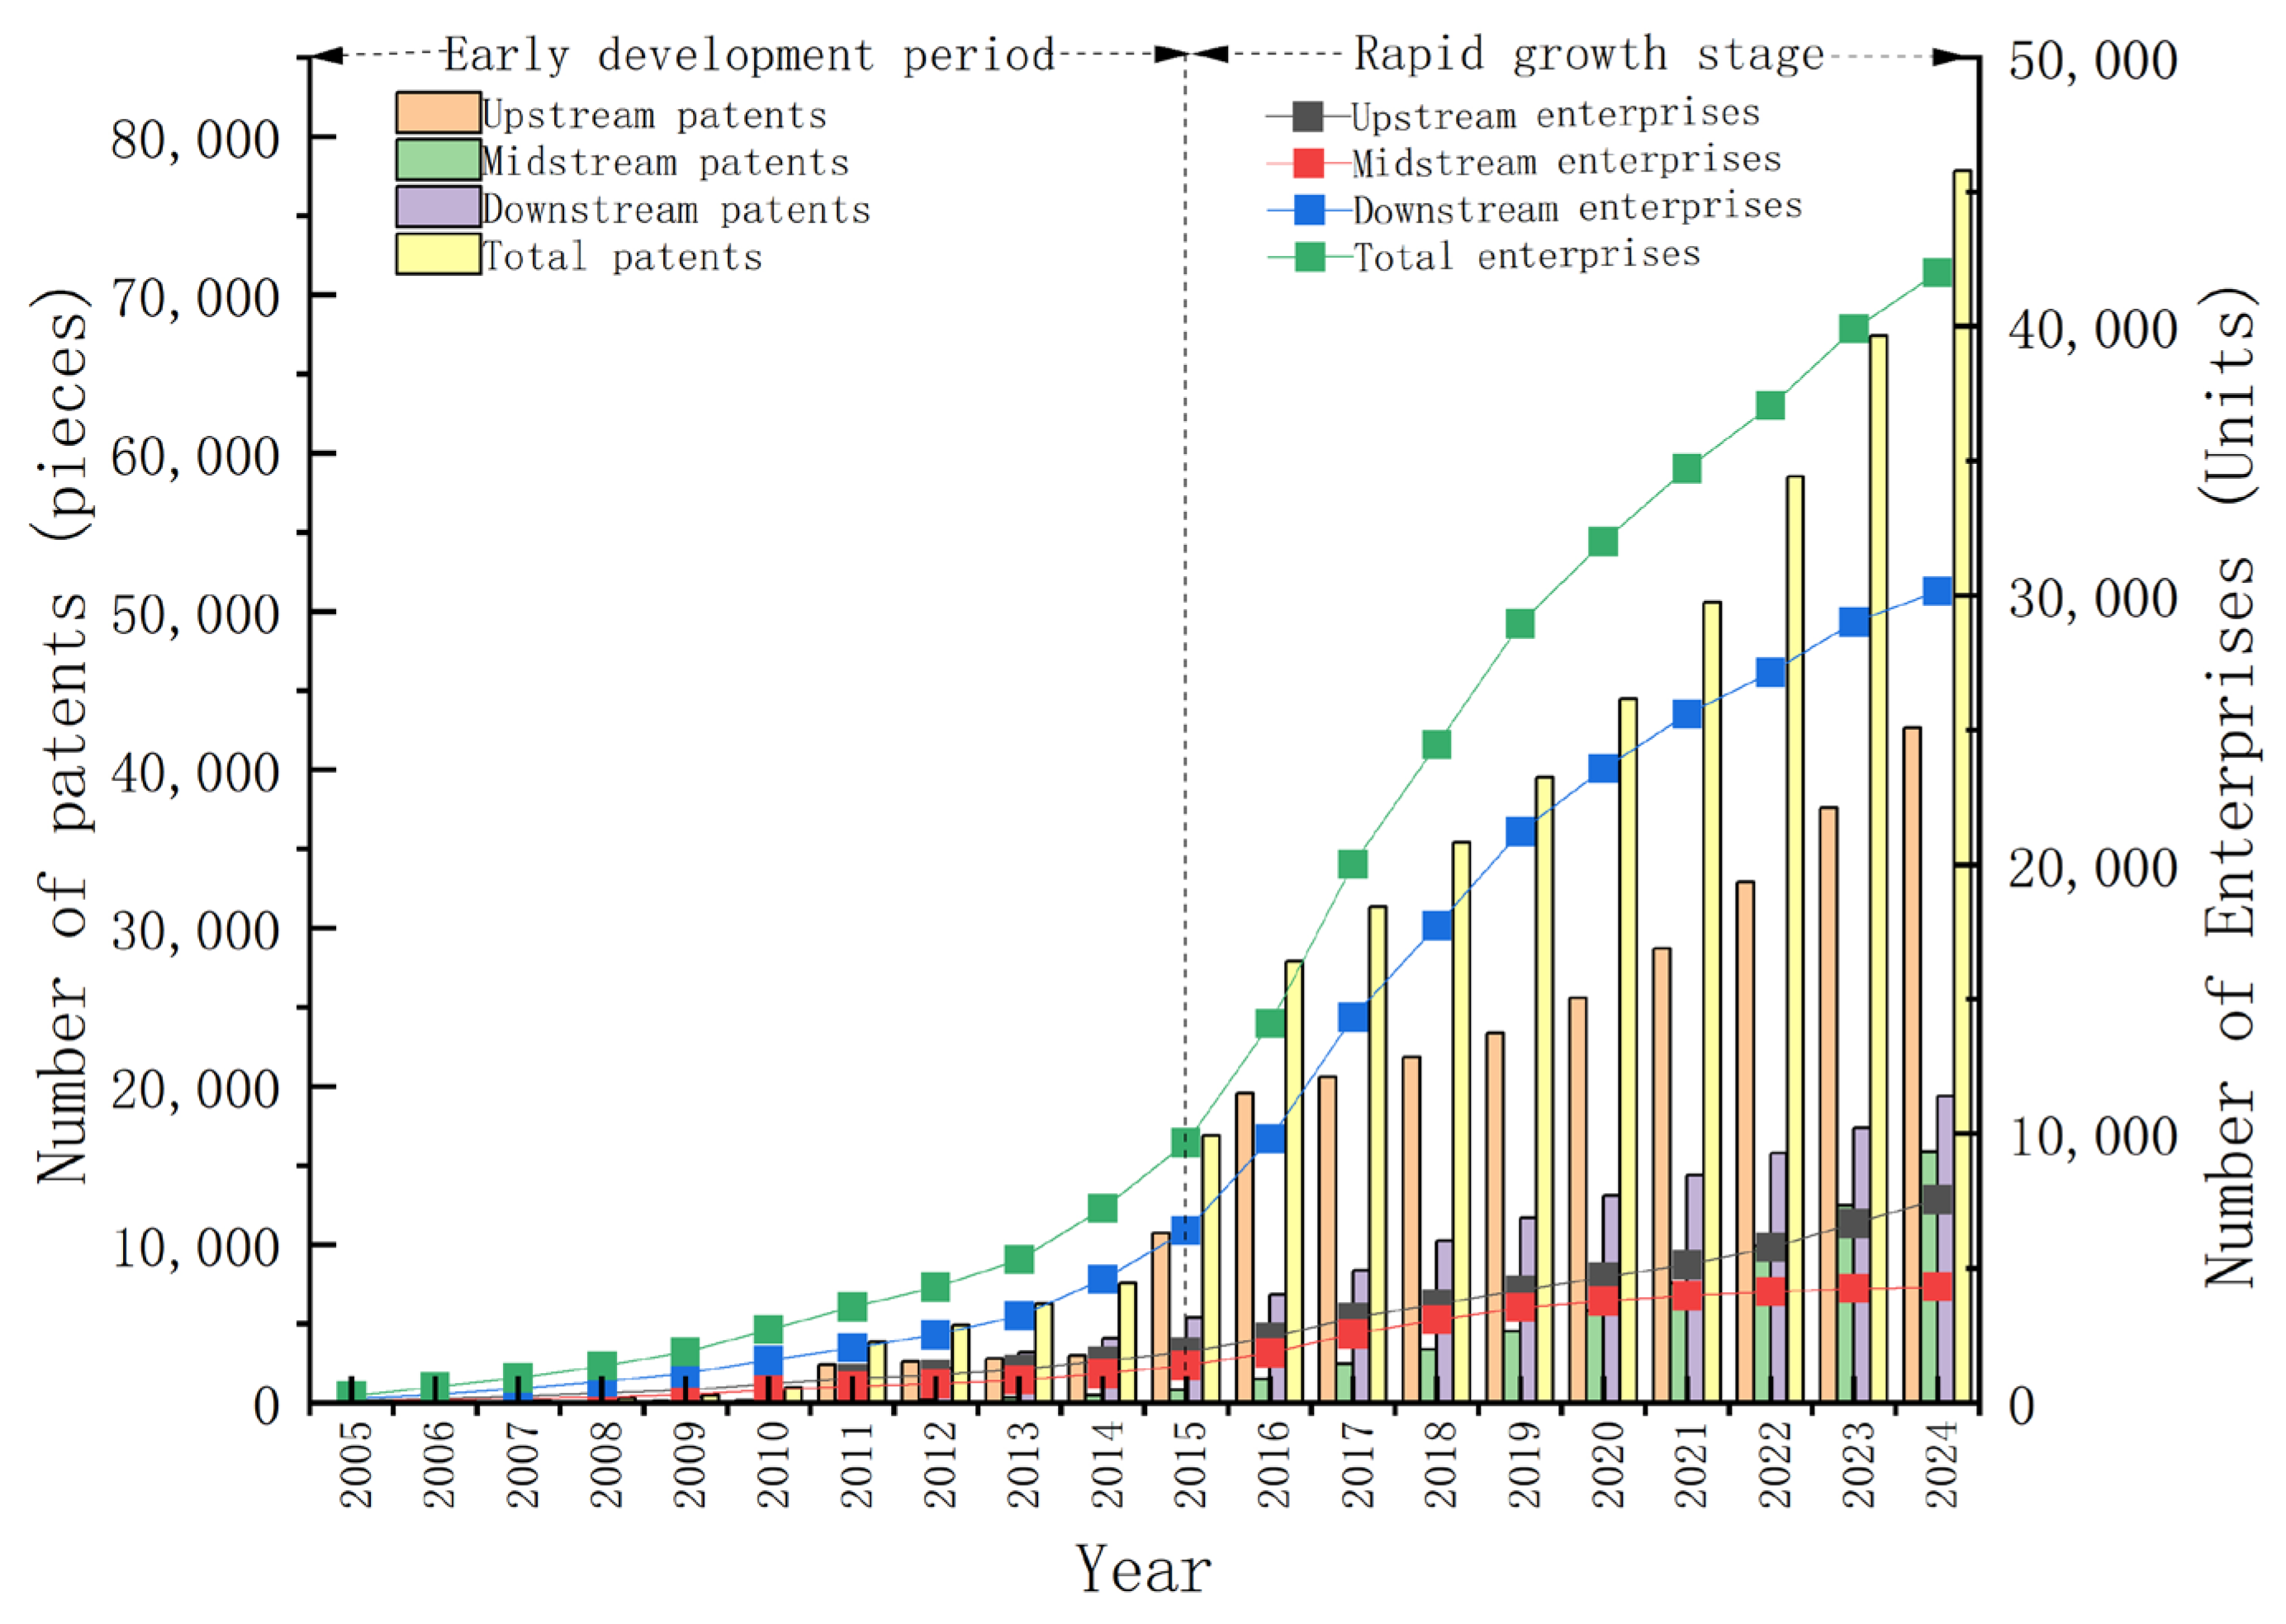
As illustrated in Figure 3, both the number of photovoltaic cell enterprises and the number of patents in China exhibited exponential growth during the study period. The total number of enterprises increased from 257 in 2005 to 41,995 in 2024, representing a compound annual growth rate (CAGR) of 30.8%. Concurrently, the total number of patents increased from 8 in 2005 to 77,802 in 2024, achieving a remarkable CAGR of 55.3%. This trajectory coincides temporally with the sustained implementation of national renewable energy strategies and the growth of global green energy market demand (references [6,33]).
Based on pivotal policy milestones in the photovoltaic cell and the observed inflection points in the data, the evolution is segmented into the following two distinct phases: an initial development phase (2005–2015) and a subsequent forward development phase (2015–2024). During the initial phase, the total number of enterprises increased from 257 to 9654, while the number of patents increased from 8 to 16,857. This growth occurred during a period of active subsidy policies (e.g., feed-in tariffs), which coincided with the entry of manufacturing enterprises and R&D resources. Entering the forward development phase, the number of enterprises soared from 9654 to 41,995, and the number of patents increased from 16,857 to 77,802. This phase corresponds to the domestic “grid parity” policy period and a concurrent surge in export demand associated with the global energy transition.
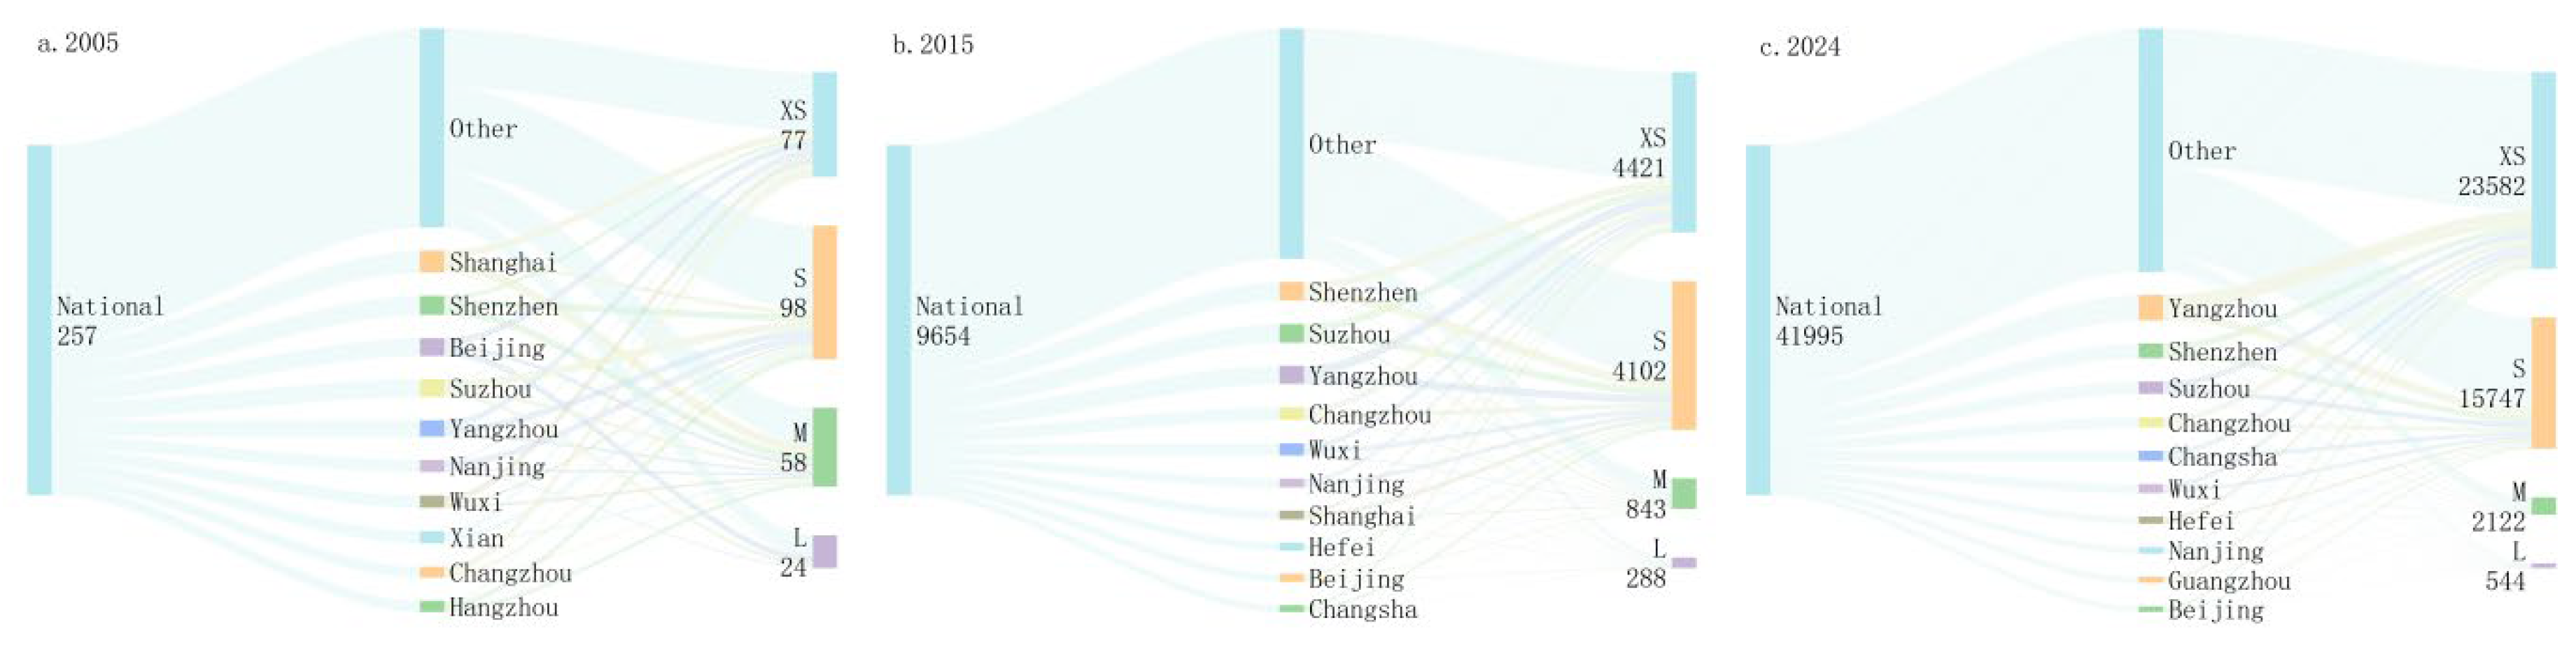
As depicted in Figure 4, in terms of scale structure, China’s photovoltaic cell industry chain exhibits a synergistic evolution characterized by “leading enterprises setting the pace and a long tail of participants permeating the market”. In accordance with the Statistical Classification Method for Large, Medium, Small, and Micro Enterprises (2017), enterprises are categorized into the following four types: large, medium-sized, small, and micro. In 2005, there were a total of 257 photovoltaic cell enterprises nationwide, concentrated primarily in core cities such as Shanghai and Shenzhen. By 2024, the numbers of small enterprises (15,747) and microenterprises (22,862) had increased substantially, establishing them as critical forces driving industrial development.
Local governments have leveraged policies for “specialized, refined, distinctive, and innovative” enterprises to guide small and medium-sized enterprises (SMEs) in focusing on core technologies. These SMEs compensate for their limitations through market sensitivity and organizational flexibility, thereby complementing the technological leadership advantages of larger firms. Through deep integration facilitated by models such as innovation coupling and industrial clustering, a collaborative industrial system has gradually been constructed—one characterized by the efficient allocation of factors and a cohesive, tiered division of labor.

3.2. Spatial Evolution Analysis of the Photovoltaic Cell Industrial Chain

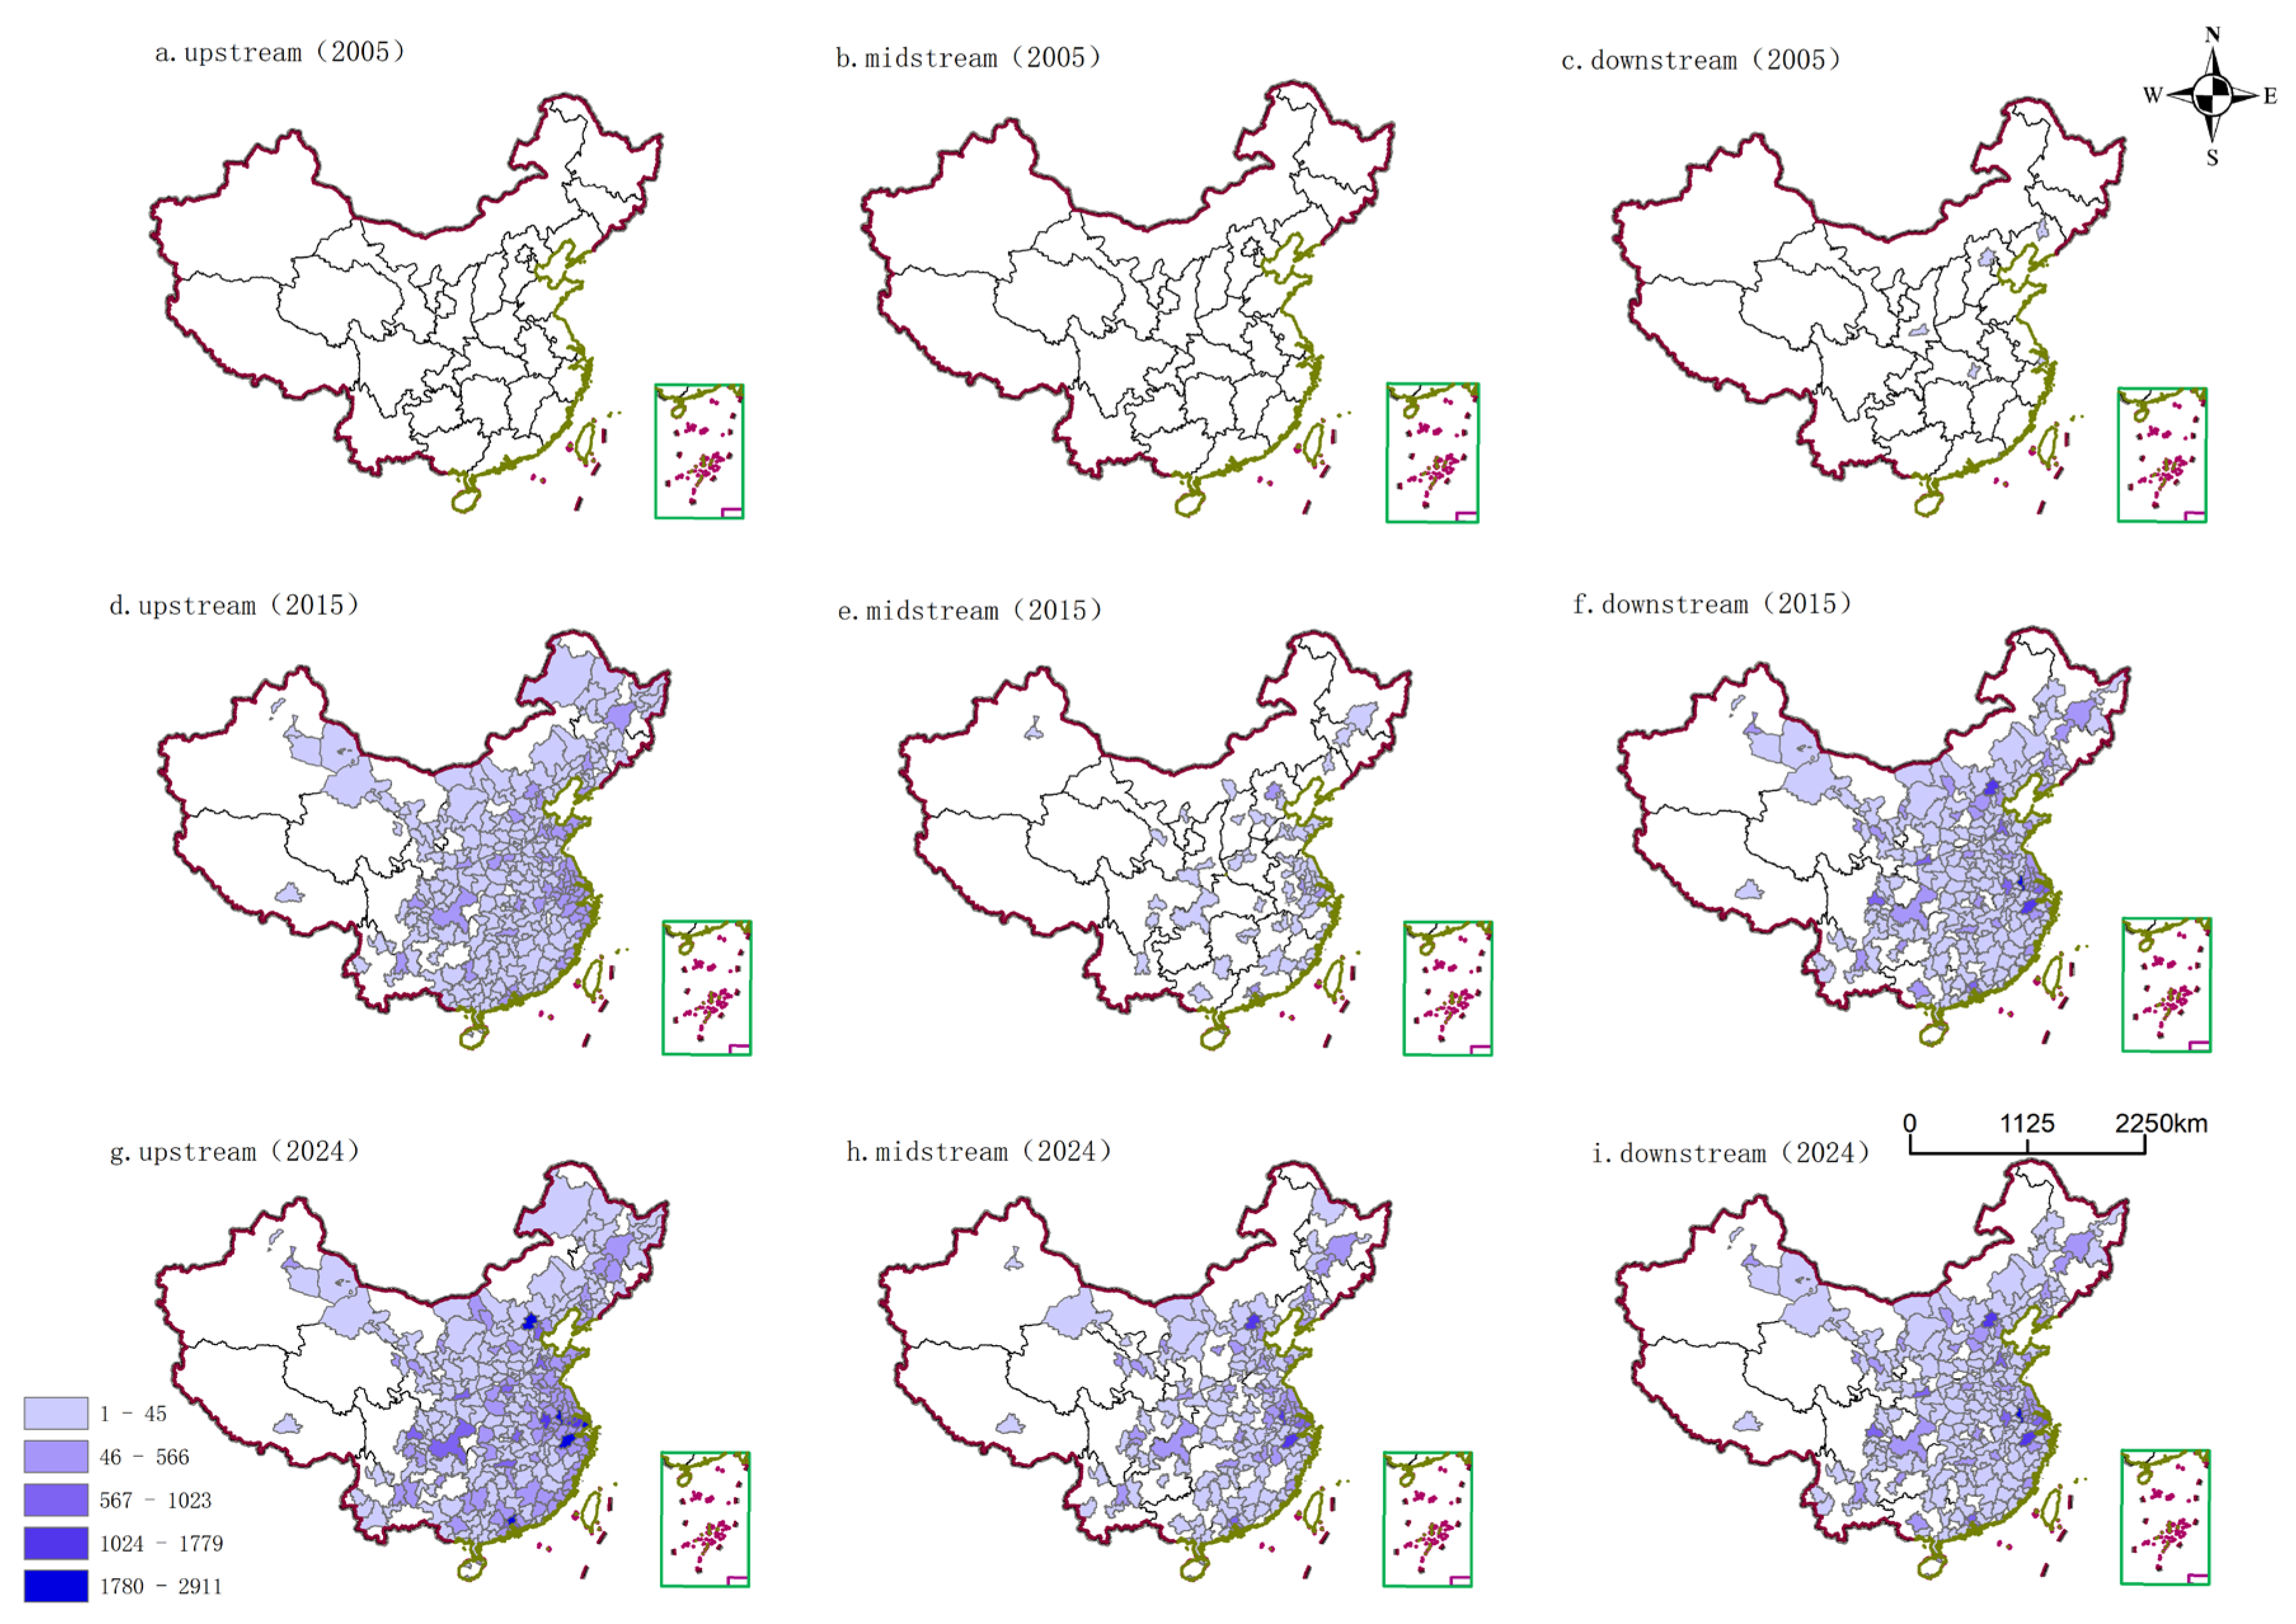
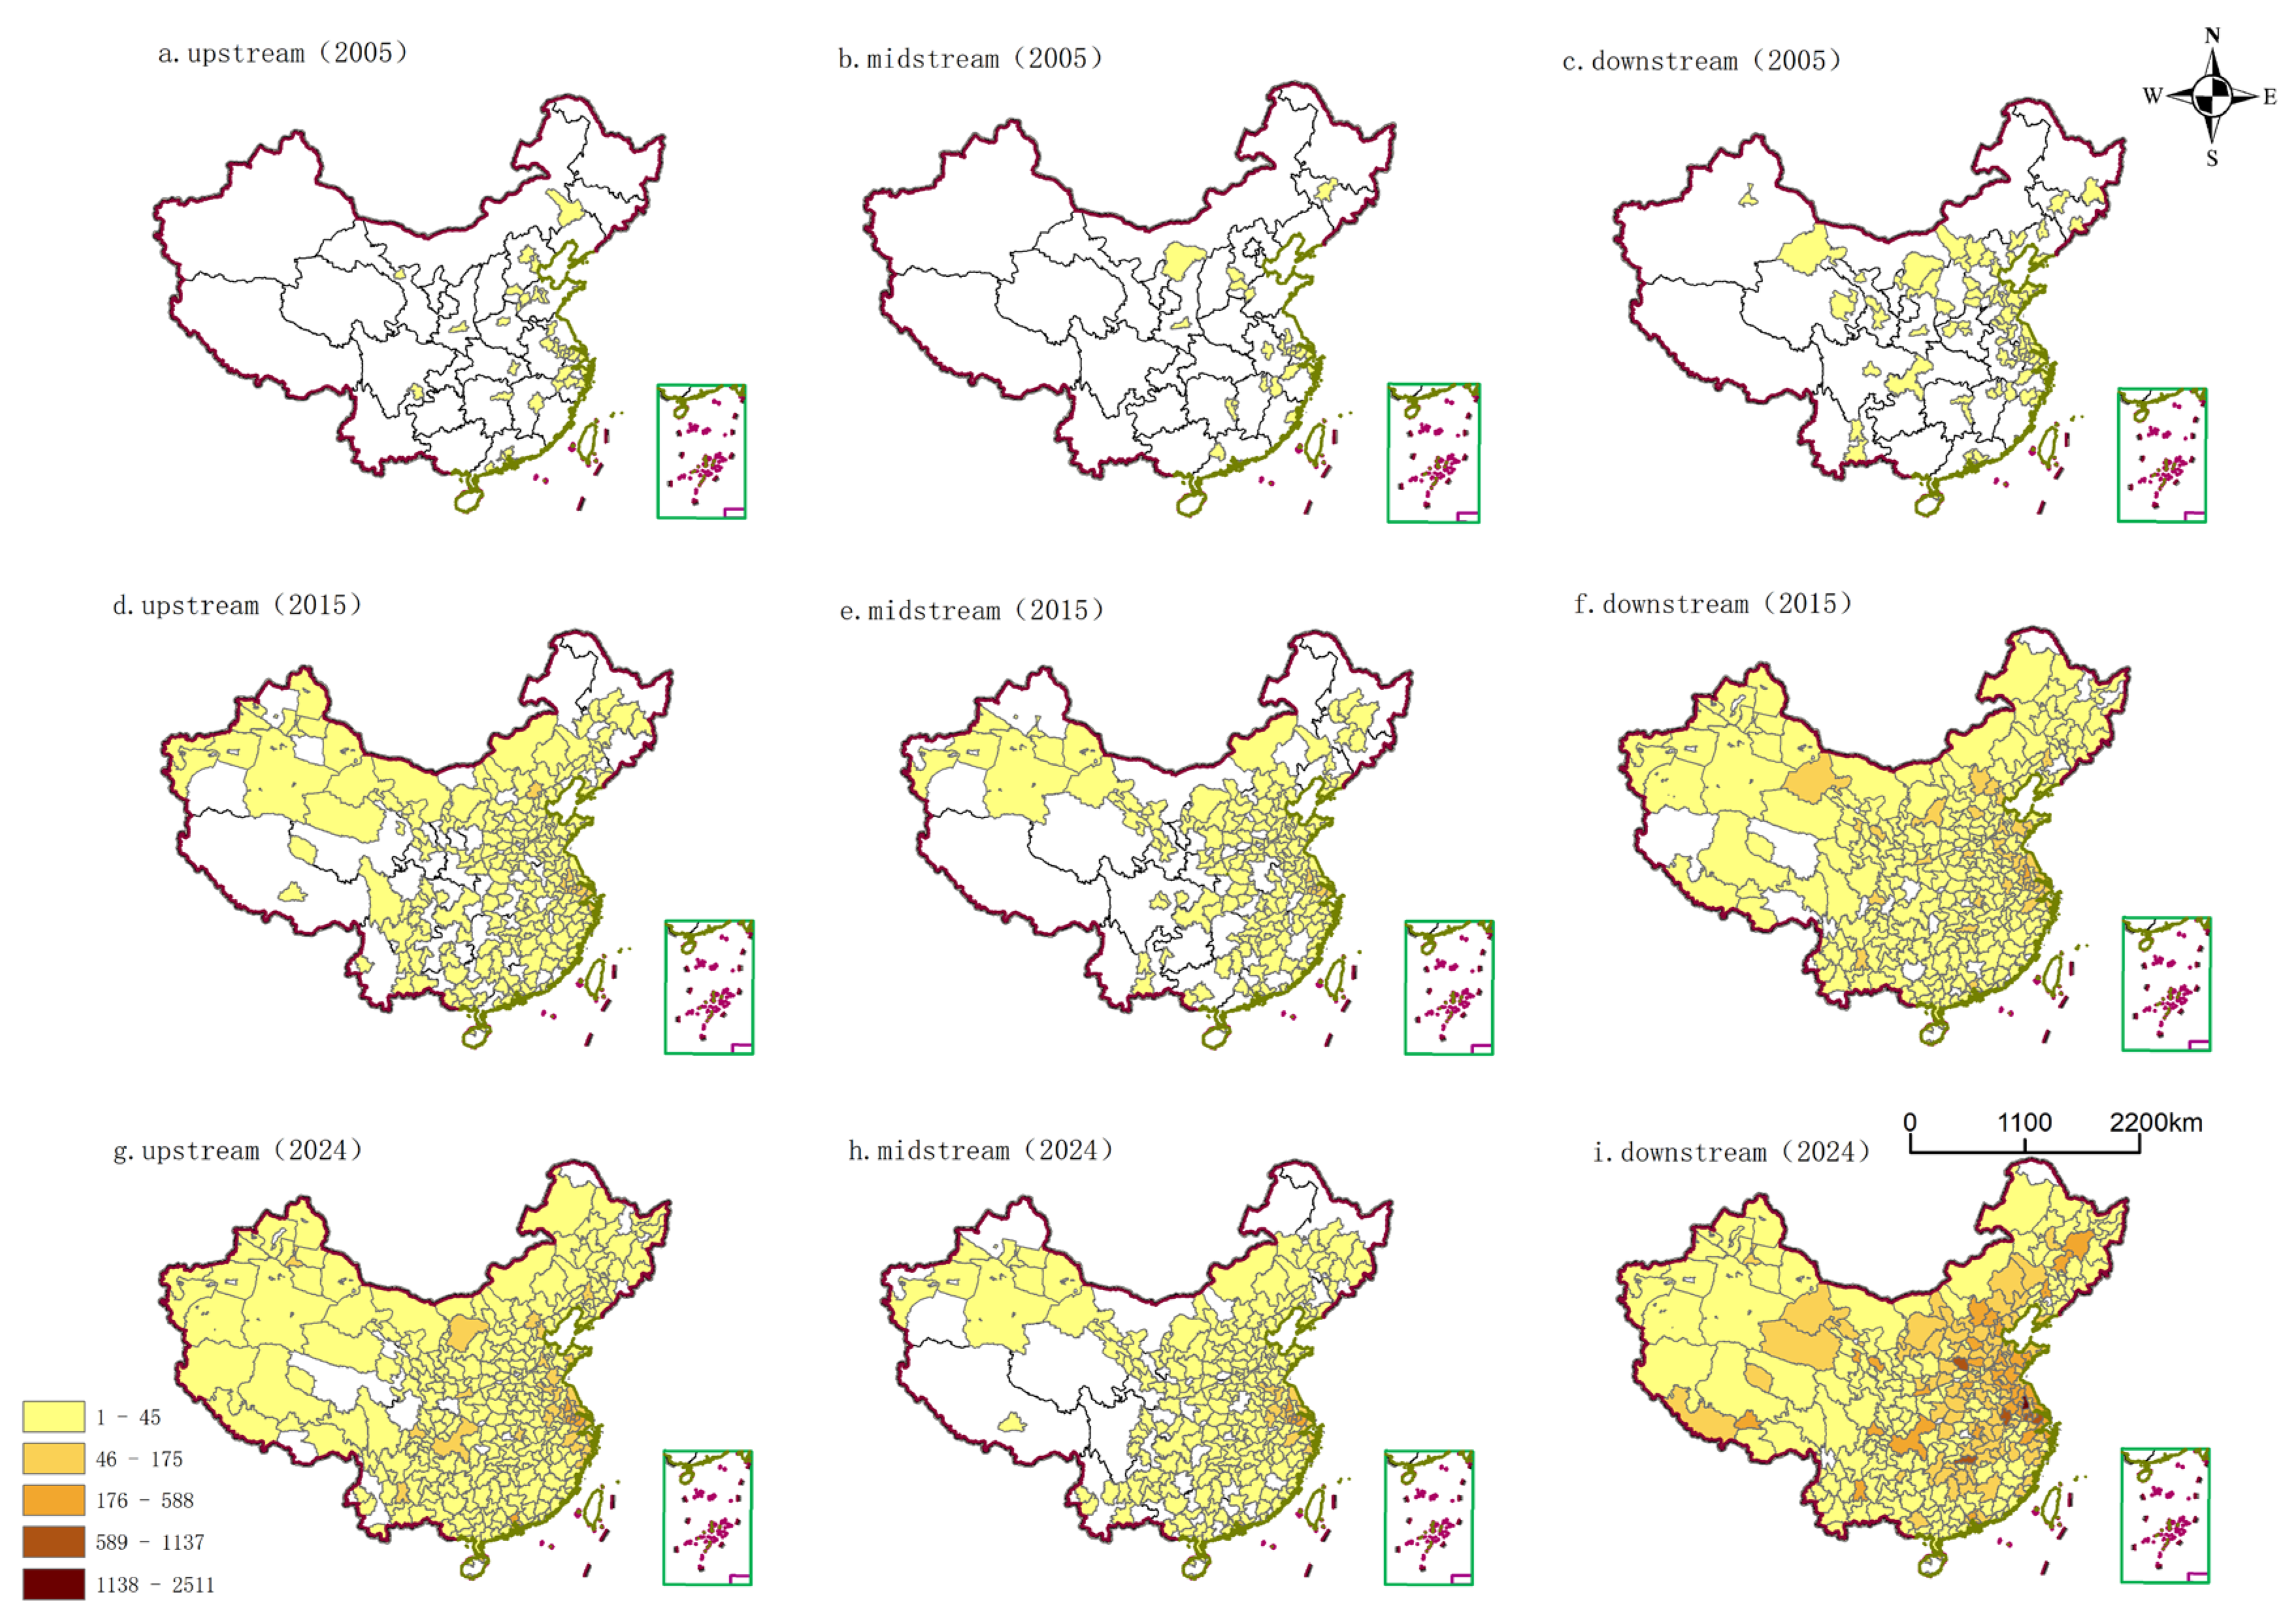
As illustrated in Figure 5, the spatial distribution pattern of China’s photovoltaic cell industry chain has undergone a profound transformation, evolving from an “eastern-led” structure to a “multipolar coordinated” national framework. In 2005, the industry was highly concentrated in a few eastern cities such as Beijing, Shanghai, and Shenzhen. At this nascent stage, all segments of the industrial chain were relatively underdeveloped and geographically dispersed. By 2015, the industrial gravity center had shifted to (32.13° N, 115.71° E). At the same time, the industrial chain agglomerated in coastal regions such as the Yangtze River Delta and the Pearl River Delta (Figure 5). This period witnessed the initial clustering of upstream material R&D and midstream manufacturing in cities such as Shenzhen and Suzhou, alongside a comprehensive downstream application layout across the eastern coastal areas. By 2024, the industrial gravity center had further moved to (31.13° N, 115.27° E). As shown in Figure 5, the spatial distribution exhibited a pattern of westward migration (e.g., upstream segments in Jiangxi and Sichuan) alongside continued agglomeration in eastern clusters. Upstream segments, driven by resource orientation, migrated notably westward, forming new clusters in provinces such as Jiangxi and Sichuan. While the midstream segments continued to optimize and increase in traditionally strong eastern cities, they also expanded into emerging automobile industry hubs in central-western regions such as Wuhan and Hefei. Downstream applications achieved a broad and balanced distribution nationwide. This spatial evolution signifies that China’s photovoltaic cell has transitioned from its initial scattered, point-like distribution through a phase of coastal agglomeration to ultimately reach a mature, networked development stage characterized by efficient coordination and leveraging regional comparative advantages.

3.3. Spatiotemporal Evolution Analysis of the Photovoltaic Cell Innovation Chain

As illustrated in Figure 6, the spatial configuration of China’s photovoltaic cell innovation chain has undergone a profound transformation, evolving from an “eastern concentration” to a “multipolar coordinated” national framework. In 2005, innovation activities were highly concentrated in cities such as Beijing, Shanghai, and Hefei. By 2015,innovation activities agglomerated in eastern coastal manufacturing hubs such as the Yangtze River Delta and the Pearl River Delta (Figure 6). Explosive zones where industry and innovation converged emerged, especially in manufacturing powerhouses such as Wuxi and Suzhou. Concurrently, upstream innovation began to extend westward to regions with energy cost advantages. As shown in Figure 6, new patent nodes appeared in Xinjiang and Inner Mongolia, while inland cities such as Hefei and Xi’an gained prominence. Downstream innovation, propelled by the proliferation of integrated applications such as “PV+,” exhibited a broad and balanced diffusion pattern nationwide. This evolutionary trajectory clearly delineates the progression of photovoltaic cell innovation activities from relying solely on concentrated scientific research resources to deep integration with manufacturing clusters and ultimately toward a development process that leverages national comparative advantages to achieve cross-regional, synergistic innovation.

3.4. Coupling Analysis of the Photovoltaic Cell Industrial Chain and Innovation Chain

By employing the spatial centroid model, this study analyzes the coupling characteristics between enterprise-weighted and patent-weighted centroids in China’s photovoltaic cell from a macro perspective for the period 2005–2024.

3.4.1. The Macrospatial Coupling Process Between the Industrial Centroid and the Innovation Centroid

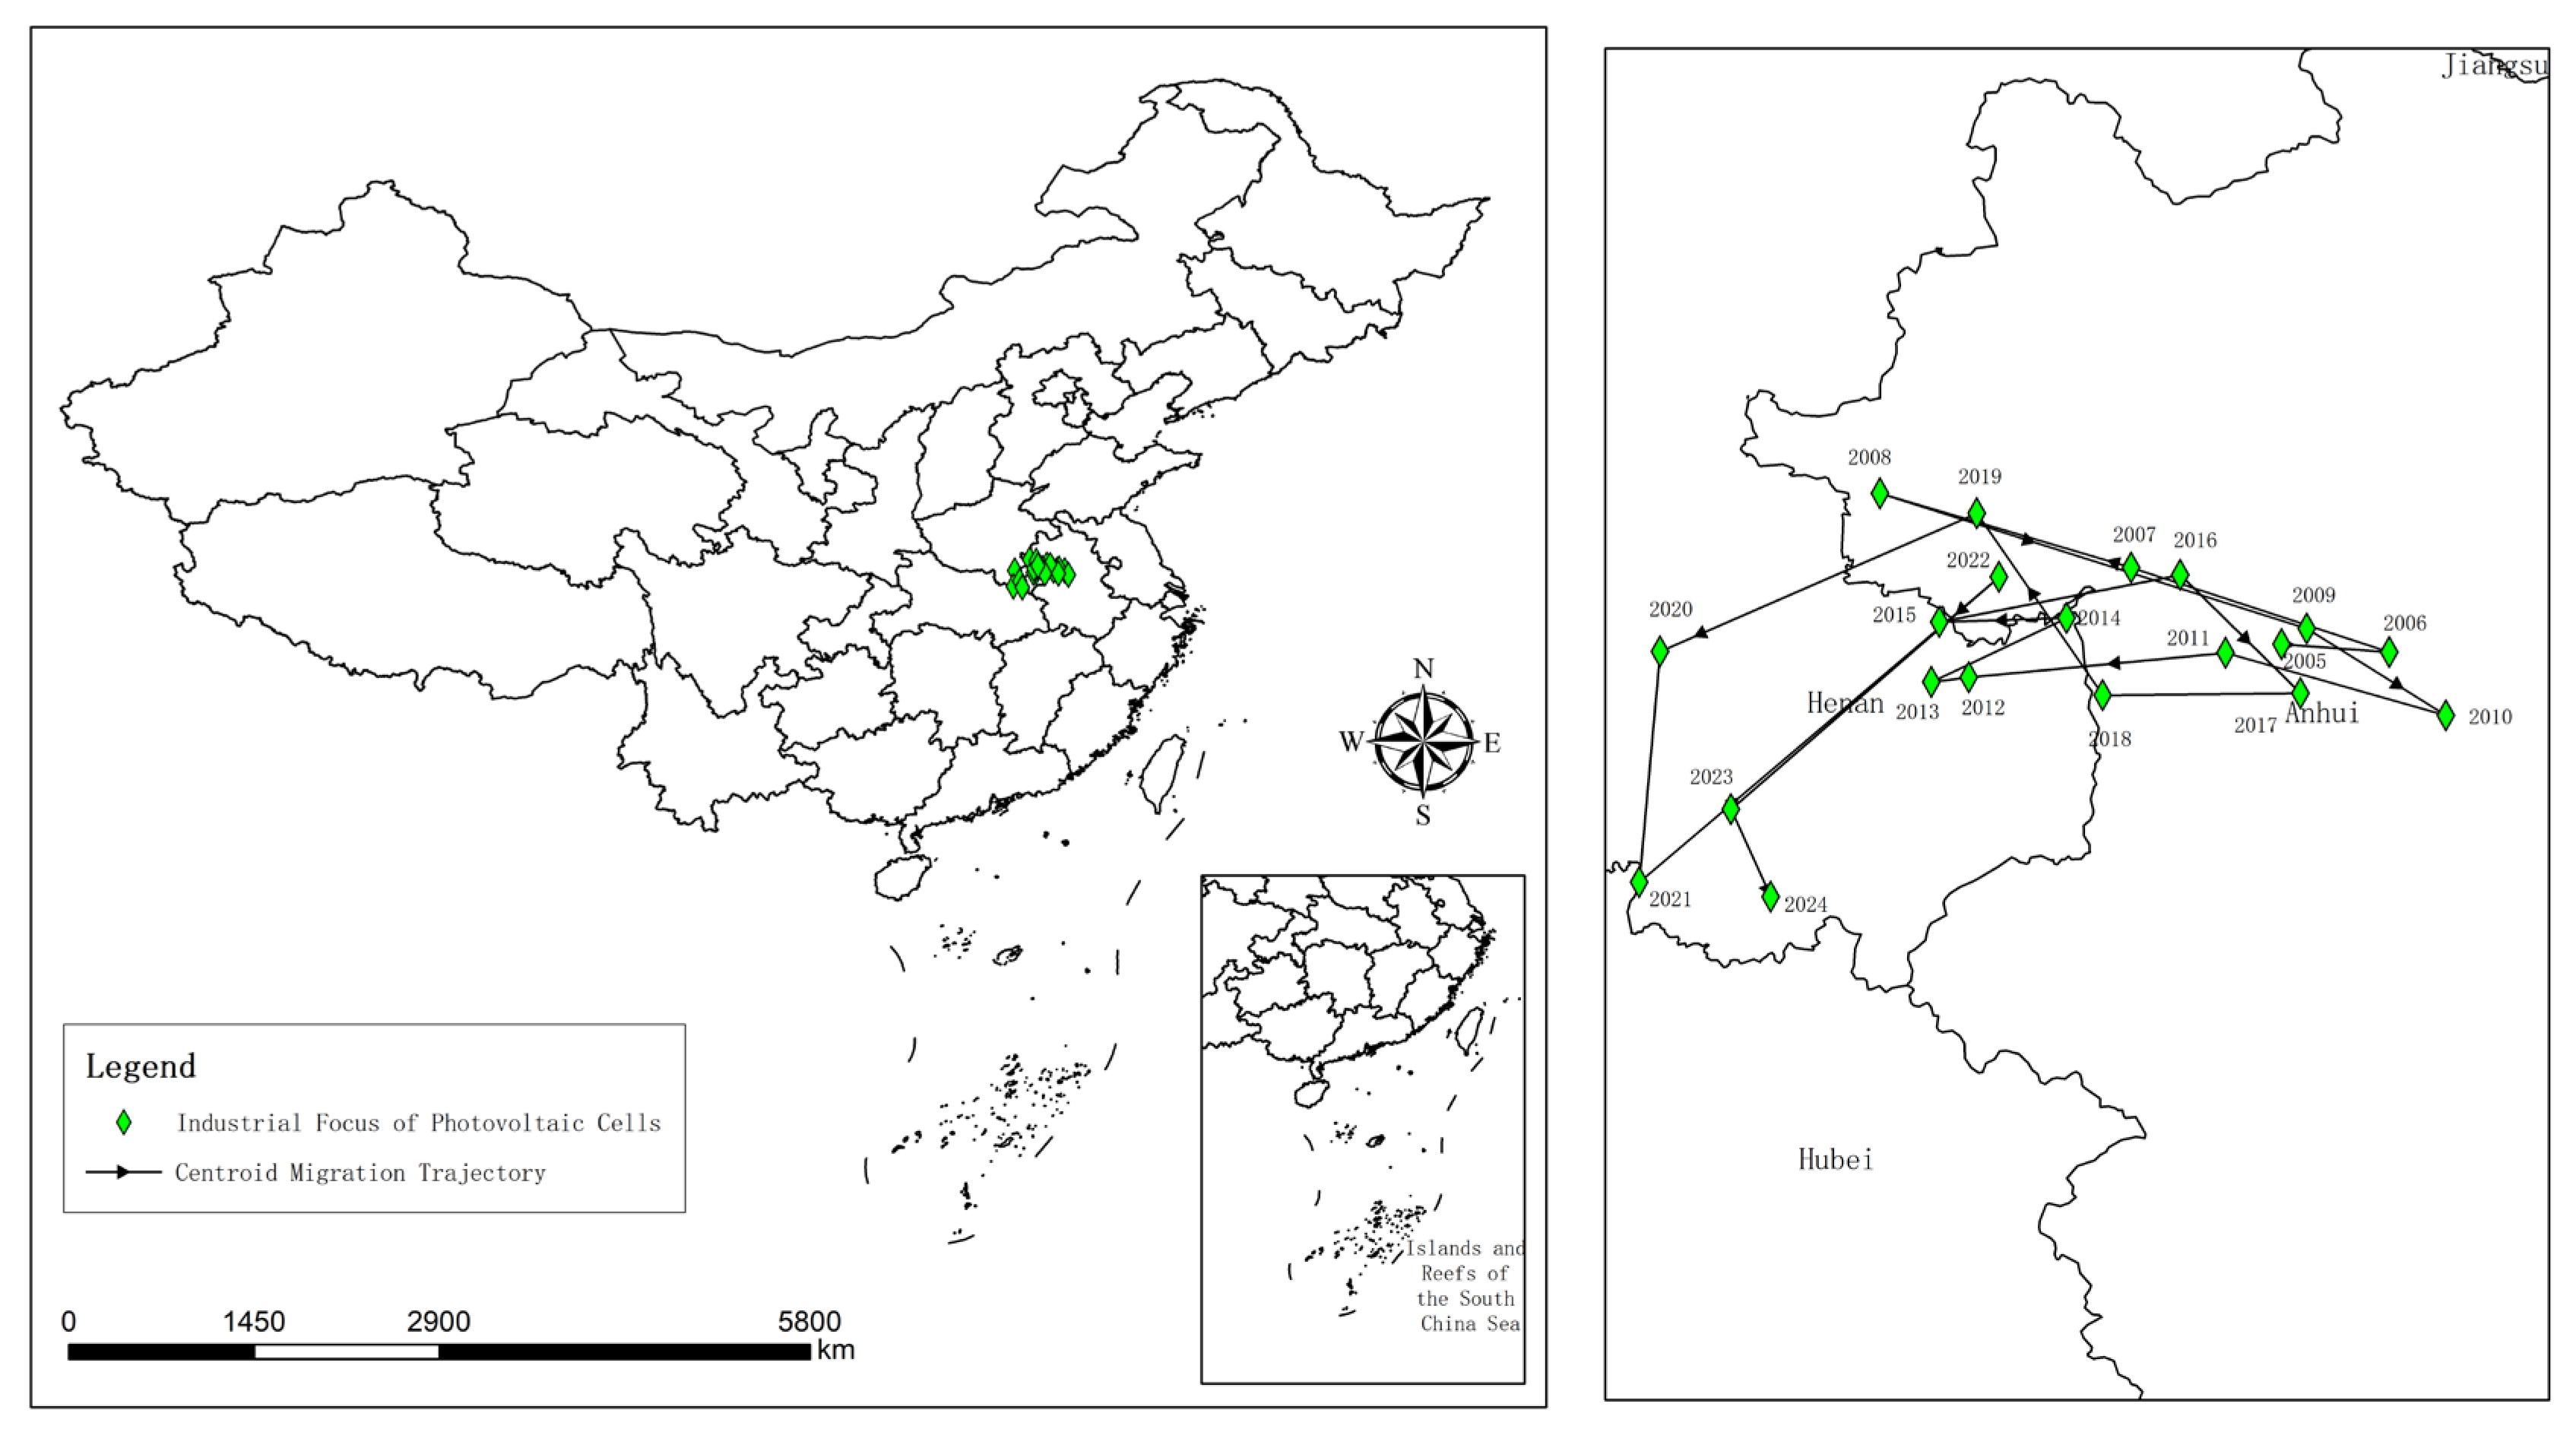
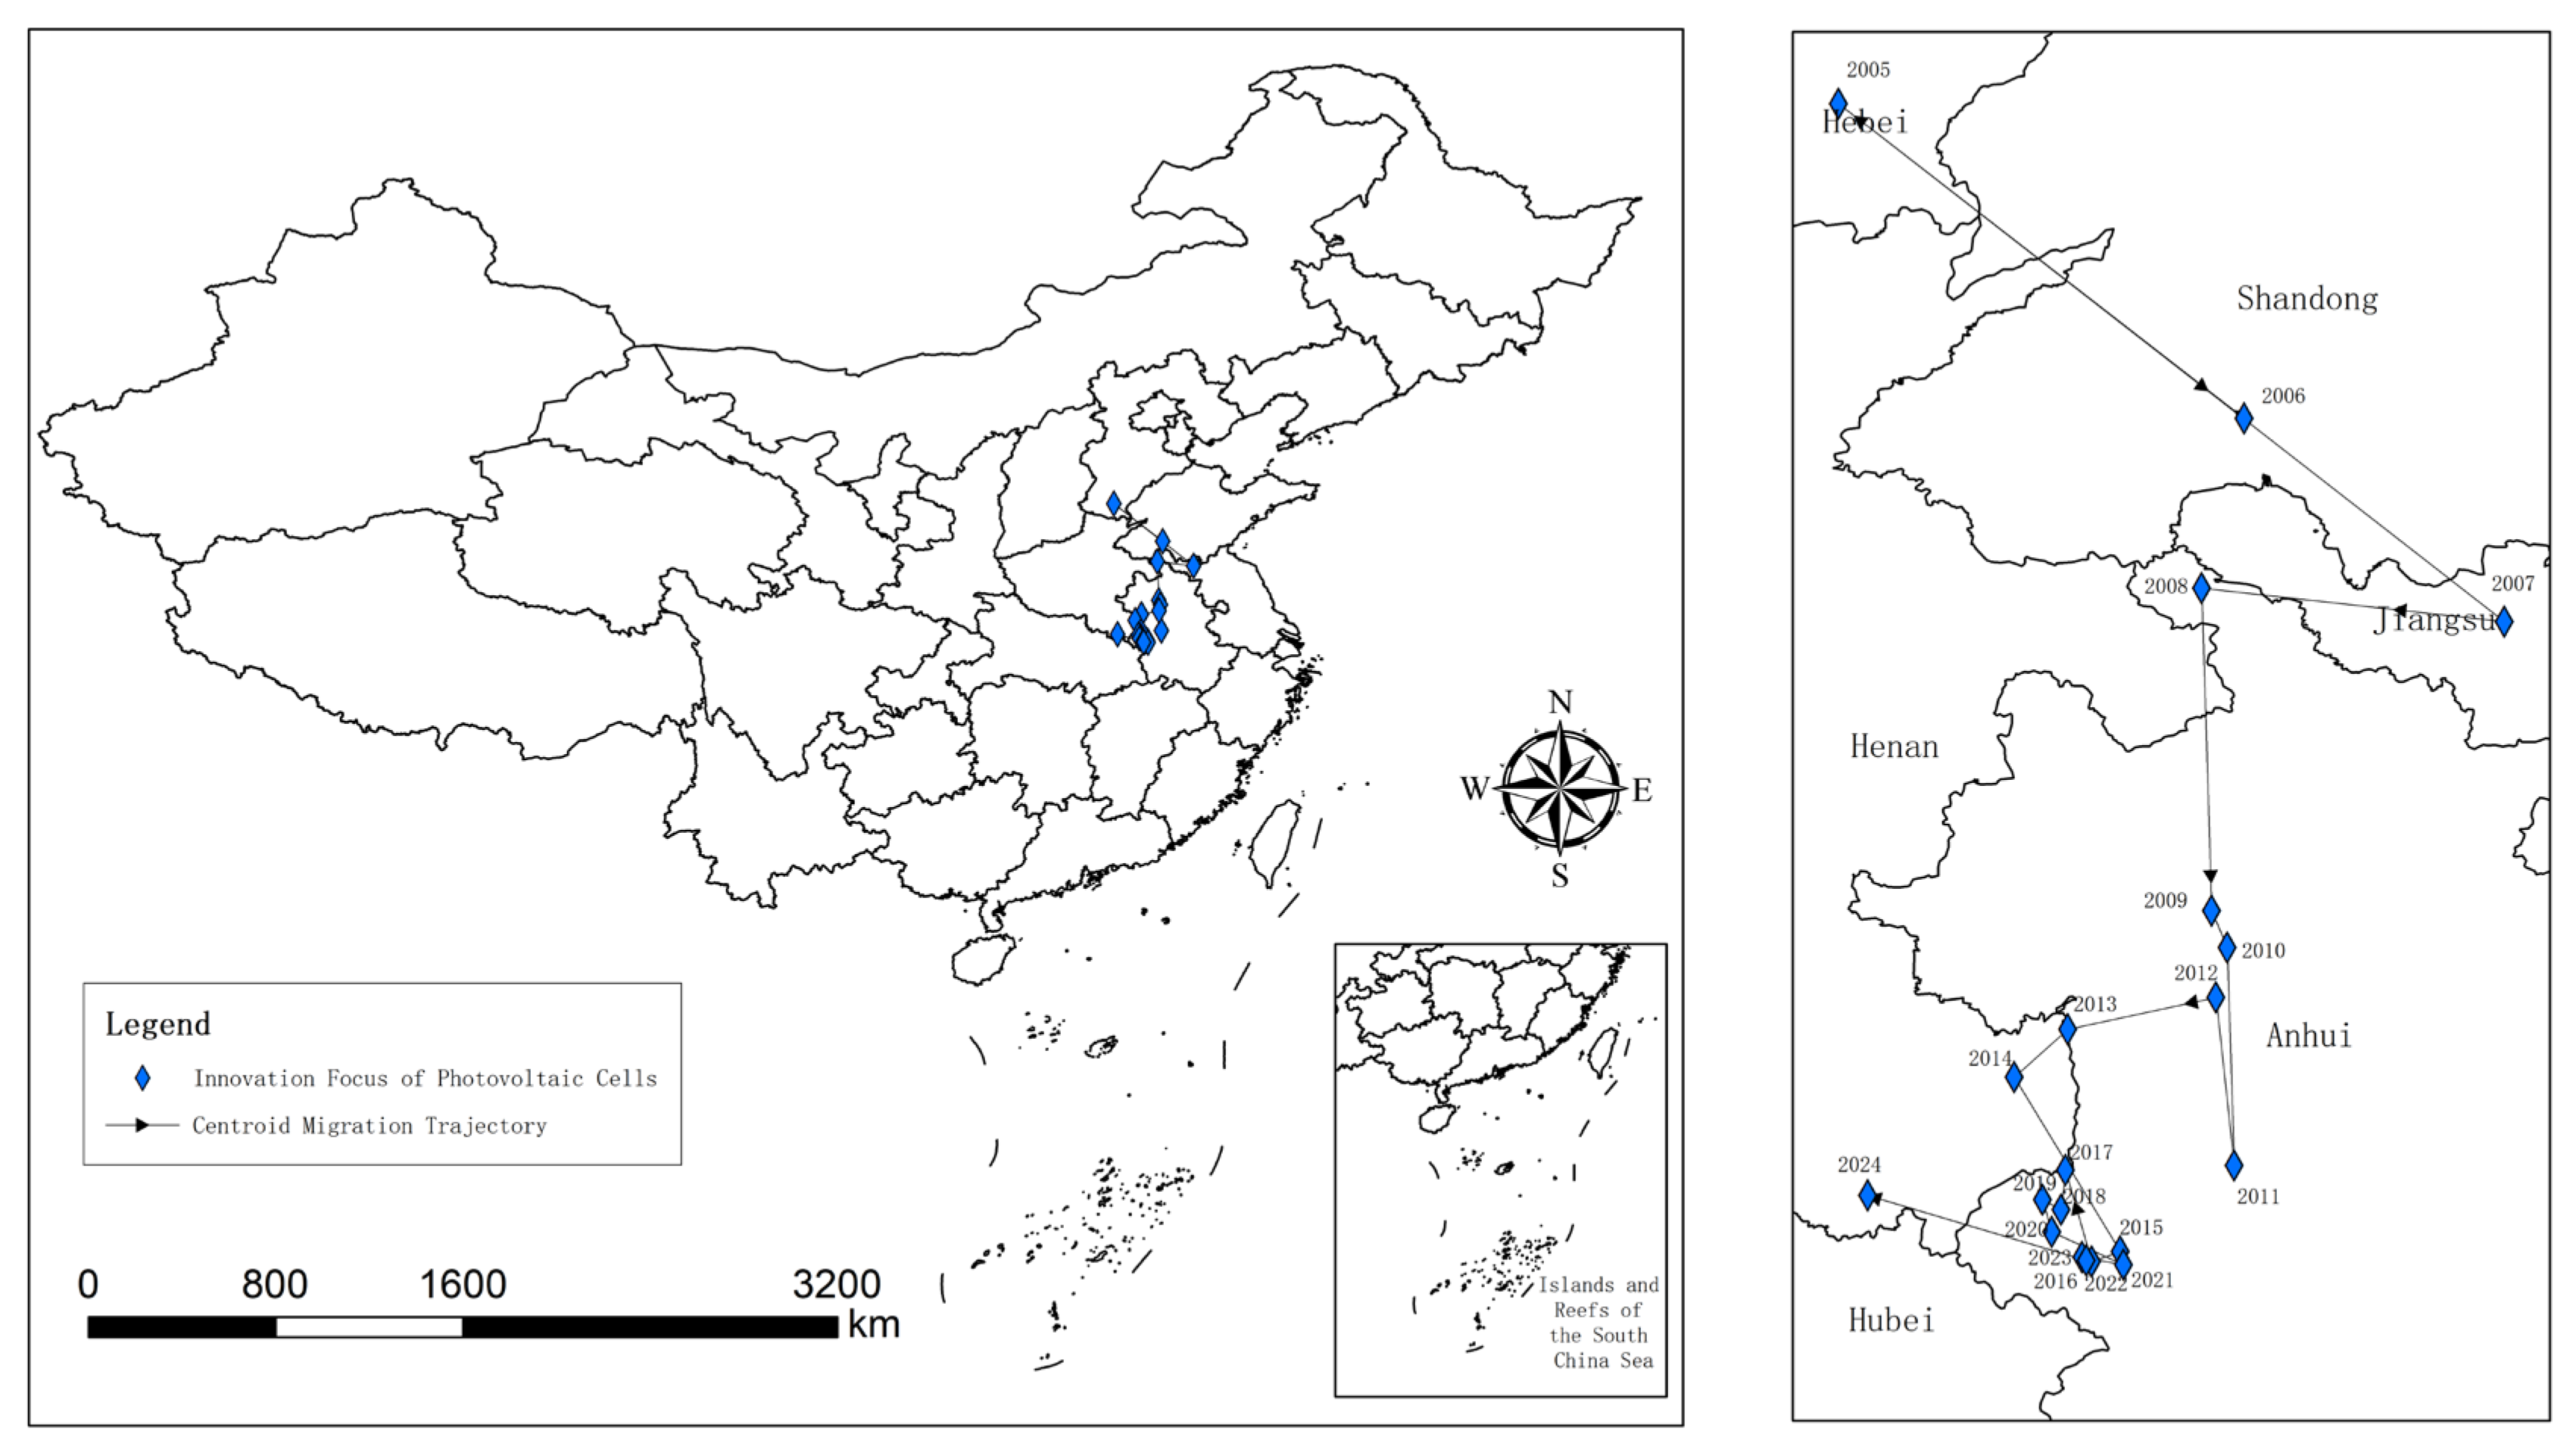
As illustrated in Figure 7, the centroid of China’s photovoltaic industry exhibited a distinct multiphase spatial migration trajectory between 2005 and 2024. In 2005, the industrial centroid was near the southern part of Henan Province (32.03° N, 116.74° E) and subsequently shifted toward lower-latitude regions. By 2015, the centroid had migrated to the vicinity of western Anhui Province (32.13° N, 115.71° E). During this period, regions such as the Yangtze River Delta and the Pearl River Delta, leveraging their robust technological foundations, vibrant capital markets, and increasing market demand from the initial phase of distributed photovoltaic cell development, attracted a substantial number of photovoltaic cell manufacturing enterprises. Thereafter, the industrial centroid underwent a pronounced shift toward the northwest, eventually reaching near the northeastern part of Hubei Province (31.13° N, 115.27° E) by 2024. This phase was marked by the rapid expansion of production capacity in the central and western regions, particularly in upstream segments such as silicon purification and silicon wafer manufacturing. Concurrently, the progressive improvement in related industrial support facilities in these regions collectively facilitated the spatial reallocation of manufacturing capacity, driving the observed diffusion of the industrial centroid toward the northwestern interior.
As illustrated in Figure 8, the centroid of photovoltaic innovation in China followed a “southward shift” trajectory between 2005 and 2024. Initially located in western Shandong Province (35.24° N, 116.69° E), it first migrated southward to western Anhui Province (31.15° N, 116.09° E) and then underwent a slight southwestward adjustment, ultimately settling in eastern Hubei Province (30.92° N, 116.32° E). This evolutionary path is closely associated with the spatial transformation of the industrial landscape: in the early stage, innovation activities were highly dependent on coastal industrial and research clusters such as the Yangtze River Delta and the Pearl River Delta; in the later stage, the diffusion of innovation resources toward inland regions was propelled by national regional coordination policies and the expansion of upstream production capacity, driven by energy cost advantages in central and western China.
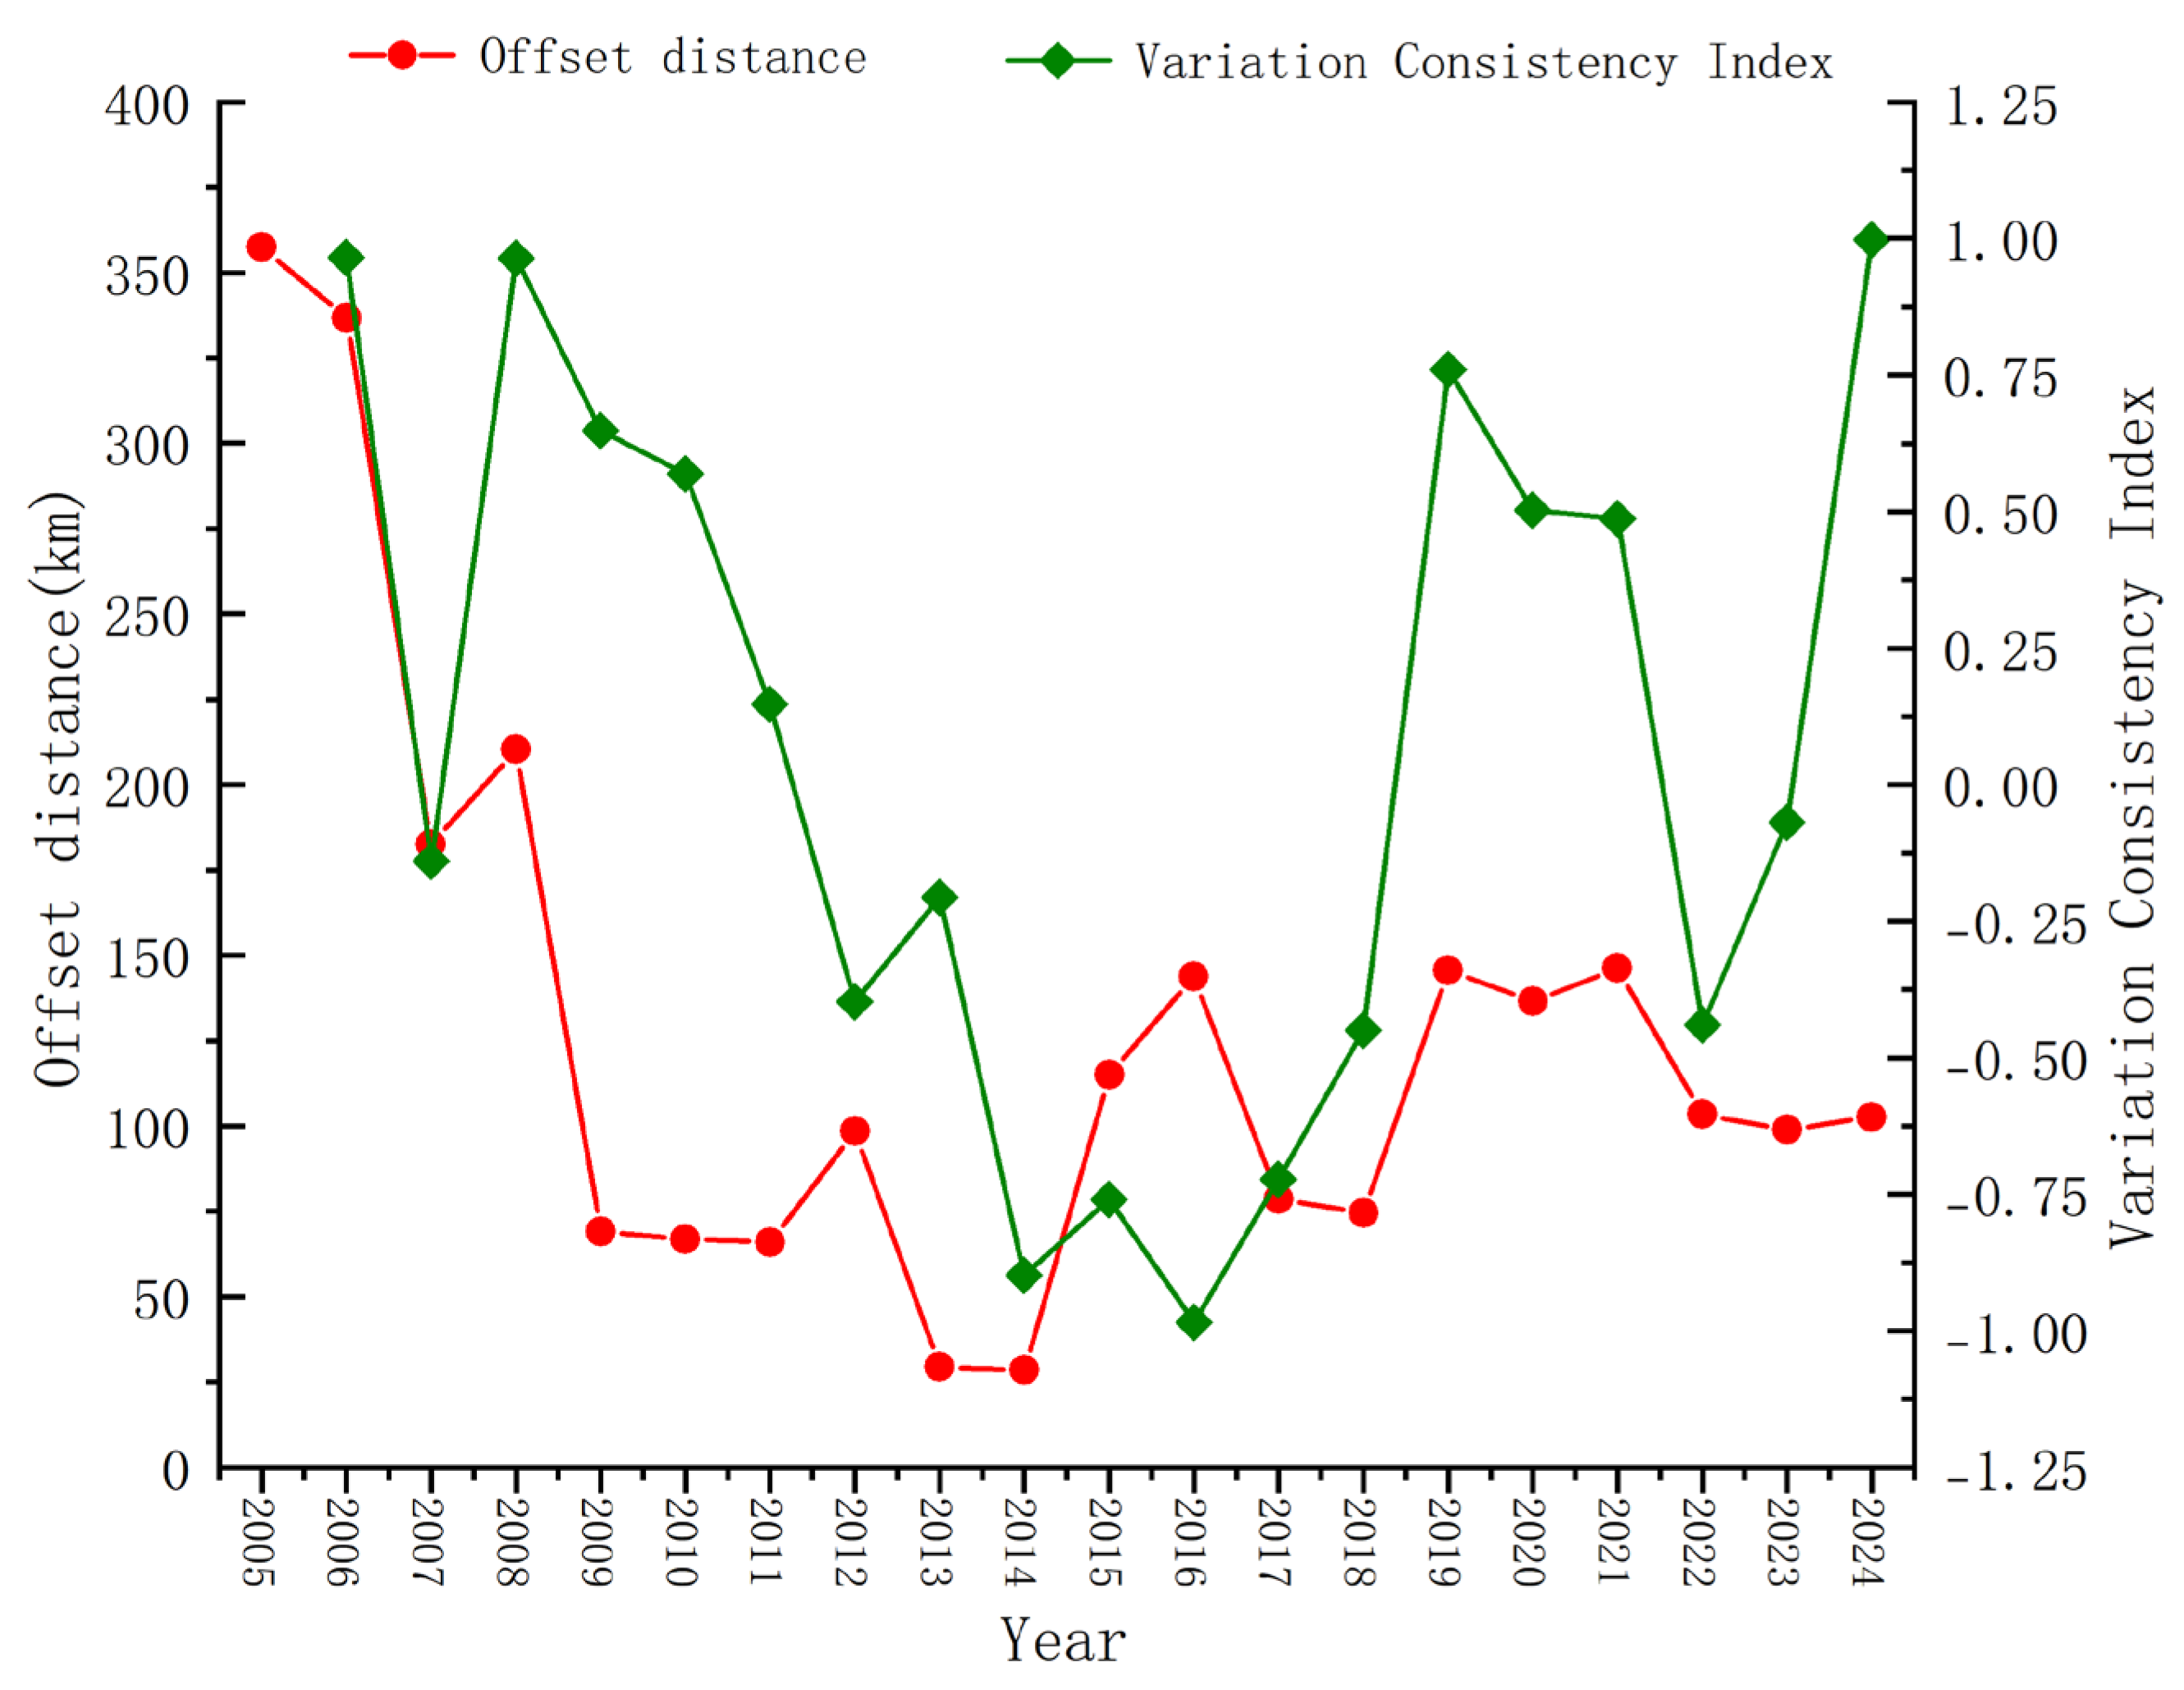
As illustrated in Figure 9, the spatial distance between China’s photovoltaic cell industry and innovation activities has continuously narrowed, decreasing from 357.4 km in 2005 to 102.7 km in 2024, a reduction of 71.3%. The directional consistency index of their spatial movements fluctuated significantly during the observation period, with negative values indicating that directional divergence occurred multiple times between 2012 and 2018. However, in phases such as 2019 and 2024, the index approached 1, suggesting a high degree of directional alignment. Overall, the macrospatial relationship between industry and innovation is characterized by the continuous convergence of spatial distance and intertwining, interactive trajectories. The spatial distance fluctuated from 115 km in 2015 to 102.7 km in 2024, with the directional consistency index reaching an exceptionally high value of 0.998 in 2024. This pattern is consistent with a spatial association between manufacturing and R&D activities, but the gravity center convergence alone does not demonstrate causality.

3.4.2. Location Quotient Patterns of Industrial and Innovation Activities in Major Cities

Based on the comparative relationship between the industrial location quotient ( L Q E m ) and the innovation location quotient ( L Q I m ) relative to the benchmark value of 1, a four-quadrant classification system can be constructed, as illustrated in Figure 10:
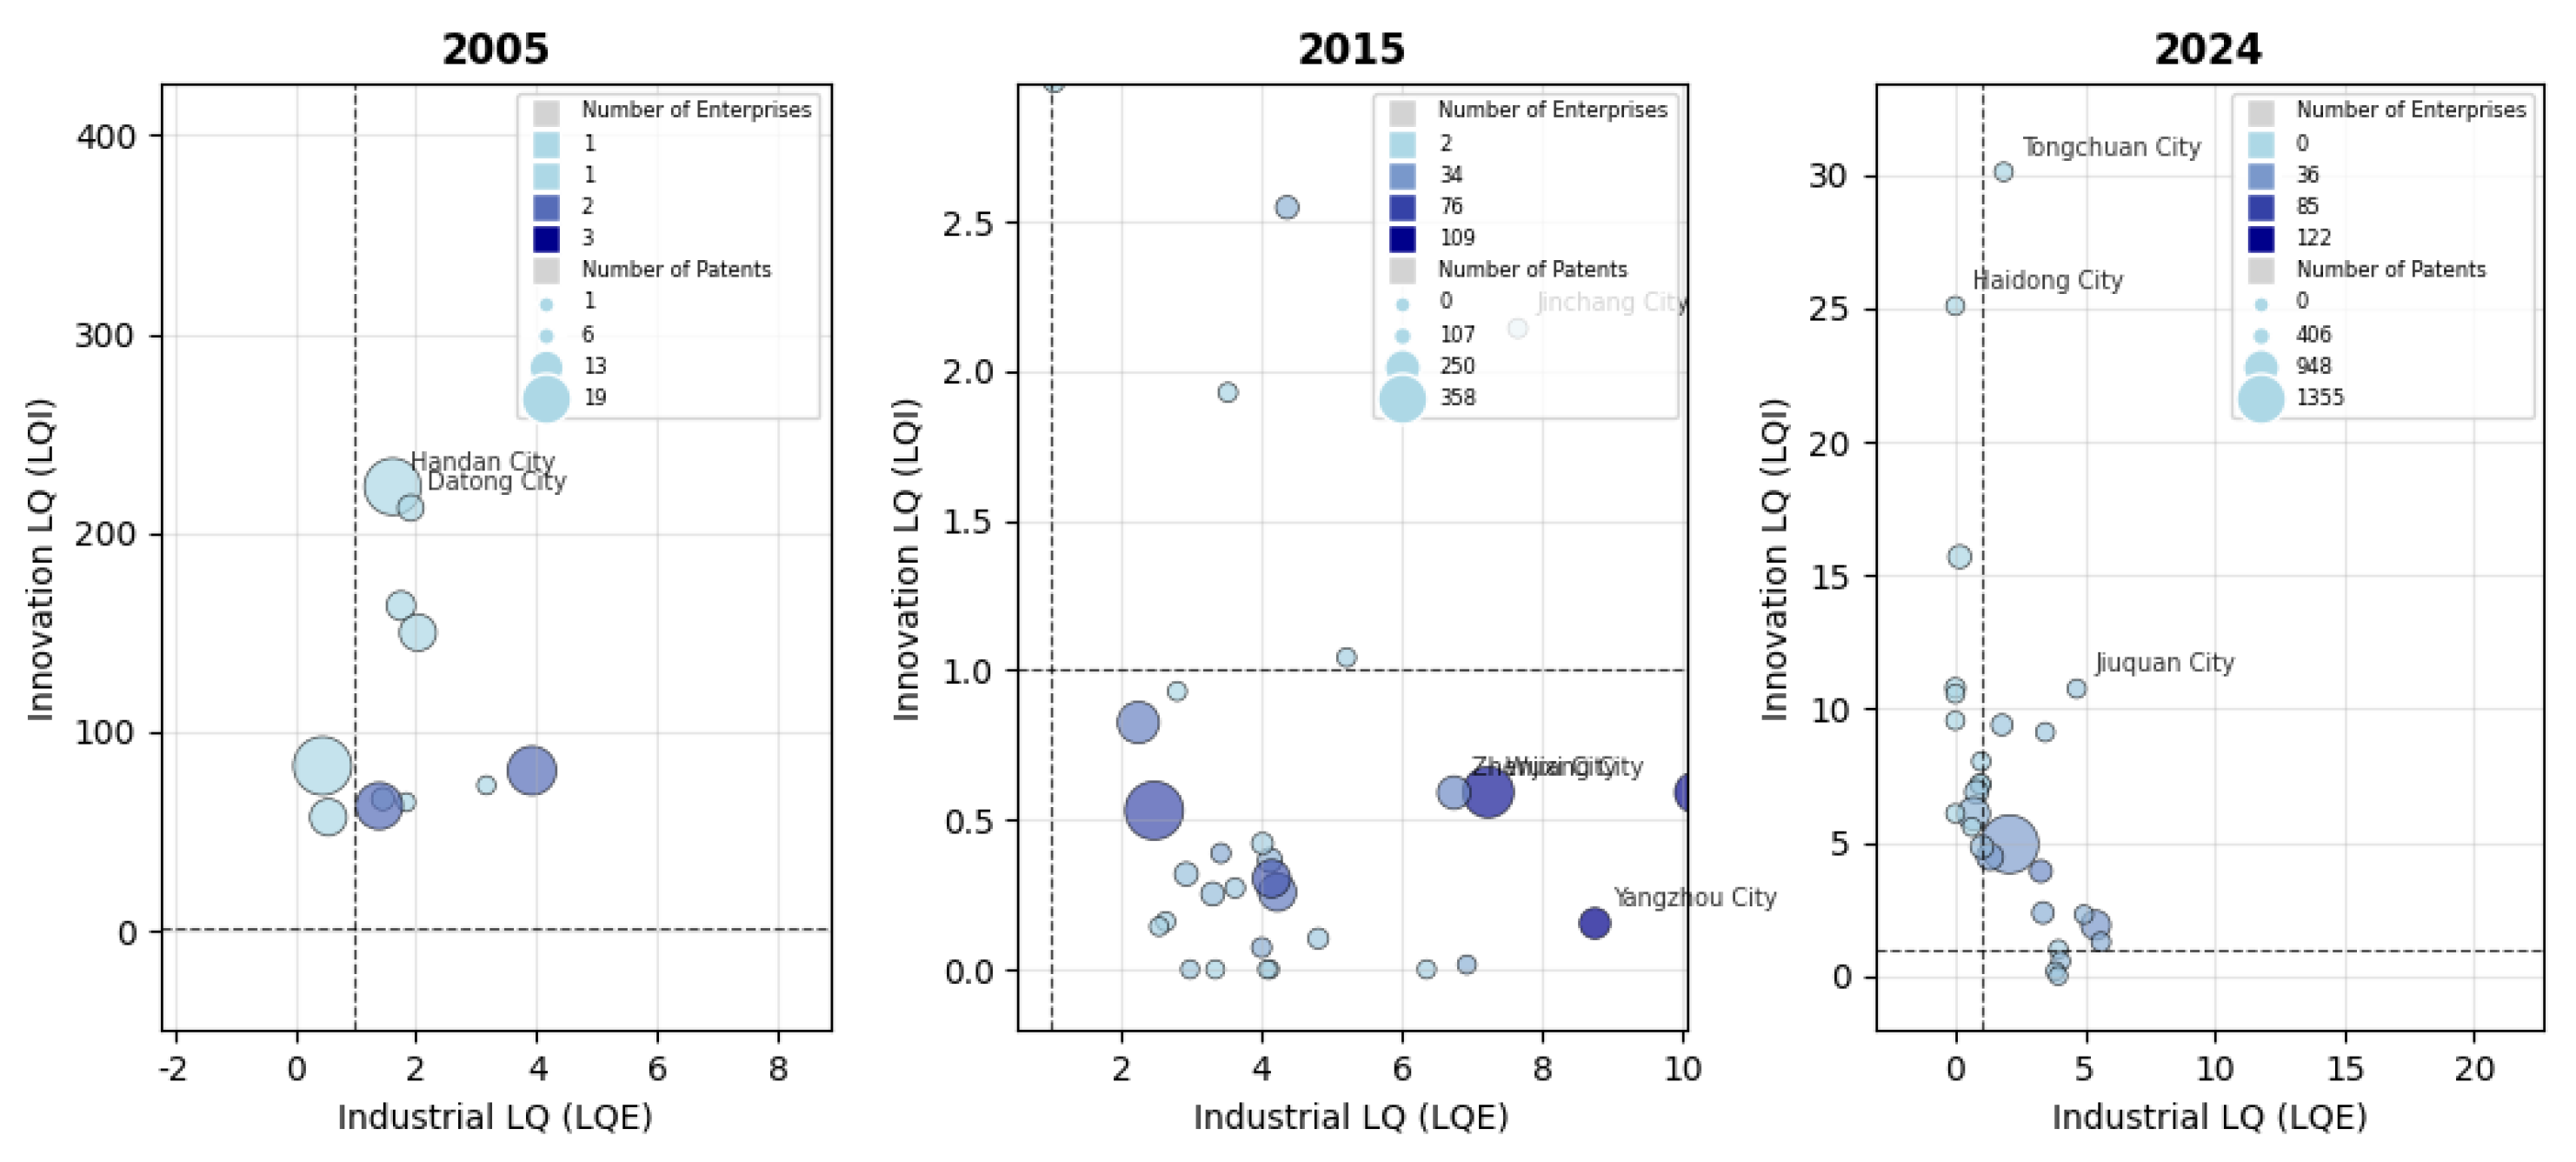
As illustrated in Figure 11, in 2005, the industry was still in its nascent stage, with the majority of cities classified as L-L type. Only a few cities, such as Hohhot and Datong, experienced a weak agglomeration of a small number of photovoltaic module OEM enterprises, driven by early new energy pilot policies. However, constrained by the low level of technological maturity of the industry and insufficient corporate R&D investment, effective agglomeration failed to materialize. By 2015, the sector had entered a phase of rapid development. Suqian, leveraging the capacity expansion and production line technological upgrades of local crystalline silicon module manufacturing leaders, evolved into an H-H-type city, hosting more than 40 photovoltaic cell enterprises and more than 100 patents. In contrast, Yangzhou, despite hosting photovoltaic cell supporting material enterprises, exhibited H-L-type characteristics due to its innovation resources being predominantly concentrated in traditional light manufacturing sectors. By 2024, Tongchuan, through its coal-to-electricity transition, introduction of new projects, and R&D subsidy policies, achieved H-H-type agglomeration with 48 photovoltaic cell enterprises and more than 1300 patents. Moreover, Haidong, driven by distributed photovoltaic cell application scenarios enabled by abundant solar resources and combined with industry–university–research collaboration through laboratory co-establishment with local universities, increased to the H-H type category, hosting 46 photovoltaic cell enterprises and more than 400 patents.

3.5. An Analysis of the Driving Mechanisms of China’s Photovoltaic Cell Innovation Development

3.5.1. Selection of Variables

As presented in Table 1, this study examines the driving mechanisms of photovoltaic cell innovation development from the following dimensions:
(1)
Dependent Variable: Innovation development level, specifically measured by photovoltaic cell innovation output. This indicator is typically represented by the number of patents granted in the field of photovoltaic cell technology within a region.
(2)
Core Explanatory Variable: Industrial agglomeration levels, specifically represented by photovoltaic cell industrial agglomeration and its squared term. The degree of industrial agglomeration is typically used to measure the geographic concentration and specialization level of photovoltaic cell enterprises. The squared term of industrial agglomeration is incorporated into the model to test whether an inverted U-shaped relationship exists between agglomeration effects and innovation.
(3)
Control Variables: In accordance with the methods in the literature [35], this study considers the factors influencing the innovation development level of the photovoltaic cell from the perspectives of the related industrial base, economic foundation conditions, degree of openness to the outside world, and technological innovation environment. Based on the augmented Dickey–Fuller unit root test for stationarity and collinearity diagnostics, in addition to the expected high correlation between industrial agglomeration and its squared term due to model specification, no severe multicollinearity issues were detected among the other control variables (VIF < 8).
For variables with a minimum value of zero, the logarithmic transformation was applied as l n ( x + 1 ) . For all other control variables with strictly positive minima, the standard natural logarithm l n ( x ) was used.
While the number of photovoltaic cell enterprises and the number of patents are widely used and valid proxies for industrial agglomeration and innovation output, they are not without limitations. Enterprise counts primarily capture the scale and geographic concentration of firms but do not directly reflect production capacity, inter-firm collaboration, value added along the industrial chain, or the degree of actual chain coordination. Similarly, patent counts provide a measure of inventive activity but do not capture innovation quality, technological significance, citation impact, or the distinction between incremental and radical innovation. These indicators are therefore best interpreted as quantitative approximations of the underlying constructs rather than as comprehensive measures of chain performance or innovation depth. Throughout the following analysis, we interpret the empirical findings with these caveats in mind, and we return to them explicitly in the discussion of policy implications.

3.5.2. Spatial Econometric Model Specification and Testing

Based on considerations of data availability and sample representativeness, the period from 2015 to 2023 was selected as the study timeframe. During this period, the number of photovoltaic industry enterprises and patents tended to stabilize, ensuring the reliability and explanatory power of the spatial spillover effect analysis. As shown in Table 2, the global Moran’s I values were significantly positive from 2015 to 2023, indicating the presence of spatial clustering characteristics. Therefore, the incorporation of a spatial econometric model is necessary to mitigate spatial errors.
Based on the spatial agglomeration characteristics of industrial and innovation activities revealed in the preceding analysis, this study employs a spatial contiguity matrix as the spatial weighting matrix. To mitigate the influence of heteroscedasticity, all the variables in the model are logarithmically transformed. To accurately capture the spatial effects of industrial agglomeration levels on innovation development levels, a sequential process of LM tests, Hausman tests, LR tests, and Wald tests was conducted to determine the optimal spatial econometric model. As shown in Table 3, all the test results are significant at the 5% level, confirming the presence of spatial dependence in the data and indicating that the two-way fixed-effects spatial Durbin model (SDM), which incorporates both individual and time effects, is more effective at capturing the spatial interaction effects between the explanatory variables and the dependent variable. Therefore, this study ultimately adopts this model for empirical analysis.

3.5.3. Analysis of Spatial Spillover Effects

In this study, the spatial Durbin model is employed for estimation. To further examine the impact of spatial spillover effects, the total effect is decomposed into direct and indirect effects using the partial differential method. To verify the robustness of the model results, we conducted a robustness test by replacing the original Matrix with Sequence Contiguity Matrix, Inverse Square Sequence-Distance Matrix and Sequence-Based 5-Nearest Neighbor Matrix. The economic distance matrix offers three key advantages: the innovation spillover effects in the photovoltaic cell are primarily transmitted through economic channels such as supply chain collaboration, capital flows, technology trade, and labor mobility, rather than relying solely on geographical proximity; the weight matrix constructed based on economic factors directly captures these transmission pathways. Unlike the adjacency matrix, the economic distance matrix assigns positive weights to each city pair, thereby naturally addressing the “isolated city” issue—regions lacking geographically adjacent cities would otherwise be excluded or assigned zero weight. Furthermore, regions with similar levels of economic development typically possess greater knowledge absorption capabilities, facilitating more effective knowledge spillover effects, a principle precisely reflected by the inverse differentiation formula.
As shown in Table 4 and Table 5, to verify the robustness of the conclusions, we subsequently decomposed the SDM using three distinct matrices. All matrices underwent row normalization to ensure comparability of weighted averages across varying numbers of neighboring cities. For the Sequence Contiguity Matrix, cities without any neighbors retained zero rows and zero values after normalization, accurately reflecting their absence of direct economic spillover effects from adjacent regions. In the Sequence-Based 5-Nearest Neighbor Matrix, each city was required to have exactly five connections (this requirement was ensured by our equilibrium sample of 285 cities), thereby excluding isolated cities. Both the economic distance matrix and the Inverse Square Sequence-Distance Matrix assigned positive weights to all i j relationships, ensuring no city was excluded.
(1) The agglomeration of the photovoltaic cell affects urban innovation through both direct and indirect channels. Under the Sequence Contiguity Matrix, the direct effect of industrial agglomeration ( x 1 ) is significantly positive, and its indirect effect is also significantly positive. Under the economic distance matrix, the direct effect is positive but not significant, whereas the indirect effect is significantly positive. Under the Inverse Square Sequence-Distance Matrix, both the direct and indirect effects are significantly positive. Under the Sequence-Based 5-Nearest Neighbor Matrix, both effects are significantly positive. The squared agglomeration term ( x 2 ) exhibits negative effects across specifications. Under the Sequence Contiguity Matrix, both direct and indirect effects are significantly negative. Under the economic distance matrix, the direct effect is negative but not significant, while the indirect effect is significantly negative. Under the Inverse Square Sequence-Distance Matrix, the direct effect is negative but not significant, and the indirect effect is significantly negative. Under the Sequence-Based 5-Nearest Neighbor Matrix, both direct and indirect effects are significantly negative. These findings confirm an inverted U-shaped relationship: excessive agglomeration beyond an optimal level suppresses innovation locally and in neighboring regions.
(2) The innovation landscape is shaped by multiple factors. For the number of photovoltaic enterprises ( x 3 ), under the Sequence Contiguity Matrix, the direct and indirect effects are significantly negative; under the economic distance matrix, the direct effect is significantly negative at the 10% level and the indirect effect is significantly negative at the 1% level; under the Inverse Square Sequence-Distance Matrix, the direct effect is significantly negative at the 10% level and the indirect effect at the 1% level; under the Sequence-Based 5-Nearest Neighbor Matrix, both effects are significantly negative. For the number of manufacturing employees ( x 4 ), under the Sequence Contiguity Matrix, both direct and indirect effects are significantly positive; under the economic distance matrix, the direct effect is not significant but the indirect effect is significantly positive; under the Inverse Square Sequence-Distance Matrix, both effects are significantly positive; under the Sequence-Based 5-Nearest Neighbor Matrix, both effects are significantly positive. For the share of secondary industry ( x 6 ), under the Sequence Contiguity Matrix, the direct effect is significantly positive and the indirect effect is significantly positive; under the economic distance matrix, neither effect is significant; under the Inverse Square Sequence-Distance Matrix, the direct effect is not significant while the indirect effect is significantly positive; under the Sequence-Based 5-Nearest Neighbor Matrix, the direct effect is not significant and the indirect effect is significantly positive. For actual utilized foreign capital ( x 8 ), under the Sequence Contiguity Matrix, the direct effect is not significant but the indirect effect is significantly negative; under the economic distance matrix, both direct and indirect effects are significantly negative; under the Inverse Square Sequence-Distance Matrix, the direct effect is not significant while the indirect effect is significantly negative; under the Sequence-Based 5-Nearest Neighbor Matrix, the direct effect is not significant and the indirect effect is significantly negative. For the share of science and education expenditure ( x 9 ), under all four matrices, the direct effect is significantly positive and the indirect effect is not significant. For internal R&D expenditure ( x 10 ), under the Sequence Contiguity Matrix, neither effect is significant; under the economic distance matrix, the direct effect is not significant and the indirect effect is significantly negative; under the Inverse Square Sequence-Distance Matrix, neither effect is significant; under the Sequence-Based 5-Nearest Neighbor Matrix, neither effect is significant. For the number of higher education institutions ( x 11 ), under the Sequence Contiguity Matrix, the direct effect is not significant and the indirect effect is significantly negative; under the economic distance matrix, neither effect is significant; under the Inverse Square Sequence-Distance Matrix, the direct effect is not significant and the indirect effect is significantly negative; under the Sequence-Based 5-Nearest Neighbor Matrix, the direct effect is not significant and the indirect effect is significantly negative.
Before proceeding to the regional heterogeneity analysis, it is crucial to clarify its logical connection with the preceding spatial evolution and coupling analyses. The descriptive results from the earlier sections have revealed marked east–west disparities in both industrial and innovation agglomerations; however, such descriptive patterns alone are insufficient to confirm two key points: whether these observed disparities are statistically significant, and whether the inverted U-shaped relationship between agglomeration and innovation—identified in the previous analyses—holds consistently across different regions. This research gap necessitates a formal test of spatial heterogeneity. In this way, the logical chain from detecting descriptive patterns to testing hypotheses through spatial econometric methods is completed, ensuring tight coherence between empirical observation and scientific inference.
Furthermore, considering the significant disparities in geographical location, industrial foundation, and economic development levels across different regions in China, it is reasonable to infer that the driving effect of industrial agglomeration on urban innovation may exhibit distinct regional heterogeneity—an issue that deserves in-depth investigation [36]. To verify this inference, this study divides the full sample into eastern, central, and western regions and conducts subsample regression analyses. As shown in Table 6, the regression results generally support the existence of an inverted U-shaped relationship between industrial agglomeration and innovation output across these regions, further confirming the spatial heterogeneity of this relationship.

4. Key Findings and Discussion

4.1. Key Findings

With respect to the photovoltaic cell industrial chain and innovation chain in China from the perspective of patent intelligence, this paper employs a combination of methods, including the spatial centroid model, location quotient analysis, and spatial econometrics, to investigate their spatiotemporal evolution pathways, coupling characteristics, and influencing mechanisms. Based on the results in Section 3.1, Section 3.2, Section 3.3, Section 3.4 and Section 3.5, the following quantifiable patterns are observed: temporal phasing: enterprise and patent growth rates accelerated after 2015 (Figure 3); spatial differentiation: the industrial gravity center shifted from (32.03° N, 116.74° E) in 2005 to (31.13° N, 115.27° E) in 2024, and the innovation gravity center from (35.24° N, 116.69° E) to (30.92° N, 116.32° E) (Figure 7 and Figure 8); driving mechanisms: the spatial Durbin model (Table 5) shows significant direct and indirect effects for agglomeration and its square term.
(1) In terms of spatiotemporal evolution, both the industrial scale and innovation output of China’s photovoltaic cell sector have exhibited exponential growth, characterized by distinct phased and regional evolutionary patterns. Temporally, the year 2015 marks a pivotal juncture where both enterprise and patent growth rates increased (Figure 3). This timing coincides with the domestic grid parity policy and global energy transition, but causal attribution is not made in this study. Spatially, the configuration of the industrial chain has undergone the following profound transformation: evolving from an initial concentration in eastern hub cities such as Beijing and Shanghai to agglomeration within coastal manufacturing belts represented by the Yangtze River Delta and the Pearl River Delta and, further, to a strategic adjustment characterized by westward migration alongside eastern optimization. Concurrently, the spatial configuration of the innovation chain has shifted from an early focus on research-intensive cities such as Beijing and Shanghai to a high concentration within the industrial clusters of the Yangtze River Delta and Pearl River Delta, ultimately culminating in a networked innovation system defined by national interconnection and multipolar coordination.
(2) In terms of spatial coupling, the spatial interaction between the photovoltaic cell industrial chain and innovation chain has complex characteristics characterized by the coexistence of “macrolevel synergistic evolution and city-level heterogeneous matching”. From a macro perspective, the industrial centroid and innovation centroid both migrated, with their spatial distance decreasing from 357.4 km (2005) to 102.7 km (2024) (Figure 9). From a city-level perspective, the location quotient analysis (Section 3.4.2) shows that a subset of cities (e.g., Tongchuan, Haidong) exhibit H-H agglomeration, while many other cities remain in L-L or mismatched states (as illustrated in Figure 11). This finding underscores the complexity and imbalance inherent in the spatial coupling of dual chains at the city level.
(3) Regarding the influencing mechanisms, the analysis reveals that innovation in the photovoltaic cell is a complex process predominantly driven by industrial agglomeration and synergistically influenced by multiple dimensions. The spatial Durbin model (Table 5) shows that the squared agglomeration term has a significantly negative indirect effect across all four spatial weight matrices (p < 0.05). This is consistent with an inverted-U shaped relationship, where very high agglomeration levels are associated with reduced innovation in neighboring regions. The exact threshold is not estimated in this study.
Before discussing policy implications, it is important to restate the limitations of our empirical proxies. The conclusions about industrial chain development draw primarily on enterprise counts, which do not measure real production capacity, vertical integration, or value added at different chain segments. Conclusions about innovation development rely on patent counts, which do not distinguish between high-value and low-value patents, nor do they capture tacit knowledge, R&D collaboration networks, or successful commercialisation. Moreover, while our spatial econometric models identify statistically significant associations and spatial spillovers, the research design is observational rather than experimental. Therefore, the findings should be interpreted as evidence of correlation and spatial interdependence, not as definitive causal statements. Policy recommendations derived from these results are suggestive and exploratory; they are intended to inform targeted investigations and pilot programs rather than to prescribe large-scale interventions with high certainty.

4.2. Discussion

Based on the empirical findings, several strategic directions may be considered for enhancing the indigenous controllability and global competitiveness of China’s photovoltaic industry.
(1)
Spatial configuration of the dual chains.
Based on the observed westward migration of the industrial centroid and the directional consistency between the industrial and innovation centroids (Section 3.4.1), one exploratory policy direction is a place-based approach. Resource-rich central and western regions might leverage their advantages in green electricity and mineral resources to focus on upstream segments, while eastern coastal regions could continue to concentrate on high-value-added midstream and downstream segments. This suggestion is derived from spatial patterns only, not from causal estimates. Pilot programs would be needed to test its effectiveness.
(2)
Factor synergy and the agglomeration trap.
The spatial Durbin model (Table 5) shows that the squared agglomeration term has significantly negative indirect effects across all four spatial weight matrices. This is consistent with an inverted-U relationship, implying that beyond some (unspecified) threshold, further concentration may be associated with lower innovation returns in neighboring regions. Policymakers may consider monitoring for a possible “agglomeration trap” driven by homogeneous scale expansion. However, because the exact threshold is not estimated here, any policy intervention should be preceded by local pilot studies.
(3)
Regionally differentiated policies.
Drawing on the regional subsample results (Table 6), where coefficients for agglomeration (ln x1) differ across east (1.358, p < 0.01), central (0.771, p < 0.01), and west (0.939, p < 0.01), policies tailored to regional development stages may be considered. In eastern regions, priority could be given to removing barriers to innovation factor flows. In central regions, improving the connection between manufacturing and R&D appears promising. Western regions might raise the quality of industrial undertaking through technology introduction and talent cultivation. These suggestions are based on associative evidence and require further validation.
All of the above suggestions are preliminary and would benefit from further case-level validation and policy experimentation. They should be viewed as hypotheses to be tested, not as definitive prescriptions.
However, this study has certain limitations. At the level of policy analysis, although the necessity of regionally differentiated governance is identified, the specific action pathways, synergistic effects, and dynamic performance of various policies have not been thoroughly evaluated. In terms of data dimensions, the study relies primarily on quantitative indicators such as the number of enterprises and patents, which inadequately capture qualitative characteristics, including industrial chain value added, innovation quality, and interactions among diverse actors. With respect to theoretical mechanisms, the exploration of mediating pathways, such as knowledge spillovers and factor mobility, as well as their moderating mechanisms within the coupling of the dual chains, remains relatively underdeveloped. Future research could further integrate multisource data and diverse methodologies to deepen the investigation of policy mechanisms, thereby providing a more robust empirical foundation for the coordinated development of industrial and innovation chains.

Author Contributions

Conceptualization, Y.L.; methodology, M.L.; software, M.L.; validation, Y.L.; formal analysis, Q.D. and X.W.; investigation, M.L. and Q.D.; resources, Y.L.; data curation, M.L. and X.W.; writing—original draft preparation, M.L.; writing—review and editing, Q.D.; visualization, X.W. and Q.D.; supervision, Y.L.; Project administration, Y.L.; Funding acquisition, Y.L. All authors have read and agreed to the published version of the manuscript.

Funding

This research was supported by the Science Foundation of the Ministry of Education of China (No. 21YJC630072), the Key Talent Project of the Yan Zhao Golden Platform for Talent Attraction in Hebei Province, China (No. HJYB202528) and the 22nd Student Research Project of Hebei GEO University, China (No. KAY202625).

Institutional Review Board Statement

Not applicable.

Informed Consent Statement

Not applicable.

Data Availability Statement

All data generated or analyzed during this study are included in this published article.

Conflicts of Interest

The authors declare no conflicts of interest.

References

  1. Zhang, P.; Li, Z.; Ghardallou, W.; Xin, Y.; Cao, J. Nexus of institutional quality and technological innovation on renewable energy development: Moderating role of green finance. Renew. Energy 2023, 214, 233–241. [Google Scholar] [CrossRef] [Scilit]
  2. Akhter, M.; Al Mansur, A.; Islam, I.; Lipu, M.S.H.; Karim, T.F.; Abdolrasol, M.G.M.; Alghamdi, T.A.H. Sustainable strategies for crystalline solar cell recycling: A review on recycling techniques, companies, and environmental impact analysis. Sustainability 2024, 16, 5785. [Google Scholar] [CrossRef] [Scilit]
  3. Zhu, S.; Xiang, N.; Xu, F. Unveiling regional disparities in China’s photovoltaic development capability through a multidimensional assessment framework. Energy Sustain. Dev. 2026, 92, 101976. [Google Scholar] [CrossRef] [Scilit]
  4. Kurtoğlu, M.; Eroğlu, F. Current trends and challenges in solar PV-integrated battery energy storage technology: Key components, methods, and future prospects. Appl. Energy 2026, 409, 127461. [Google Scholar] [CrossRef] [Scilit]
  5. Lin, M.; Wu, Y.; Qin, B.; Cao, W.; Liu, J.; Xu, Z.; Ruan, J. Response to the upcoming emerging waste: Necessity and feasibility analysis of photovoltaic waste recovery in China. Environ. Sci. Technol. 2022, 56, 17396–17409. [Google Scholar] [CrossRef] [Scilit]
  6. Yang, Y.; Zha, D.; Wu, Y. City-level photovoltaic deployment roadmap in China. Renew. Energy 2026, 262, 125334. [Google Scholar] [CrossRef] [Scilit]
  7. Teng, Y.; Lin, B. The energy-saving effect of industrial chain synergistic division: Evidence from China’s industrial chain. Energy Policy 2024, 185, 113925. [Google Scholar] [CrossRef] [Scilit]
  8. Zhang, R.; Ji, C.; Tan, L.; Sun, Y. Evaluation and construction of the capacities of urban innovation chains based on efficiency improvement. PLoS ONE 2022, 17, e0274092. [Google Scholar] [CrossRef] [Scilit] [PubMed]
  9. Xu, Y.; Hunjra, A.I.; Mishra, T.; Zhao, S. Carbon neutrality and synergy between industrial and innovation chains: Green finance perspective. Int. J. Prod. Res. 2025, 63, 8295–8319. [Google Scholar] [CrossRef] [Scilit]
  10. Ivanov, D. The Industry 5.0 framework: Viability-based integration of the resilience, sustainability, and human-centricity perspectives. Int. J. Prod. Res. 2023, 61, 1683–1695. [Google Scholar] [CrossRef] [Scilit]
  11. Ghobakhloo, M.; Mahdiraji, H.A.; Iranmanesh, M.; Jafari-Sadeghi, V. From Industry 4.0 digital manufacturing to Industry 5.0 digital society: A roadmap toward human-centric, sustainable, and resilient production. Inf. Syst. Front. 2024. Epub ahead of print. [Google Scholar] [CrossRef] [Scilit]
  12. Yang, Q.; Su, Q.; Qiao, J.; Zhang, Z. Realizing supply chain benefits through technological-development-oriented supply chain innovation: The mediating role of supply chain transparency and supply chain embeddedness. IEEE Trans. Eng. Manag. 2025, 72, 3215–3235. [Google Scholar] [CrossRef] [Scilit]
  13. Javed, A.; Basit, A.; Shahzad, M.A.; Khan, M.K. Green supply chain integration and knowledge dynamics: A pathway to incremental and radical green innovation. J. Knowl. Manag. 2026, 30, 1843–1864. [Google Scholar] [CrossRef] [Scilit]
  14. Vu, T.N.Q.; Nguyen, N.A.; Nguyen, K.H.; Pham, V.K. Navigating the Green Transition: Drivers, Barriers, and Policy Implications for Circular Economy Adoption Among Logistics SMEs in an Emerging Economy. Sustainability 2025, 18, 55. [Google Scholar] [CrossRef] [Scilit]
  15. Sun, F.; Guo, J.; Huang, X.; Shang, Z.; Jin, B. Spatio-temporal characteristics and coupling coordination relationship between industrial green water efficiency and science and technology innovation: A case study in China. Ecol. Indic. 2024, 159, 111651. [Google Scholar] [CrossRef] [Scilit]
  16. Mu, X.; Zou, T. Policy mechanisms and spatial dynamics of low-carbon city construction in promoting inclusive green growth in China. Front. Environ. Sci. 2025, 13, 1559528. [Google Scholar] [CrossRef] [Scilit]
  17. Chang, X.; Wu, Z.; Wang, J.; Zhang, X.; Zhou, M.; Yu, T.; Wang, Y. The coupling effect of carbon emission trading and tradable green certificates under electricity marketization in China. Renew. Sustain. Energy Rev. 2023, 187, 113719. [Google Scholar] [CrossRef] [Scilit]
  18. Marimuthu, V.; Sebi, M.J.; Sankaran, M. Development of spatial econometric models for estimating bicycle sharing trip activity. Sustain. Cities Soc. 2023, 98, 104845. [Google Scholar] [CrossRef] [Scilit]
  19. Chen, Y.; Zhuang, G.; Yang, Y. Be a model for neighbour provinces: Research on the spatiotemporal differences and influencing factors of energy intensity in China. Energy 2025, 320, 134601. [Google Scholar] [CrossRef] [Scilit]
  20. Zhang, C.; Lv, W.; Zhang, P.; Song, J. Multidimensional spatial autocorrelation analysis and it’s application based on improved Moran’s I. Earth Sci. Inform. 2023, 16, 3355–3368. [Google Scholar] [CrossRef] [Scilit]
  21. Salgueiro, G.P.; Perobelli, F.S.; Domingues, E.P.; Valério, V.E.d.M. Spatial and socioeconomic factors of distributed photovoltaic generation in Minas Gerais. Energy Econ. 2026, 154, 109121. [Google Scholar] [CrossRef] [Scilit]
  22. Radmehr, R.; Shayanmehr, S.; Baba, E.A.; Samour, A.; Adebayo, T.S. Spatial spillover effects of green technology innovation and renewable energy on ecological sustainability: New evidence and analysis. Sustain. Dev. 2024, 32, 1743–1761. [Google Scholar] [CrossRef] [Scilit]
  23. Li, D.; Heimeriks, G.; Alkemade, F. Knowledge flows in global renewable energy innovation systems: The role of technological and geographical distance. Technol. Anal. Strateg. Manag. 2022, 34, 418–432. [Google Scholar] [CrossRef] [Scilit]
  24. Hou, C.; Ma, Y. An empirical analysis of spatial effects and their driving factors in urban green development using spatial econometric models. Front. Environ. Sci. 2025, 13, 124501. [Google Scholar] [CrossRef] [Scilit]
  25. Zhang, X.; Zhu, S.; Qiu, X.; Huang, B.; Geng, Y.; Shao, S.; Ge, Y. Spatial distribution characteristics and driving factors of volatile organic compounds emissions changes in China: A sectoral and gravity movement analysis. Environ. Dev. Sustain. 2026. Epub ahead of print. [Google Scholar] [CrossRef] [Scilit]
  26. Grether, J.-M.; Mathys, N.A. Is the World’s Economic Centre of Gravity Already in Asia? Area 2010, 42, 47–50. [Google Scholar] [CrossRef] [Scilit]
  27. Powers, S.L.; Pitas, N.A.; Rice, W.L. Applying location quotient methodology to urban park settings with mobile location data: Implications for equity and park planning. Urban For. Urban Green. 2024, 98, 128418. [Google Scholar] [CrossRef] [Scilit]
  28. Haggett, P. Locational Analysis in Human Geography; Edward Arnold: London, UK, 1962. [Google Scholar]
  29. Jiang, X.; Liu, Q. Spatial agglomeration identification and agglomeration zoning of semiconductor industry in China. Econ. Geogr. 2024, 44, 108–117. [Google Scholar]
  30. Yan, M.; Yan, M.; Zhao, J. Manufacturing agglomeration and high-quality economic development: Unveiling nonlinear dynamics and spatial spillovers in China. Appl. Geogr. 2026, 186, 103833. [Google Scholar] [CrossRef] [Scilit]
  31. LeSage, J.P.; Pace, R.K. Introduction to Spatial Econometrics; CRC Press Taylor & Francis Group: Boca Raton, FL, USA, 2009. [Google Scholar]
  32. Quah, D.T. Regional convergence clusters across Europe. Eur. Econ. Rev. 1996, 40, 951–958. [Google Scholar] [CrossRef] [Scilit]
  33. GB/T 2260-2007; Codes for Administrative Divisions of the People’s Republic of China. China Standards Press: Beijing, China, 2007.
  34. Zhang, L.; Wang, J.; Wen, H.; Fu, Z.; Li, X. Operating performance, industry agglomeration and its spatial characteristics of Chinese photovoltaic industry. Renew. Sustain. Energy Rev. 2016, 65, 373–386. [Google Scholar] [CrossRef] [Scilit]
  35. Feng, Z.; Li, Y.; Tang, S.; Hao, P.; Jun, N.; Liu, G.; Shi, L. Spatiotemporal evolution and driving factors of carbon emissions in China’s photovoltaic industry. ACS Omega 2026, 11, 4521–4535. [Google Scholar] [CrossRef] [Scilit] [PubMed]
  36. Zhu, C.; Lee, C.C. Big city, big innovation? Evidence from city-county consolidation in China. Cities 2026, 172, 106825. [Google Scholar] [CrossRef] [Scilit]
Figure 1. Research Framework (Source: authors’ own construction).
Systems 14 00605 g001
Figure 2. Structural division of the photovoltaic cell industry chain (Source: authors’ construction based on the relevant literature).
Systems 14 00605 g002
Figure 3. Temporal changes in the number of enterprises and patents in China’s photovoltaic cell industry (Source: authors’ calculation based on Qcc.com (accessed on 15 October 2025) and PatSnap (Patsnap Information Technology (Suzhou) Co., Ltd. (Suzhou, China)).
Systems 14 00605 g003
Figure 4. Evolution of enterprise scale in China’s photovoltaic cell industry (Source: authors’ calculation based on Qcc.com, accessed on 15 October 2025).
Systems 14 00605 g004
Figure 5. Spatial distribution of the industrial chain of China’s photovoltaic cell industry (Source: authors’ calculation; base map from Ministry of Natural Resources of China (GS(2023)2767), and the green box denotes the South China Sea Islands of China). (Note: 2023. The base map boundaries have not been modified. The same applies to Figure 6, Figure 7 and Figure 8.).
Systems 14 00605 g005
Figure 6. Spatial distribution of the innovation chain of China’s photovoltaic cell industry (Source: authors’ calculation; base map from Ministry of Natural Resources of China (GS(2023)2767), and the green box denotes the South China Sea Islands of China).
Systems 14 00605 g006
Figure 7. Migration trajectory of the industrial gravity center of China’s photovoltaic cell industry (2005–2024) (Source: authors’ calculation; base map from Ministry of Natural Resources of China (GS(2023)2767)).
Systems 14 00605 g007
Figure 8. Migration trajectory of the innovation gravity center of China’s photovoltaic cell industry (2005–2024) (Source: authors’ calculation; base map from Ministry of Natural Resources of China (GS(2023)2767)).
Systems 14 00605 g008
Figure 9. Dynamic changes in the spatial overlap and change consistency of dual centroids (Source: authors’ calculation based on Qcc.com (accessed on 15 October 2025) and PatSnap). (Note: Patsnap Information Technology (Suzhou) Co., Ltd. (Suzhou, China)).
Systems 14 00605 g009
Figure 10. Four-Quadrant Evaluation Model (Source: authors’ construction based on relevant literature).
Systems 14 00605 g010
Figure 11. Analysis of the synergy between the photovoltaic cell industry and innovation in China (Source: authors’ calculation based on Qcc.com(accessed on 15 October 2025) and PatSnap (Note: The two dashed lines are both bounded by the value of 1.)
Systems 14 00605 g011
Table 1. Descriptive statistics (Source: authors’ calculation).
NatureVariable TypeVariable NameSymbolMinMaxTransformation
Dependent VariableInnovation Development LevelPhotovoltaic Cell Innovation Output (count) y 0973ln (y + 1)
Core Explanatory VariableIndustrial Agglomeration LevelPhotovoltaic Cell Industrial Agglomeration x 1 09.94ln (x1 + 1)
Square of Photovoltaic Cell Industrial Agglomeration x 2 098.82ln (x2 + 1)
Control VariableRelated Industrial BaseNumber of Photovoltaic Cell Enterprises x 3 0554ln (x3 + 1)
Economic Foundation ConditionsNumber of Manufacturing Employees (in 10,000 persons) x 4 0.01259ln (x4)
Total Fixed Asset Investment (10,000 yuan) x 5 27701.72 × 108ln (x5)
Proportion of Secondary Industry Value Added in GDP (%) x 6 5.2591.614ln (x6)
Degree of OpennessTotal Value of Imports and Exports of Goods (10,000 yuan) x 7 344.21 × 10⁸ln (x7)
Actual Utilized Foreign Capital (10,000 USD) x 8 03.08 × 10⁶ln (x8 + 1)
Technological Innovation EnvironmentProportion of Science and Education Expenditure (%) x 9 2.0885.3ln (x9)
Internal R&D Expenditure (10,000 yuan) x 10 52.23 × 10⁷ln (x10)
Number of Higher Education Institutions (number) x 11 193ln (x11)
Table 2. Global Moran’s I and Significance Levels (Source: authors’ calculation).
YearIE (I)Sd (I)Zp-Value
20150.392−0.0040.0409.8390.000
20160.404−0.0040.04010.1240.000
20170.142−0.0040.0403.6260.000
20180.208−0.0040.0405.2620.000
20190.169−0.0040.0404.2940.000
20200.175−0.0040.0404.4400.000
20210.226−0.0040.0405.7050.000
20220.202−0.0040.0405.1160.000
20230.247−0.0040.0406.2440.000
Table 3. Test results of the spatial econometric model (Source: authors’ calculation).
Test StatisticStatistic Valuep-ValueTest StatisticStatistic Valuep-Value
LM–Error22,000.000 ***0.000LR-test (time nested)2004.58 ***0.000
LM–Lag19,000.000 ***0.000LR Lag40.90 ***0.000
Robust LM–Error3221.884 ***0.000LR Error40.52 ***0.000
Robust LM–Lag266.464 ***0.000Wald Lag27.10 ***0.004
Hausman198.67 ***0.000Wald Error24.17 ***0.012
LR-test (individual nested)20.28 ***0.009
Note: *** p < 0.01.
Table 4. SDM Estimation Results (economic distance matrix) (Source: authors’ calculation).
VariableCoefficient (β)Std. Err.p-ValueWx (θ)Std. Err.p-Value
l n x 1 0.2060.1960.2931.343 **0.5570.016
l n x 2 −0.0440.0770.568−0.623 **0.2700.021
l n x 3 −0.0610.0500.222−0.287 ***0.0790.000
l n x 4 −0.0370.0740.6170.812 ***0.2290.000
l n x 5 −0.0460.1350.733−0.1100.5630.845
l n x 6 0.1200.1160.3010.0560.3290.865
l n x 7 −0.0030.0050.5480.039 **0.0180.030
l n x 8 −0.0070.0130.590−0.192 ***0.0520.000
l n x 9 1.742 **0.7910.028−0.8262.3600.726
l n x 10 −0.0040.0150.788−0.142 **0.0690.040
l n x 11 0.0830.0790.293−0.3940.2600.130
Spatial ( ρ )0.737 ***0.0230.000
N2565
R20.379
Note: *** p < 0.01, ** p < 0.05.
Table 5. Robustness test and spatial effect decomposition results (Source: authors’ calculation).
Economic Distance MatrixSequence Contiguity MatrixInverse Square Sequence-Distance MatrixSequence-Based 5-Nearest Neighbor Matrix
Direct EffectIndirect EffectDirect EffectIndirect EffectDirect EffectIndirect EffectDirect EffectIndirect Effect
l n x 1 0.3395.729 ***0.694 ***2.160 ***0.401 *3.302 ***0.574 ***2.136 ***
l n x 2 −0.104−2.541 **−0.208 **−0.717 ***−0.123−1.150 ***−0.165 *−0.659 **
l n x 3 −0.086 *−1.230 ***−0.192 ***−0.563 ***−0.093 *−0.809 ***−0.150 ***−0.662 ***
l n x 4 0.0252.853 ***0.488 ***0.940 ***0.237 ***1.413 ***0.328 ***1.176 ***
l n x 5 −0.057−0.563−0.150−0.132−0.025−0.166−0.164−0.011
l n x 6 0.1420.6780.308 **1.234 ***0.0131.901 ***0.0581.627 ***
l n x 7 −0.0010.133 *−0.0080.005−0.0080.006−0.006−0.007
l n x 8 −0.024 *−0.751 ***−0.015−0.081 ***−0.012−0.160 ***−0.015−0.101 **
l n x 9 1.856 **1.8164.183 ***0.5044.212 ***1.1594.097 ***1.402
l n x 10 −0.016−0.551 **−0.024−0.026−0.021−0.052−0.021−0.064
l n x 11 0.054−1.185−0.061−0.496 ***0.050−0.787 **0.002−0.925 ***
N2565256525652565
R20.3790.2400.3020.272
Note: *** p < 0.01, ** p < 0.05, * p < 0.1.
Table 6. Spatial Heterogeneity and Significance Levels (Source: authors’ calculation).
EastCentralWest
l n x 1 1.358 ***0.771 ***0.939 ***
l n x 2 −0.624 ***−0.707 ***−0.221
l n x 3 −0.632 ***−0.179 **−0.601 ***
l n x 4 1.568 ***0.570 ***−0.019
l n x 5 −0.143−4.280 ***0.019
l n x 6 0.239 **0.236 ***0.221 ***
l n x 7 −0.0060.029−0.039
l n x 8 −0.018−0.195 **0.126 ***
l n x 9 0.250 ***0.214 ***0.135 **
l n x 10 0.0140.017−0.101
l n x 11 −0.077−0.0760.043
_cons−0.555 ***2.066 ***26.054 ***
N900900765
R-sq0.2800.1920.207
F27.83017.09814.500
Note: *** p < 0.01, ** p < 0.05.
Disclaimer/Publisher’s Note: The statements, opinions and data contained in all publications are solely those of the individual author(s) and contributor(s) and not of MDPI and/or the editor(s). MDPI and/or the editor(s) disclaim responsibility for any injury to people or property resulting from any ideas, methods, instructions or products referred to in the content.