


Abstract
Sino–U.S. trade friction (SUTF) has imposed significant shocks on economic systems and firm operations, attracting growing scholarly attention. This study investigates the impact of SUTF on corporate innovation quality and its underlying mechanism. Using the U.S. Section 301 investigation as a quasi-natural experiment, we adopt a difference-in-differences (DID) research design. The results indicate that SUTF significantly enhances corporate innovation quality, and this positive effect is partially mediated by the adoption of artificial intelligence (AI)—a general-purpose technology that reshapes traditional organizational and management systems. Moreover, the innovation-enhancing effect of SUTF is more pronounced among firms with a higher proportion of executives with IT experience and those with stronger corporate governance. These findings contribute to the literature on the economic consequences of SUTF by revealing AI adoption as a novel mechanism. This study also offers practical insights for firms navigating an era of heightened trade tensions and can inform policies aimed at fostering high-quality innovation.
Keywords:
Sino–U.S. trade friction; corporate innovation quality; artificial intelligence adoption; escaping-competition effect JEL Classification:
F14; O31; O33
1. Introduction
Sino–U.S. trade friction (SUTF) in the 21st century was initiated by the U.S. Section 301 investigation against China, an action announced by then-President Donald Trump on 18 August 2017. This protectionist policy, characterized by the imposition of substantial tariffs, aimed to restrict China’s trade and technological advancement, particularly within the manufacturing sector. According to the data from the Peterson Institute for International Economics (PIIE), the average tariff rate imposed on Chinese exports to the U.S. increased more than sixfold following the onset of SUTF relative to the pre-SUTF period (available at https://www.piie.com/research/piie-charts/2019/us-china-trade-war-tariffs-date-chart, accessed on 14 November 2025). SUTF has thus disrupted corporate operational systems, undermined the efficiency of global intermediate goods trade, reconfigured supply chains, and fractured global industrial networks [1,2,3,4,5]. This turbulence casts a shadow over the high-quality development of leading Chinese manufacturers, such as Huawei, ZTE, and DJI.
The academic literature, primarily grounded in traditional trade theories, emphasizes that SUTF increases trade policy uncertainty, thereby elevating export costs and operational burdens [6,7,8]. Scholars argue that these adverse effects ultimately deter corporate investment [9], constrain R&D expenditures [10], and lower patent applications [11,12,13].
However, a growing body of recent studies, informed by the escaping-competition effect, offers a contrasting view. This literature suggests that SUTF can compel firms to enhance their innovation efforts to gain a competitive advantage amid policy-induced uncertainties, thereby exerting a positive effect on corporate innovation [14,15,16,17]. Meanwhile, artificial intelligence (AI), a general-purpose technology characterized by powerful information processing capabilities, has significantly reshaped traditional organizational and management systems [18,19]. Scholars argue that corporate AI adoption can help mitigate financial risks [20], reduce corporate misconduct [21], improve investment efficiency [22], and promote sustainable business practices [23], ultimately enhancing corporate innovation quality [24].
Although a nascent literature has begun to examine the relationship between trade frictions and corporate innovation, dedicated research on the causal effect of SUTF on corporate innovation quality in the digital era remains scarce and is subject to several limitations. First, existing studies tend to overemphasize changes in innovation quantity, relying on indicators such as R&D expenditures and patent counts [11,16,17], while largely overlooking the assessment of genuine innovation quality. Second, regarding the measurement of SUTF, extant studies predominantly employ identification strategies that rely either on industry-level tariff shocks [8,17] or on firm-level historical export patterns [12,25]. These approaches, however, fail to jointly account for both cross-sectional variation in firm-level exposure intensity and the temporal evolution of tariff increases. Third, discussions regarding the transmission channels linking SUTF to corporate innovation remain anchored in traditional business frameworks, focusing predominantly on cost pressures and competitive dynamics [10,15]. Despite AI’s role as a transformative general-purpose technology that has fundamentally reshaped organizational and managerial systems, this critical contextual factor remains largely absent from current analytical frameworks.
Motivated by these practical concerns and research gaps, this study aims to investigate the following three research questions:
RQ1: What is the causal effect of SUTF on corporate innovation quality?
RQ2: Through which mechanism does SUTF influence corporate innovation quality?
RQ3: Does the effect of SUTF on corporate innovation quality vary with executive IT background and corporate governance structures?
This study investigates the systematic consequences of SUTF from the perspective of corporate innovation quality, with a particular focus on the novel channel of AI adoption. Leveraging the quasi-natural experiment provided by the U.S. Section 301 investigation, we find that SUTF stimulates textually measured corporate AI adoption, which in turn promotes corporate innovation quality. Moreover, this positive effect is more pronounced for firms with more IT-experienced executives and those with superior corporate governance.
Our study contributes to the extant literature in several ways. First, it establishes a causal link between SUTF and corporate innovation quality, thereby helping to reconcile the mixed findings in prior literature on the innovation effects of trade frictions. Second, it identifies a novel mediating mechanism—AI adoption—thereby integrating a critical contemporary business practice into the analysis of trade friction. Third, it systematically advances the understanding of the contingent effects of SUTF by examining boundary conditions related to executive technological background and firms’ internal governance structures.
Beyond its theoretical contributions, this study offers practical implications. For practitioners, our findings suggest that advancing AI adoption can serve as a strategic response to SUTF, helping firms systematically reshape organizational structures and processes to enhance innovation quality. For policymakers, the results highlight the value of refining innovation evaluation frameworks and incentive schemes to foster high-quality innovation in an era of global trade tensions.
2. Background and Literature Review
2.1. Background
The U.S. Section 301 investigation represents a landmark event in SUTF. Following the findings of the investigation, the U.S. government officially imposed substantial tariffs on a wide range of Chinese exports in March 2018, marking the onset of sustained bilateral trade friction. The first formal round of these tariffs took effect on 6 July 2018. Over the subsequent 18 months, the U.S. implemented four successive rounds of escalating tariffs, covering Chinese exports with a cumulative value of approximately $550 billion. As summarized in Table 1, the scope of sectors subject to these additional tariffs expanded progressively. By the fourth round, the tariffs encompassed products classified under 1097 distinct Harmonized System (HS) four-digit codes, accounting for 94.325% of all HS-4 categories. The academic literature has documented the profound negative effects of the SUTF from multiple perspectives, including its impact on globalization initiatives [26], the international financial system [27], the global trading system [1,2], and supply chains [4]. Notably, relative to firms in the U.S., Chinese firms have been identified as suffering more severe adverse consequences in this trade dispute [28].
Table 1.
Timeline of major tariff rounds in Sino–U.S. trade friction.
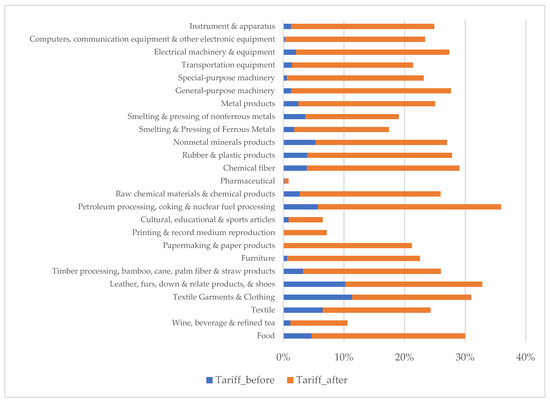
To assess the magnitude of SUTF, we follow the approach of Benguria et al. [10] to construct industry-level tariff rates faced by Chinese exporters to the U.S. market. The detailed procedure is outlined below.
First, we establish baseline tariffs using the U.S. Most-Favored-Nation (MFN) applied tariff rates, which reflect the pre-SUTF bilateral tariff level. Second, we measure the additional tariffs based on the product lists issued by the U.S. Trade Representative Office (USTR) under Section 301. Specifically, we compile the complete list of products subject to Section 301 tariffs against China, along with their corresponding additional tariff rates announced throughout the investigation. The total tariff rate at the HS 4-digit product level during the SUTF period is then calculated as the sum of the baseline MFN tariff and the applicable Section 301 additional tariff. Third, we map HS four-digit product codes to the industry classification codes of the China Securities Regulatory Commission (CSRC) based on product descriptions from the World Trade Organization’s Integrated Database (IDB). Finally, we compute a weighted-average industry-level tariff, where the weight for each product is its mean export value from China to the U.S. over our sample period.
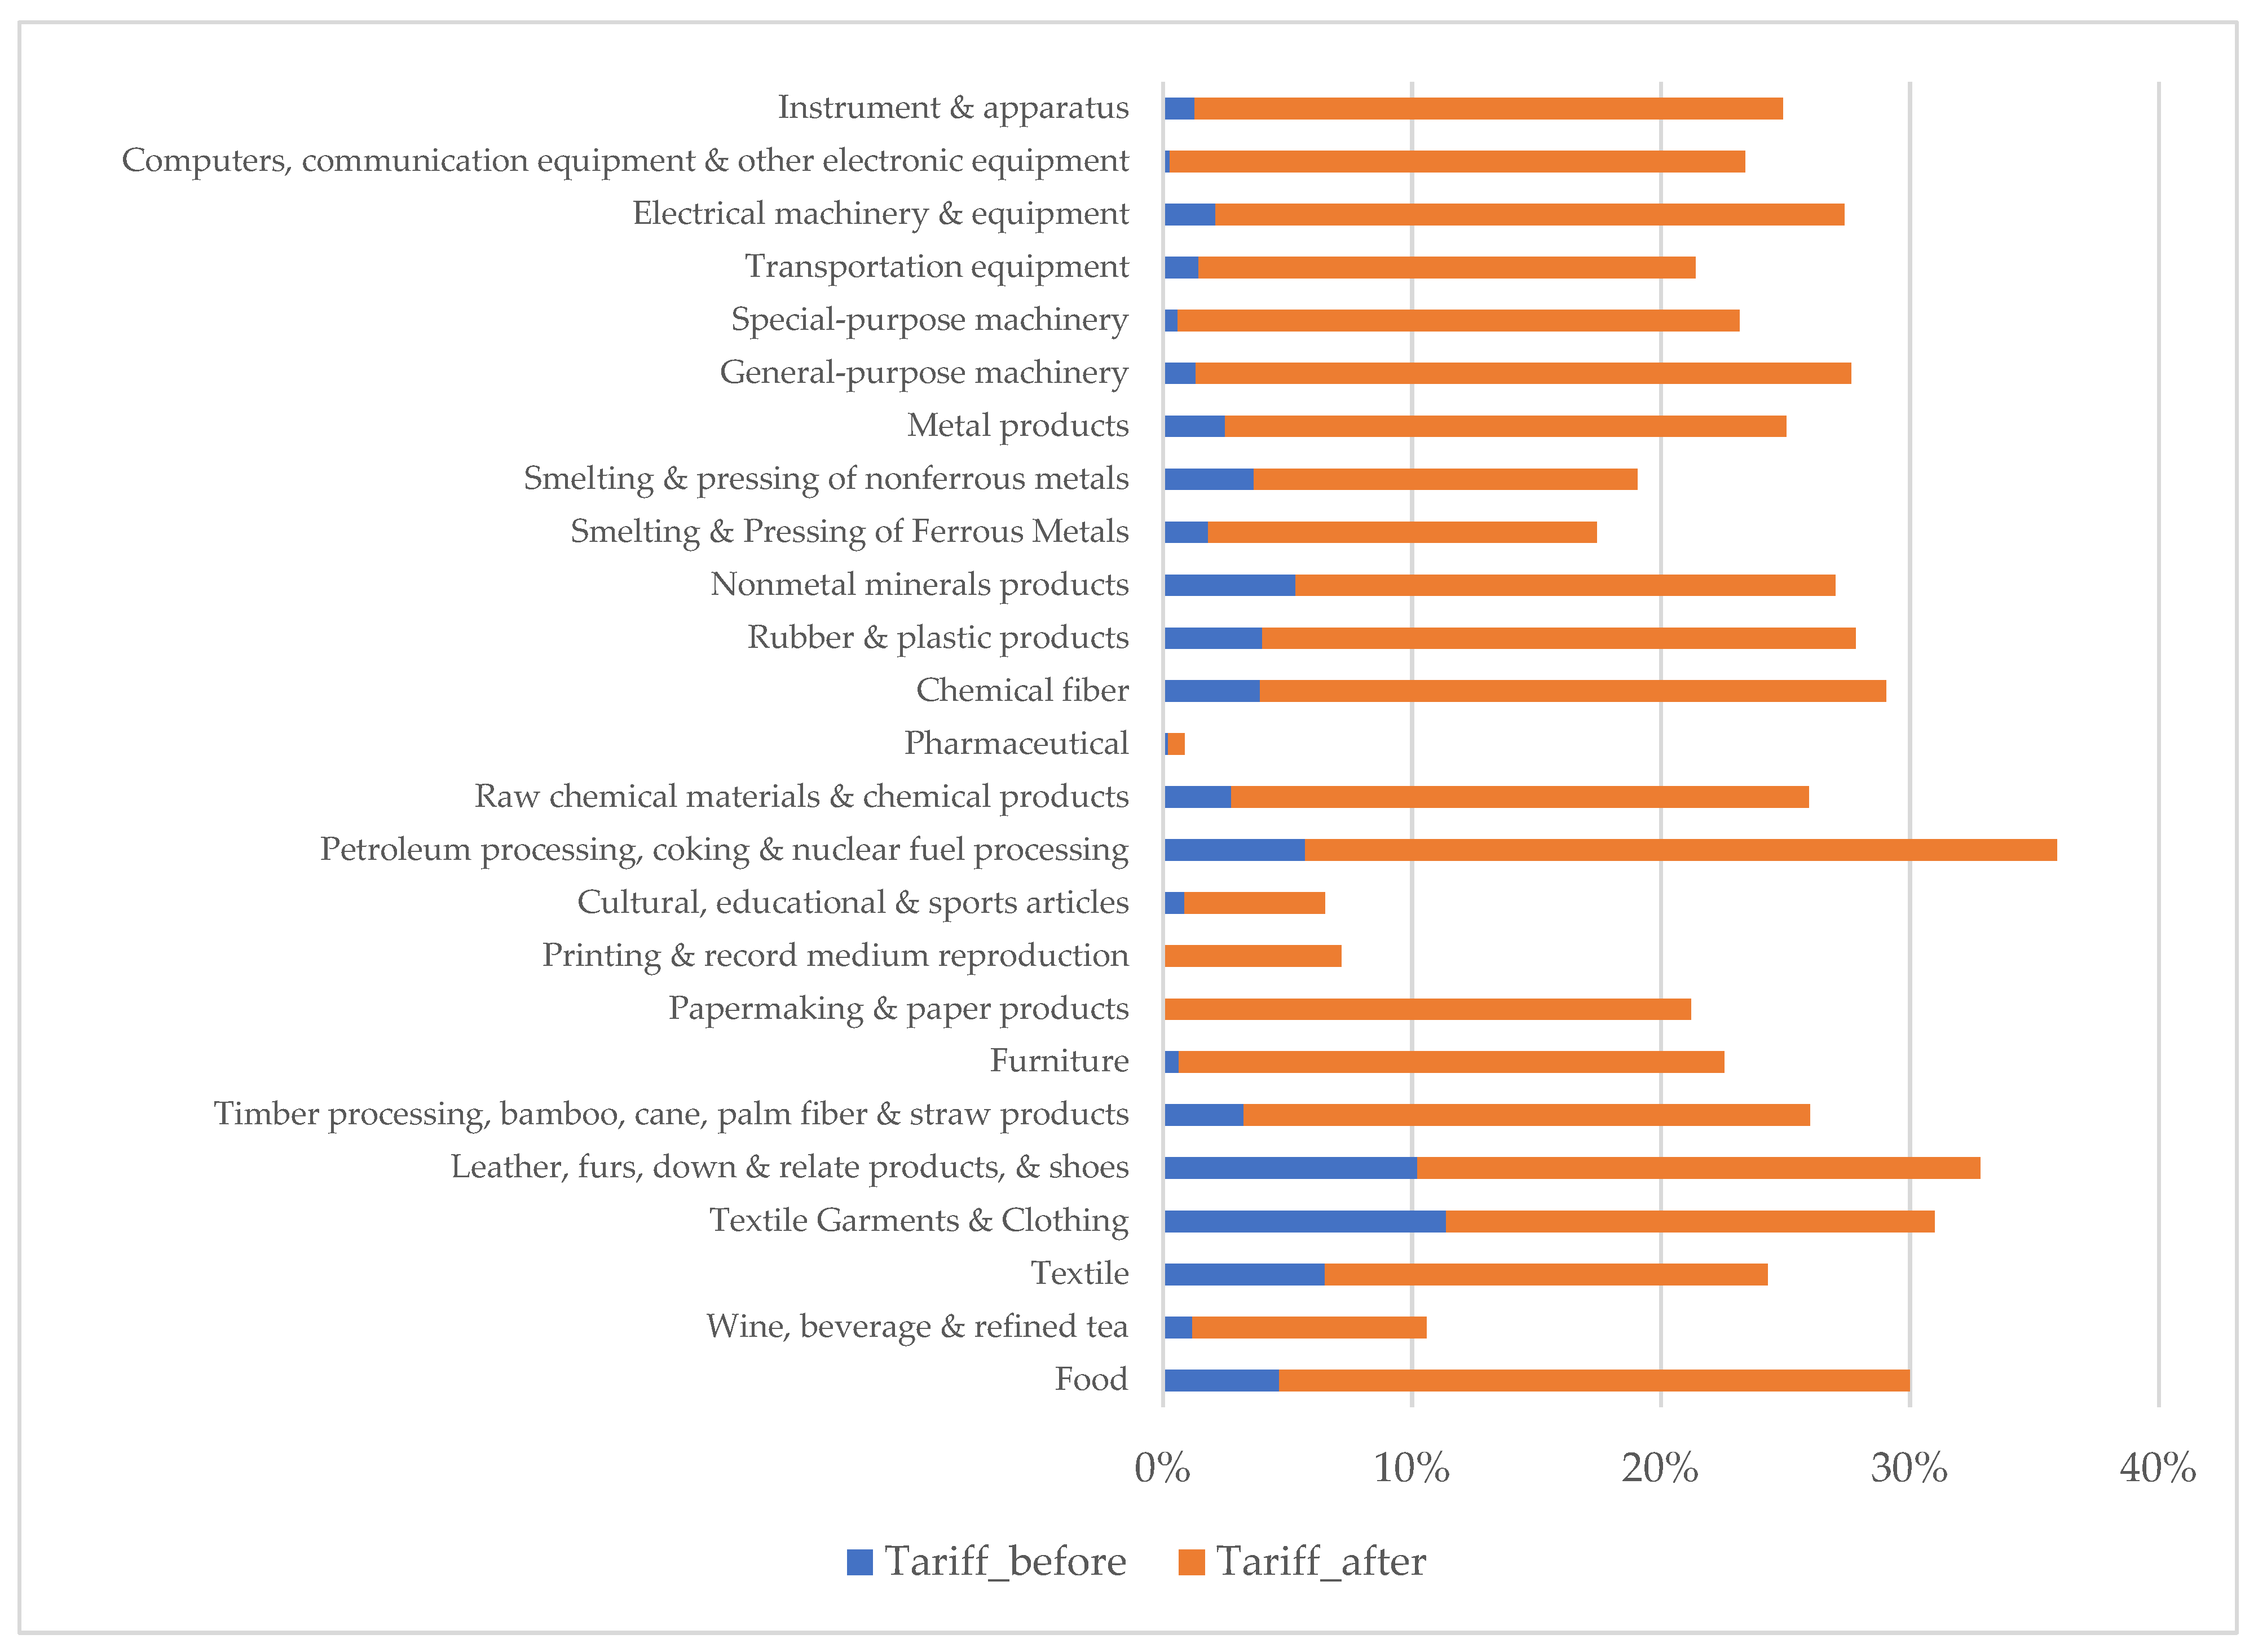
Figure 1 presents the changes in average industry-level tariff rates before and after the onset of the U.S. Section 301 investigation. The figure shows that the investigation substantially increased tariff burdens on Chinese exporters, with an average increase of 16.670 percentage points. This magnitude aligns closely with estimates published by the PIIE.
Figure 1.
Changes in industry-level tariff rates before and after the U.S. Section 301 investigation. Note: The blue bars indicate the average tariff rates prior to the onset of SUTF, while the orange bars represent the rates following its onset.
2.2. Literature Review
Existing studies examining the innovation effects of SUTF have produced mixed findings. One strand of literature, grounded in traditional trade theory, highlights a negative effect of SUTF on corporate innovation [9,10,11,12,13]. According to this theoretical perspective, higher tariffs—a common tool of trade protection—impose additional trade and compliance costs on firms in the targeted country, intensifying their operational burdens and worsening financing conditions [29,30,31]. This, in turn, crowds out firms’ investment in innovation activities, which require substantial and sustained financial support [32].
However, the heterogeneous-firms trade model introduced by Melitz [33] shifted the theoretical focus to firms’ differential investment decisions in dynamic environments. Building on this, Gorodnichenko et al. [34] argue that intensifying competitive pressure in global markets diminishes firms’ pre-innovation rents, thereby stimulating an escaping-competition motivation that can foster innovation. Hombert and Matray [35] further attribute this mechanism to the profitability of differentiated products. Subsequently, a burgeoning literature has focused on firms’ motivation to escape the heightened competition triggered by SUTF, documenting a positive effect on innovation [14,15,16,17]. For example, Li et al. [15] find that the high tariffs triggered by SUTF prompted Chinese exporters to divert sales to domestic or alternative markets, thereby intensifying competition within the domestic industry. This intensified competition motivates firms to increase innovation investment to escape competitive pressure. Zheng et al. [16] and Tian et al. [17] explore the positive effect of SUTF on innovation outcomes, highlighting firms’ motivation to create differentiated products and secure a more competitive market position.
These conflicting arguments regarding the innovation effect of SUTF may stem from a focus on innovation quantity rather than innovation quality. For Chinese firms, quantitative innovation outcomes, such as R&D expenditures and patent counts, are often tied to policy incentives like government subsidies [36], which can encourage rent-seeking behavior and a strategic reallocation of resources toward low-productivity innovations [37]. According to Schumpeter’s theory of innovation [38] and the escaping-competition view, firms facing substantial uncertainty can only escape intense competition by enhancing genuine innovation quality that generates sustained economic profits. Therefore, we hypothesize that SUTF will promote corporate innovation quality.
Meanwhile, the rise of the digital economy has created new pathways for firms’ high-quality development [39,40]. In the digital era, rapidly advancing AI technologies have become vital tools for enhancing corporate resilience in highly uncertain business environments [41,42]. Confronted with heightened policy uncertainty, firms tend to adopt precautionary and forward-looking strategies by reallocating resources toward digital investments. Such initiatives can generate competitive advantages by lowering operational costs and improving business efficiency [43,44], which, in turn, accelerate digital transformation and facilitate AI adoption.
According to Socio-Technical Systems (STS) theory, organizational development is driven by the joint optimization of technical and social subsystems, highlighting the importance of integrating advanced technologies with organizational structures and processes [45,46,47]. The growing adoption of AI reshapes firms’ production, decision-making, and innovation processes [48,49]. These AI technologies, such as intelligent computing, large-scale data analytics, and generative AI, enable firms to access cross-domain knowledge, identify technological opportunities, and achieve more significant technological breakthroughs [50]. Thus, we posit that SUTF enhances firms’ AI adoption, thereby promoting innovation quality.
3. Research Design
3.1. Empirical Model Settings
Following the identification strategies of Lu and Yu [51], Bai and Jia [52], and Tang et al. [53], we employ a DID design with a continuous treatment to estimate the causal effect of SUTF on corporate innovation quality. The baseline regression model is specified as follows:
In Equation (1), the dependent variable, CIQ, denotes corporate innovation quality. The key independent variable, TF, measures a firm’s exposure intensity to SUTF. The vector Controls represents a series of control variables that may influence innovation quality, including firm size (Size), firm age (Age), governmental subsidies (Subsidy), fixed assets (Capital), employee compensation (Salary), financial leverage (Leverage), return on assets (ROA), state ownership (SOE), ownership concentration (Top1), and provincial GDP (GDP). Detailed definitions and data sources for all variables are provided in Appendix A. To mitigate potential reverse causality, all firm-level independent variables are lagged by one period. We further include firm, industry, and year fixed effects to absorb time-invariant firm heterogeneity, industry-specific trends, and common time shocks, respectively. Standard errors are clustered at the firm level to account for serial correlation within firms. All continuous variables are winsorized at the 1st and 99th percentiles to mitigate the influence of outliers.
3.2. Variable Construction
3.2.1. Dependent Variable: Corporate Innovation Quality
To measure corporate innovation quality, we follow prior literature [54,55,56,57,58] and employ the patent breadth measure developed by Aghion et al. [59]. Compared with other measures such as invention patent counts and citation counts, patent breadth provides a more comprehensive characterization of innovation quality. Patent breadth is defined as one minus the Herfindahl index of the patent’s 4-digit International Patent Classification (IPC) subclasses. A higher patent breadth value indicates that the patent’s technological claims are distributed across a more diverse set of technological domains. Such dispersion reflects greater patent complexity, a wider application domain, and a broader scope of patent protection, all of which collectively signal a higher degree of innovation quality [55,56,60,61]. Our firm-level measure of innovation quality, CIQ, is calculated as the annual median of patent breadth across all patents applied for by a firm in a given year.
In subsequent robustness analysis (Section 4.3.3), we employ two alternative proxies for corporate innovation quality. The first, CIQ2, is the ratio of invention patent applications to total patent applications, capturing innovation quality from the perspective of patent composition. The second, CIQ3, is the number of forward citations received by a firm’s invention patents, which reflects the technological impact and significance of the innovation.
3.2.2. Key Independent Variable: Trade Friction Exposure
Our key independent variable, TF, is the core interaction term in the DID regression model. It is constructed as the product of a continuous treatment intensity measure, TariffIntensity, and a post-SUTF indicator, Post.
Prevailing approaches to measuring a firm’s exposure to SUTF are inconsistent and can be categorized into two strands. The first strand leverages the U.S. Section 301 investigation, employing an industry-level identification strategy, where industries subject to higher tariff increases are designated as the treatment group [8,17]. A key limitation of this approach is its inability to capture heterogeneous exposure across firms within the same industry. The second strand refines the analysis to the firm level by defining treatment groups based on a firm’s pre-SUTF export dependence, measured by its historical export share [11,12,25]. While this approach accounts for firm-level heterogeneity, a significant drawback is that it does not directly incorporate the specific tariff increases imposed under the U.S. Section 301 investigation.
To address the limitations of both approaches, we construct a continuous treatment variable (TariffIntensity) that integrates industry-level tariff shocks with firm-level export dependence. Specifically, it is calculated as follows:
In Equation (2), DeltaIndTariffj captures the changes in industry-level tariffs, measured as the difference between the post-SUTF and pre-SUTF average tariff rates for industry j (as detailed in Section 2.1 and illustrated in Figure 1). ExportDependence2017i represents firm i’s export dependence. Following Lu and Yu [51] and Chen et al. [11], we measure it as a firm’s export-to-sales ratio in 2017, the year immediately preceding the onset of SUTF.
The interaction term, TF, is then constructed as the product of TariffIntensity and the post-SUTF indicator, Post. The dummy variable Post equals one for fiscal years 2018 and onward, and zero otherwise. This specification follows the standard DID design [8,14].
3.3. Sample Construction and Data Sources
Our initial sample comprises Chinese A-share listed manufacturing firms from 2014 to 2022. Data on industry-level tariff changes are compiled from multiple sources. Product-level tariff schedules are obtained from the UN Comtrade database and the IDB. The list of products specifically targeted under the U.S. Section 301 investigation is sourced from official announcements by the office of the USTR. Patent data, which we use to construct our measure of innovation quality, are obtained from the China National Intellectual Property Administration (CNIPA). We match patents to listed firms based on firm names, including full names, former names, and common abbreviations. Firm-level financial and corporate governance variables are sourced from the China Stock Market and Accounting Research (CSMAR) Database, a standard and reliable source for empirical research on the Chinese capital market.
We refine the sample by applying the following filters: (1) firms under Special Treatment (ST) or Particular Transfer (PT) status, which indicate financial distress or other irregularities; (2) firms that went public after the onset of SUTF (i.e., after 2018); (3) firms with negative book equity (i.e., liabilities exceeding assets); (4) firms that changed their primary industry classification during the sample period; and (5) firms with missing or abnormal values for key financial variables, such as negative government subsidies or employee compensation. After applying these filters, our final sample consists of 14,722 firm-year observations, representing 2074 unique manufacturing enterprises.
4. Results
4.1. Summary Statistics and Correlations
Table 2 presents the descriptive statistics for the main variables. The mean of corporate innovation quality (CIQ) is 0.245, with a standard deviation of 0.276 and a maximum of 0.934. These statistics indicate substantial cross-sectional variation in innovation quality. The correlation matrix is provided in Table 3. The pairwise Pearson correlation coefficients among the independent variables are all below 0.6, mitigating concerns regarding severe multicollinearity in the regression analyses.
Table 2.
Descriptive statistics.
Table 3.
Correlation matrix.
4.2. Baseline Regression Results
Table 4 presents the baseline regression results. Column (1) reports a positive and statistically significant coefficient for the variable of interest, TF, suggesting a positive association between SUTF and corporate innovation quality. In Column (2), after incorporating control variables, the coefficient on TF remains positive and statistically significant. The coefficient estimate of 0.288 implies that, following the policy shock, a one-standard-deviation increase in a firm’s exposure to SUTF leads to a 0.011 (=0.288 × 0.037) increase in corporate innovation quality for the treatment group relative to the control group. Given the sample mean of CIQ is 0.245, this effect translates to an approximately 4.349% (=0.288 × 0.037/0.245) improvement. We regard this as economically meaningful, especially considering that the average annual growth rate of manufacturing value added—a broad indicator of productivity—was only about 6% during our sample period (National Bureau of Statistics of China, 2014–2022). Collectively, these baseline results provide preliminary evidence consistent with the hypothesis that SUTF enhances corporate innovation quality.
Table 4.
Baseline results: the effect of SUTF on corporate innovation quality.
4.3. Robustness Checks
4.3.1. Parallel Trend Test
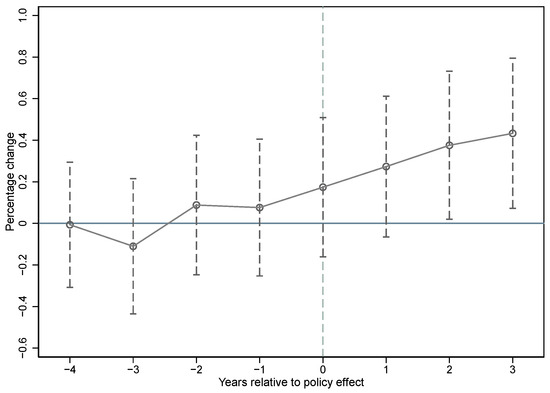
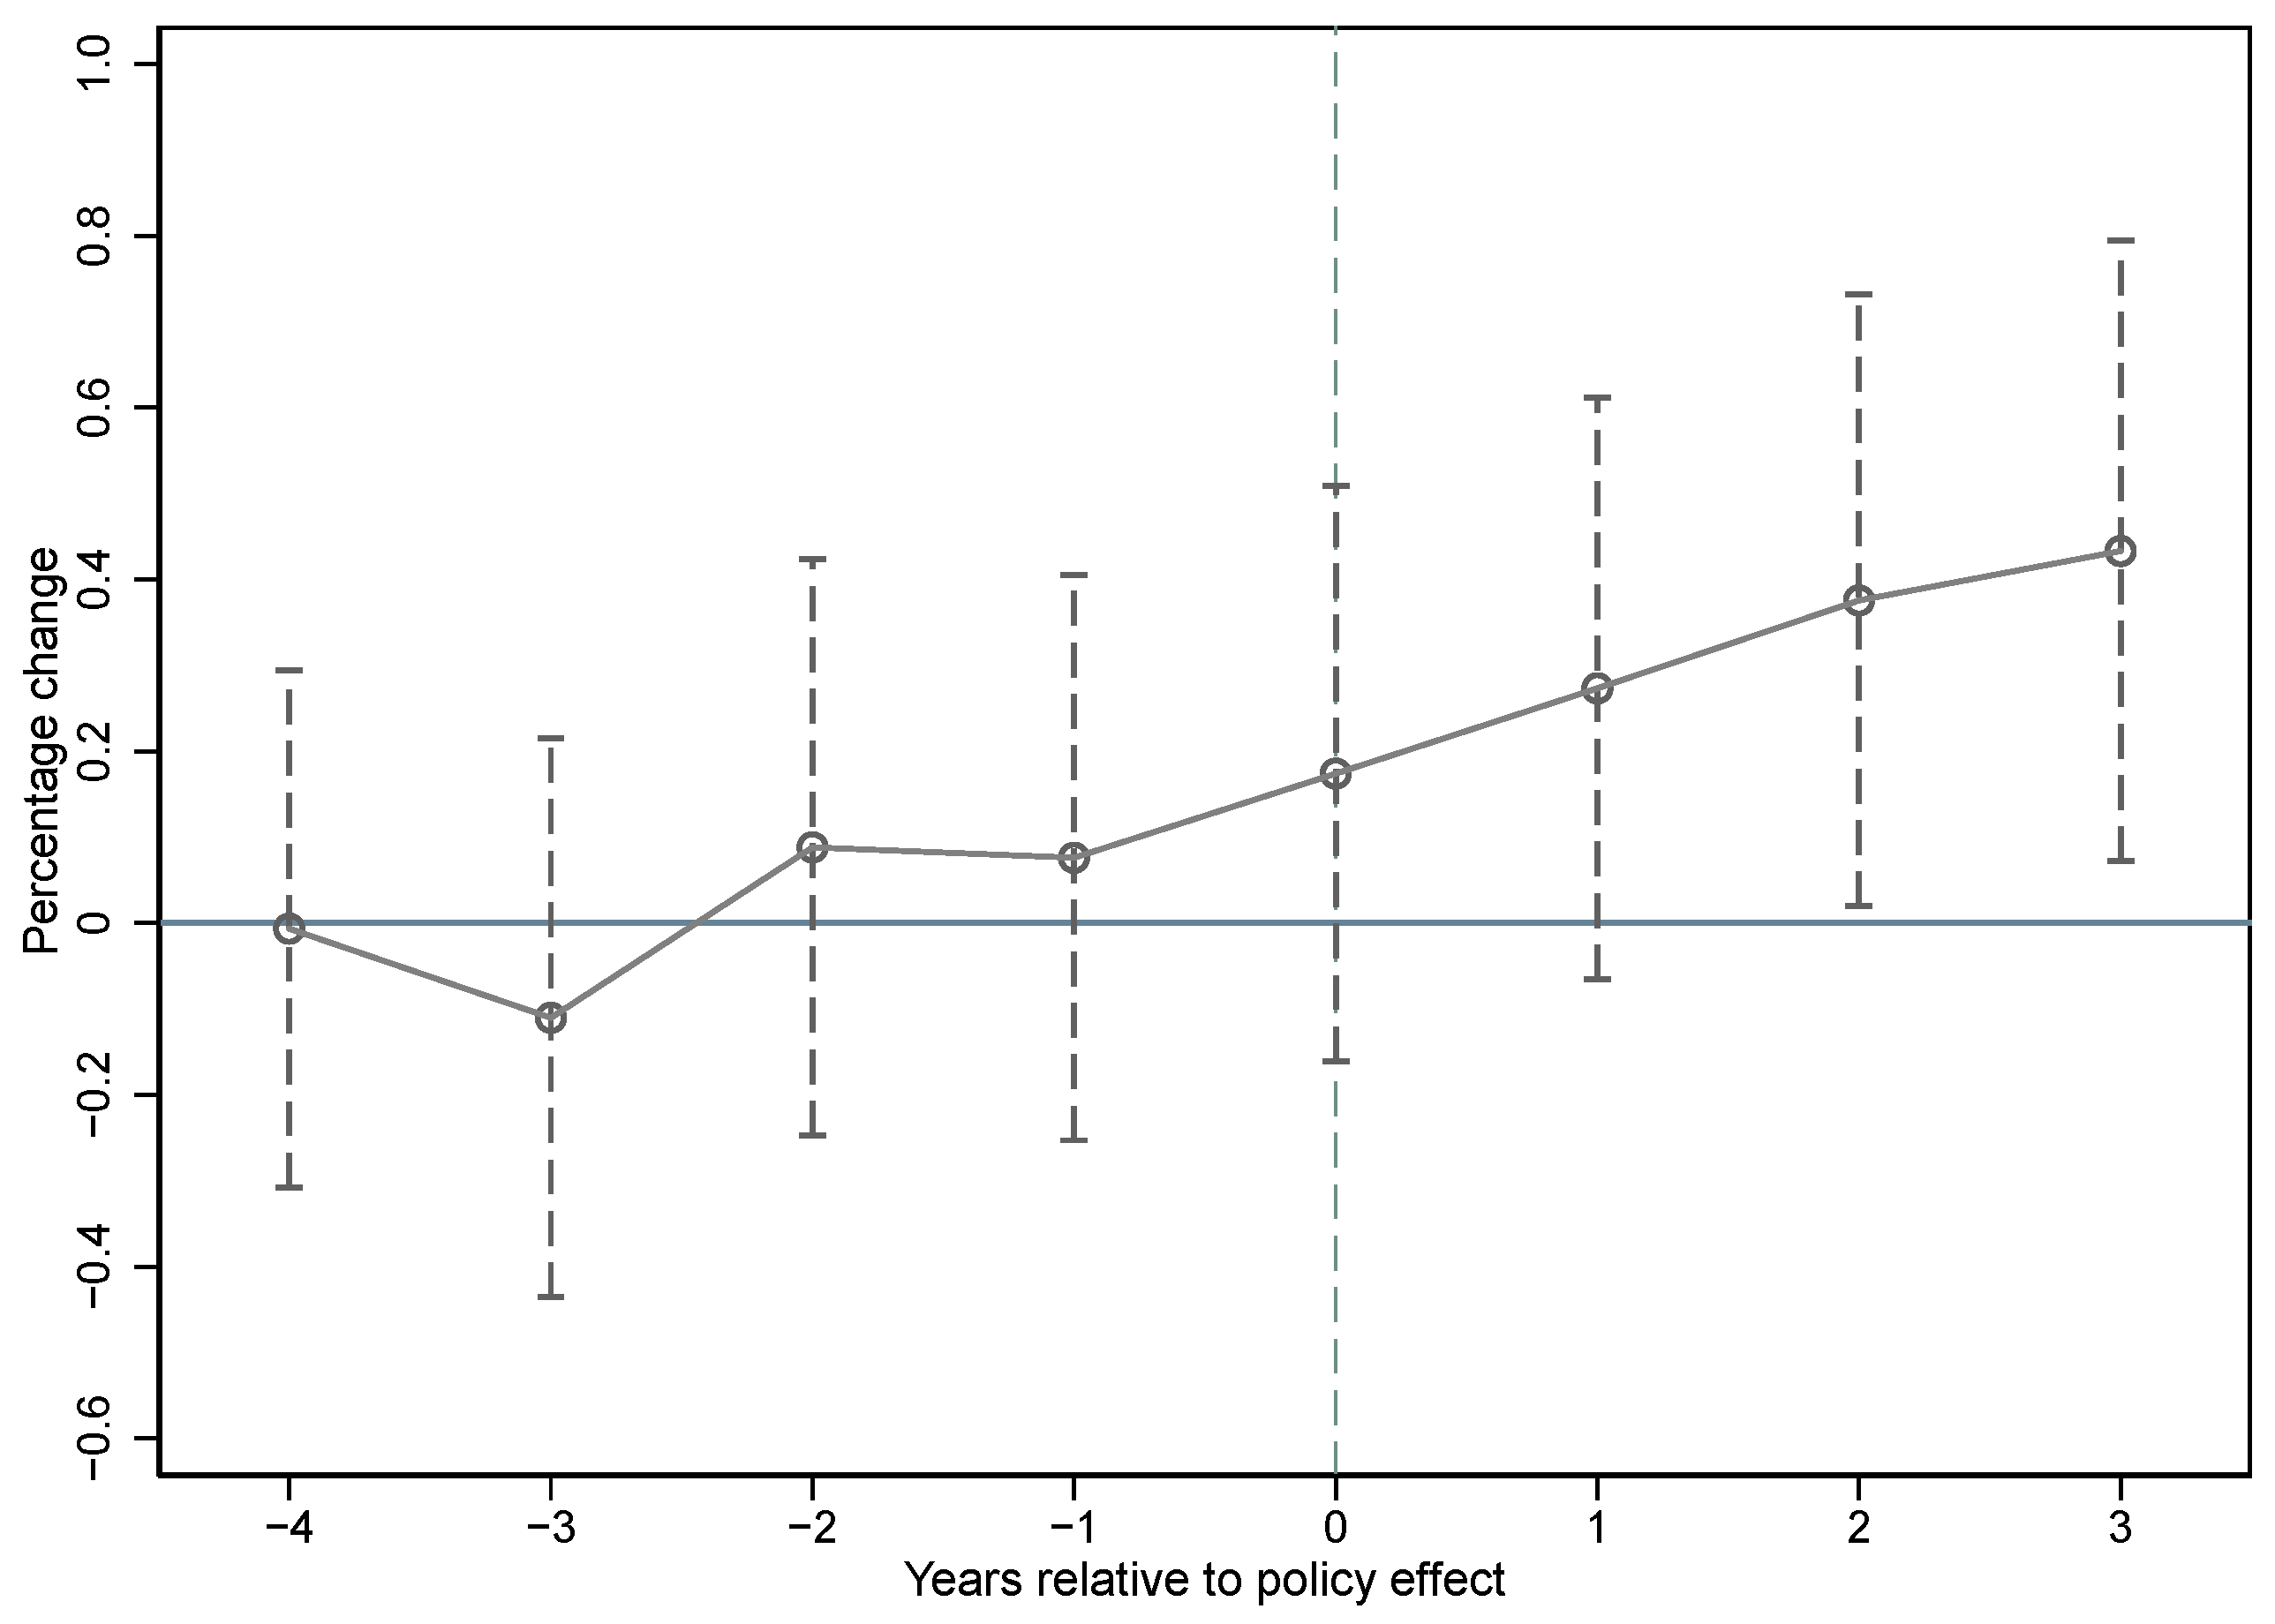
The validity of the DID approach rests on the parallel trends assumption. This assumption posits that, absent the treatment, the outcomes of the treatment and control groups would have followed similar trajectories. To test this assumption, we employ an event-study framework following Beck et al. [62], spanning an estimation window from four periods before to three periods after the onset of SUTF. Because our dependent variable, corporate innovation quality (CIQ), is measured with a one-year lead in the baseline specification, the event-time indicators in this analysis effectively cover the period from five years before to three years after the shock. We omit the event-time dummy for the year five years prior to the shock to avoid perfect multicollinearity, thus establishing it as the reference period. As reported in Table 5, the coefficients on the pre-treatment period dummies are individually insignificant. Moreover, an F-test fails to reject the null hypothesis that all pre-treatment coefficients are jointly zero. These results suggest that the pre-treatment trends in innovation quality between the treatment and control groups are not statistically distinguishable, supporting the parallel trends assumption.
Table 5.
Parallel trend: event-study estimates.
Figure 2 plots the dynamic treatment effects. The point estimates for the pre-treatment periods are close to zero, and their 95% confidence intervals encompass zero. In contrast, the coefficients for the post-treatment period are predominantly positive and statistically significant, exhibiting a gradually increasing pattern over time. Overall, the results from the event-study analysis lend support to the validity of our DID identification strategy and illustrate a sustained, positive effect of SUTF on corporate innovation quality.
Figure 2.
Dynamic effects of SUTF on corporate innovation quality (CIQ). Note: The solid dots represent the estimated coefficients for each relative year, with the vertical bars indicating the corresponding 95% confidence intervals. The dashed vertical line marks the shock year (t = 0). The omitted reference period is five years prior to the onset of SUTF.
4.3.2. Placebo Test
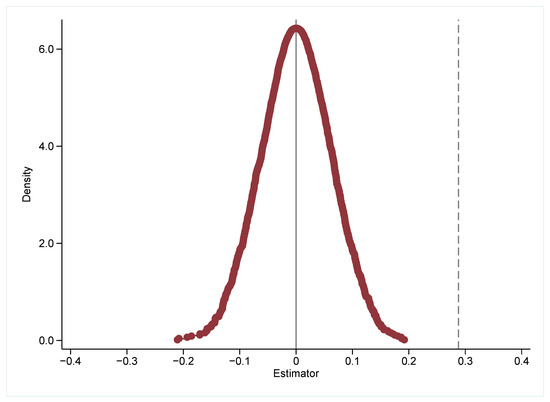
We conduct a placebo test to assess whether our baseline results are driven by the actual effect of SUTF, or alternatively, by random chance or unobservable confounding trends. Following Ferrara et al. [63], we perform a simulation in which we randomly assign treatment status and its corresponding shock years to construct a placebo treatment indicator. This procedure is replicated 2000 times. Figure 3 plots the kernel density distribution of the estimated coefficients on the placebo treatment variable from these 2000 replications. The distribution is tightly centered around zero, in stark contrast to the statistically significant coefficient from the actual baseline estimation. This discrepancy provides evidence that our main finding is unlikely to be spurious, thereby strengthening the credibility of our causal inference regarding the effect of SUTF.
Figure 3.
Placebo test. Note: The curve represents the kernel density distribution of the estimated coefficients from 2000 placebo simulations, in which the treatment status and shock years are randomly assigned. The solid vertical line at 0 represents the expected distribution under the null hypothesis of no true policy effect. The dashed vertical line indicates the estimated coefficient on TF from the baseline regression.
4.3.3. Alternative Measures for Key Variables
To assess the robustness of our core findings, we conduct a series of tests using alternative measures for the key variables. First, we examine the sensitivity of our results to different specifications of the SUTF shock. We employ three alternative independent variables: (1) Following Bai and Jia [52], we construct an alternative continuous treatment variable, TariffIntensity2, by interacting DeltaIndTariff with a firm’s pre-shock export dependence, where the latter is measured as the firm’s average export-to-sales ratio over the three-year period preceding the onset of SUTF (i.e., 2015–2017). The alternative interaction term, TF2, is then constructed as the product of TariffIntensity2 and the post-SUTF indicator, Post. (2) Consistent with the industry-level identification strategies in Liu et al. [8] and Tian et al. [17], we implement a standard DID design. The treatment group comprises firms in industries facing above-median tariff increases (where DeltaIndTariff exceeds the sample median), and the treatment effect is captured by the interaction term between this treatment dummy and a post-policy indicator (DIDindustry). (3) We directly utilize the weighted average industry-level tariff rate (Tariff) to measure the intensity of the SUTF shock, as detailed in Section 2.1. Columns (1) through (3) of Table 6 present the regression results using these alternative measures. The coefficients on TF2, DIDindustry, and Tariff are all positive and statistically significant at the 1% level. These results confirm the robustness of our core findings to alternative shock specifications.
Table 6.
Robustness checks: alternative variable definitions.
Second, we evaluate the sensitivity of our results to alternative proxies of corporate innovation quality. (1) Following Yang [64], we use the share of invention patent applications in total applications (CIQ2) to capture innovation quality. Invention patents undergo a more stringent and lengthy examination process, making them the most valuable among the three patent types. A higher value of CIQ2 thus indicates a better innovation structure and higher overall innovation quality. (2) We employ the forward citations of invention patents (CIQ3) as an alternative measure of innovation quality. CIQ3 captures the frequency with which a firm’s patents are cited by subsequent patent applications. A higher citation count signifies greater knowledge dissemination and, by implication, higher patent quality [65]. Columns (4) and (5) of Table 6 present the regression results using CIQ2 and CIQ3 as the dependent variables, respectively. The coefficients on TF remain positive and statistically significant in both specifications, reinforcing the robustness of our baseline findings.
4.3.4. Addressing Potential Confounding Policies
Although our regression models include a comprehensive set of control variables, the estimated relationship between SUTF and corporate innovation quality may still be confounded by other concurrent policy initiatives. We focus on three prominent concurrent initiatives: the China–Europe Railway Express (CERE), the National AI Innovation Pilot Zone (NAIIPZ) program, and the Made in China 2025 (MIC2025) strategy.
First, the CERE represents a sustained effort to deepen trade partnerships and has substantially reduced overland transportation time. This improvement in logistics may induce trade diversion effects that are independent of SUTF, potentially biasing our estimates. Second, the NAIIPZ aims to foster the digital economy by providing firms in designated zones with AI-related resources and policy support. This place-based industrial policy could independently stimulate innovation within pilot cities, introducing a source of endogeneity if the selection of NAIIPZ cities is correlated with firms’ exposure to SUTF. Third, the MIC2025 policy was launched in 2015 to accelerate the transformation of the manufacturing sector toward high-end, intelligent, and green development. Within two years of its inception, more than 30 cities were designated as demonstration pilots. This targeted industrial policy may spur innovation in designated pilot cities, thereby confounding the estimated effect of SUTF.
To mitigate potential bias, we augment our baseline regression model, Equation (1), by including dummy variables for CERE, NAIIPZ, and MIC2025, as well as their respective interaction terms with TF. The CERE dummy equals one for firms located in cities connected to the railway network following its inauguration and zero otherwise. The NAIIPZ dummy equals one for firms headquartered in cities designated as pilot zones after the policy launch, and zero otherwise. The MIC2025 dummy equals one for firms headquartered in cities selected as demonstration pilots and zero otherwise.
Table 7 reports the estimation results. After incorporating dummy variables for these potential confounding policies and their interaction terms with TF, the coefficients on TF remain significantly positive across all specifications. The continued significance supports the robustness of our primary finding that SUTF enhances corporate innovation quality.
Table 7.
Robustness checks: controlling for concurrent policies.
4.3.5. Alternative Sample Specifications
To address concerns that the baseline results may be driven by a unique sub-sample of firms with consistently superior innovation performance, we exclude firms that rank in the top 10% annually in terms of innovation quality. As reported in Column (1) of Table 8, the coefficient on TF remains positive and statistically significant. Furthermore, to mitigate the potential influence of location-specific advantages, we exclude firms headquartered in the four municipalities under the direct administration of the central government (i.e., Beijing, Tianjin, Shanghai, and Chongqing). These regions typically provide greater resource endowments and a more favorable innovation ecosystem. The results, presented in Column (2) of Table 8, show that the coefficient on TF continues to be positive and statistically significant. Collectively, these results suggest that our core findings are robust to alternative sample specifications designed to alleviate concerns regarding sample selection bias.
Table 8.
Robustness checks: subsample analyses.
4.4. Mechanism Analysis
In this section, we explore whether corporate AI adoption serves as a channel through which SUTF affects innovation quality. SUTF substantially increases uncertainty and intensifies competitive pressure, triggering firms’ motivation to adopt precautionary and forward-looking strategies, such as AI adoption. As a transformative general-purpose technology, AI can systemically reshape corporate organizational structures and processes, thereby enhancing innovation quality. To investigate this channel, we employ a causal mediation analysis framework. Specifically, we estimate the following two-stage system of equations:
Equation (3) estimates the effect of SUTF on the proposed mediator, AI adoption. Equation (4) then examines the effect of both SUTF and lagged AI adoption on corporate innovation quality, thereby testing the hypothesized mediation path. All other variables and the model structure are consistent with the baseline specification in Equation (1).
Following the recent literature on AI [20,22,23,66], we measure AI adoption using the textual analysis approach proposed by Yao et al. [67]. Their method begins by compiling an initial vocabulary of AI-related terms from multiple sources: the extant literature, documents published by the World Intellectual Property Organization (WIPO), and industry reports from leading Chinese research institutions. This lexicon is then expanded using the Word2Vec model—a word embedding technique that identifies semantically similar words—resulting in a final dictionary of 73 Chinese keywords. The complete list is provided in Appendix B. Our primary proxy, AIRatio, is defined as the frequency of AI-related keywords in the Management’s Discussion and Analysis (MD&A) section of a firm’s annual report. To assess robustness, we construct an alternative measure, AINum, defined as the raw count of such keywords in the MD&A.
Panel A of Table 9 presents the estimation results. Column (1) shows that the coefficient on TF is positive and statistically significant at the 5% level when AIRatio is the dependent variable, indicating that SUTF significantly promotes AI adoption. In Column (2), which includes AIRatio, the coefficient on TF remains positive and significant for CIQ, albeit attenuated in magnitude compared to the baseline estimate. This attenuation, coupled with a significant Sobel test statistic (p < 0.05), suggests that AI adoption mediated a portion of SUTF’s total effect on innovation quality. Columns (3) and (4) report results using the alternative mediating variable, AINum. The findings are qualitatively similar: SUTF positively affects AINum (Column 3), and its direct effect on CIQ decreases upon controlling for AINum (Column 4), with the Sobel test again significant. Collectively, these results support the interpretation that AI adoption serves as a partial mediator in the relationship between SUTF and corporate innovation quality.
Table 9.
Mechanism analysis: the mediating role of AI adoption. (Panel A) Two-stage least squares and Sobel test results. (Panel B) Bootstrap test for mediation effects.
To address the potential limitations of the Sobel test, we follow the prior literature [68,69] and implement a nonparametric bootstrap procedure with 1000 replications. As shown in Panel B of Table 9, the 95% bias-corrected confidence intervals for the indirect effects (via AI adoption) exclude zero for both AIRatio and AINum, while the direct effect of SUTF remains positive and significant. These results reinforce the presence of a significant mediation effect and alleviate concerns regarding the parametric assumptions of the Sobel test.
4.5. Heterogeneity Analysis
We explore the heterogeneous effects of SUTF on innovation quality along two dimensions: the digital competence of executives and the quality of corporate governance.
First, we investigate whether the effect varies with the level of executive digital competence. We measure the presence of IT expertise in the top management team by the proportion of executives with an IT-related professional background to the total number of executives (ITE). The sample is then partitioned at the annual median of ITE. As reported in Columns (1) and (2) of Table 10, the coefficient on TF is positive and statistically significant only for the subsample of firms with above-median ITE. This suggests that the innovation-enhancing effect of SUTF is concentrated in firms with greater digital leadership capacity. A plausible explanation is that firms lacking executives with relevant IT expertise may face greater challenges in assimilating AI concepts and implementing related technologies, thereby capturing fewer innovation benefits from policy-induced incentives. This finding aligns with recent studies on the value of executive IT background [70] and underscores the critical role of specialized human capital in the digital transformation era.
Table 10.
Heterogeneity analysis: executive IT background and corporate governance.
Second, we investigate the moderating influence of corporate governance. We use the proportion of independent directors on the board of directors (CG) as a proxy for governance quality and, similarly, split the sample at its annual median. Results presented in Columns (3) and (4) of Table 10 show that the coefficient on TF is larger in magnitude and exhibits stronger statistical significance for firms with above-median CG. This indicates a more pronounced innovation-enhancing effect of SUTF in firms with stronger governance. This result highlights the importance of effective corporate governance in mitigating external challenges. Sound governance structures are likely to improve organizational resilience [71], allowing firms to allocate resources more effectively and formulate more strategic responses to external pressures, such as trade frictions, in highly uncertain environments.
5. Conclusions
5.1. Summary of Findings and Discussion
This study investigates the impact of SUTF on corporate innovation quality. Based on a sample of Chinese listed manufacturing firms from 2014 to 2022 and employing a DID design with a continuous treatment, we find robust evidence that SUTF exerts a positive and statistically significant effect on corporate innovation quality. This finding supports the escaping-competition view, illustrating that beyond imposing cost pressures, external trade shocks can motivate firms to upgrade their innovation strategies and shift toward more quality-oriented technological activities. Our mechanism analysis identifies AI adoption as a significant channel through which SUTF enhances innovation quality. Confronted with heightened uncertainty and intensified competition, firms are incentivized to adopt precautionary and forward-looking strategies, leading to increased AI adoption. This general-purpose technology, in turn, reshapes organizational systems and processes, ultimately fostering innovation quality. Moreover, the positive effect is more pronounced for firms whose executives possess greater digital competence (i.e., a higher proportion of IT-experienced executives) and for those with stronger corporate governance. These heterogeneous effects underscore the complementary roles of specialized human capital and effective monitoring mechanisms in enabling firms to capture the innovation benefits triggered by external policy shocks.
The literature on the effect of SUTF on firm innovation presents mixed findings. One stream of research, grounded in traditional trade theories, documents a negative effect, arguing that trade frictions inhibit corporate innovation by raising costs and operational burdens [6,7,10,11]. In contrast, a growing body of recent studies reports a positive effect, suggesting that trade frictions can stimulate innovation as firms seek to escape intensified competition [15,16,17]. Our study departs from prior studies that primarily rely on quantitative indicators such as R&D spending or patent counts by shifting the focus to innovation quality. Furthermore, regarding the underlying mechanism, while extant studies highlight factors like incremental costs [11], financing constraints [16], and competitive pressure [15], they pay scant attention to the systematic, transformative role of emerging general-purpose technologies, particularly AI. We address this gap by identifying AI adoption as a novel mediating channel. Moreover, by examining the moderating roles of executive IT background and internal governance structures, we introduce a contingency perspective that elucidates for which firms the innovation-promoting effect of SUTF is strongest. This analysis echoes and extends the traditional corporate finance literature on the role of human capital and governance [70,71].
5.2. Theoretical and Practical Implications
Our findings offer important implications for both theory and practice. Theoretically, this study makes two primary contributions. First, by integrating the escape-competition logic into the context of the digital economy, it provides a novel theoretical lens to examine the complex relationship between trade policy shocks and corporate innovation strategies. Second, it extends the application of Schumpeter’s theory of innovation and STS theory by demonstrating how external competitive shocks, mediated by technological adoption, can act as a catalyst for creative destruction and quality upgrading at the firm level.
Practically, our results offer actionable insights for policymakers and corporate managers. For policymakers, the findings suggest that proactive industrial and innovation policies—such as subsidies for digital infrastructure or R&D tax credits—could be designed to complement trade policies. This integrated approach can better guide and incentivize enterprises, especially those highly exposed to trade frictions, to embark on a high-quality, innovation-driven transformation path. For corporate managers, the findings underscore a strategic imperative: to actively cultivate in-house AI capabilities and decisively integrate these technologies into core operational and innovation systems. Such a commitment positions firms to achieve high-quality innovation.
5.3. Limitations and Future Research Directions
This study is subject to several limitations that also point to promising avenues for future research. First, our measure of firm-level AI adoption relies on textual analysis of corporate disclosures. Although this method is well established in the literature, it is susceptible to concerns about rhetorical emphasis and may not fully capture the substantive depth or effectiveness of AI implementation. A primary constraint stems from the underdevelopment of Chinese accounting standards regarding the recognition and disclosure of AI-related intangible assets. The absence of clear, mandatory classification for AI-related expenditures makes it challenging to construct more refined indicators, such as the scale of dedicated AI personnel, proprietary algorithms, or firm-specific AI capabilities. We expect that as China’s accounting standards evolve to mandate better disclosure of data and intangible assets, future research will be able to employ more direct and comprehensive metrics for AI adoption.
Second, our analysis focuses on the microeconomic effects stemming from the tariff sanctions imposed under the U.S. Section 301 investigation. We do not examine the potential impact of non-tariff barriers, such as entity list designations or technical standards. These instruments constitute an increasingly important dimension of modern trade friction. Future research could fruitfully explore how these alternative forms of trade restriction influence corporate strategy and innovation, thereby providing a more holistic understanding of the multifaceted nature of Sino–U.S. technological competition.
Author Contributions
Conceptualization, methodology, resources, validation, visualization, writing—original draft, writing—review and editing, T.Y. and L.W.; data curation, formal analysis, investigation, software, T.Y.; funding acquisition, project administration, supervision, L.W. All authors have read and agreed to the published version of the manuscript.
Funding
This research was funded by the National Natural Science Foundation of China: 71672106.
Data Availability Statement
The data presented are available on request from the corresponding author.
Conflicts of Interest
The authors declare no conflicts of interest.
Appendix A
Table A1.
Variable definitions and data sources.
Appendix B
Table A2.
Terms of AI-related keywords.
References
- Mao, H.; Görg, H. Friends like this: The impact of the US–China trade war on global value chains. World Econ. 2020, 43, 1776–1791. [Google Scholar] [CrossRef] [Scilit]
- Zhu, Z.; Zheng, H.; Zhu, Z. Analysis on the economic effect of Sino-US trade friction from the perspective of added value. Environ. Dev. Sustain. 2022, 24, 180–203. [Google Scholar] [CrossRef] [Scilit] [PubMed]
- Guo, L.; Wang, S.; Xu, N.Z. US economic and trade sanctions against China: A loss-loss confrontation. Econ. Polit. Stud. 2023, 11, 17–44. [Google Scholar] [CrossRef] [Scilit]
- Luo, C.; Wang, N. US-China trade frictions and supply chain reconstruction: Perspective from indirect links. J. Int. Money Financ. 2025, 151, 103256. [Google Scholar] [CrossRef] [Scilit]
- Xing, K.; Yuan, Y. Will Sino–US trade friction affect the resilience of the global backbone industry network? Econ. Anal. Policy 2025, 87, 893–908. [Google Scholar] [CrossRef] [Scilit]
- Krolikowski, P.M.; McCallum, A.H. Goods-market frictions and international trade. J. Int. Econ. 2021, 129, 103411. [Google Scholar] [CrossRef] [Scilit]
- Feng, X.; Li, W.; Peng, Y.; Tan, Y. International trade friction and the cost of debt: Evidence from China. Pac.-Basin Financ. J. 2021, 67, 101550. [Google Scholar] [CrossRef] [Scilit]
- Liu, M.; Lin, F.; Feng, F.; Xiong, G. Sino-US trade friction and the firm value: Evidence from listed firms in China. Econ. Anal. Policy 2025, 86, 978–987. [Google Scholar] [CrossRef] [Scilit]
- Kong, Q.; Li, R.; Wang, Z.; Peng, D. Economic policy uncertainty and firm investment decisions: Dilemma or opportunity? Int. Rev. Financ. Anal. 2022, 83, 102301. [Google Scholar] [CrossRef] [Scilit]
- Benguria, F.; Choi, J.; Swenson, D.L.; Xu, M.J. Anxiety or pain? The impact of tariffs and uncertainty on Chinese firms in the trade war. J. Int. Econ. 2022, 137, 103608. [Google Scholar] [CrossRef] [Scilit]
- Chen, Y.; Zhang, S.; Miao, J. The negative effects of the US-China trade war on innovation: Evidence from the Chinese ICT industry. Technovation 2023, 123, 102734. [Google Scholar] [CrossRef] [Scilit]
- Kong, D.; Liu, C.; Narayan, P.K.; Sharma, S.S. The US–China trade war and corporate innovation: Evidence from China. Financ. Manag. 2024, 53, 501–541. [Google Scholar] [CrossRef] [Scilit]
- Yin, H.T.; Wen, J.; Ni, G.H.; Chang, C.P. How do economic sanctions affect corporate innovation? Lessons from China. Technol. Forecast. Soc. Change 2026, 224, 124516. [Google Scholar] [CrossRef] [Scilit]
- Xu, Z.; Zhong, X.; Zhang, Z. Does the Sino–US trade friction promote firm innovation? The role of the export grab effect. Sustainability 2022, 14, 2709. [Google Scholar] [CrossRef] [Scilit]
- Li, L.S.; Liu, Y.; Yuan, J. The effect of the US–China trade war on Chinese corporate innovation: A curse or a blessing? World Econ. 2025, 48, 1446–1464. [Google Scholar] [CrossRef] [Scilit]
- Zheng, F.; Chen, X.; Sun, Y. The influence of trade policy uncertainty on corporate innovation strategies. Financ. Res. Lett. 2025, 75, 106922. [Google Scholar] [CrossRef] [Scilit]
- Tian, S.; Zhang, X.; Ge, B. The impact of Sino-US trade frictions on innovation investment in high-tech enterprises. Financ. Res. Lett. 2025, 86, 108887. [Google Scholar] [CrossRef] [Scilit]
- Krogh, V.G. Artificial intelligence in organizations: New opportunities for phenomenon-based theorizing. Acad. Manag. Discov. 2018, 4, 404–409. [Google Scholar] [CrossRef] [Scilit]
- Feuerriegel, S.; Shrestha, Y.R.; Krogh, V.G.; Zhang, C. Bringing artificial intelligence to business management. Nat. Mach. Intell. 2022, 4, 611–613. [Google Scholar] [CrossRef] [Scilit]
- Wang, A.; Luo, K.; Nie, Y. Can artificial intelligence improve enterprise environmental performance: Evidence from China. J. Environ. Manag. 2024, 370, 123079. [Google Scholar] [CrossRef] [Scilit]
- Zou, M.; Yang, Y. Unveiling the impact of artificial intelligence on corporate misconduct, the perspective of information asymmetry. Technol. Forecast. Soc. Change 2026, 225, 124506. [Google Scholar] [CrossRef] [Scilit]
- Lin, N.; Li, A.; Geng, Y.; Yao, J.; Liu, C. The role of artificial intelligence in enhancing firm investment efficiency. Int. Rev. Financ. Anal. 2026, 109, 104830. [Google Scholar] [CrossRef] [Scilit]
- Xi, K.; Shao, X. Impact of AI applications on corporate green innovation. Int. Rev. Econ. Financ. 2025, 99, 104007. [Google Scholar] [CrossRef] [Scilit]
- Messeri, L.; Crockett, M.J. Artificial intelligence and illusions of understanding in scientific research. Nature 2024, 627, 49–58. [Google Scholar] [CrossRef] [Scilit] [PubMed]
- Guo, M.; Wang, S. The US-China trade war: Impact on corporate social responsibility decoupling and corporate resilience. Energy Econ. 2026, 157, 109251. [Google Scholar] [CrossRef] [Scilit]
- Meinderts, T. The power of Section 301: The Reagan tariffs in an age of economic globalization. Globalizations 2020, 17, 746–758. [Google Scholar] [CrossRef] [Scilit]
- Wang, P.; Li, Y.; Wu, S. Time-varying effects of US economic policy uncertainty on exchange rate return and volatility in China. Emerg. Mark. Financ. Trade 2022, 58, 1807–1820. [Google Scholar] [CrossRef] [Scilit]
- Wang, X.; Shi, B. Transmission and diffusion effect of Sino-US trade friction along global value chains. Financ. Res. Lett. 2022, 46, 102057. [Google Scholar] [CrossRef] [Scilit]
- Brander, J.A.; Spencer, B.J. Export subsidies and international market share rivalry. J. Int. Econ. 1985, 18, 83–100. [Google Scholar] [CrossRef] [Scilit]
- Henson, S.; Heasman, M. Food safety regulation and the firm: Understanding the compliance process. Food Policy 1998, 23, 9–23. [Google Scholar] [CrossRef] [Scilit]
- Maskus, K.E.; Wilson, J.S. Quantifying the Impact of Technical Barriers to Trade: Can it Be Done? University of Michigan Press: Ann Arbor, MI, USA, 2001. [Google Scholar]
- Hall, B.H. The financing of research and development. Oxf. Rev. Econ. Policy 2002, 18, 35–51. [Google Scholar] [CrossRef] [Scilit]
- Melitz, M.J. The impact of trade on intra-industry reallocations and aggregate industry productivity. Econometrica 2003, 71, 1695–1725. [Google Scholar] [CrossRef] [Scilit]
- Gorodnichenko, Y.; Svejnar, J.; Terrell, K. Globalization and innovation in emerging markets. Am. Econ. J. Macroecon. 2010, 2, 194–226. [Google Scholar] [CrossRef] [Scilit]
- Hombert, J.; Matray, A. Can innovation help US manufacturing firms escape import competition from China? J. Financ. 2018, 73, 2003–2039. [Google Scholar] [CrossRef] [Scilit]
- Dang, J.; Motohashi, K. Patent statistics: A good indicator for innovation in China? Patent subsidy program impacts on patent quality. China Econ. Rev. 2015, 35, 137–155. [Google Scholar] [CrossRef] [Scilit]
- Ang, Y.Y.; Jia, N.; Yang, B.; Huang, K.G. China’s low-productivity innovation drive: Evidence from patents. Comp. Polit. Stud. 2024, 57, 2011–2045. [Google Scholar] [CrossRef] [Scilit]
- Schumpeter, J. Business Cycles: A Theoretical and Statistical Analysis of the Capitalist Process; McGraw-Hill: New York, NY, USA, 1939. [Google Scholar]
- Brynjolfsson, E.; McAfee, A. Race Against the Machine: How the Digital Revolution is Accelerating Innovation, Driving Productivity, and Irreversibly Transforming Employment and the Economy; Digital Frontier Press: Tokyo, Japan, 2007. [Google Scholar]
- Martínez-Caro, E.; Cegarra-Navarro, J.G.; Alfonso-Ruiz, F.J. Digital technologies and firm performance: The role of digital organisational culture. Technol. Forecast. Soc. Change 2020, 154, 119962. [Google Scholar] [CrossRef] [Scilit]
- Belhadi, A.; Mani, V.; Kamble, S.S.; Khan, S.A.R.; Verma, S. Artificial intelligence-driven innovation for enhancing supply chain resilience and performance under the effect of supply chain dynamism: An empirical investigation. Ann. Oper. Res. 2024, 333, 627–652. [Google Scholar] [CrossRef] [Scilit]
- Han, M.; Shen, H.; Wu, J.; Zhang, X. Artificial Intelligence and Firm Resilience: Empirical Evidence from Natural Disaster Shocks. Inf. Syst. Res. 2025, 36, 2116–2133. [Google Scholar] [CrossRef] [Scilit]
- Cheng, Z.; Masron, T.A. Economic policy uncertainty and corporate digital transformation: Evidence from China. Appl. Econ. 2023, 55, 4625–4641. [Google Scholar] [CrossRef] [Scilit]
- Fan, L.; Sun, Y.; Wu, T. Is climate policy uncertainty an angel or a devil? Empirical evidence from corporate digital transformation. Int. Rev. Financ. Anal. 2025, 103, 104135. [Google Scholar] [CrossRef] [Scilit]
- Trist, E.; Higgin, G.; Murray, H.; Pollock, A.B. Organisational Choice; Tavistock Publications: London, UK, 1963. [Google Scholar]
- Geels, F.W. From sectoral systems of innovation to socio-technical systems: Insights about dynamics and change from sociology and institutional theory. Res. Policy 2004, 33, 897–920. [Google Scholar] [CrossRef] [Scilit]
- Sony, M.; Naik, S. Industry 4.0 integration with socio-technical systems theory: A systematic review and proposed theoretical model. Technol. Soc. 2020, 61, 101248. [Google Scholar] [CrossRef] [Scilit]
- Sachan, S.; Almaghrabi, F.; Yang, J.B.; Xu, D.L. Human-AI collaboration to mitigate decision noise in financial underwriting: A study on FinTech innovation in a lending firm. Int. Rev. Financ. Anal. 2024, 93, 103149. [Google Scholar] [CrossRef] [Scilit]
- Cheng, H.; Lin, S.; Hong, C. Quantity or efficiency? The impact of AI adoption on firm innovation: Evidence from Chinese listed companies. Socio-Econ. Plan. Sci. 2026, 105, 102450. [Google Scholar] [CrossRef] [Scilit]
- Luo, X.; Yu, D.; Zhou, D. Does AI catalyze novelty? Generative AI, resource allocation novelty, and innovation quality of high-performing manufacturing enterprises in emerging markets. Technovation 2026, 153, 103525. [Google Scholar] [CrossRef] [Scilit]
- Lu, Y.; Yu, L. Trade liberalization and markup dispersion: Evidence from China’s WTO accession. Am. Econ. J. Appl. Econ. 2015, 7, 221–253. [Google Scholar] [CrossRef] [Scilit]
- Bai, Y.; Jia, R. Elite recruitment and political stability: The impact of the abolition of China’s civil service exam. Econometrica 2016, 84, 677–733. [Google Scholar] [CrossRef] [Scilit]
- Tang, P.; Jiang, Q.; Wang, C. Beyond environmental actions: How environmental regulations stimulate strategic-political CSR engagement in China? Energy Econ. 2024, 129, 107171. [Google Scholar] [CrossRef] [Scilit]
- Ma, R.; Lv, W.; Zhao, Y. The impact of TMT experience heterogeneity on enterprise innovation quality: Empirical analysis on Chinese listed companies. Sustainability 2022, 14, 16571. [Google Scholar] [CrossRef] [Scilit]
- Zhu, X.; Wu, H.; Deng, Q. Quantity or quality: Novel insights into the impact of digital finance on innovation. Financ. Res. Lett. 2024, 65, 105603. [Google Scholar] [CrossRef] [Scilit]
- Liang, S. Bank competition, market concentration and innovation: Insights from China’s patent pledge financing policy. Financ. Res. Lett. 2025, 82, 107590. [Google Scholar] [CrossRef] [Scilit]
- Han, Q.; Li, C. Patent quality and enterprise digital transformation. Int. Rev. Financ. Anal. 2026, 109, 104543. [Google Scholar] [CrossRef] [Scilit]
- Zhang, X.; Xue, Q.; Liu, H.; Wei, J. Financial-judicial specialization and corporate innovation: Evidence from the establishment of financial courts in China. J. Int. Financ. Mark. Inst. Money 2026, 109, 102328. [Google Scholar] [CrossRef] [Scilit]
- Aghion, P.; Akcigit, U.; Bergeaud, A.; Blundell, R.; Hémous, D. Innovation and top income inequality. Rev. Econ. Stud. 2019, 86, 1–45. [Google Scholar] [CrossRef] [Scilit]
- Akcigit, U.; Baslandze, S.; Stantcheva, S. Taxation and the international mobility of inventors. Am. Econ. Rev. 2016, 106, 2930–2981. [Google Scholar] [CrossRef] [Scilit]
- Heger, D.; Zaby, A.K. Patent breadth as effective barrier to market entry. Econ. Innov. New Technol. 2018, 27, 174–188. [Google Scholar] [CrossRef] [Scilit]
- Beck, T.; Levine, R.; Levkov, A. Big bad banks? The winners and losers from bank deregulation in the United States. J. Financ. 2010, 65, 1637–1667. [Google Scholar] [CrossRef] [Scilit]
- Ferrara, E.L.; Chong, A.; Duryea, S. Soap operas and fertility: Evidence from Brazil. Am. Econ. J. Appl. Econ. 2012, 4, 1–31. [Google Scholar] [CrossRef] [Scilit]
- Yang, D. Pendency and grant ratios of invention patents: A comparative study of the US and China. Res. Policy 2008, 37, 1035–1046. [Google Scholar] [CrossRef] [Scilit]
- He, Y.; Tang, S.; Wang, L.; Wang, S.; Yu, T. Private equity market development, state ownership, and firm innovation: Evidence from China. Int. Rev. Econ. Financ. 2024, 91, 958–985. [Google Scholar] [CrossRef] [Scilit]
- Wu, Q.; Guo, L.; Li, D. Artificial intelligence and corporate shadow banking: Evidence from distorted innovation. Technol. Soc. 2026, 86, 103256. [Google Scholar] [CrossRef] [Scilit]
- Yao, J.; Zhang, K.; Guo, L.; Feng, X. How does artificial intelligence improve firm productivity? Based on the perspective of labor skill structure adjustment. J. Manag. World 2024, 40, 101–116. (In Chinese) [Google Scholar]
- Preacher, K.J.; Hayes, A.F. SPSS and SAS procedures for estimating indirect effects in simple mediation models. Behav. Res. Methods Instrum. Comput. 2004, 36, 717–731. [Google Scholar] [CrossRef] [Scilit]
- Ebers, M.; Maurer, I. Connections count: How relational embeddedness and relational empowerment foster absorptive capacity. Res. Policy 2014, 43, 318–332. [Google Scholar] [CrossRef] [Scilit]
- Liu, Z.; Huang, Y. Skill is power: Does the executive’s IT background affect the audit opinion? Manag. Audit. J. 2025, 40, 1060–1099. [Google Scholar] [CrossRef] [Scilit]
- Hurtado, J.M.; Herrero, I. Board of directors and firm resilience from a social capital perspective. Corp. Soc. Responsib. Environ. Manag. 2024, 31, 2770–2782. [Google Scholar] [CrossRef] [Scilit]

Disclaimer/Publisher’s Note: The statements, opinions and data contained in all publications are solely those of the individual author(s) and contributor(s) and not of MDPI and/or the editor(s). MDPI and/or the editor(s) disclaim responsibility for any injury to people or property resulting from any ideas, methods, instructions or products referred to in the content. |
© 2026 by the authors. Licensee MDPI, Basel, Switzerland. This article is an open access article distributed under the terms and conditions of the Creative Commons Attribution (CC BY) license.