Article

The Inverted-U Relationship Between AI and Corporate Innovation Performance

School of Public Administration, South China University of Technology, Guangzhou 510641, China
*
Author to whom correspondence should be addressed.
Systems 2026, 14(5), 520; https://doi.org/10.3390/systems14050520
Submission received: 19 March 2026 / Revised: 22 April 2026 / Accepted: 29 April 2026 / Published: 7 May 2026

Abstract

The rapid advancement of artificial intelligence (AI) has reshaped corporate innovation, yet the existing literature has largely overlooked the non-linear boundary conditions of AI’s innovation effects. This study asks: what is the functional form of the AI–innovation relationship, and through which mechanisms does it operate? Using a sample of 25,204 firm-year observations from Chinese A-share manufacturing companies (2010–2023), we employ fixed-effects models, U-tests, bootstrap mediation, and text similarity analysis. The findings reveal an inverted-U-shaped relationship with a turning point at 2.948. Absorptive capacity partially mediates this relationship, while industry concentration negatively moderates it. Patent text similarity analysis confirms the “homogenization trap.” Heterogeneity analysis shows AI’s enabling effect is more sustainable in non-state-owned and high-tech firms. This study extends the TOE framework by identifying the optimal AI adoption range and empirically validating the homogenization trap, offering guidance for firms to invest in proprietary AI models and for governments to promote open data initiatives. Future research should test these findings across different institutional contexts, particularly European economies.

1. Introduction

Manufacturing is the cornerstone of China’s national economy and a key pillar of high-quality economic development. At present, Chinese manufacturing enterprises are undergoing a critical phase of structural adjustment. Innovation serves as the primary driving force for enhancing the quality and efficiency of the manufacturing sector; fully harnessing enterprises’ inherent innovative potential is a vital task in the current process of building a modern industrial system. In 2021, the Ministry of Industry and Information Technology, in conjunction with the National Development and Reform Commission and other departments, issued the “14th Five-Year Plan for the Development of Intelligent Manufacturing”, which clearly outlined a new pathway for the intelligent transformation of the manufacturing sector, with intelligent manufacturing emerging as a new direction for the innovative development of manufacturing enterprises. At the same time, artificial intelligence (AI), as a key technology in the new generation of technological revolution, offers enterprises greater opportunities for development. Against this backdrop, clarifying the impact of AI on corporate innovation performance and its underlying mechanisms holds significant practical importance for fully leveraging AI to drive innovation in manufacturing enterprises and facilitating their intelligent transformation.
Research into the impact of artificial intelligence on corporate innovation has become a key topic in the field of innovation management. Existing research indicates that, through its ability to process big-data models, artificial intelligence is reshaping the paradigm of corporate innovation [1,2]. In terms of specific approaches, existing research has primarily focused on knowledge management, organisational change and process optimisation to reveal the mechanisms through which artificial intelligence drives innovation. In the field of knowledge management, artificial intelligence has significantly enhanced corporate innovation efficiency [3,4] by expanding the boundaries of knowledge [5], promoting knowledge coupling [6] and optimising knowledge allocation [7]. In terms of organisational change, artificial intelligence has broken traditional organisational practices [8] and, by reshaping the research and development system, has stimulated innovation within organisations [9].
In European management studies, scholars have examined the relationship between artificial intelligence and innovation from various theoretical perspectives. For instance, Teece (2018) argues that artificial intelligence enhances dynamic capabilities by accelerating identification of and capitalisation on opportunities [10]; Vial (2019), however, cautions that the organisational transformation triggered by artificial intelligence often lags behind technological adoption, thereby creating a “capability gap” [11]. Ransbotham et al. (2019), drawing on a survey of European firms, found that the benefits of AI adoption diminish once a certain threshold is exceeded [12]; however, they did not identify the precise inflexion point or its underlying mechanisms. It is evident that European research remains largely silent on the non-linear boundary conditions of AI’s innovation effects, particularly regarding the roles played by absorptive capacity and market concentration. These cross-contextual differences present an opportunity for this study to expand upon this research within the Chinese context. Furthermore, in terms of process optimisation, AI has achieved end-to-end support from problem identification to solution implementation [13]; whilst ensuring the precision of innovation research, it has also significantly improved the success rate of innovation investment [14]. It is worth noting that firms are heterogeneous micro-entities; consequently, the innovation-enabling effects of AI also exhibit distinct heterogeneous characteristics: at the firm level, there are differences in the extent to which firms of varying sizes, industries and ownership structures benefit from AI [15]; from an external environment perspective, the competitive landscape imposes constraints on the effects of AI [16]. Given the complexity of AI’s innovation effects, some scholars have proposed an alternative view, suggesting that there is a non-linear relationship between AI and firm innovation [17], and that the relationship between AI and firm innovation performance follows an inverted-U shape [18]. However, most existing research has focused on the theoretical derivation of these non-linear characteristics [19], and has yet to identify the inflexion points or optimal ranges of AI’s non-linear effects; the boundaries of its influence remain unclear [20], making it difficult to provide guidance for the optimal allocation of AI resources in practice. Consequently, the non-linear relationship of AI’s innovation effects and its underlying mechanisms require further elucidation.
The foregoing literature review reveals a critical gap: while prior studies have acknowledged the non-linear nature of AI’s impact on innovation, neither the precise turning point nor the underlying mechanisms have been empirically identified. Moreover, existing European research has largely focused on linear or context-independent effects, leaving unanswered the question of whether and how the inverted-U-shaped relationship varies across ownership types and technological intensities.
This study therefore seeks to answer the following research question: What is the functional form of the relationship between AI adoption and corporate innovation performance? Through which mechanisms does this relationship operate under different internal and external conditions? This study aims to empirically identify the optimal range of AI adoption for corporate innovation, test whether absorptive capacity mediates the inverted-U-shaped relationship, examine how industry concentration moderates this relationship, and compare the heterogeneous effects across state-owned versus non-state-owned enterprises and high-tech versus low-tech industries. By doing so, we extend the TOE framework and provide actionable insights for both managers and policymakers.

2. Theoretical Framework and Hypothesis Development

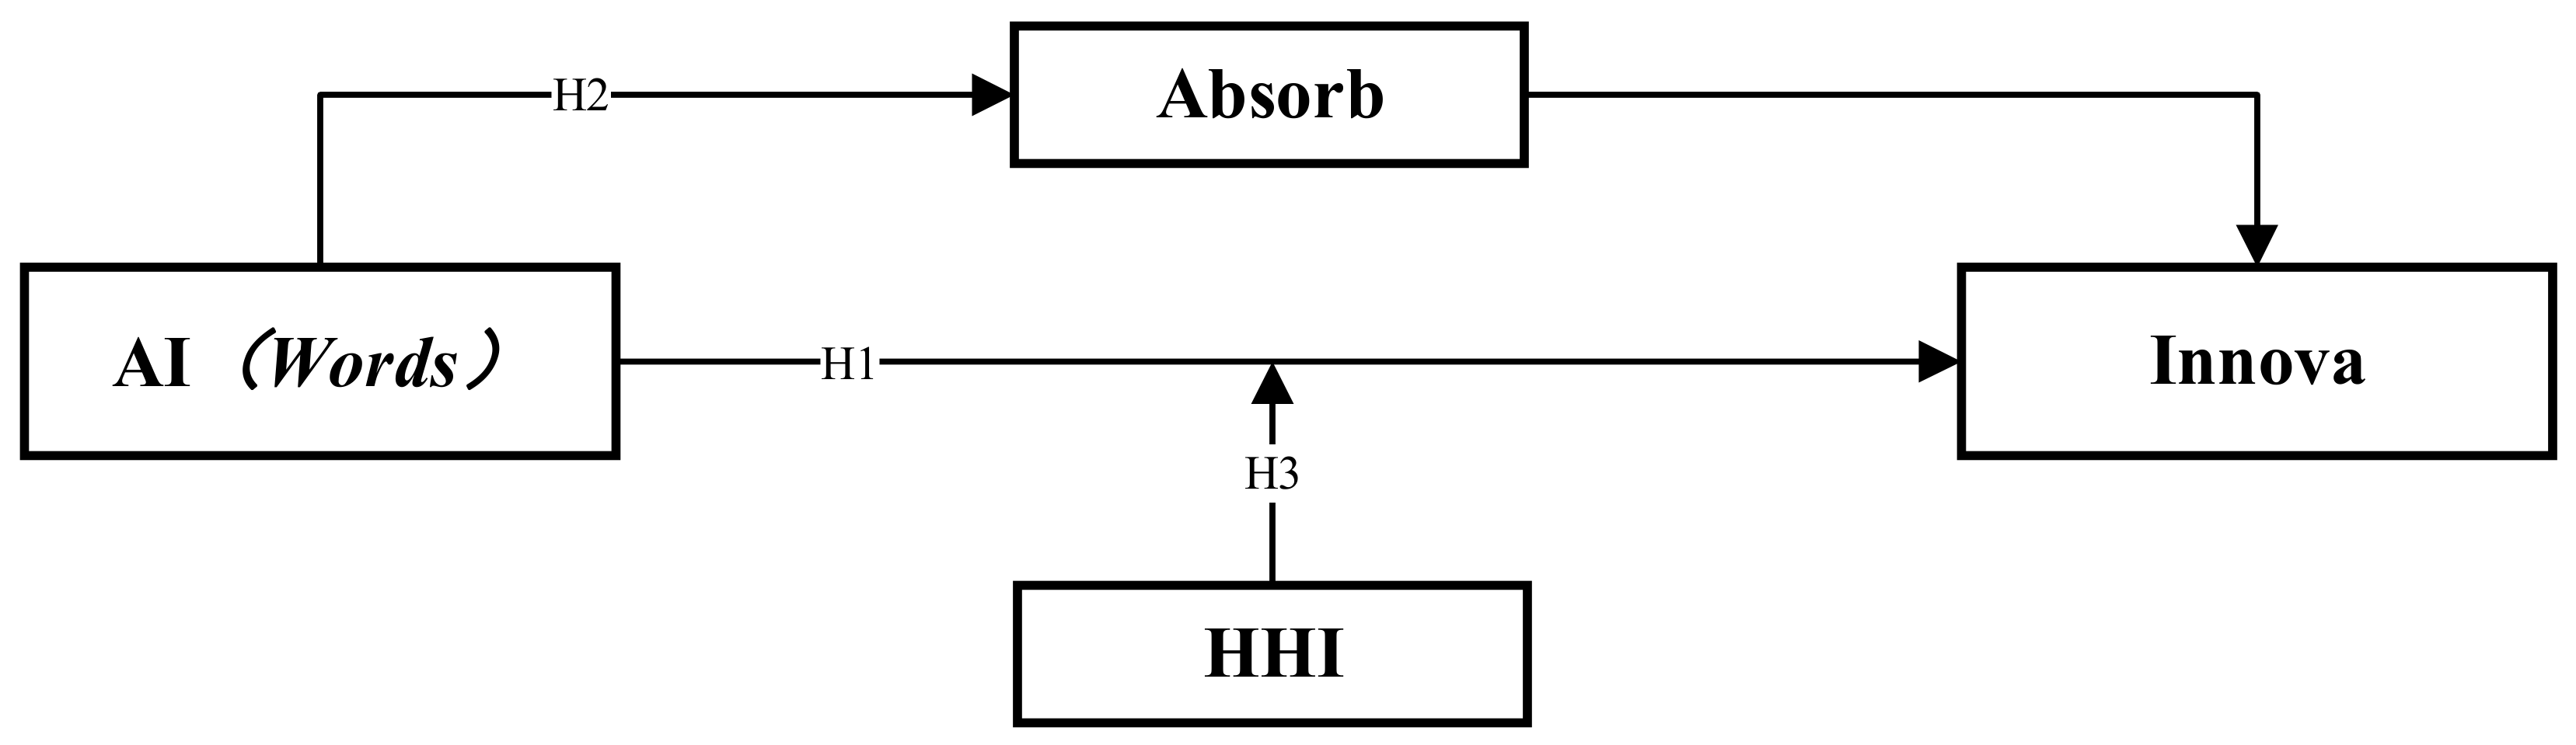
The Technology–Organisation–Environment (TOE) framework posits that innovative behaviour is influenced by a triad of factors: technology, organisation and environment; furthermore, the specific elements encompassed by these three dimensions vary across different contexts [21]. At the organisational level, corporate innovation is conceptualised as a process whereby an organisation transforms technological benefits through the strategic allocation of internal and external resources. The integration of artificial intelligence (AI) provides organisations with more efficient technological resources for innovation. Against this backdrop, the integration of AI technology into the allocation of organisational resources can significantly enhance an organisation’s innovation performance (Figure 1).
The rise of artificial intelligence technology marks a shift in the innovation paradigm, exerting a profound influence on the reshaping of innovation behaviour, the integration of innovation resources, and the industrialisation of innovation outcomes [22]. Artificial intelligence technology serves as a key enabler of corporate innovation, capable of transforming traditional innovation models through multiple pathways. From the perspective of resource combination, the essence of acquiring a competitive advantage lies in the ability to efficiently combine and dynamically allocate resources, whilst the breadth and depth of AI application determine the effectiveness of a firm’s resource allocation and the boundaries of its innovation capacity [23]. In terms of risk management, the deep learning capabilities of artificial intelligence can help enterprises identify potential risks in the innovation process, optimise innovation pathways, and reduce the trial-and-error costs of innovation. Currently, the application of artificial intelligence has expanded from the R&D stage to the full process of industrialisation [13]. It is worth noting that the limitations of AI should also be addressed. Its reliance on data and computational power means that predictive accuracy declines when data collection is restricted. At the same time, the widespread adoption of AI technology has lowered the barrier to entry, which may trap enterprises in a cycle of homogenised innovation. Over-reliance on AI-generated solutions can progressively weaken an enterprise’s innovative capacity and may ultimately hinder improvements in innovation performance. Based on this, the first hypothesis of this paper is proposed:
H1. 
There is an inverted-U-shaped relationship between artificial intelligence and corporate innovation performance.
In the process of artificial intelligence transformation, the key to an enterprise’s innovative development lies not only in the introduction of technology, but also in building the organisational transformation capabilities required to support it [24], namely the enterprise’s absorptive capacity. Absorptive capacity refers to an enterprise’s comprehensive ability to identify the value of external knowledge and ultimately commercialise it. When AI provides technological solutions, enterprises with strong absorptive capacity can more effectively translate this technical knowledge into internal practice. By dynamically adjusting organisational configurations, they maximise the value of the technology. This absorptive capacity manifests as a progressive relationship across three dimensions: technology value identification, knowledge transformation, and innovation application. Enterprises with strong absorptive capacity can adapt to the application of artificial intelligence within shorter cycles, achieving a faster value transformation from technological investment to innovative output. Consequently, the impact of AI on corporate innovation performance may be realised through the enhancement of organisational absorptive capacity. Based on this, the second hypothesis of this paper is proposed:
H2. 
Absorptive capacity mediates the relationship between AI and corporate innovation performance.
In a dynamically competitive market environment, market competitiveness is a challenge that corporate innovation must confront head-on. When assessing the innovative value of AI, the industry’s competitive environment must be fully taken into account. Industry concentration serves as a structural indicator of the market environment. When industry concentration is low, the market structure tends to be fragmented, and the market competition faced by firms is more intense; this pressure is transformed into a driving force for innovation. Conversely, when industry concentration is high, resources are concentrated in the hands of a small number of leading firms, creating market barriers that may weaken firms’ willingness to innovate [25]. Consequently, this market structure effect influences the impact of AI innovation. In more competitive markets, the enabling effect of AI may be more fully realised, whereas in less competitive markets, its enabling effect may be relatively weaker. Based on this, we propose the third hypothesis of this paper:
H3. 
Industry concentration negatively moderates the inverted-U-shaped relationship between AI and firm innovation performance.

3. Research Methodology

3.1. Data Sources and Sample

The subject of this study is Chinese companies listed on the Shanghai and Shenzhen A-share markets between 2010 and 2023. The reason for selecting 2010 as the starting point is that, during the third wave of artificial intelligence in 2010, research into deep learning intensified and its application gradually spread across various industries. Consequently, from 2010 onwards, the advantages of companies adopting artificial intelligence technology became more pronounced, thereby ensuring the validity of the data used in this study. The annual report data were sourced from Sina Finance (https://finance.sina.com.cn/ (accessed on 18 March 2026)), whilst the corporate data were obtained from the Guotai-An database (CSMAR) and the China Economic and Financial Database (CCER). These sources were selected based on their widespread validation in peer-reviewed studies. To ensure the quality of the research data, the following data processing steps were undertaken: (1) samples classified as “ST” or “*ST” in the relevant year were excluded; (2) samples with many missing values for the key research variables were excluded. Ultimately, this study obtained 25,204 valid observations, covering 2847 manufacturing enterprises.

3.2. Variables and Descriptions

To ensure conceptual clarity, this study distinguishes between primary variables and constructed indicators. All constructed indicators are clearly identified as such, and their calculation procedures are described step by step.
(1)
Primary Variables
The following variables were directly extracted from the CSMAR, CCER, and Sina Finance databases without any arithmetic transformation. These serve as the foundation for all subsequent calculations (Table 1).
(2)
Constructed Indicators
Each constructed indicator is calculated from the primary variables listed above. These indicators are used as input variables in the econometric models. Table 2 summarises the construction method and functional role of each indicator.
(3)
Measurement of complex indicators
① Artificial Intelligence Indicators (Words)
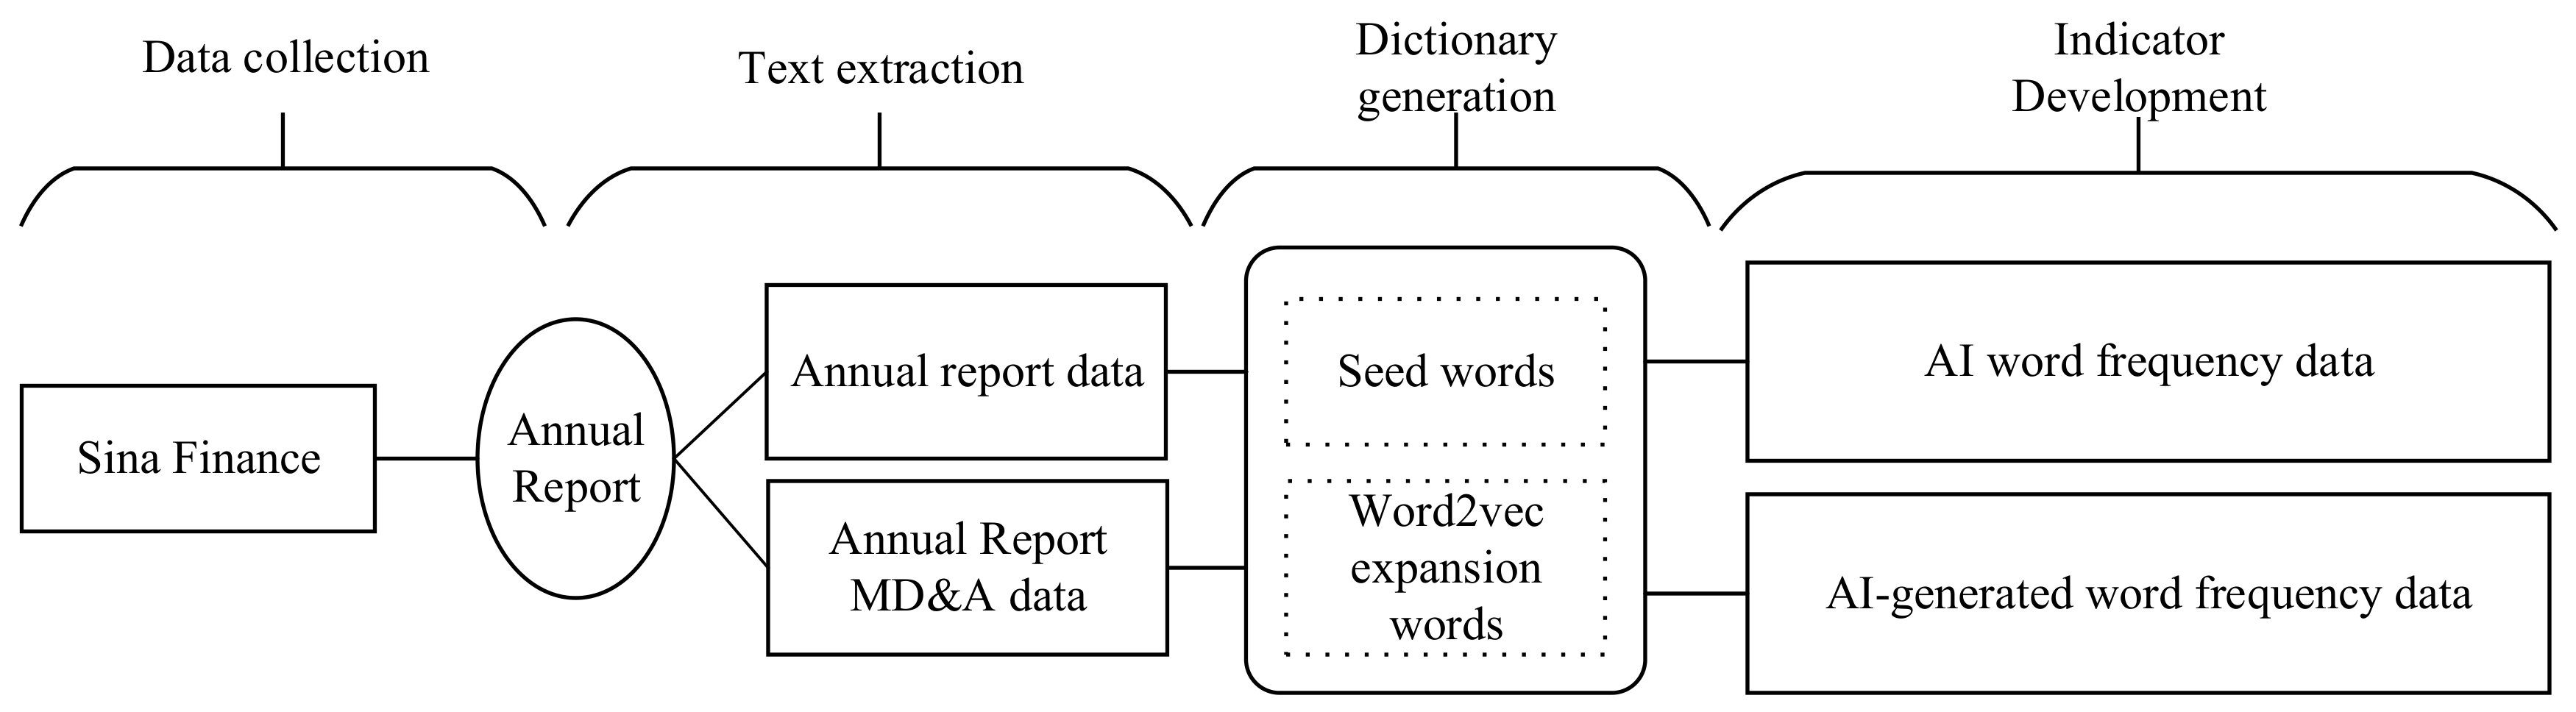
This paper employs machine learning methods to generate an artificial intelligence lexicon and subsequently constructs corporate artificial intelligence indicators based on listed companies’ annual reports and patent texts. The construction process is illustrated in Figure 2.
Data collection: Sina Finance is one of the most authoritative financial websites in China. The text-based annual reports of listed companies available on the site are easily accessible and analysable; furthermore, manual checks have revealed that the annual reports collected by Sina Finance are relatively comprehensive. Therefore, we have selected the Sina Finance website as the data source for listed companies’ annual reports. Patent texts are sourced from the IRPDB intellectual property database, which provides a relatively comprehensive collection of Chinese patent data; patent text data for listed companies can be obtained via the database’s application programming interface.
Generation of the artificial intelligence thesaurus: The steps for generating the artificial intelligence thesaurus are as follows: (1) Referring to the artificial intelligence glossary provided by Yao J Q et al. (2024) [27], 52 terms such as “artificial intelligence”, “machine learning”, “Internet of Things” and “cloud computing” were manually selected as seed words. (2) Using Word2vec technology and the Skip-gram model, the terms from the annual reports and patent texts were used as training data. Based on the cosine similarity between the seed words and the output words, the 10 words most semantically similar to each seed word were selected. (3) Duplicate words, terms unrelated to artificial intelligence, and words with excessively low frequency were removed, resulting in a final set of 73 words, which formed the artificial intelligence dictionary used in this paper.
Word frequency extraction—constructing AI indicators based on listed companies’ annual reports: As Chinese text lacks spaces for word segmentation and words constitute the smallest independent linguistic units, specialised word segmentation processing is required for annual report texts. We employed the widely used open-source Python (version 3.12) “jieba” Chinese word segmentation module to process the text of listed companies’ annual reports. Chinese text analysis presents three challenges: segmentation granularity, disambiguation of ambiguous terms, and the identification of neologisms. For example, “machine learning” is one of the core terms in artificial intelligence, but the “jieba” segmentation module splits it into two words: “machine” and “learning”. To address this issue, we incorporated a custom-generated artificial intelligence dictionary as a predefined proper noun dictionary into the “jieba” tokenisation module and counted the number of artificial intelligence terms in the listed companies’ annual reports. We adopted the natural logarithm of the number of artificial intelligence keywords in the annual reports plus one as the corporate artificial intelligence indicator. The specific calculation formula is
W o r d s = ln ( N i t + 1 )
In this context, W o r d s refers to the company’s level of AI adoption, whilst N i t refers to the frequency of AI-related terms used by the enterprise in year t.
② Absorptive capacity indicator (absorb)
Following Li et al. (2024) [28] and Jeon et al. (2015) [29], absorptive capacity is measured as the one-period-lagged entropy-weighted composite of two normalised R&D indicators: R&D intensity (R&D expenditure/operating revenue) and R&D personnel ratio (R&D employees/total employees).
Step 1 (Normalisation):
X i j t = X i j t min ( X j ) max ( X j ) min ( X j )
Step 2 (Entropy weight):
w j = 1 e j ( 1 e j ) ,   e j = 1 ln ( N ) p i j t ln ( p i j t )
Step 3 (Composite score):
A b s o r b i , t = w j X i j t
Step 4 (One-period lag):
L . Absorb i , t = Absorb i , t 1
This lagged variable is used as the final mediating variable in the regression models.
③ Industry concentration indicators (HHI)
Industry concentration is used to measure the intensity of market competition within an industry. This study employs the Herfindahl–Hirschman Index (HHI) as a measure of industry concentration. A higher HHI indicates greater industry concentration and lower market competition; a lower HHI indicates lower industry concentration and more intense market competition. The specific formula for calculating industry concentration is
H H I = i n c o m e i I N C O M E 2
INCOME represents the total revenue of the industry, whilst incomei represents the revenue of firm i within the industry. The higher the value of HHI, the more uneven the distribution of revenue within the industry, indicating a higher degree of industry concentration.

3.3. Model Settings

Based on the aforementioned analytical framework and research hypotheses, there exists a non-linear relationship between artificial intelligence and corporate innovation performance. Given that both the dependent variable and the core explanatory variables are continuous, this study draws on the work of Yao J Q et al. (2024) [27] to construct a fixed-effects model in order to test the non-linear relationship between artificial intelligence and corporate innovation performance. There are three reasons for selecting a two-way fixed-effects model. Firstly, the Hausman test rejected the random-effects model, supporting fixed-effects estimation. Secondly, the inclusion of firm-level fixed effects allows for the control of unobservable heterogeneity across firms that does not vary over time, whilst the year-level fixed effects absorb common time shocks. Thirdly, for panel data characterised by firm-level heterogeneity, this specification is standard practice in the innovation literature [26]. The specific model is as follows:
I n n o v a i t = α 0 + α 1 W o r d s i t + α 2 W o r d s i t 2 + α 3 C V i t + Y E + I N D + ε i t
In Equation (7), I n n o v a i t represents the innovation performance of firm i in year t; I n n o v a i t represents the level of artificial intelligence of firm i in year t; α 0 is the constant term; α 1 ~ α 3 is the regression coefficient of the model; CV denotes the control variables; ε i t the random disturbance term of the model. Furthermore, to ensure the robustness of the model, time (YE) and individual (IND) effects were also fixed.
The paper further examines the mediating role of absorptive capacity in the relationship between artificial intelligence and firm innovation performance. Based on the mediating effect testing method proposed by Aasvik O (2025) [33], the mediating effect testing model is constructed as follows:
A b s o r b i t = δ 0 + δ 1 W o r d s i t + δ 2 W o r d s i t 2 + δ 3 C V i t + Y E + I N D + ε i t
I n n o v a i t = θ 0 + θ 1 W o r d s i t + θ 2 W o r d s i t 2 + θ 3 A b s o r b i t + θ 4 C V i t + Y E + I N D + ε i t
In Equations (8) and (9), A b s o r b i t represents the absorption capacity of firm i in year t; δ 0 , θ 0 is a constant term; δ 1 ~ δ 3 , θ 1 ~ θ 4 is the regression coefficient of the model.
The external industry environment may confound the relationship between artificial intelligence and corporate innovation performance; therefore, this paper constructs a moderation model to test the moderating effect of industry concentration on the relationship between artificial intelligence and corporate innovation performance. This moderation model is an extension of Model (1), and the specific model is as follows:
I n n o v a i t = β 0 + β 1 W o r d s i t + β 2 W o r d s i t 2 + β 3 H H I i t + β 4 W o r d s i t × H H I i t + β 5 W o r d s i t 2 × H H I i t + C V i t + Y E + I N D + ε i t
In Equation (10), H H I i t denotes the Herfindahl–Hirschman Index (HHI) level of firm i in year t; β 0 is the constant term; β 1 ~ β 5 is the regression coefficient of the model.
Furthermore, based on the testing method for the U-shaped relationship moderation effect, this paper calculates and determines the changes in the axis of symmetry of the quadratic function, i.e., the inflexion points of the function. Firstly, by setting the first derivative of Words to zero in Model (4), we obtain the value of Words at the axis of symmetry (the turning point); the specific formula for the function is:
W o r d s = β 1 β 4 H H I 2 β 2 + 2 β 5 H H I
Since Equation (11) is a functional expression involving HHI, it is necessary to differentiate HHI further:
𝜕 W o r d s * 𝜕 H H I = β 1 β 5 β 2 β 4 2 ( β 2 + β 5 H H I ) 2
By substituting the regression coefficients into model (12) and performing the analysis, β 1 β 5 β 2 β 4 < 0 demonstrates that the moderator shifts the axis of symmetry of the main effect’s inverted-U-shaped relationship to the left, whilst β 1 β 5 β 2 β 4 > 0 demonstrates that the moderator shifts the axis of symmetry of the main effect’s inverted-U-shaped relationship to the right.

4. Results

4.1. Descriptive Statistics

The descriptive statistics for the main variables in this study are presented in Table 3. Specifically, there are significant differences in the level of corporate innovation performance, the dependent variable in this study. Although the maximum value of the log-transformed invention patent applications is 9.336 (corresponding to 11,342 in raw count), the median is only 2.302, indicating a clear “head–tail” concentration effect. At the same time, the mean is 2.421, suggesting that the innovation efforts of the vast majority of listed companies remain in the exploratory and initial stages. Secondly, the core explanatory variable in this study—artificial intelligence—has a maximum value of 6.028 and a mean of only 0.744, suggesting that the level of adoption of artificial intelligence among most enterprises is generally low. The median remains at 0, indicating that some enterprises are still adopting a wait-and-see approach regarding the adoption of artificial intelligence technology. The rapid development of artificial intelligence has ushered in a new wave of technological revolution; however, the application of AI technology is fraught with numerous unknowns. Consequently, whether enterprises will adopt AI and how they can best utilise it depends on their ability to unlock the “black box” of AI’s potential to empower corporate innovation. Therefore, this paper aims to elucidate the logical relationship between AI and corporate innovation performance through rigorous empirical testing.

4.2. The Impact of Artificial Intelligence on Corporate Innovation Performance

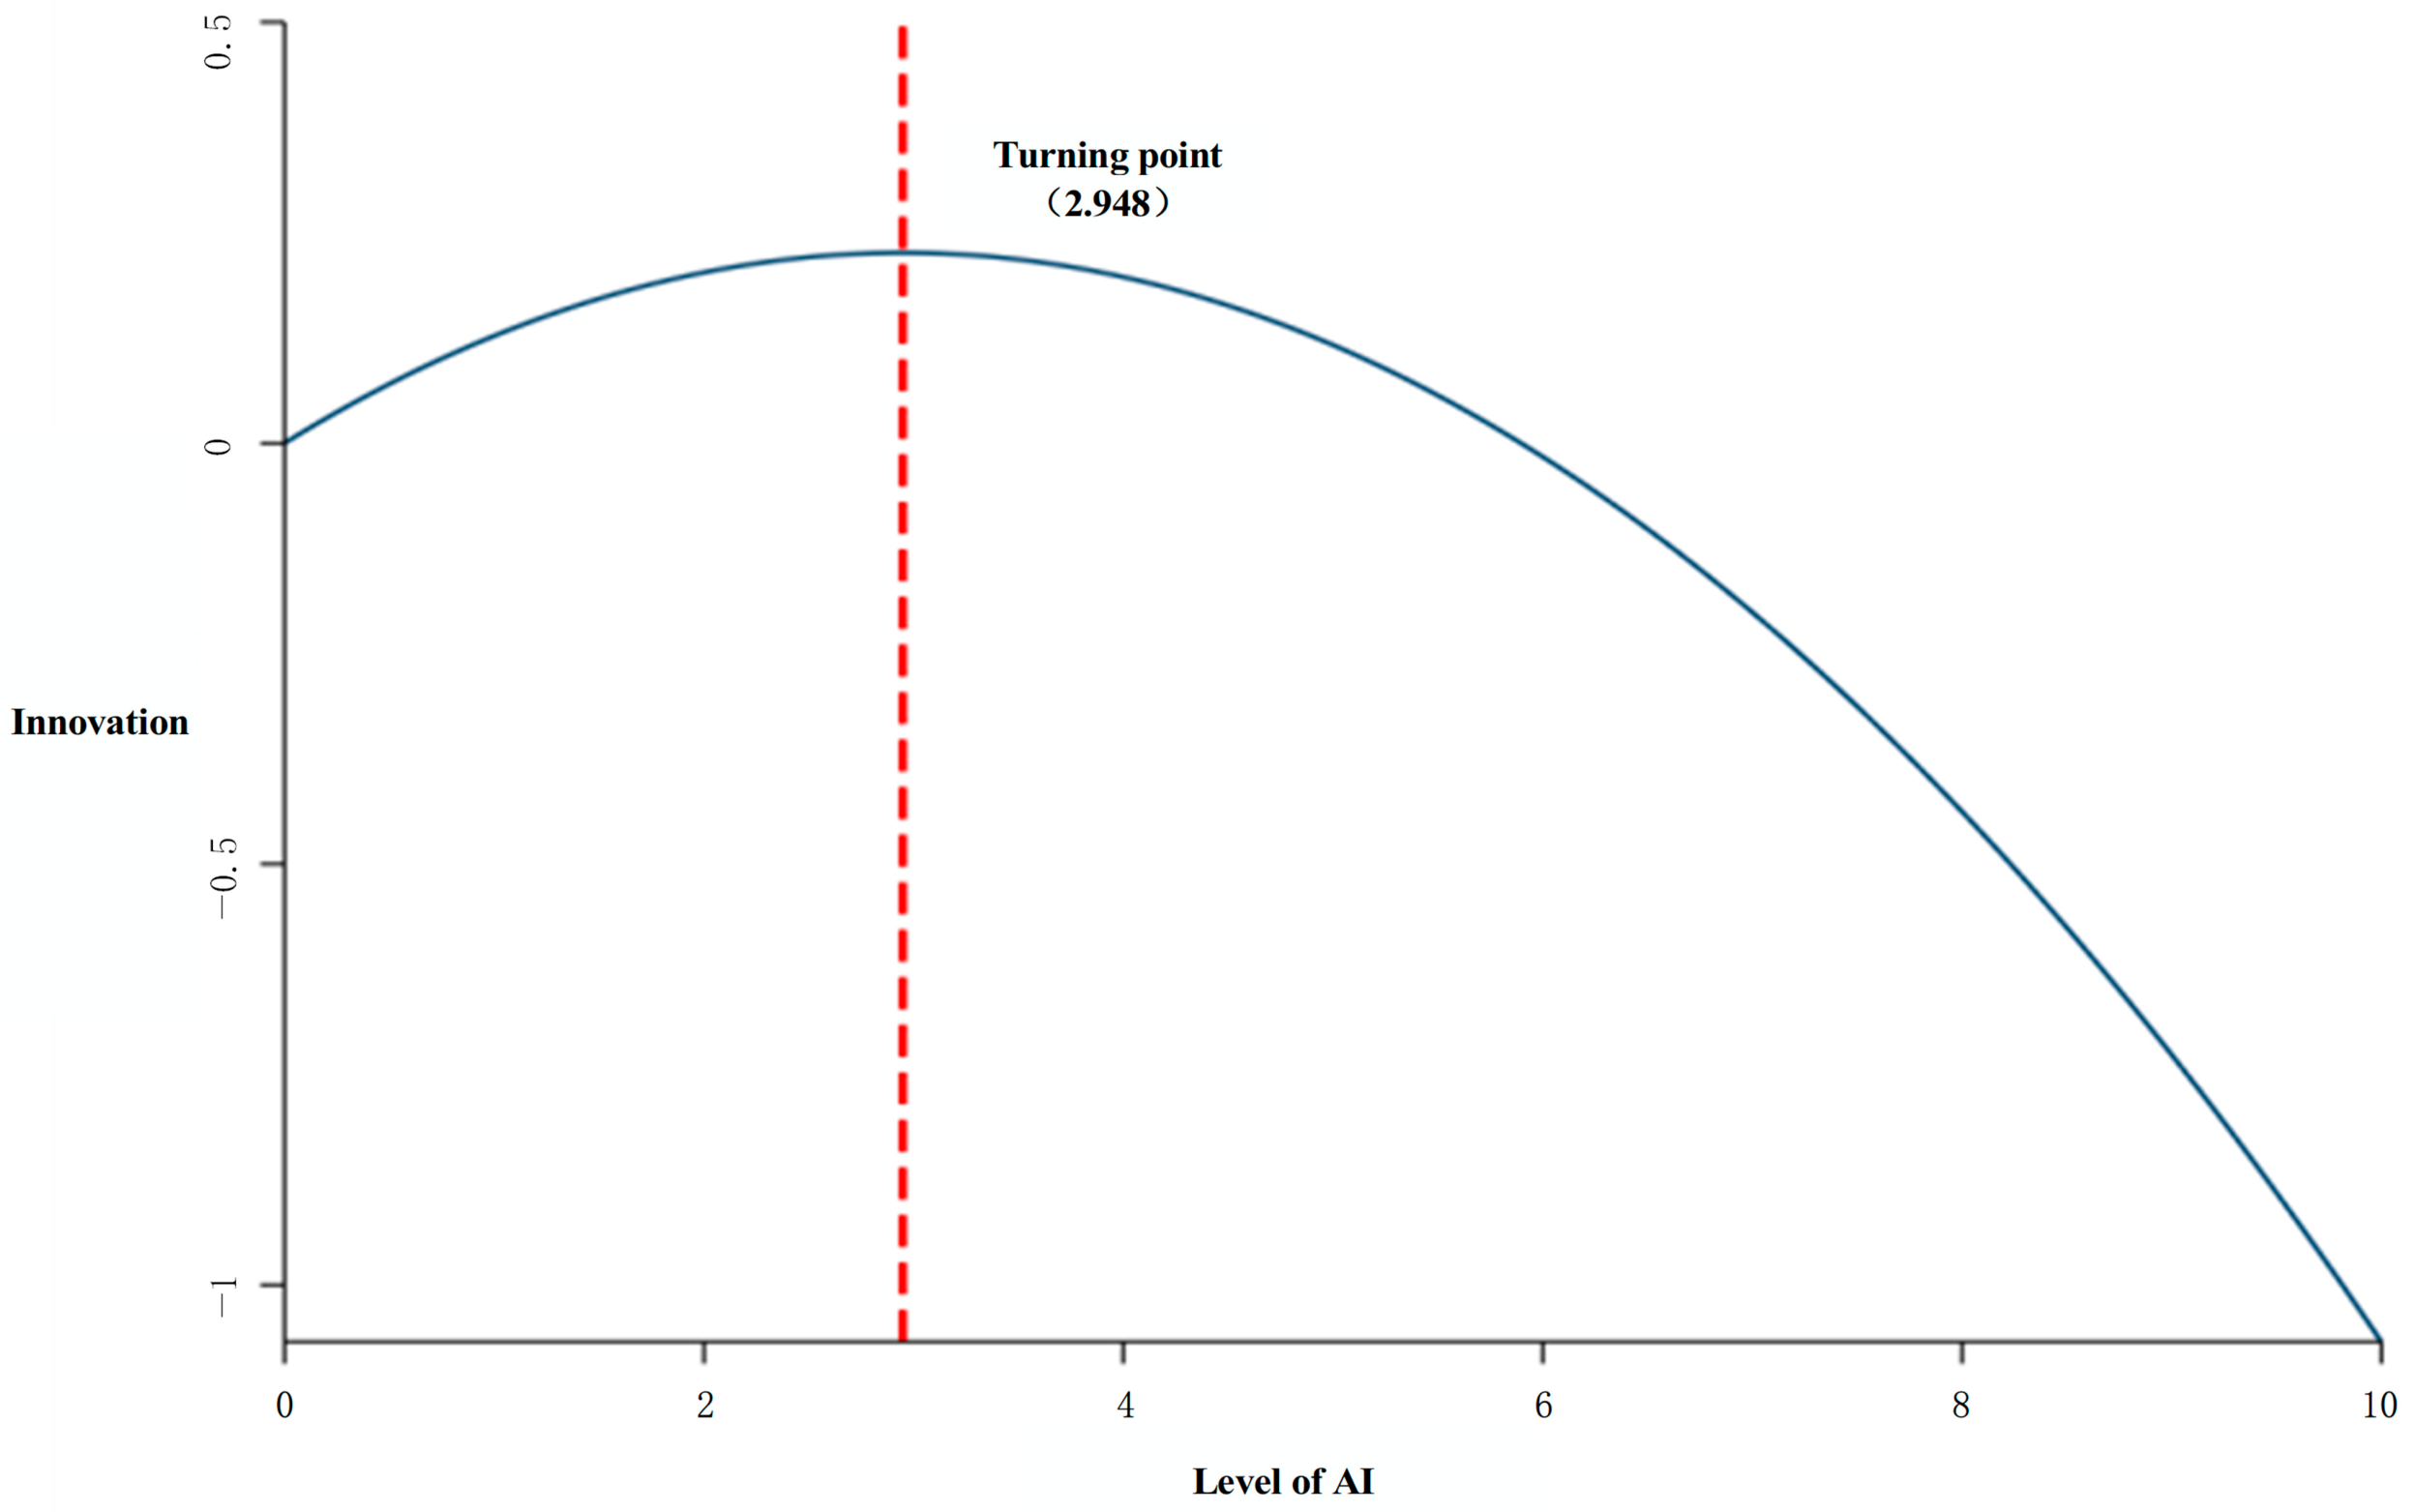
The results in Table 4 show that the coefficient of the linear term for AI is 0.153, which is significantly positive at the 1% significance level; whereas the coefficient of the quadratic term for AI is −0.026, which is significantly negative at the 10% significance level.The results indicate that the impact of AI on corporate innovation performance exhibits a non-linear inverted-U-shaped relationship; that is, excessively high levels of AI application inhibit corporate innovation, and there exists an optimal range for the enabling effect of AI on corporate innovation performance, thereby confirming hypothesis H1. Furthermore, based on the regression coefficients in Column (2), the turning point of the inverted-U curve is calculated to be 2.948. This implies that the positive effect of AI on corporate innovation performance exists within an “optimal range” of [0, 2.948]. If a firm relies excessively on AI beyond this optimal range, it may fall into an “empowerment trap”, thereby hindering improvements in innovation performance. It should be noted, however, that this estimated turning point is context-dependent and may vary across industries, time periods, and economic conditions. Therefore, managers should not treat this value as a universal threshold, but rather continuously monitor the marginal returns of AI adoption in their specific context. The paper further plots the inverted-U-shaped relationship between AI and corporate innovation performance (Figure 2). As can be seen from the figure, as the level of AI increases, corporate innovation performance clearly exhibits an inverted-U-shaped trend, rising initially and then declining.
Simply judging the existence of a non-linear relationship based on coefficients and signs has its limitations. To test the validity of the non-linear relationship between artificial intelligence and corporate innovation performance, this paper utilises the U-test command to examine this relationship; the specific results are shown in Table 5 and Figure 3. The results of the U-test indicate that the regression model includes both positive and negative slopes, whilst the inflexion point of the function falls within the sample range of the core explanatory variable, confirming the existence of an inverted-U-shaped relationship between artificial intelligence and corporate innovation performance. Specifically, the estimated turning point of the function is 2.948; that is, when a firm’s level of AI application reaches 2.948, it can elicit the maximum efficacy of AI in empowering corporate innovation. Once this level is exceeded, the empowering effect of AI on corporate innovation performance will gradually decline. Given the dynamic nature of AI technologies and their evolving diffusion across sectors, this turning point should be interpreted with caution. It is not a fixed threshold but rather a context-specific estimate that may shift as technological capabilities, market structures, and policy environments evolve.
To further analyse the underlying mechanisms of the inverted-U-shaped relationship, this paper conducts a similarity analysis on the word frequency data. Drawing on previous research on patent similarity measurement [34], Sentence-BERT was employed to vectorise the word frequencies in the annual reports, and the cosine similarity between word frequency pairs within the high-level and low-level groups was calculated. The results are shown in Table 6. The average intra-group cosine similarity for high-AI enterprises (0.324) was significantly higher than that for low-AI enterprises (0.187), with a difference of 0.137 (p < 0.001). This finding suggests that enterprises with higher levels of AI adoption exhibit greater homogeneity in their technical content, further corroborating the mechanism of the AI empowerment trap.

4.3. Robustness Testing

(1) Replacement of core explanatory variable measures. To ensure the reliability of the textual research findings, this paper employs two methods to test for the replacement of core explanatory variables. Firstly, the method of measuring word frequency is altered: instead of the exact AI word frequency used in the baseline regression, the Python (version 3.12) processing command is modified to measure AI extended word frequency (E-Words), and the AI level replacement indicator is ultimately measured using the method of taking the logarithm of the extended word frequency plus one; Secondly, drawing on the research findings of Lin Y K et al. (2025) [35], the number of AI patents was utilised as a proxy indicator for regression analysis. The regression results are presented in Table 7, columns (1) and (2). Following the substitution of the core explanatory variable, a significant U-shaped relationship between AI and corporate innovation performance persists.
(2) Truncation of the dependent variable. As can be seen from the descriptive statistics of the sample, the range of corporate innovation performance values is 0–11,342, with a relatively large standard deviation. To eliminate the interference of outliers on the regression results, this study further applied a 1–99% bilateral trimming to the dependent variable before taking the logarithm and performing the regression. The regression results are shown in Table 7, Column (3). After applying bilateral trimming to the dependent variable, a significant U-shaped relationship between AI and corporate innovation performance still holds.
(3) Narrowing the research sample window. Drawing on the research by Liu P et al. (2025) [36], this study conducted a regression after removing research samples from the four directly administered municipalities of Beijing, Tianjin, Shanghai and Chongqing to eliminate the interference of special samples on the regression. The regression results are shown in Table 7, column (4). After removing the samples from the directly administered municipalities, a significant U-shaped relationship between artificial intelligence and corporate innovation performance still holds.
(4) Adding higher-order terms of the explanatory variables. Drawing on the research by Ma Yanyan et al. (2025) [37], we incorporated the cubic terms of the explanatory variables into the baseline regression model. If the cubic terms are significant, this indicates an S-shaped non-linear relationship between the explanatory and dependent variables, rather than an inverted-U-shaped relationship. The regression results are shown in Table 7, column (5). The coefficient of the cubic term of the explanatory variable is not significant, confirming the U-shaped relationship between artificial intelligence and corporate innovation performance. In summary, the baseline regression results of this study are robust.

4.4. Endogenous Test

Although this paper has included fixed effects for both individuals and time in the baseline regression model, estimation bias due to endogeneity arising from omitted variables may still exist. Therefore, this paper attempts to test for and address potential endogeneity issues using the instrumental variables method. Firstly, drawing on the research by Yang X et al. (2024) [38], this study uses the level of AI adoption among peers (IV) as an instrumental variable for AI. This is because the level of AI adoption among peers exerts a peer effect on the firm, thereby driving the firm to increase its level of AI application, whilst the level of AI adoption among peers does not directly influence the firm’s innovation performance, thus satisfying the requirements for exogeneity and correlation of the instrumental variable. To ensure the reliability of the model, this paper further draws on the research by Reed W R et al. (2015) [39], incorporating the one-period lagged core explanatory variable (L.Words) as a second instrumental variable into the model. The specific regression results are shown in Table 8. The results indicate that the F-values in the first stage are all greater than 10, satisfying the correlation requirement for instrumental variables. Furthermore, the Kleibergen-Paap rk LM statistic test is significantly positive at the 1% significance level, indicating a strong rejection of the null hypothesis of “insufficient identification of the instrumental variables”. The results of Shea’s partial R-squared test are all greater than 0.5, indicating that the instrumental variables possess strong independent explanatory power for the endogenous variables, and there is no issue of weak instrumental variables. The above results indicate that, after eliminating endogeneity issues in the model, the impact of artificial intelligence on corporate innovation performance remains inverted-U-shaped, consistent with the baseline regression results, thereby confirming the reliability of the baseline regression findings.

4.5. The Mediating Role of Absorption Capacity

The results of the mediation analysis are presented in Table 9. As shown in Column (1), the regression coefficient for the linear term of artificial intelligence on absorptive capacity is 0.009, whilst that for the squared term is −0.002; these are significant at the 1% and 5% statistical levels, respectively. This satisfies the first condition for testing an inverted-U-shaped mediation effect, namely that the influence of artificial intelligence on absorptive capacity is significant and exhibits an inverted-U-shaped relationship. Column (2) reports the regression results of firm innovation performance on the linear term of AI, the squared term of AI, and absorptive capacity. The results show that the regression coefficients for the linear and squared terms of AI remain significant, and the effect of absorptive capacity on firm innovation performance is significantly positive at the 1% statistical level. This indicates that absorptive capacity plays a partial mediating role in the inverted-U-shaped relationship between AI and firm innovation performance. Furthermore, to ensure the robustness of the mediation results, this study conducted further tests using the Bootstrap method, with 5000 bootstrap samples. The results are shown in Table 10. The test results indicate that the point estimate of the indirect effect is 0.011, with a 95% confidence interval of [0.0052, 0.0168]; the point estimate of the direct effect is 0.048, with a 95% confidence interval of [0.0365, 0.0595]. Neither confidence interval includes 0, indicating that absorptive capacity mediates the main effect, thereby confirming hypothesis H2.

4.6. The Moderating Effect of Industry Concentration

Furthermore, this paper introduces industry concentration to investigate its moderating effect on the interaction between artificial intelligence and corporate innovation performance; the test results are presented in Table 11. The results of the industry concentration moderating effect test indicate that the regression coefficient for the interaction term between industry concentration and the quadratic term of artificial intelligence is −0.289, and this has a significant negative effect at the 5% statistical level; that is, industry concentration exerts a negative moderating effect on the inverted-U-shaped relationship between artificial intelligence and corporate innovation performance. Based on the testing methodology for the moderating effect of the U-shaped relationship, this paper calculated and assessed the shifts in the axis of symmetry of the quadratic function—that is, the inflexion point of the function. It was found that industry concentration causes the axis of symmetry of the main effect’s inverted-U shape to shift to the left; that is, as the intensity of industry concentration increases, the promotional effect of AI on corporate innovation performance exhibits a trend of diminishing returns, thereby confirming hypothesis H3.

4.7. Heterogeneity Analysis

Given the substantial differences between different types of enterprises, this paper further analyses the heterogeneous characteristics of the impact of artificial intelligence on corporate innovation performance across enterprise ownership and industry types. Firstly, the differing ownership structures of state-owned enterprises (SOEs) and private enterprises result in distinct differences in terms of resource endowments, political connections and decision-making efficiency; secondly, different industry types exhibit significant variations in innovation resources and technological innovation capabilities, leading to differing levels of demand for artificial intelligence. These differences may all contribute to the heterogeneous nature of the impact of artificial intelligence on corporate innovation performance across different types of enterprises. In this paper, whilst classifying enterprises into SOEs and non-SOEs based on their ownership structure, reference is made to the research by Li J et al. (2024) [40]. Furthermore, in accordance with the “Notice of the National Bureau of Statistics on Issuing the Classification Catalogue of High-Tech and Low-Tech Enterprises”, the sample enterprises were categorised into high-tech and low-tech industries.
(1) Enterprise type. The regression results are presented in Table 12, which indicates that the impact of AI on corporate innovation performance exhibits an inverted-U-shaped relationship in both the SOE and non-SOE samples. Calculations reveal that the inflexion point for SOEs is 2.212, whilst that for non-SOEs is 2.917; that is, the threshold effect of AI on innovation performance in non-SOEs lags behind that in SOEs.
(2) Industry type. The regression results are shown in Table 13. The results indicate that the impact of artificial intelligence on corporate innovation performance exhibits an inverted-U-shaped relationship in both the sample of low-tech industry enterprises and that of high-tech industry enterprises. Calculations show that the inflexion point of the function for low-tech industry enterprises is 1.131, whilst that for high-tech industry enterprises is 3.875; in other words, the threshold effect of artificial intelligence on innovation performance in high-tech industry enterprises lags behind that in low-tech industry enterprises.

5. Discussion

(1) There is a significant inverted-U-shaped relationship between AI and corporate innovation performance; this finding confirms that AI is not merely an enabling technology, and that its impact on innovation follows the law of diminishing marginal returns. Within the optimal range, AI enhances innovation efficiency by expanding the boundaries of knowledge, promoting knowledge coupling, and optimising resource allocation. However, once the level of AI adoption exceeds the inflexion point, firms fall into the so-called “AI empowerment trap”, wherein over-reliance on standardised solutions generated by AI leads to technological convergence and a loss of differentiated innovation capabilities; the patent text similarity analysis in this paper directly supports this mechanism. This finding extends the theoretical work of Duong (2025) and Deng et al. (2025) [17,18], who, whilst proposing a non-linear relationship, did not empirically identify the inflexion point. Furthermore, this study responds to the findings of Ransbotham et al. (2019) [12], based on a survey of European firms, which indicated that AI returns diminish after exceeding a certain threshold; however, this study has further precisely identified this inflexion point. It should be emphasised that the figure of 2.948 is context-dependent and should not be generalised.
(2) Absorptive capacity partially mediates the inverted-U-shaped relationship between AI and corporate innovation performance. This finding suggests that absorptive capacity is a key mechanism through which AI empowers innovation but not the sole pathway. It indicates the existence of other parallel mechanisms, such as process optimisation, risk management and organisational restructuring. This study extends the work of Jeon et al. (2015) and Li et al. (2024) [29,40], who established the mediating role of absorptive capacity in the relationship between artificial intelligence and innovation. It is important to emphasise that absorptive capacity is a necessary but not sufficient condition; firms should not rely solely on absorptive capacity to avoid the “AI-enabled trap”.
(3) Industry concentration negatively moderates the inverted-U-shaped relationship between AI and corporate innovation performance, shifting the axis of symmetry of the inverted-U curve to the left. This finding reveals the profound impact of market competition structures on the effects of AI innovation: in competitive markets, firms face greater innovation pressures and differentiation demands, providing stronger incentives to utilise AI for breakthrough innovation, thereby amplifying AI’s enabling effects; simultaneously, competitive pressures themselves inhibit technological homogenisation; conversely, in concentrated markets, firms lack incentives to innovate and tend to adopt off-the-shelf, standardised AI solutions to maintain the status quo. This accelerates technological convergence, causing the negative effects of AI to manifest at lower adoption levels. This study supports the conclusion of Pan et al. (2020) that market concentration suppresses the willingness to innovate, extending this finding to the AI context [25], whilst also responding to the call by Krakowski et al. (2023) [16] regarding shifts in the sources of AI’s competitive advantage. It is worth emphasising that monopolistic firms should exercise greater vigilance regarding AI investment and prioritise the development of differentiated, proprietary AI capabilities.
(4) Heterogeneity analysis reveals that the inflexion point for non-state-owned enterprises (2.917) is higher than that for state-owned enterprises (2.212), whilst the inflexion point for high-tech enterprises (3.875) is significantly higher than that for low-tech enterprises (1.131). This finding reveals the moderating mechanisms of ownership structure and industry technological intensity on the AI empowerment effect: whilst state-owned enterprises can access government resources and policy subsidies during the early stages of AI development, administrative constraints lead to resource redundancy and “AI for AI’s sake” investments, causing the return threshold to be reached prematurely; non-state-owned enterprises, although facing higher trial-and-error costs initially, are compelled by resource constraints to make more targeted AI investments, resulting in a rightward shift in the inflexion point. High-tech firms tend to utilise AI for in-depth technological exploration and proprietary algorithm development, effectively avoiding the homogenisation trap; low-tech firms, however, due to their weak technical capabilities, rely more heavily on standardised solutions, leading to rapid convergence in technological content. This study extends the findings of Li et al. (2024) [40] regarding ownership differences and adapts Dosi’s (1988) [41] technological innovation framework to the AI context. It is important to emphasise that a one-size-fits-all approach to AI policy is inefficient; firms should formulate differentiated AI application strategies based on their own attributes and industry characteristics.

6. Conclusions and Implications

This study asked what the functional form of the relationship between AI adoption and corporate innovation performance is, and through which mechanisms this relationship operates under different internal and external conditions. We find that the relationship follows an inverted-U-shaped function with a turning point at 2.948, indicating that moderate AI adoption enhances innovation performance while excessive adoption leads to diminishing returns. Absorptive capacity partially mediates this relationship, whereas industry concentration negatively moderates it. Furthermore, heterogeneity analysis reveals that the enabling effect of AI is more sustainable in non-state-owned and high-tech firms.

6.1. Research Findings

(1) H1 is supported. We find a significant inverted-U-shaped relationship between AI adoption and corporate innovation performance (coefficient of linear term = 0.153, p < 0.01; coefficient of quadratic term = −0.026, p < 0.10). The turning point is 2.948, indicating that moderate AI adoption enhances innovation performance, while excessive adoption leads to diminishing returns—a phenomenon we term the “AI-enabled trap.”
(2) H2 is partially supported. Absorptive capacity partially mediates the inverted-U-shaped relationship (indirect effect = 0.011, 95% CI [0.0052, 0.0168]; direct effect = 0.048, 95% CI [0.0365, 0.0595]). This suggests that absorptive capacity is one important mechanism, but other pathways may also exist.
(3) H3 is supported. Industry concentration negatively moderates the inverted-U-shaped relationship (interaction term coefficient = −0.289, p < 0.05). The enabling effect of AI on innovation is stronger in more competitive markets (lower industry concentration) and weaker in less competitive markets.
(4) Heterogeneity analysis indicates that, compared to state-owned enterprises and firms in low-tech industries, non-state-owned enterprises and firms in high-tech industries exhibit a relatively delayed threshold effect, with the enabling effect of AI on innovation demonstrating greater sustainability.

6.2. Research Implications

(1) Close attention should be paid to the optimal inflexion point for the application of artificial intelligence (AI) technology to prevent enterprises from falling into the AI “empowerment trap”. Based on research findings indicating an inverted-U-shaped relationship between AI and corporate innovation performance, it is recommended that enterprises establish a dynamic evaluation and adjustment mechanism for AI applications to continuously monitor their level of AI adoption. For enterprises below the inflexion point, support for AI adoption should be appropriately increased. This can be achieved by boosting investment in AI infrastructure and providing targeted subsidies for AI applications, thereby driving the uptake of AI technology across the business sector. Conversely, for enterprises above the inflexion point, the investment structure for new technologies should be optimised. This involves reducing redundant investment in AI-related technologies or scaling back the application of AI technologies that are not directly relevant to the enterprise’s core business.
(2) Given the pivotal role of absorption capacity, emphasis should be placed on industry–academia–research collaboration to formulate corresponding strategies aimed at enhancing internal organisational absorption capacity. Firstly, focus should be placed on improving technological awareness within the enterprise; companies can utilise university resources by offering AI-related courses and conducting regular training for management to elevate the organisation’s overall understanding of AI technology; secondly, to strengthen AI transformation capabilities, companies should establish joint laboratories leveraging the advantages of cross-departmental platforms, thereby reducing the trial-and-error costs of their own AI transformation through the integration of cross-departmental AI technical resources; finally, focus should be placed on building the company’s own knowledge system, by establishing an in-house AI think tank, reviewing and organising materials related to AI technology involved in project operations, and gradually forming a proprietary AI knowledge base to reduce subsequent technical reuse costs.
(3) The negative moderating effect of industry concentration indicates that enterprises must overcome constraints imposed by the industry environment. Against the backdrop of widespread AI adoption, enterprises should focus on in-depth R&D of key core technologies, utilising AI to strengthen these technologies and build technical barriers characterised by scarcity and irreplaceability. For highly concentrated leading enterprises, AI can be used to reinforce their technological monopoly advantages, whilst enterprises operating in sectors with lower concentration can adopt a differentiation strategy. On the one hand, they can seek complementary resources through business ecosystems to establish connections; on the other, they can develop core technologies within their specific niche areas, thereby becoming indispensable key nodes within their respective fields. This strategy mitigates, to a certain extent, the dampening effect of industry concentration on AI innovation, whilst also enabling the continuous conversion of AI’s technological dividends into the enterprise’s own competitive advantages.
(4) The application of artificial intelligence in enterprises should adhere to the principles of differentiation and customisation, avoiding the “homogenisation trap”. Enterprises should move away from a “one-size-fits-all” approach and dynamically adjust their AI application strategies in line with their own nature and industry characteristics, focusing investment on customised or proprietary AI models rather than relying on generic off-the-shelf solutions. For state-owned enterprises, the focus should be on promoting the gradual integration of AI with existing traditional business segments, using customised models to address specific industry pain points and enhance the depth of AI integration; for non-state-owned enterprises, they should leverage their flexibility to utilise dedicated funds to focus on the research and development of proprietary models in vertical sectors, thereby achieving breakthroughs in key and challenging technologies. At the sectoral level, enterprises in high-tech industries should prioritise investment in underlying foundational algorithms and proprietary architectures, building unique algorithmic barriers to create technological “moats”; conversely, enterprises in low-tech industries should not blindly pursue algorithmic complexity, but rather focus on the scenario-based application of mature AI technologies, achieving rapid conversion of returns through data fine-tuning. Implementing differentiated adjustments based on the nature of enterprises and industries can largely avoid the resource misallocation and homogenised competition resulting from a “one-size-fits-all” approach and the generalisation of technology, thereby maximising the synergistic effects of AI innovation.
(5) Policymakers should prioritise the promotion of open data and algorithm governance to provide a fair technological environment for enterprise transformation. The government should not merely act as a “regulator” but rather as an “enabler”, focusing on resolving the issues of “data barriers” and “algorithmic bias” in AI applications. Firstly, to establish a high-quality open data system, the government should take the lead in creating industry-level data-sharing platforms. Whilst safeguarding commercial secrets, these platforms should break down data silos to ensure that SMEs can access high-quality training data even when they lack proprietary data, thereby reducing algorithmic prediction bias; secondly, an assessment mechanism for algorithmic fairness and transparency should be established. Enterprises should be encouraged to use highly interpretable models, and regular compliance and bias checks should be conducted on AI applications to prevent innovation from being stifled by data monopolies or model flaws; finally, differentiated support policies should be formulated. Special subsidies should be provided to enterprises that contribute to the development of customised models and the secure sharing of data, whilst actively promoting the circulation of data resources across different industries to reduce innovation risks arising from technological uncertainty at the supply side.

7. Research Limitations and Future Directions

(1) Our sample is restricted to Chinese A-share manufacturing firms (2010–2023), limiting generalizability to non-manufacturing sectors or different institutional contexts such as European economies. Future cross-country replications, particularly using European samples, are needed to validate the external validity of our findings.
(2) Our AI adoption measure relies primarily on annual report text analysis, which may suffer from “AI washing” or under-reporting and fails to capture the type or depth of AI applications. Future research should develop multi-dimensional AI metrics combining text-based indicators with objective measures such as AI patents, capital expenditure, and capability assessments.
(3) The estimated turning point (2.948) is context-dependent and time-sensitive, and despite our use of instrumental variables, potential endogeneity cannot be completely ruled out. Future longitudinal studies and research leveraging exogenous shocks to AI adoption would provide stronger causal evidence and more dynamic benchmarks.


Author Contributions

Conceptualization, X.F. and B.W.; methodology, X.F.; software, X.F.; validation, X.F. and B.W.; formal analysis, X.F.; investigation, X.F.; resources, B.W.; data curation, X.F.; writing—original draft preparation, B.W.; writing—review and editing, B.W.; visualization, X.F.; supervision, B.W.; project administration, B.W.; funding acquisition, B.W. All authors have read and agreed to the published version of the manuscript.

Funding

This study was funded by the National Key Project of the Chinese Academy of Social Sciences: “Research on the Institutional Mechanisms Driving the Development of New-Quality Productive Forces through Cutting-Edge Technological Innovation” (24AKS019).

Data Availability Statement

The data used in this study are sourced from publicly available databases and commercial data providers. Specifically, annual report text data were obtained from Sina Finance (https://finance.sina.com.cn/ accessed on 28 April 2026), corporate financial and governance data were sourced from the CSMAR database and the China Economic and Financial Database (CCER), and patent text data were retrieved from the IRPDB intellectual property database. The authors do not have permission to redistribute these data publicly due to the terms of use of the respective data providers.

Conflicts of Interest

The authors declare no competing interests.

References

  1. Obschonka, M.; Audretsch, D.B. Artificial intelligence and big data in entrepreneurship: A new era has begun. Small Bus. Econ. 2020, 55, 529–539. [Google Scholar] [CrossRef]
  2. Vărzaru, A.A.; Bocean, C.G. Digital transformation and innovation: The influence of digital technologies on turnover from innovation activities and types of innovation. Systems 2024, 12, 359. [Google Scholar] [CrossRef]
  3. Ma, Y.; Zhang, W.; Ma, C.; Ai, Y.; Hu, J. Artificial intelligence, data elements, digital economy, and corporate innovation performance. Int. Rev. Econ. Financ. 2025, 103, 104560. [Google Scholar] [CrossRef]
  4. Bocean, C.G. Unraveling the Connection Between AI Adoption and E-Commerce Performance in the European Union: A Cross-Country Study. Systems 2026, 14, 106. [Google Scholar] [CrossRef]
  5. Baltezarević, B.V.; Battista, D. Artificial Intelligence and Cognitive Boundaries: A Critical Examination of Intelligence, Understanding, and Consciousness. Knowl.-Int. J. 2025, 69, 61–66. [Google Scholar]
  6. Shan, B.; Liu, K.; Lu, X.; Liu, X. Artificial intelligence, knowledge coupling, and dynamic capabilities in China’s GEM listed enterprises: The role of human–AI collaboration. J. Knowl. Manag. 2025; ahead-of-print. [CrossRef]
  7. Salimimoghadam, S.; Ghanbaripour, A.N.; Tumpa, R.J.; Rahimi, A.K.; Golmoradi, M.; Rashidian, S.; Skitmore, M. The rise of artificial intelligence in project management: A systematic literature review of current opportunities, enablers, and barriers. Buildings 2025, 15, 1130. [Google Scholar] [CrossRef]
  8. Murire, O.T. Artificial intelligence and its role in shaping organizational work practices and culture. Adm. Sci. 2024, 14, 316. [Google Scholar] [CrossRef]
  9. Johnson, P.C.; Laurell, C.; Ots, M.; Sandström, C. Digital innovation and the effects of artificial intelligence on firms’ research and development–automation or augmentation, exploration or exploitation? Technol. Forecast. Soc. Change 2022, 179, 121636. [Google Scholar] [CrossRef]
  10. Teece, D.J. Business models and dynamic capabilities. Long Range Plan. 2018, 51, 40–49. [Google Scholar] [CrossRef]
  11. Vial, G. Understanding digital transformation: A review and a research agenda. In Managing Digital Transformation; Routledge: Oxfordshire, UK, 2021; pp. 13–66. [Google Scholar]
  12. Ransbotham, S.; Khodabandeh, S.; Fehling, R.; LaFountain, B.; Kiron, D. Winning with AI; MIT Sloan Management Review: Cambridge, MA, USA, 2019. [Google Scholar]
  13. Shaw, J.; Rudzicz, F.; Jamieson, T.; Goldfarb, A. Artificial intelligence and the implementation challenge. J. Med. Internet Res. 2019, 21, e13659. [Google Scholar] [CrossRef]
  14. Platania, F.; Hernandez, C.T.; El Ouadghiri, I.; Peillex, J. Bridging AI innovation and sustainable Development: The effect of AI technological progress on SDG investment performance. Technovation 2025, 146, 103279. [Google Scholar] [CrossRef]
  15. Lichtenthaler, U. Beyond artificial intelligence: Why companies need to go the extra step. J. Bus. Strategy 2020, 41, 19–26. [Google Scholar] [CrossRef]
  16. Krakowski, S.; Luger, J.; Raisch, S. Artificial intelligence and the changing sources of competitive advantage. Strateg. Manag. J. 2023, 44, 1425–1452. [Google Scholar] [CrossRef]
  17. Duong, C.D. Artificial intelligence innovation, innovation niches and entrepreneurial performance: The curvilinear role of open innovation. Bus. Process Manag. J. 2025, 1–28. [Google Scholar] [CrossRef]
  18. Deng, J.; Dai, J.; Shao, J.; Shangguan, W. Untangling the Non-linear Impact of Digital Innovation on Operational Efficiency. IEEE Trans. Eng. Manag. 2025, 72, 1954–1969. [Google Scholar] [CrossRef]
  19. Szymanska, E.; Berbel-Pineda, J.M. Innovation processes: From linear models to artificial intelligence. Eng. Manag. Prod. Serv. 2024, 16, 15–28. [Google Scholar] [CrossRef]
  20. Orlando, B.; Scuotto, V.; Cillo, V.; Del Giudice, M. University-Business R&D collaborations and innovation in light of Artificial Intelligence: A new AI-based Open Innovation paradigm. J. Technol. Transf. 2026, 51, 452–480. [Google Scholar]
  21. Awa, H.O.; Ojiabo, O.U. A model of adoption determinants of ERP within TOE framework. Inf. Technol. People 2016, 29, 901–930. [Google Scholar] [CrossRef]
  22. Secundo, G.; Spilotro, C.; Gast, J.; Corvello, V. The transformative power of artificial intelligence within innovation ecosystems: A review and a conceptual framework. Rev. Manag. Sci. 2025, 19, 2697–2728. [Google Scholar] [CrossRef]
  23. Li, C.; Xu, Y.; Zheng, H.; Wang, Z.; Han, H.; Zeng, L. Artificial intelligence, resource reallocation, and corporate innovation efficiency: Evidence from China’s listed companies. Resour. Policy 2023, 81, 103324. [Google Scholar] [CrossRef]
  24. Fredriksson, S. Organizational Adaptation Towards Artificial Intelligence: A Case Study at a Public Organization. Master’s Thesis, Karlstad University, Karlstad, Sweden, 2018. [Google Scholar]
  25. Pan, J.; Yu, M.; Liu, J.; Fan, R. Customer concentration and corporate innovation: Evidence from China. N. Am. J. Econ. Financ. 2020, 54, 101284. [Google Scholar] [CrossRef]
  26. Cao, X.; Wang, Z.; Li, G.; Zheng, Y. The impact of chief executive officers’(CEOs’) overseas experience on the corporate innovation performance of enterprises in China. J. Innov. Knowl. 2022, 7, 100268. [Google Scholar] [CrossRef]
  27. Yao, J.Q.; Zhang, K.P.; Guo, L.P.; Feng, X. How Does Artificial Intelligence Improve Firm Productivity? Based on the Perspective of Labor Skill Structure Adjustment. J. Manag. World 2024, 40, 101–116+133+117–122. [Google Scholar]
  28. Li, Y.H.; Lin, Y.X.; Li, D.D. How Does the Application of Al Tedchnologies Affect Firm Innovation. China Ind. Econ. 2024, 155–173. [Google Scholar] [CrossRef]
  29. Jeon, J.; Hong, S.; Ohm, J.; Yang, T. Causal relationships among technology acquisition, absorptive capacity, and innovation performance: Evidence from the pharmaceutical industry. PLoS ONE 2015, 10, e0131642. [Google Scholar] [CrossRef]
  30. Lee, C.C.; Fang, L.; Zhao, J.; Yu, C.H.; Zhang, J. How does FinTech development drive corporate innovation? Fresh evidence from the perspective of financial supply. Technol. Econ. Dev. Econ. 2025, 31, 244–279. [Google Scholar] [CrossRef]
  31. Ma, S.; Appolloni, A. Can financial flexibility enhance corporate green innovation performance? Evidence from an ESG approach in China. J. Environ. Manag. 2025, 387, 125869. [Google Scholar] [CrossRef]
  32. Lin, L.; Zheng, Y.; Tu, Y. The new environmental protection law, ESG investment, and corporate innovation performance. Int. Rev. Econ. Financ. 2025, 98, 103916. [Google Scholar] [CrossRef]
  33. Aasvik, O.; Hagenzieker, M.; Ulleberg, P.; Bjørnskau, T. How testing impacts willingness to use and share autonomous shuttles with strangers: The mediating effects of trust and optimism. Int. J. Hum.-Comput. Interact. 2025, 41, 3783–3798. [Google Scholar] [CrossRef]
  34. Wang, T.; Shi, H.; Liu, W.; Yan, X. A joint FrameNet and element focusing Sentence-BERT method of sentence similarity computation. Expert Syst. Appl. 2022, 200, 117084. [Google Scholar] [CrossRef]
  35. Lin, Y.-K.; Maruping, L.M. Organizing for AI Innovation: Insights From an Empirical Exploration of US Patents. MIS Q. 2025, 49, 1095–1122. [Google Scholar] [CrossRef]
  36. Liu, P.; Zhao, S.; Kang, L.; Yin, Y. CNN Intelligent diagnosis method for bearing incipient faint faults based on adaptive stochastic resonance-wave peak cross correlation sliding sampling. Digit. Signal Process. 2025, 156, 104871. [Google Scholar] [CrossRef]
  37. Ma, Y.Y.; Shao, Z.; Kang, Y.X.; Tang, L.Q.; Wang, T.N. Transformation Extent Study on the Impact of Competitive Experience on Firms Digital. Chin. J. Manag. 2025, 22, 1012–1021. [Google Scholar]
  38. Yang, X.; Li, F.; Liu, Y. Industry and regional peer effects on company innovation. Financ. Res. Lett. 2024, 67, 105719. [Google Scholar] [CrossRef]
  39. Reed, W.R. On the practice of lagging variables to avoid simultaneity. Oxf. Bull. Econ. Stat. 2015, 77, 897–905. [Google Scholar] [CrossRef]
  40. Li, J.; Sasaki, M. The impact of state ownership on corporate social responsibility reporting: A comparison between state-owned and non-state-owned enterprises in China. Manag. Commun. Q. 2024, 38, 504–533. [Google Scholar] [CrossRef]
  41. Dosi, G. Sources, procedures, and microeconomic effects of innovation. J. Econ. Lit. 1988, 26, 1120–1171. [Google Scholar]
Figure 1. Research framework diagram.
Systems 14 00520 g001
Figure 2. Flowchart for AI-based word frequency extraction.
Systems 14 00520 g002
Figure 3. Artificial intelligence and firm innovation performance.
Systems 14 00520 g003
Table 1. Primary variable table.
Primary VariableSourceDescription
patent_application_countCCERNumber of invention patent applications filed by the firm in year *t* (raw count)
annual_report_textSina FinanceFull textual content of the firm’s annual report for year *t*
rd_expenditureCSMARTotal R&D expenditure of the firm in year *t* (in RMB)
rd_personnel_countCSMARNumber of employees engaged in R&D activities in year *t*
total_employeesCSMARTotal number of employees in the firm in year *t*
operating_revenueCSMARTotal operating revenue of the firm in year *t* (in RMB)
total_assetsCSMARTotal assets of the firm at the end of year *t* (in RMB)
total_liabilitiesCSMARTotal liabilities of the firm at the end of year *t* (in RMB)
founding_dateCSMARDate of incorporation of the firm
board_sizeCSMARTotal number of board members in year *t*
top1_shareholding_ratioCSMARPercentage of shares held by the largest shareholder in year *t*
chairman_ceo_dualityCSMARDummy variable: 1 if the chairman and CEO are the same person, else 0
market_valueCSMARYear-end market value of the firm (in RMB)
industry_codeCSMARFour-digit industry classification code (CIC)
Table 2. Constructed Indicator and their definitions.
Constructed IndicatorSymbolConstruction MethodFunctional RoleSource Reference
Innovation performanceInnovaLog(1 + patent_application_count)Dependent variableCao et al., 2022 [26]
AI adoptionWordsSee below for the calculation process ①Key explanatory variableYao et al., 2024 [27]
Absorptive capacityAbsorbSee below for the calculation process ②Mediating variableLi et al., 2024; [28] Jeon et al., 2015 [29]
Industry concentrationHHISee below for the calculation process ③Moderating variableLee et al., 2025 [30]
Firm sizeSizeLog(total_assets)Control variableLi et al., 2024 [28]
Firm ageAgeLog(current year—year of founding_date)Control variableMa et al., 2025 [31]
Board sizeBsiLog(board_size)Control variableLin et al., 2025 [32]
Top-1 ownership concentrationTop1top1_shareholding_ratio (no transformation)Control variableLin et al., 2025 [32]
Dual board structureDualchairman_ceo_duality (0/1)Control variableLi et al., 2024 [28]
Leverage ratioLevertotal_liabilities/total_assetsControl variableMa et al., 2025 [31]
Revenue growth rateGrowth(operating_revenue_t—operating_revenue_{t − 1})/operating_revenue_{t − 1}Control variableMa et al., 2025 [31]
Tobin’s QTobinQmarket_value/total_assetsControl variableLin et al., 2025 [32]
Table 3. Descriptive statistics of variables.
VariableObsMeanSDMinMedMax
Innova25,2042.4211.48902.3029.336
Words25,2040.7441.106006.028
Absorb25,2040.4520.1830.0210.4380.987
HHI25,2040.1640.1320.0370.1641
Size25,2043.1310.0532.8703.1263.354
Age25,2041.8910.95402.0793.466
Dual25,2040.4050.491001
Bsi25,2042.2270.17402.3032.944
Top125,20433.53014.3811.84031.3489.990
Lever25,2040.3900.2420.0070.37713.711
Growth25,2040.56315.547−29.4760.1041294.219
TobinQ25,2042.1302.0230.6581.661122.190
Table 4. Regression results of artificial intelligence and firms’ innovation performance.
VariableInnovaInnova
(1)(2)
Words0.149 ***
(0.037)
0.153 ***
(0.051)
Words2−0.020 *
(0.011)
−0.026 *
(0.015)
Size 11.802 ***
(1.242)
Age −0.129 **
(0.058)
Dual −0.025
(0.056)
Bsi −0.128
(0.176)
Top1 0.004
(0.003)
Lever −0.321 *
(0.180)
Growth −0.019
(0.024)
TobinQ 0.024
(0.017)
Constant1.417 ***
(0.057)
−34.818 ***
(3.797)
Firm FEsYesYes
Year FEsYesYes
R20.1290.148
Note: *, **, *** indicate significance at the 10%, 5% and 1% levels, respectively.
Table 5. U-test results.
CategoryLower LimitUpper Limit
Range of values for the core explanatory variable0.0006.028
Slope0.153−0.160
t-value4.629−1.833
p > |t|0.0000.033
Extremum2.948
Table 6. Text similarity analysis results.
GroupObsMean Cosine SimilarityMedian SimilaritySE95% CI
High-AI firms10,6440.3240.2980.087[0.319, 0.329]
Low-AI firms14,5600.1870.1650.094[0.183, 0.191]
Difference +0.137 ***+0.133 p < 0.001
Note: *** indicate significance at the 1% levels, respectively.
Table 7. Robustness test results.
VariableReplacement of the Key Explanatory VariableTruncation of the Dependent VariableNarrowing the Research Sample WindowAdding Higher-Order Terms of the Explanatory Variables
(1)(2)(3)(4)(5)
Words 0.175 ***
(0.051)
0.163 ***
(0.055)
0.019
(0.110)
Words2 −0.036 **
(0.015)
−0.029 *
(0.016)
0.074
(0.072)
Words3 −0.017
(0.011)
AI-patents 0.422 ***
(0.024)
AI-patents2 −0.023 **
(0.011)
E-Words0.263 **
(0.111)
E-Words2−0.047 **
(0.023)
Constant−39.706 ***
(6.200)
−33.749 ***
(3.781)
−33.176 ***
(4.205)
−34.830 ***
(5.295)
ControlsYesYesYesYesYes
Firm FEsYesYesYesYesYes
Year FEsYesYesYesYesYes
R20.1160.2110.1450.1590.149
Note: *, **, *** indicate significance at the 10%, 5% and 1% levels respectively.
Table 8. Endogeneity test results.
VariablePhase 1Phase 2
WordsWords2Innova
Words 0.340 ***
(0.057)
Words2 −0.031 *
(0.017)
L.Words0.386 ***
(0.016)
−0.079
(0.057)
L.Words2−0.060 ***
(0.006)
0.234 ***
(0.030)
IV−0.727 ***
(0.009)
−1.475 ***
(0.026)
IV20.095 ***
(0.006)
0.902 ***
(0.029)
Constant3.442 ***
(0.427)
7.268 ***
(1.199)
−50.259 ***
(2.019)
ControlsYesYesYes
Firm FEsYesYesYes
Year FEsYesYesYes
R20.9460.9680.250
Robust F162748087.77
Prob > F0.0000.000
Note: *, *** indicate significance at the 10%and 1% levels respectively.
Table 9. Mechanism test: mediating role of absorptive capacity.
VariableAbsorbInnova
(1)(2)
Words0.009 ***
(0.002)
0.148 ***
(0.039)
Words2−0.002 **
(0.001)
−0.025 *
(0.015)
L.Absorb 1.248 ***
(0.421)
Constant0.215 ***
(0.058)
−35.421 ***
(3.801)
ControlsYesYes
Firm FEsYesYes
Year FEsYesYes
R20.1180.151
Note: *, **, *** indicate significance at the 10%, 5% and 1% levels respectively.
Table 10. Boostrap Autonomous Sampling 5000 Test Results.
CategoryEffectS.Ezp > |z|95%
Confidence Interval
Indirect effects0.0110.0033.670.0000.0052–0.0168
direct effects0.0480.0068.000.0000.0365–0.0595
Table 11. Mechanism test: Moderating effect of industry concentration.
VariableInnovaInnova
Words0.151 ***
(0.051)
0.163 ***
(0.052)
Words2−0.025 *
(0.015)
−0.028 *
(0.015)
HHI0.077
(0.252)
0.325
(0.286)
Words × HHI 0.736 **
(0.297)
Words2 × HHI −0.289 **
(0.135)
Constant−34.880 ***
(3.799)
−35.289 ***
(3.800)
ControlsYesYes
Firm FEsYesYes
Year FEsYesYes
R20.1490.150
Note: *, **, *** indicate significance at the 10%, 5% and 1% levels respectively.
Table 12. Heterogeneity analysis: types of enterprises.
VariableSOEN-SOE
Words1.376 ***
(0.265)
0.140 ***
(0.034)
Words2−0.311 ***
(0.096)
−0.024 **
(0.010)
Constant23.673
(14.969)
−36.612 ***
(2.541)
ControlsYesYes
Firm FEsYesYes
Year FEsYesYes
R20.4980.152
Note: **, *** indicate significance at the 5% and 1% levels respectively.
Table 13. Heterogeneity analysis: industry type.
VariableLow-TechHigh-Tech
Words0.199 ***
(0.063)
0.186 ***
(0.041)
Words2−0.088 ***
(0.024)
−0.024 **
(0.011)
Constant−24.341 ***
(3.802)
−40.037 ***
(3.390)
ControlsYesYes
Firm FEsYesYes
Year FEsYesYes
R20.1510.145
Note: **, *** indicate significance at the 5% and 1% levels respectively.
Disclaimer/Publisher’s Note: The statements, opinions and data contained in all publications are solely those of the individual author(s) and contributor(s) and not of MDPI and/or the editor(s). MDPI and/or the editor(s) disclaim responsibility for any injury to people or property resulting from any ideas, methods, instructions or products referred to in the content.