Article

How Do Endogenous Structure and Multidimensional Proximity Shape Urban Network Dynamics? Evidence from the Yellow River Basin Using Firm-Level Big Data and ERGMs

1
Key Research Institute of Yellow River Civilization and Sustainable Development, Henan University, Kaifeng 475001, China
2
School of Software, Henan University, Kaifeng 475004, China
*
Author to whom correspondence should be addressed.
Systems 2026, 14(5), 490; https://doi.org/10.3390/systems14050490
Submission received: 25 March 2026 / Revised: 23 April 2026 / Accepted: 27 April 2026 / Published: 30 April 2026
(This article belongs to the Section Complex Systems and Cybernetics)

Abstract

The shift from the central place paradigm to the network paradigm in regional relation research emphasizes the need to elucidate the factors and mechanisms driving urban network dynamics. Leveraging firm-level big data—including a headquarters–branch relationships database (29,359 headquarters and 114,679 branches) and an investment relationships database (21,843 investing firms and 69,733 recipients)—this study constructs an urban network integrating both vertical and horizontal enterprise connections. Using exponential random graph models (ERGMs), it analyzes the influencing factors and driving mechanisms of urban network dynamics in the Yellow River Basin (YRB). This study found that the urban network in the YRB is characterized by multiple isolated “core–periphery” radial networks. Strong connections are concentrated within each province’s major cities and their immediate surroundings, while horizontal connections across provincial borders are weaker. From 2000 to 2020, the urban network has evolved from isolated “core–periphery” radial networks to corridor networks where some core nodes are interconnected. The urban network dynamics in the YRB result from the combined influences of the preferential attachment mechanism, the network self-organization mechanism, the multi-dimensional proximity mechanisms, and the geographical boundary effect. Enterprises tend to establish branches or investments in cities with spatial proximity and larger economic scales. Reciprocal and transitive structures significantly facilitate urban network formation. Additionally, institutional proximity, geographical proximity, cultural proximity, cognitive proximity, and geomorphological division all exert varying degrees of influence on enterprise connections between cities.

1. Introduction

Since the introduction of Christaller’s and Lösch’s central place theory, the “central place paradigm” has long dominated the study of regional relationships, with an emphasis on hierarchical structures and the rank-size rule [1,2]. However, since the 1990s, the accelerating flows of production factors between cities, together with the emergence of theories such as the “space of flows”, complex network theory, and social network analysis have prompted a shift in regional relationship research from the traditional “central place paradigm” toward the “network paradigm”. In this context, the urban network has emerged as a key research focus within disciplines such as urban geography, regional economics, and economic geography over the past two decades.
Scholars have conducted extensive studies across various scales, including global [3], transnational [4], national [5], urban agglomeration [6], and urban–regional [7]. These studies explore diverse perspectives, including enterprise connections [8], population migration [9], innovation cooperation [10], infrastructure connections [11], information flows [12], and socio-cultural perspectives [13]. Among these various perspectives, examining urban networks through the lens of enterprise connections has attracted considerable attention from scholars [14,15]. Researchers generally posit that the flows of people, goods, and other elements between cities are outcomes and external manifestations of inter-city connections. The relationships between enterprises across cities are considered fundamental to these flows, with enterprise connections viewed as the micro-foundations of the formation and evolution of urban network [16,17].
Currently, criticisms of urban network research from the perspective of enterprise relationships can be summarized in several aspects: First, contemporary urban network studies from the enterprise perspective demonstrate an excessive reliance on the Advanced Producer Services (APSs), with limited integration between the APS perspective and other industrial sectors. Many scholars argue that, in the “post-industrial” era, manufacturing continues to have a significant influence on urban development and the embeddedness of cities within urban network. Consequently, an exclusive focus on APS, while disregarding the urban networks established by manufacturing industries, is a biased approach [18]. Second, existing studies have predominantly relied on the limited inter-firm relationships of high-end enterprises, such as Advanced Producer Services (APSs), Fortune Global 500 companies and Listed Companies, to measure inter-urban network connections [19,20]. However, given that high-end enterprises are typically located in higher-tier cities, this approach is more suitable for assessing urban network connections at the global or transnational scales rather than at smaller spatial scales or in underdeveloped regions. The over-reliance on high-end enterprises to construct urban networks may lead to the neglect of smaller and peripheral cities, thereby producing biased results [21]. Thirdly, the majority of existing studies have employed the headquarters–branch perspective to measure urban network connections. However, this perspective captures the command-and-control relationships between headquarters and their branches within the same enterprise, representing a typical intra-firm vertical network [22]. There is a scarcity of studies that assess inter-city network connections based on horizontal relationships among enterprises, such as investment links or technological collaborations [16,23]. Unlike the vertical relationships within the same industry, which are predominantly between headquarters and branches, investment connections often span across different industries. Some scholars posit that horizontal connections between enterprises are more indicative of the overall pattern of urban connections than vertical ones [14]. However, to date, there has been a marked lack of research that integrates both horizontal and vertical relationships to provide a more complete assessment of urban network connections.
Regarding research content, existing studies have largely focused on visualizing urban network structures, describing the evolution patterns of urban networks, and comparing similarities and differences in urban network structures from various perspectives, the influencing factors and driving mechanisms behind urban network evolution remain key theoretical questions that have yet to be. Existing research has predominantly relied on spatial econometric models or multiple quadratic assignment procedure (MQAP) models to study the influencing factors and driving mechanisms of urban network evolution. However, both spatial econometric models and QAP models can only capture limited aspects of urban network evolution. Recent advancements in complex network statistical modeling techniques, notably exponential random graph models (ERGMs), have introduced new methods for analyzing the factors and driving mechanisms of network evolution. However, current research has primarily focused on trade networks [24], innovation networks [25], and similar areas, with relatively few studies directly addressing urban networks.
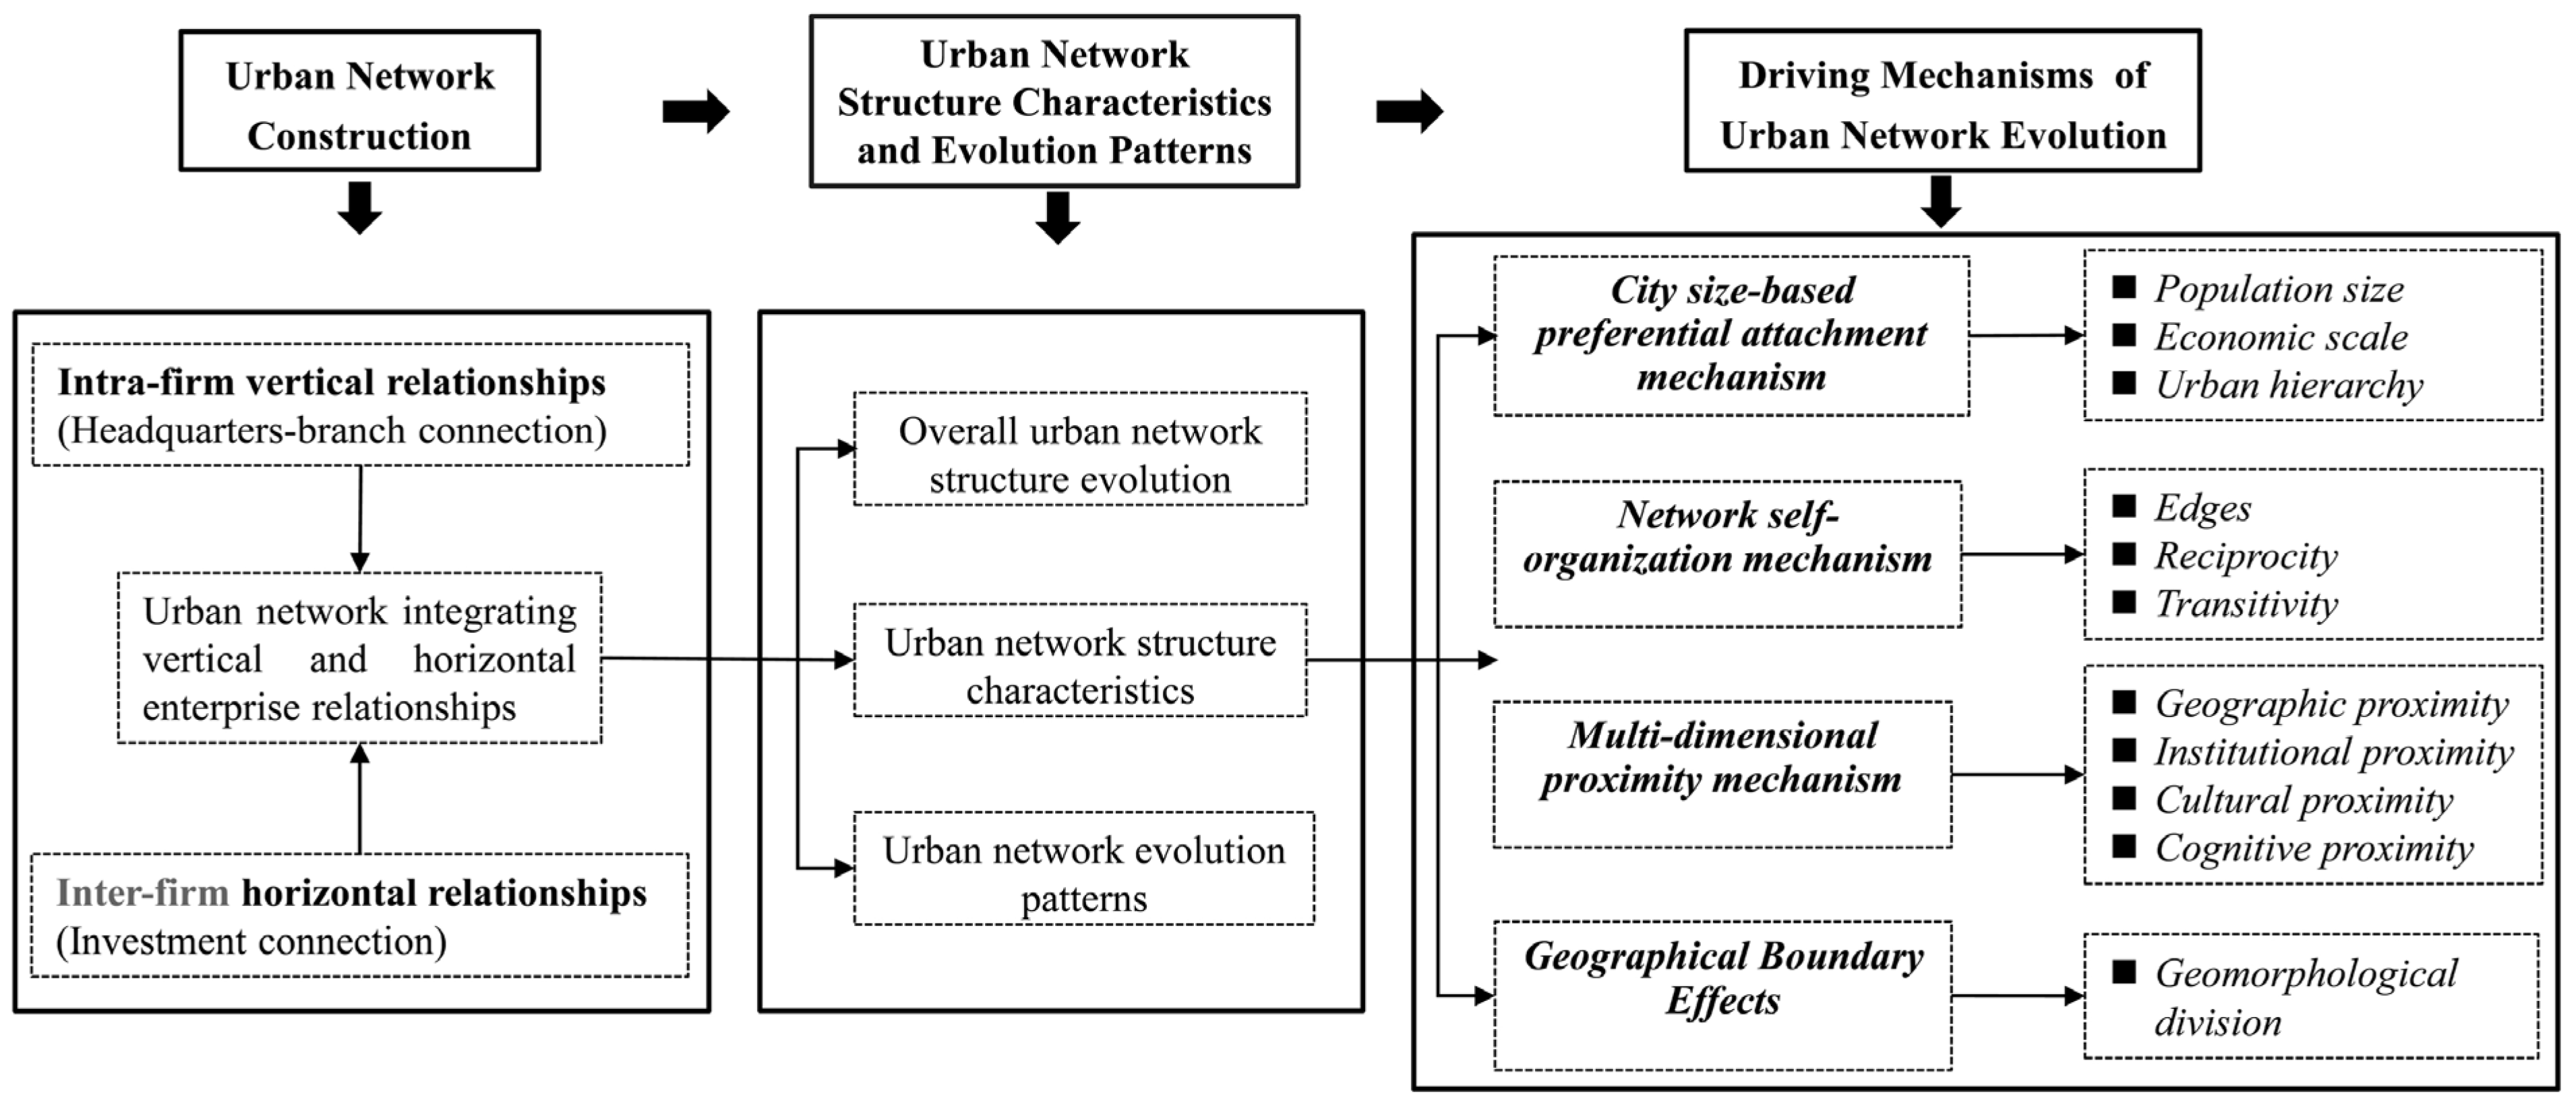
In response to the limitations of existing research, as illustrated in Figure 1, we first construct an urban network that integrates both vertical and horizontal connections by leveraging firm-level big data on intra-firm headquarters–branch relationships and inter-firm investment relationships. Second, we employ social network analysis and GIS visualization to examine the overall structural dynamics of the urban network in the YRB, its structural characteristics, and the patterns of network dynamics. Finally, based on the ERGMs, we analyze the influencing factors and driving mechanisms of urban network dynamics from four aspects: the city size-based preferential attachment mechanism, the network self-organization mechanism, the multidimensional proximity mechanism, and the geographical boundary effects.
This study addresses the following research questions:
1. What structural characteristics and change patterns did the urban network in the YRB exhibit from 2000 to 2020?
2. What factors and mechanisms drive the dynamics of the urban network in the Yellow River Basin? What roles do endogenous structural effects and multidimensional proximity play in this process?

2. Materials and Methods

2.1. Study Area

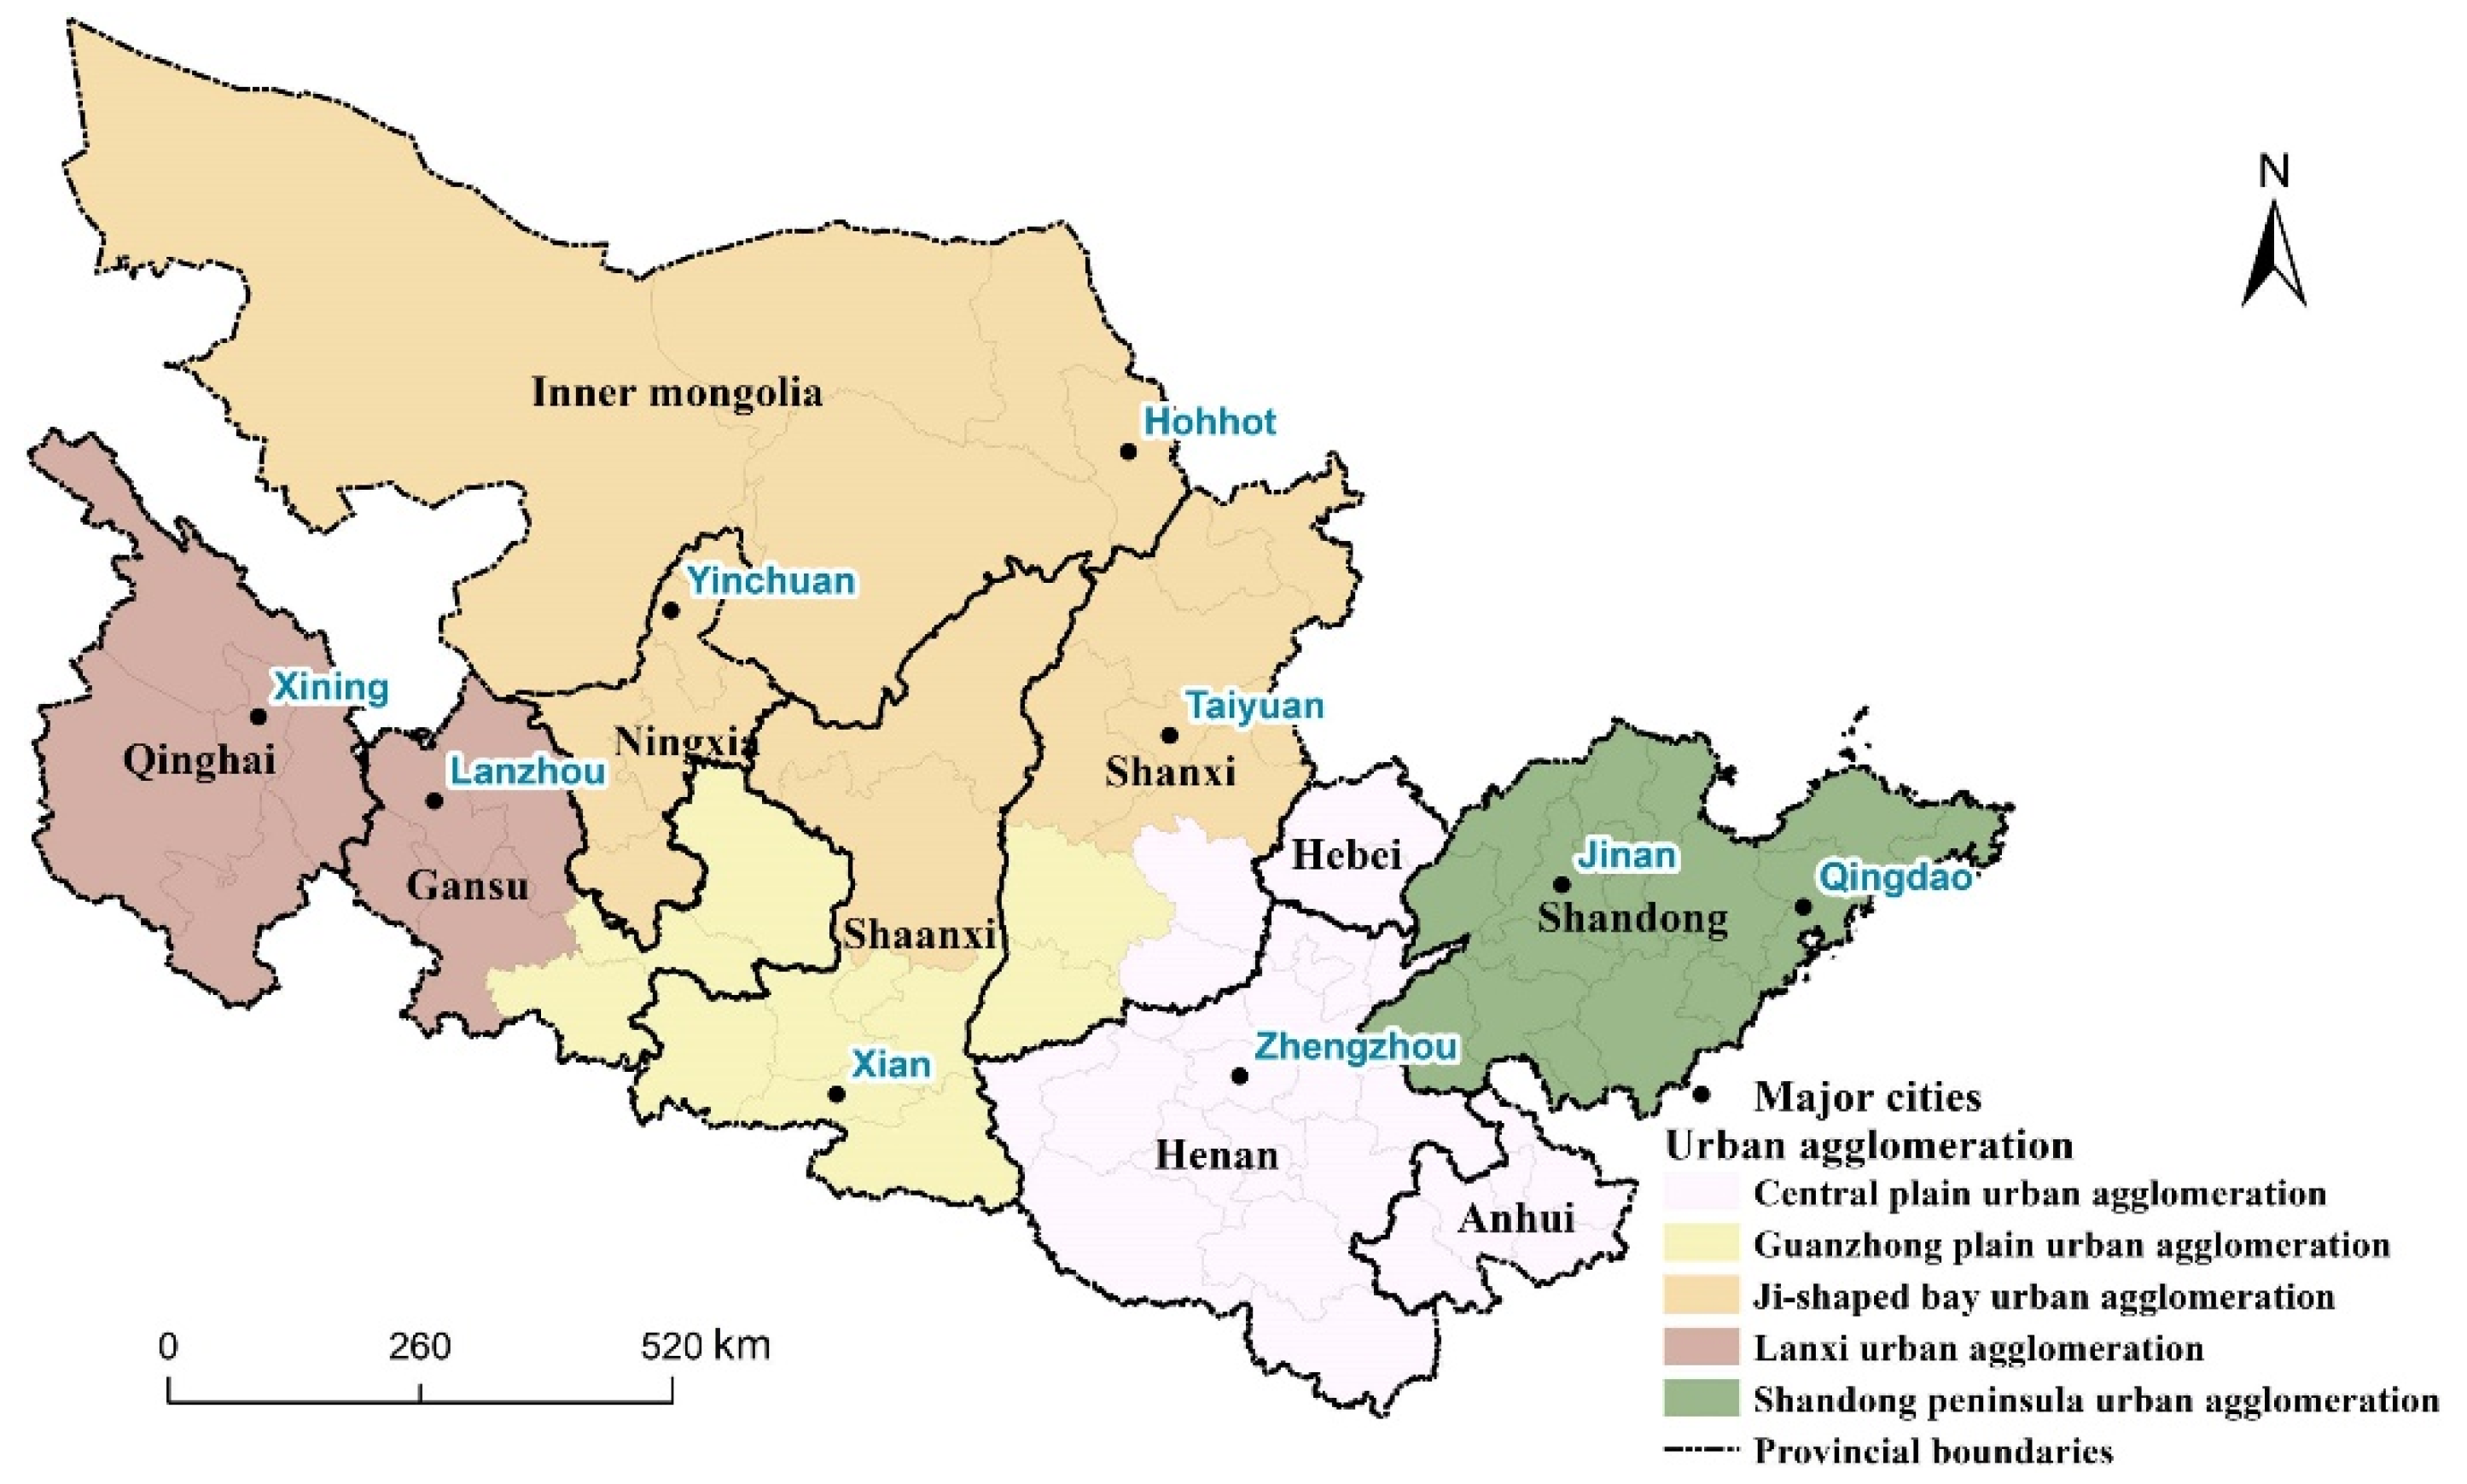
The study area is the Yellow River Basin (YRB), the second largest basin in China after the Yangtze River Economic Belt. As shown in Figure 2, the YRB comprises five regions: the Lan-xi urban agglomeration, the Ji-shaped urban agglomeration, the Guanzhong Plain urban agglomeration, the Central Plains urban agglomeration, and the Shandong Peninsula urban agglomeration. Spanning ten provinces/autonomous regions, including the entire provinces of Shandong, Henan, Shaanxi, Shanxi, and Ningxia, as well as parts of Anhui, Hebei, Inner Mongolia, Gansu, and Qinghai, it encompasses a total of 83 prefecture-level cities or autonomous prefectures. The major cities within the study area include Xi’an, Zhengzhou, Qingdao, Jinan, Taiyuan, Hohhot, Yinchuan, Lanzhou and Xining.
The YRB serves as a representative and distinctive case study area for several reasons. First, it boasts unique natural environmental features, spanning plateaus, mountains, and plains from west to east. These natural features, including terrain, topography, and rivers, significantly influence the urban network dynamics. Second, existing studies typically use dialect regions to measure cultural proximity. However, the cultural regions in the YRB are relatively unique, as they are largely organized along provincial boundaries. From the upper to the lower reaches, these include the Kunlun culture represented by Qinghai Province, the Hehuang culture represented by Gansu Province, the Xixia culture represented by Ningxia Hui Autonomous Region, the grassland culture represented by Inner Mongolia Autonomous Region, the Guanzhong culture represented by Shaanxi Province, the Sanjin culture represented by Shanxi Province, the Central Plains culture represented by Henan Province, and the Qilu culture represented by Shandong Province. These distinct cultural features, together with the basin’s geographical fragmentation, make the YRB an ideal region for studying the impact of geographical isolation and multidimensional proximity on urban network dynamics.

2.2. Data Sources and Processing

The terrain and topography data for the YRB used in this study are derived from China’s 90 m resolution digital elevation model data. Patent cooperation data from 2000 to 2020 were obtained from the China National Intellectual Property Administration (cnipa.gov.cn) and include three categories: invention patents, utility model patents, and design patents. Population and GDP data are sourced from the fifth and seventh national population census and various regional statistical yearbooks.
Enterprise relationship data were sourced from the enterprise big data platform Qichacha (www.qichacha.com). First, enterprises within the study area that have headquarters–branch relationships and investment relationships were selected from the platform. Information such as enterprise names, establishment dates, addresses, operational statuses, investment times, investment amounts was collected for these enterprises. Subsequently, the enterprise addresses were geocoded to obtain their geographical coordinates within the study area. This process enabled the acquisition of location information for enterprises involved in headquarters–branch and investment relationships. In terms of data cleaning, enterprises that were dissolved, revoked, or lacked key information such as registered capital during the study period were first excluded. Second, to exclude the interference of numerous small firms, enterprises with registered capital below 200,000 RMB were removed. Based on the establishment date of each branch and the committed capital contribution date of each investment event, the temporal dynamics of the enterprise headquarters–branch network and the enterprise investment network were determined. The resulting databases include: an enterprise headquarters–branch relationship database composed of 29,359 headquarters and 114,679 branch offices, and an enterprise investment relationship database composed of 21,843 investing enterprises and 69,733 recipient enterprises being invested in. These enterprise-to-enterprise level headquarters–branch relationships data and investment relationships data with location information, were then aggregated to the city level, resulting in two 83 × 83 matrices representing relationships between cities within the study area. In these matrices, inter-city headquarters–branch relationships are represented by weighted branch counts, while the investment relationships are indicated by total investment amounts. Finally, the original relationship matrices from the perspectives of headquarters–branch and investment relationships were standardized using Min–Max normalization, transforming them into [0~1] matrices. These two matrices were then combined to create an integrated enterprise relationship matrix that incorporates both vertical and horizontal enterprise connections. The values in the integrated matrix range from 0 to 2, where higher values indicate stronger enterprise relationships.
The specific calculation steps are as follows:
Step 1: Measuring vertical headquarters–branch connections between cities
(1) Assume that the importance of a branch enterprise is proportional to the size (registered capital) of its headquarters. The weight W of the branch enterprise is determined through Min–Max normalization:
W i j = X i j X i j m i n X i j m a x X i j m i n
Xij is the registered capital of the j enterprise in the i industry.
Xijmax and Xijmin are the maximum and minimum registered capital values of enterprises in the ith industry, respectively.
Wij ranges from 0 to 1, with larger values indicating greater importance of the branch enterprise.
(2) Calculate the weighted directed headquarters–branch connections between cities
V a b = i m j n W i j
where:
  • V a b represents the headquarters–branch connections from city a to city b.
  • i is the industry, j is the j branch enterprise in the i industry.
  • Wij is the weight of the j branch enterprise in the i industry.
Step 2: Measuring horizontal investment connections between cities
The investment connection between cities is represented by the total investment amount. The calculation formula is as follows:
H a b = i m j n I i j
H a b denotes the directed enterprise investment from city a to city b.
i represents the industry type, j denotes the j enterprise invested in within the i industry.
Iij denotes the investment amount for the j enterprise in the i-th industry.
Step 3: Calculation of total enterprise connections between cities
The total enterprise connections between cities are calculated by combining the normalized values of headquarters–branch connections and investment connections. The formula is as follows:
T o t a l a b = N o r m a l i z a t i o n ( V a b ) + N o r m a l i z a t i o n ( H a b )
where:
  • T o t a l a b represents the directed total enterprise connection from city a to city b.
  • N o r m a l i z a t i o n ( V a b ) denotes the normalized vertical headquarters–branch connection from city a to city b.
  • N o r m a l i z a t i o n ( H a b ) denotes the normalized horizontal investment connection from city a to city b.
The value of T o t a l a b ranges from 0 to 2, where a higher value indicates stronger overall enterprise connection between cities.

2.3. Methods

2.3.1. Social Network Analysis

Social network analysis (SNA) is a widely used method for analyzing urban network structures. This study employs the following metrics (Table 1) to analyze the network structure.

2.3.2. Exponential Random Graph Models (ERGMs)

The exponential random graph models (ERGMs) is a statistical modeling method specifically designed for relational data. It effectively reveals the reasons and mechanisms behind network formation [26]. The dependent variable Pθ (Y = y) in the ERGMs represents the probability of observing the actual network y among all possible networks in the set Y. The explanatory variables generally include three types: node attribute variables, endogenous structural variables, and exogenous covariates. The ERGMs is formulated as follows:
P θ Y = y E = e 1 , e 2 ; X = x 1 , x 2 ; C = c 1 , c 2 = 1 k { exp { exp { θ α endogenous   effects e + θ β nodal   effects x + θ γ e x o g e n o u s   effects c } }
where: Y represents the set of all possible network data sets formed randomly with N nodes, while y represents the observed network. k is a normalization constant ensuring that probabilities remain within the range of 0 to 1. Parameters θα, θβ, θγ correspond to their respective statistics. Endogenous effects (e) indicate internal structural variables of the network. Nodal effects (x) represent node attribute variables, and exogenous effects (c) denote external network effects.

3. Results

3.1. Overall Urban Network Structure Dynamics in the YRB

The changes in the urban network structure of the YRB from 2000 to 2020 are summarized in Table 2. Over this period, both the network degree centrality and network density show a significant growth trend, indicating growing enterprise connections between cities. However, these network indicators vary across different perspectives. The average degree centrality of the headquarters–branch network increased from 2.35 to 40.8, while that of the investment network rose from 4.63 to 26.04. The integrated network’s centrality grew from 7.01 to 47.1. The degree centrality and network density of the integrated network are slightly higher than those of the single-perspective subnetworks.
The number of identified communities decreased from 2000 to 2020 across all three perspectives: from 13 to 5 in the headquarters–branch network, from 8 to 6 in the investment network, and from 7 to 6 in the integrated network. These trends indicate a significant enhancement in spatial integration since 2000 within the YRB since 2000, accompanied by increasingly prominent small-group and clustering characteristics in the urban network.

3.2. Urban Network Structure Characteristic and Dynamics Pattern

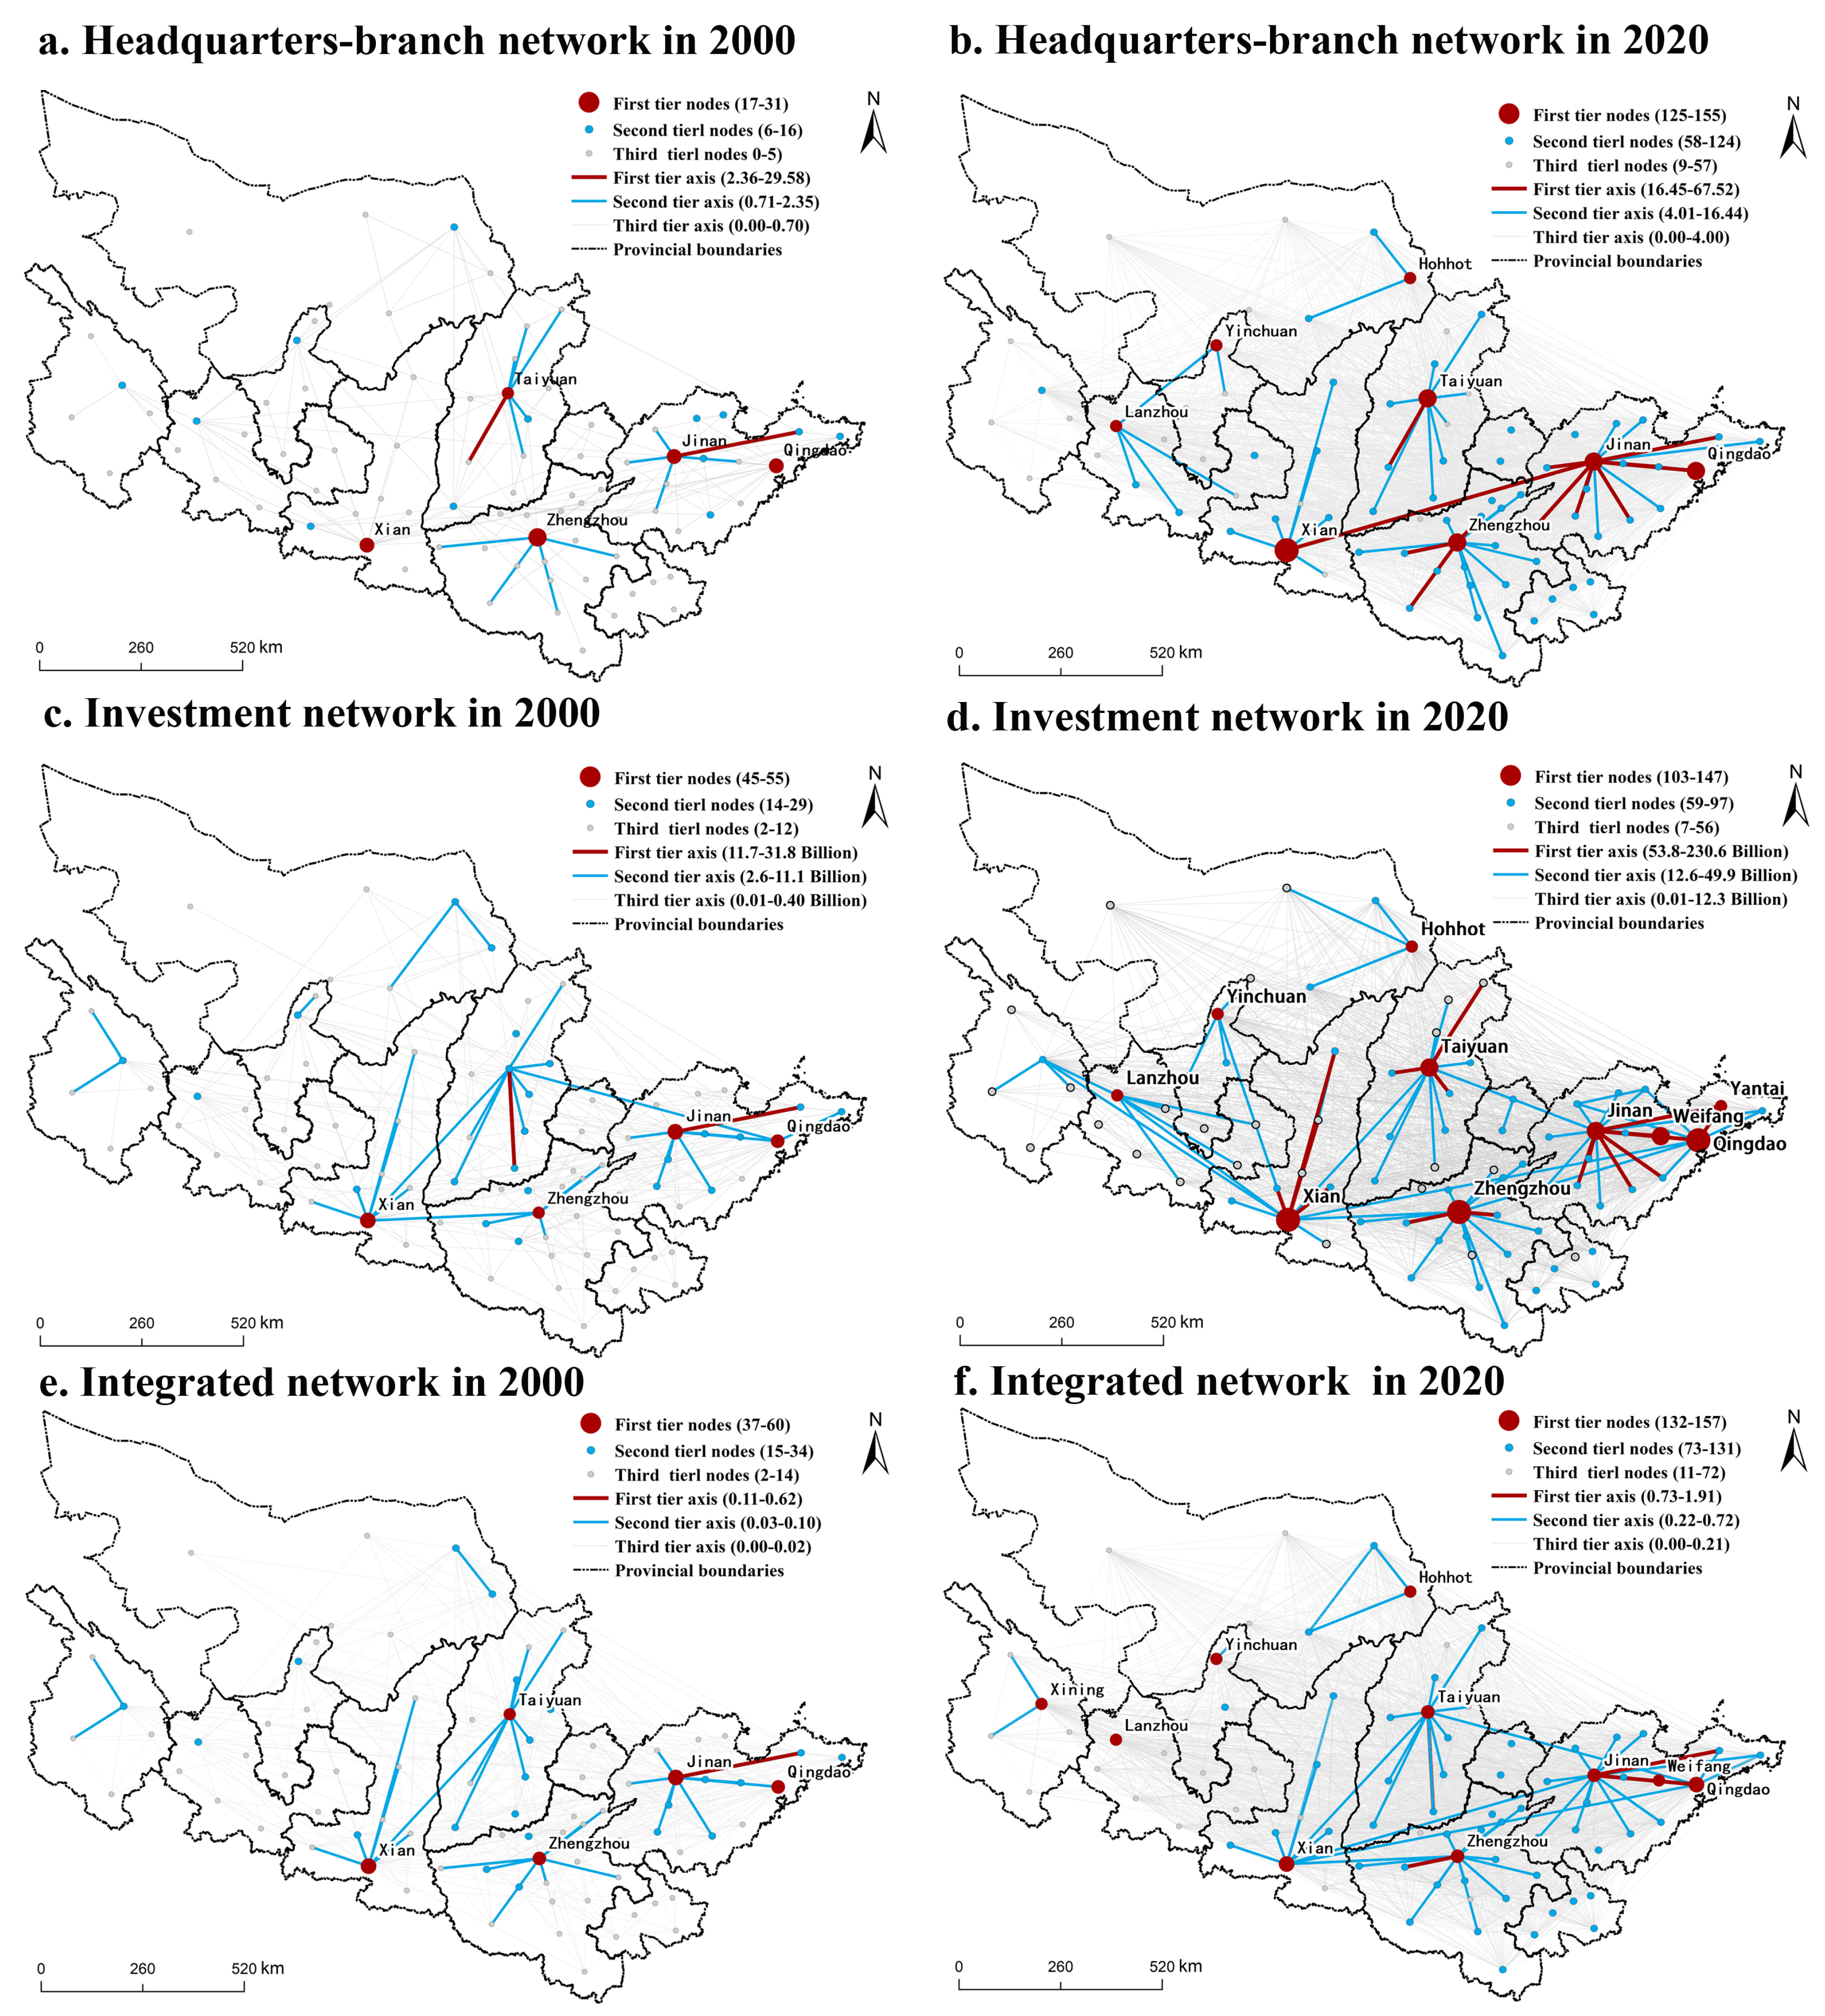
Figure 3 depicts the structural characteristics and dynamic patterns of the urban network in the YRB from 2000 to 2020, analyzed through three dimensions: headquarters–branch network, investment network, and integrated network. The common findings from the three perspectives are as follows:
First, the urban network development shows significant regional differences, generally decreasing from east to west. The eastern Shandong Peninsula urban agglomeration exhibits the highest level of networked development, followed by the Central Plains urban agglomeration and the Guanzhong Plain urban agglomeration. Most nodes in these urban agglomerations are second-tier or higher, and their network connectivity strength also surpasses that of other areas. The Lan-xi urban agglomeration and the Ji-shaped urban agglomeration have the lowest degree of urban network development.
Second, the urban network is primarily organized around a few major cities, forming several “core–periphery” radial structures. The network revolves around five major cities and their surrounding areas, arranged from east to west: Jinan, Qingdao, Zhengzhou, Taiyuan, and Xi’an. For instance, the Shandong Peninsula urban agglomeration forms a radial network centered on Jinan and Qingdao. The Central Plains urban agglomeration forms a radial network centered on Zhengzhou, extending to surrounding cities. The Guanzhong Plain urban agglomeration forms a radial structure centered on Xi’an. High-tier urban network connections (first and second tier axes) are mainly established among major cities within provinces, while cross-provincial horizontal enterprise connections are weak, with strong urban network connections largely confined within provincial boundaries.
Third, from 2000 to 2020, the urban network has transitioned from several isolated core–periphery radial networks to a stage of corridor networks, where major cities are interconnected. In 2000, the urban network formed isolated core–periphery radial networks centered on multiple major cities. As these radial networks expanded, some major cities began to establish strong cross-regional corridor network connections, breaking through provincial boundaries. This led to stronger network connections between previously isolated core–periphery networks, particularly evident among the core cities of Xi’an, Zhengzhou, Jinan, Qingdao, and Taiyuan.

4. Influencing Factors and Driving Mechanisms of Urban Network Dynamics

4.1. The Index System for Urban Network Dynamics in the YRB

The dynamics of urban network results from the combined effects of node attributes, endogenous structural dependencies, and exogenous network covariates. Attribute-based variables show how specific attributes of network actors influence network relationships.
Existing studies use variables such as popularity, activity, sender, and receiver effects to measure preferential attachment or Matthew effects in networks. This paper, however, focuses on how urban scale, indicated by population size, economic scale (GDP), and urban hierarchy, influences urban network formation (see Table 3). It investigates whether larger, richer, and higher-ranked cities are more likely to establish enterprise connections.
Endogenous structural effects refer to how existing configurations or motif structures within a network influence the formation of new relationships. Common structures include network edges, reciprocity, gwdegree, popularity (in-degree effects), Kstar, triangles, simple 2-path, and higher-order structures such as gedsp and gwesp. Based on model convergence, the clear geographical interpretability of these variables for our research question, and common practices in existing studies, this paper selects three structural variables: edges, mutual, and gwesp. Edges form the foundation of network relationships, analogous to the constant term in regression analysis. This variable is included in all models and requires no further justification. Mutual (reciprocity) captures bidirectional enterprise linkages between cities (e.g., cross-investment or reciprocal headquarters–branch relationships), reflecting the balanced and collaborative characteristics of inter-city relations. Gwesp (transitivity) captures triadic closure effects: if city A connects to B, and B connects to C, then A and C are more likely to connect. This reflects the mechanism through which enterprise linkages are transmitted and diffused via intermediate cities.
Exogenous covariate networks refer to relational variables that influence the formation of network relationships beyond endogenous structural effects and individual attribute effects. Drawing on the relevant literature [27,28,29], this study utilizes five variables: geographic proximity, institutional proximity, cultural proximity, cognitive proximity, and geomorphological division. These concepts are defined as follows:
Geographical proximity refers to the degree of closeness between network members in geographic or spatial terms, reflecting the influence of spatial distance on the formation of network relationships. Existing research typically represents geographic proximity using geographic distance or adjacency matrices. Given the extensive east–west span of the YRB, using geographic distance may lead to outliers. Therefore, this study employs a second-order adjacency matrix based on the Queen’s criterion to represent geographic proximity. If cities are spatially adjacent, the relationship matrix assigns a value of 1; otherwise, it is 0.
Institutional proximity refers to the similarity in formal or informal rules, norms, and policies between two actors, capturing how shared habits, regulations, or institutions influence the formation of network relationships. In this paper, institutional proximity is indicated by urban agglomeration boundaries. If two cities fall within the same urban agglomeration boundary, the relationship matrix assigns a value of 1; otherwise, it is 0.
Cultural proximity reflects how shared social and cultural backgrounds, as well as cultural identities, facilitate the formation of urban network connections. In this study is represented by provincial boundaries. If two cities are within the same provincial boundary, the relationship matrix assigns a value of 1; otherwise, it is 0.
Cognitive proximity refers to the degree of similarity in knowledge or technical backgrounds between network members, reflecting the influence of shared knowledge bases on the formation of network relationships. In this paper, cognitive proximity is quantified by the frequency of patent collaborations between cities. A relationship matrix assigns a value of 1 if the number of patent collaborations between cities exceeds the average; otherwise, it is marked as 0.
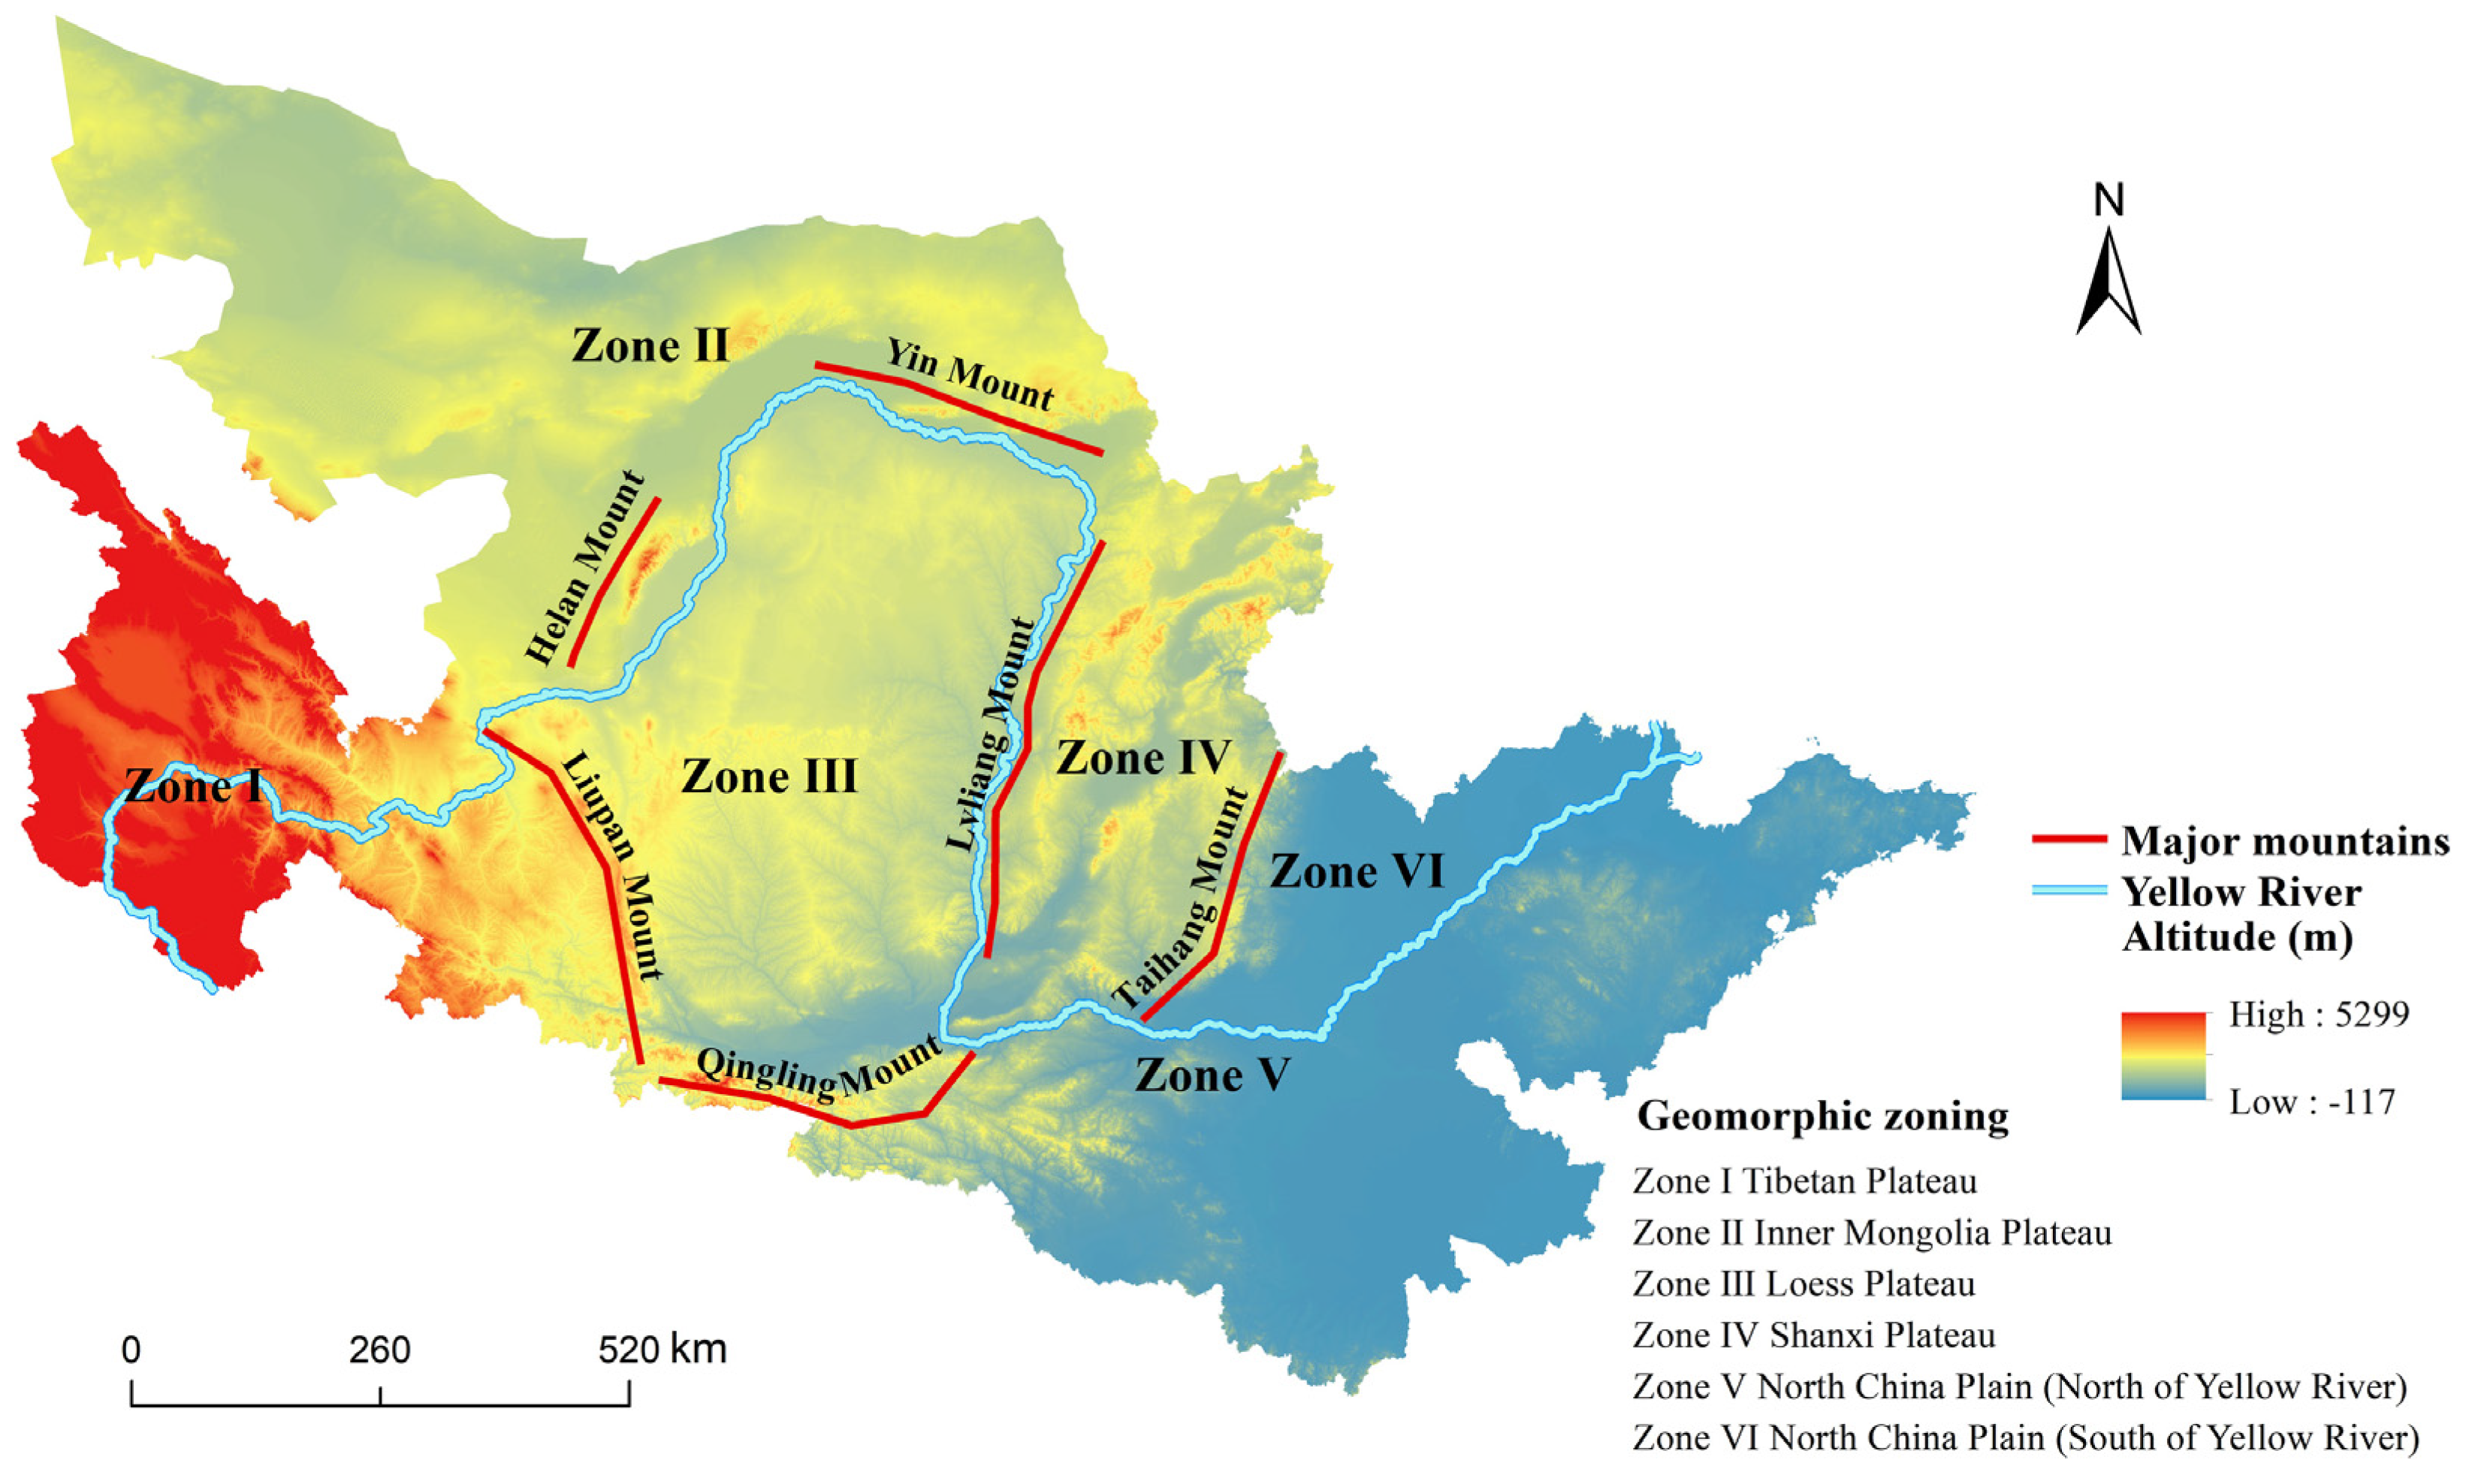
Geomorphological division refers to the spatial fragmentation caused by natural topographic factors such as mountains and rivers, and its influence on the formation of urban network connections. As shown in Figure 4, based on an analysis of the terrain and the division of major geographical features such as mountains and the Yellow River, the study categorizes the region into six zones: 1. Western Loess Plateau and Qinghai–Tibet Plateau include areas west of the Liupan mountains and the Qinghai–Tibet Plateau. 2. Inner Mongolia Plateau covers areas west of the Helan mountains and north of the Yin mountains. 3. Loess Plateau encompasses areas north of the Qinling mountains and south of the J-shaped bend of the Yellow River. 4. Shanxi Plateau includes areas east of the Lvliang mountains and west of the Taihang mountains. 5. North China Plain covers areas east of the Taihang mountains and north of the Yellow River. 6. South North China Plain encompasses areas east of the Qinling mountains and south of the Yellow River.

4.2. The Influencing Factors and Driving Mechanism of Urban Network Evolution

Using ERGMs from the R Statnet package, this study analyzes the factors influencing urban network dynamics in the YRB from 2000 to 2020. To emphasize key network relationships and better detect network structural effects, the integrated enterprise relationship matrices for 2000 and 2020 were binarized using thresholds of 0.0004 and 0.0066, respectively. In 2000, the binarized matrices contained 256 network ties, which increased to 398 network ties by 2020.
As presented in Table 4, the ERGMs analysis comprises four models, each providing fitting results for both 2000 and 2020: Model 1: baseline model considering only edges, with coefficients generally negative, akin to the constant term in regression analysis. Model 2: extends Model 1 by incorporating three attribute variables: population size, economic scale (GDP), and urban hierarchy. Model 3: expands Model 1 to include two endogenous structural variables: reciprocity and transitivity. Model 4: comprehensive Model integrating attribute variables, endogenous structural variables, and five exogenous network covariates.

4.2.1. City Size-Based Preferential Attachment Mechanism

As indicated in Table 4, GDP shows a consistently significant positive coefficient in both Model 2 and Model 4. This underscores that the economic scale of a city notably influences the formation of enterprise relationships. Enterprises tend to invest in or establish branches in cities with larger economic scales to maximize investment returns or expand market scope, highlighting a preference for linkages based on economic aggregation. Conversely, city population size exhibits consistently significant negative coefficients across Model 2 and Model 4. For urban hierarchy, the coefficient is negative and significant in 2000 but becomes negative and non-significant in 2020 (Model 2). This suggests that larger population size is not associated with a higher probability of forming enterprise ties, and that the negative effect of urban hierarchy, while present in 2000, weakens by 2020. Consistent with these findings, the structural analysis of the urban network in the YRB (Figure 3) reveals that the most robust urban network linkages are primarily confined to interactions between provincial core cities and their immediate smaller neighbors, rather than between cities of similar size or hierarchical status.

4.2.2. Network Self-Organization Mechanism

Regarding structural variables, reciprocity and transitivity demonstrate significant positive coefficients in Model 3 and Model 4, indicating that pre-existing reciprocal and triangle-based transitive play a substantial role in shaping urban network relationships. In Model 3, which solely incorporates structural variables, the coefficients for reciprocity in 2000 and 2020 are 2.66 and 2.77 respectively, while those for transitivity are 1.33 and 1.64. This suggests that reciprocity has a stronger impact compared to transitivity over this period. Moving to Model 4, encompassing both structural and exogenous network covariates, while the coefficients for both structural effects decline from 2000 to 2020, reciprocity maintains a stronger influence than transitivity.

4.2.3. Multi-Dimensional Proximity Mechanisms

Within the multi-dimensional proximity mechanisms, while institutional proximity based on urban agglomeration boundaries showed no significant effect on the dynamics of the urban network in the YRB, other variables contributed to varying extents. Cultural proximity, based on provincial boundaries, had the most significant influence on the urban network dynamics in the YRB, and this influence strengthened from 2000 to 2020. This suggests that enterprises prefer to establish branches or conduct investment activities within their own province.
Geographic proximity, based on spatial adjacency, also significantly influences the formation of urban networks. From 2000 to 2020, the coefficient for geographic proximity increased from 0.89 to 1.23. This indicates that geographical distance has a substantial impact on the establishment of network connections between cities, making enterprise relationships more likely to occur between geographically adjacent cities.
In 2000, cognitive proximity had a substantial impact coefficient on inter-city network connections in the YRB, although it was not statistically significant. This was primarily due to the region’s low density of innovation networks at that time, with relatively few cities having established close patent cooperation relationships. In 2020, cognitive proximity based on patent cooperation began to significantly influence inter-city enterprise and investment connections, indicating that knowledge and technological spillovers between cities were increasingly shaping the establishment of enterprise relationships.
In Model 3 and Model 4 for the years 2000 and 2020, institutional proximity did not exhibit statistical significance. This suggests that cities within the same urban agglomeration did not show a stronger tendency toward establishing enterprise connections, implying that the boundaries and policies of urban agglomerations did not significantly influence the formation of enterprise relationships among cities within the region.

4.2.4. Geographical Boundary Effects

In 2000, the geomorphological division caused by geographical barriers such as rivers and mountains had a significant positive impact on corporate connections between cities, with a coefficient of 0.44 ***. This indicated that cities within the same topography and landform regions had lower costs in terms of enterprise connections and exchanges, making it easier to establish close ties. However, by 2020, the coefficient for geomorphological division decreased from 0.44 *** to 0.27, suggesting that the influence of geographical isolation on enterprise connections has been diminishing over this period.

4.3. Model Convergence Diagnostics

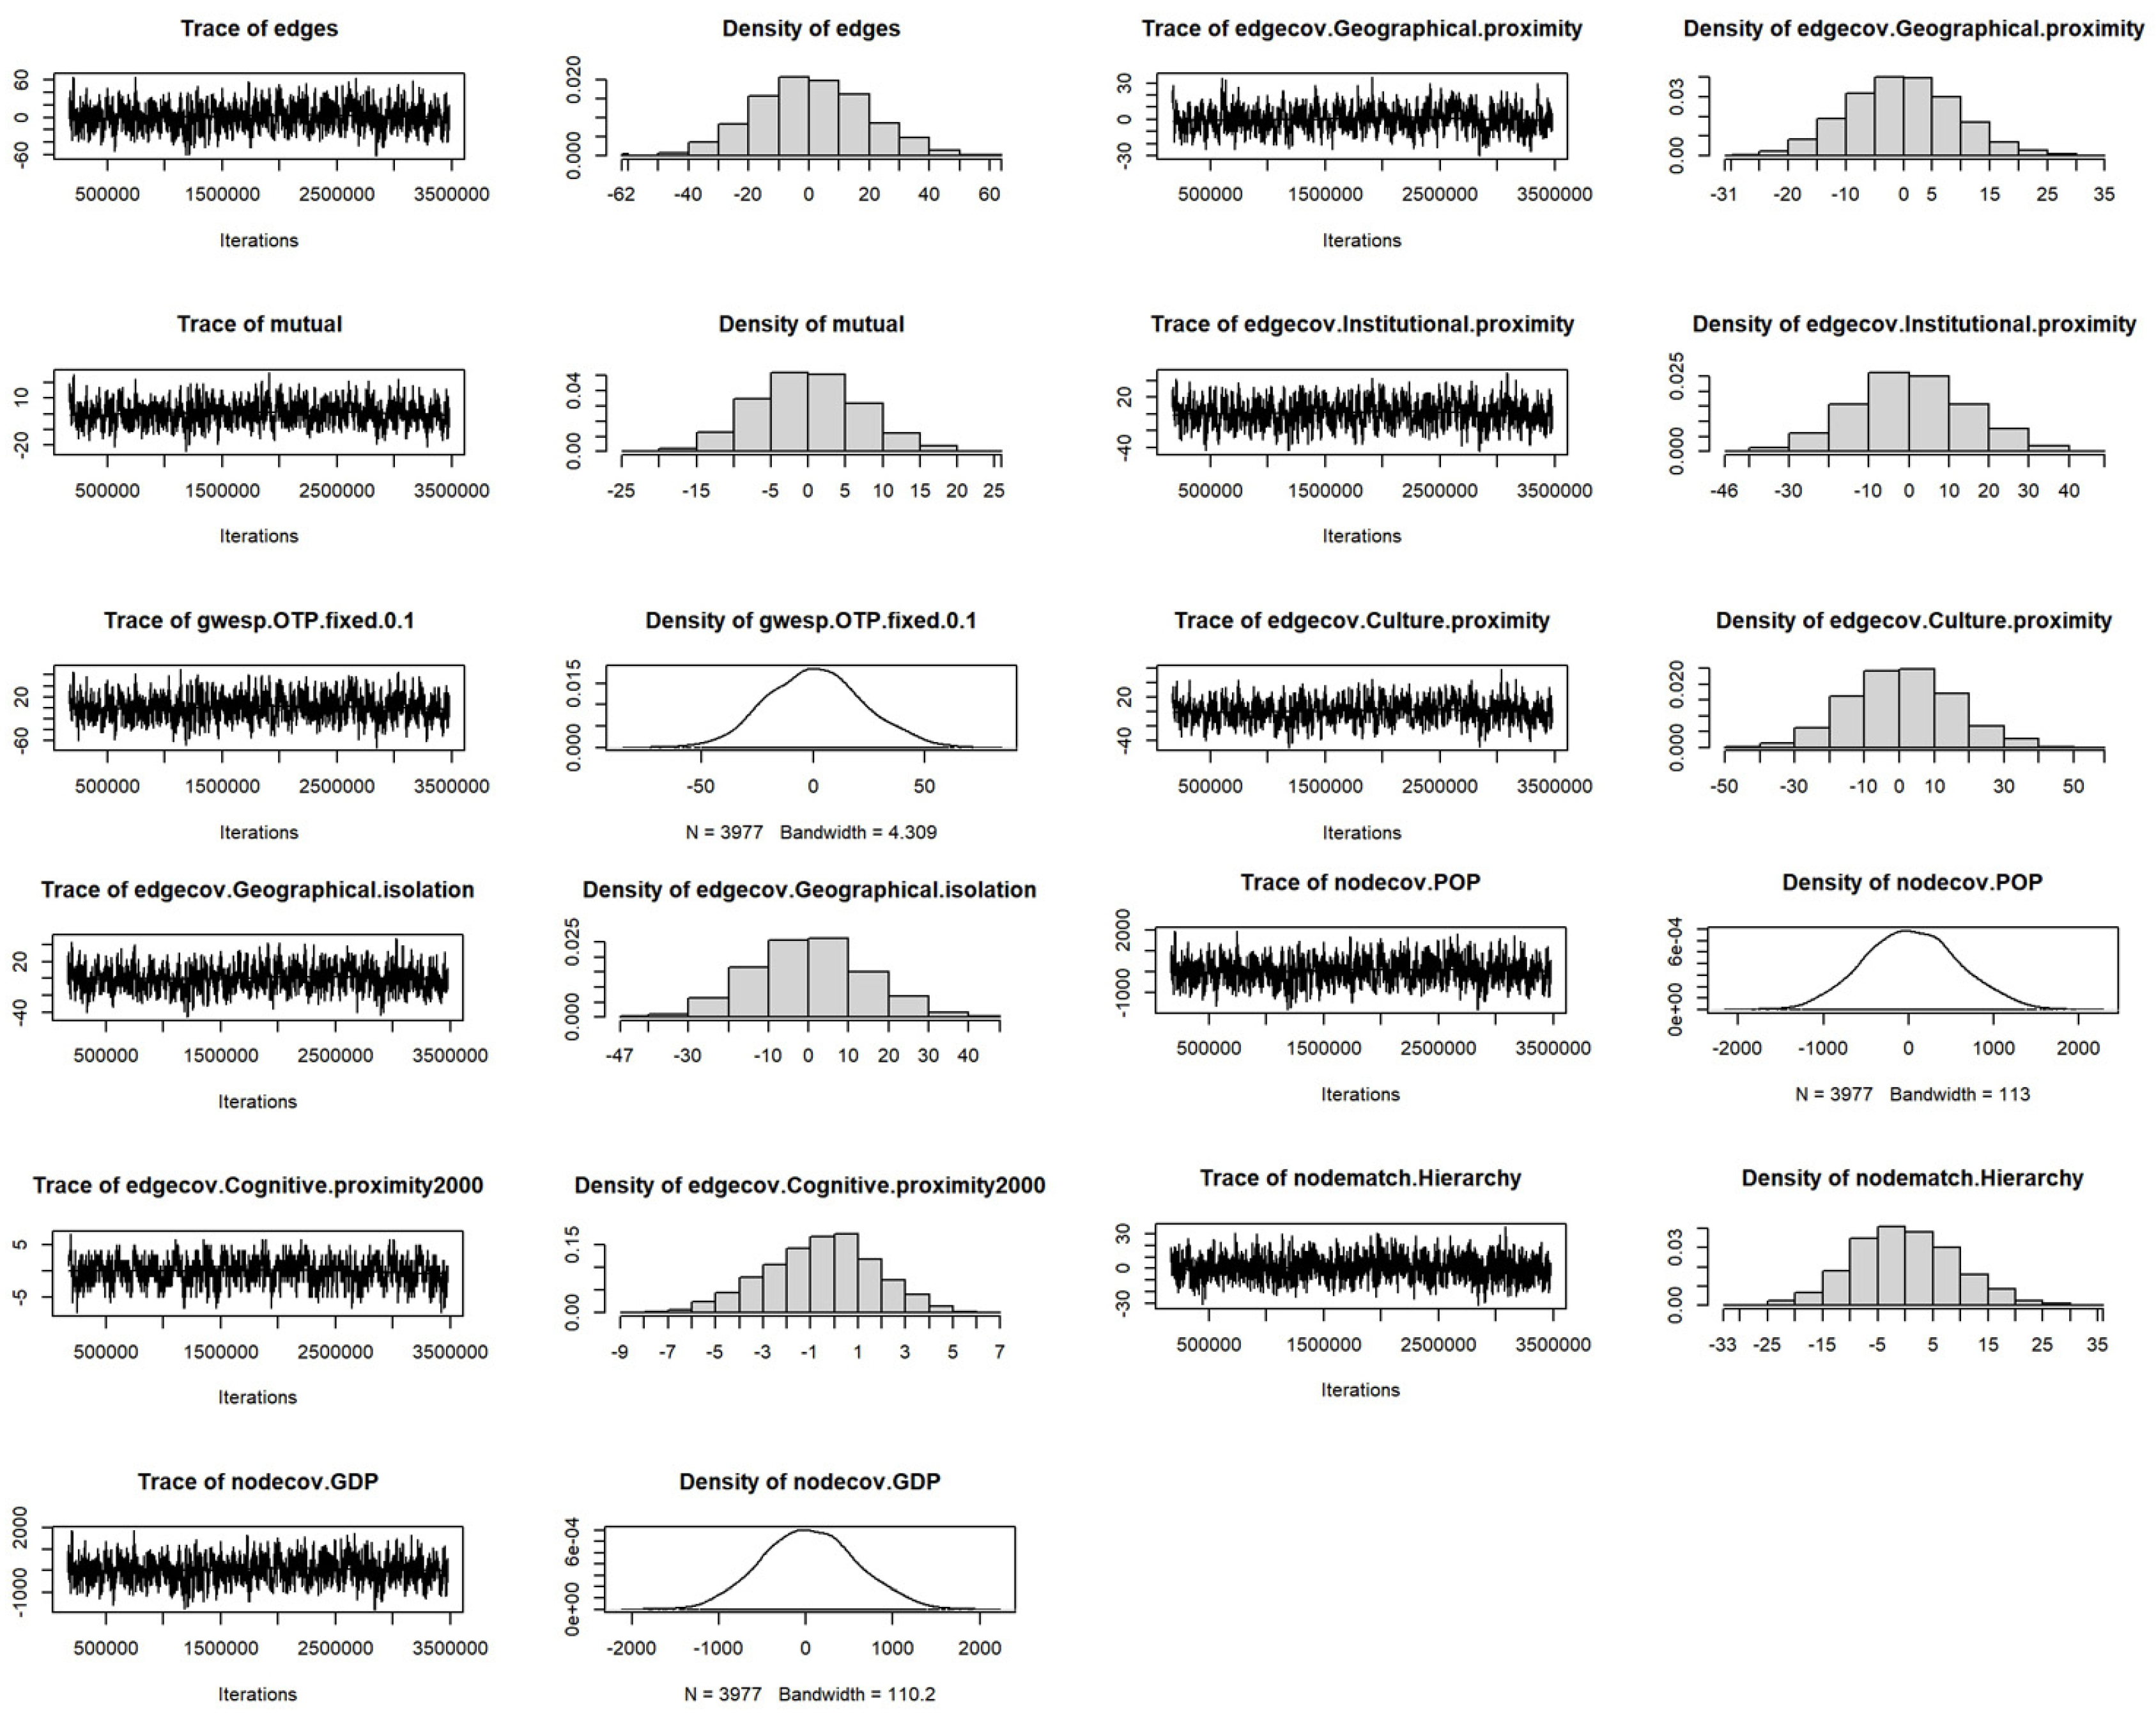
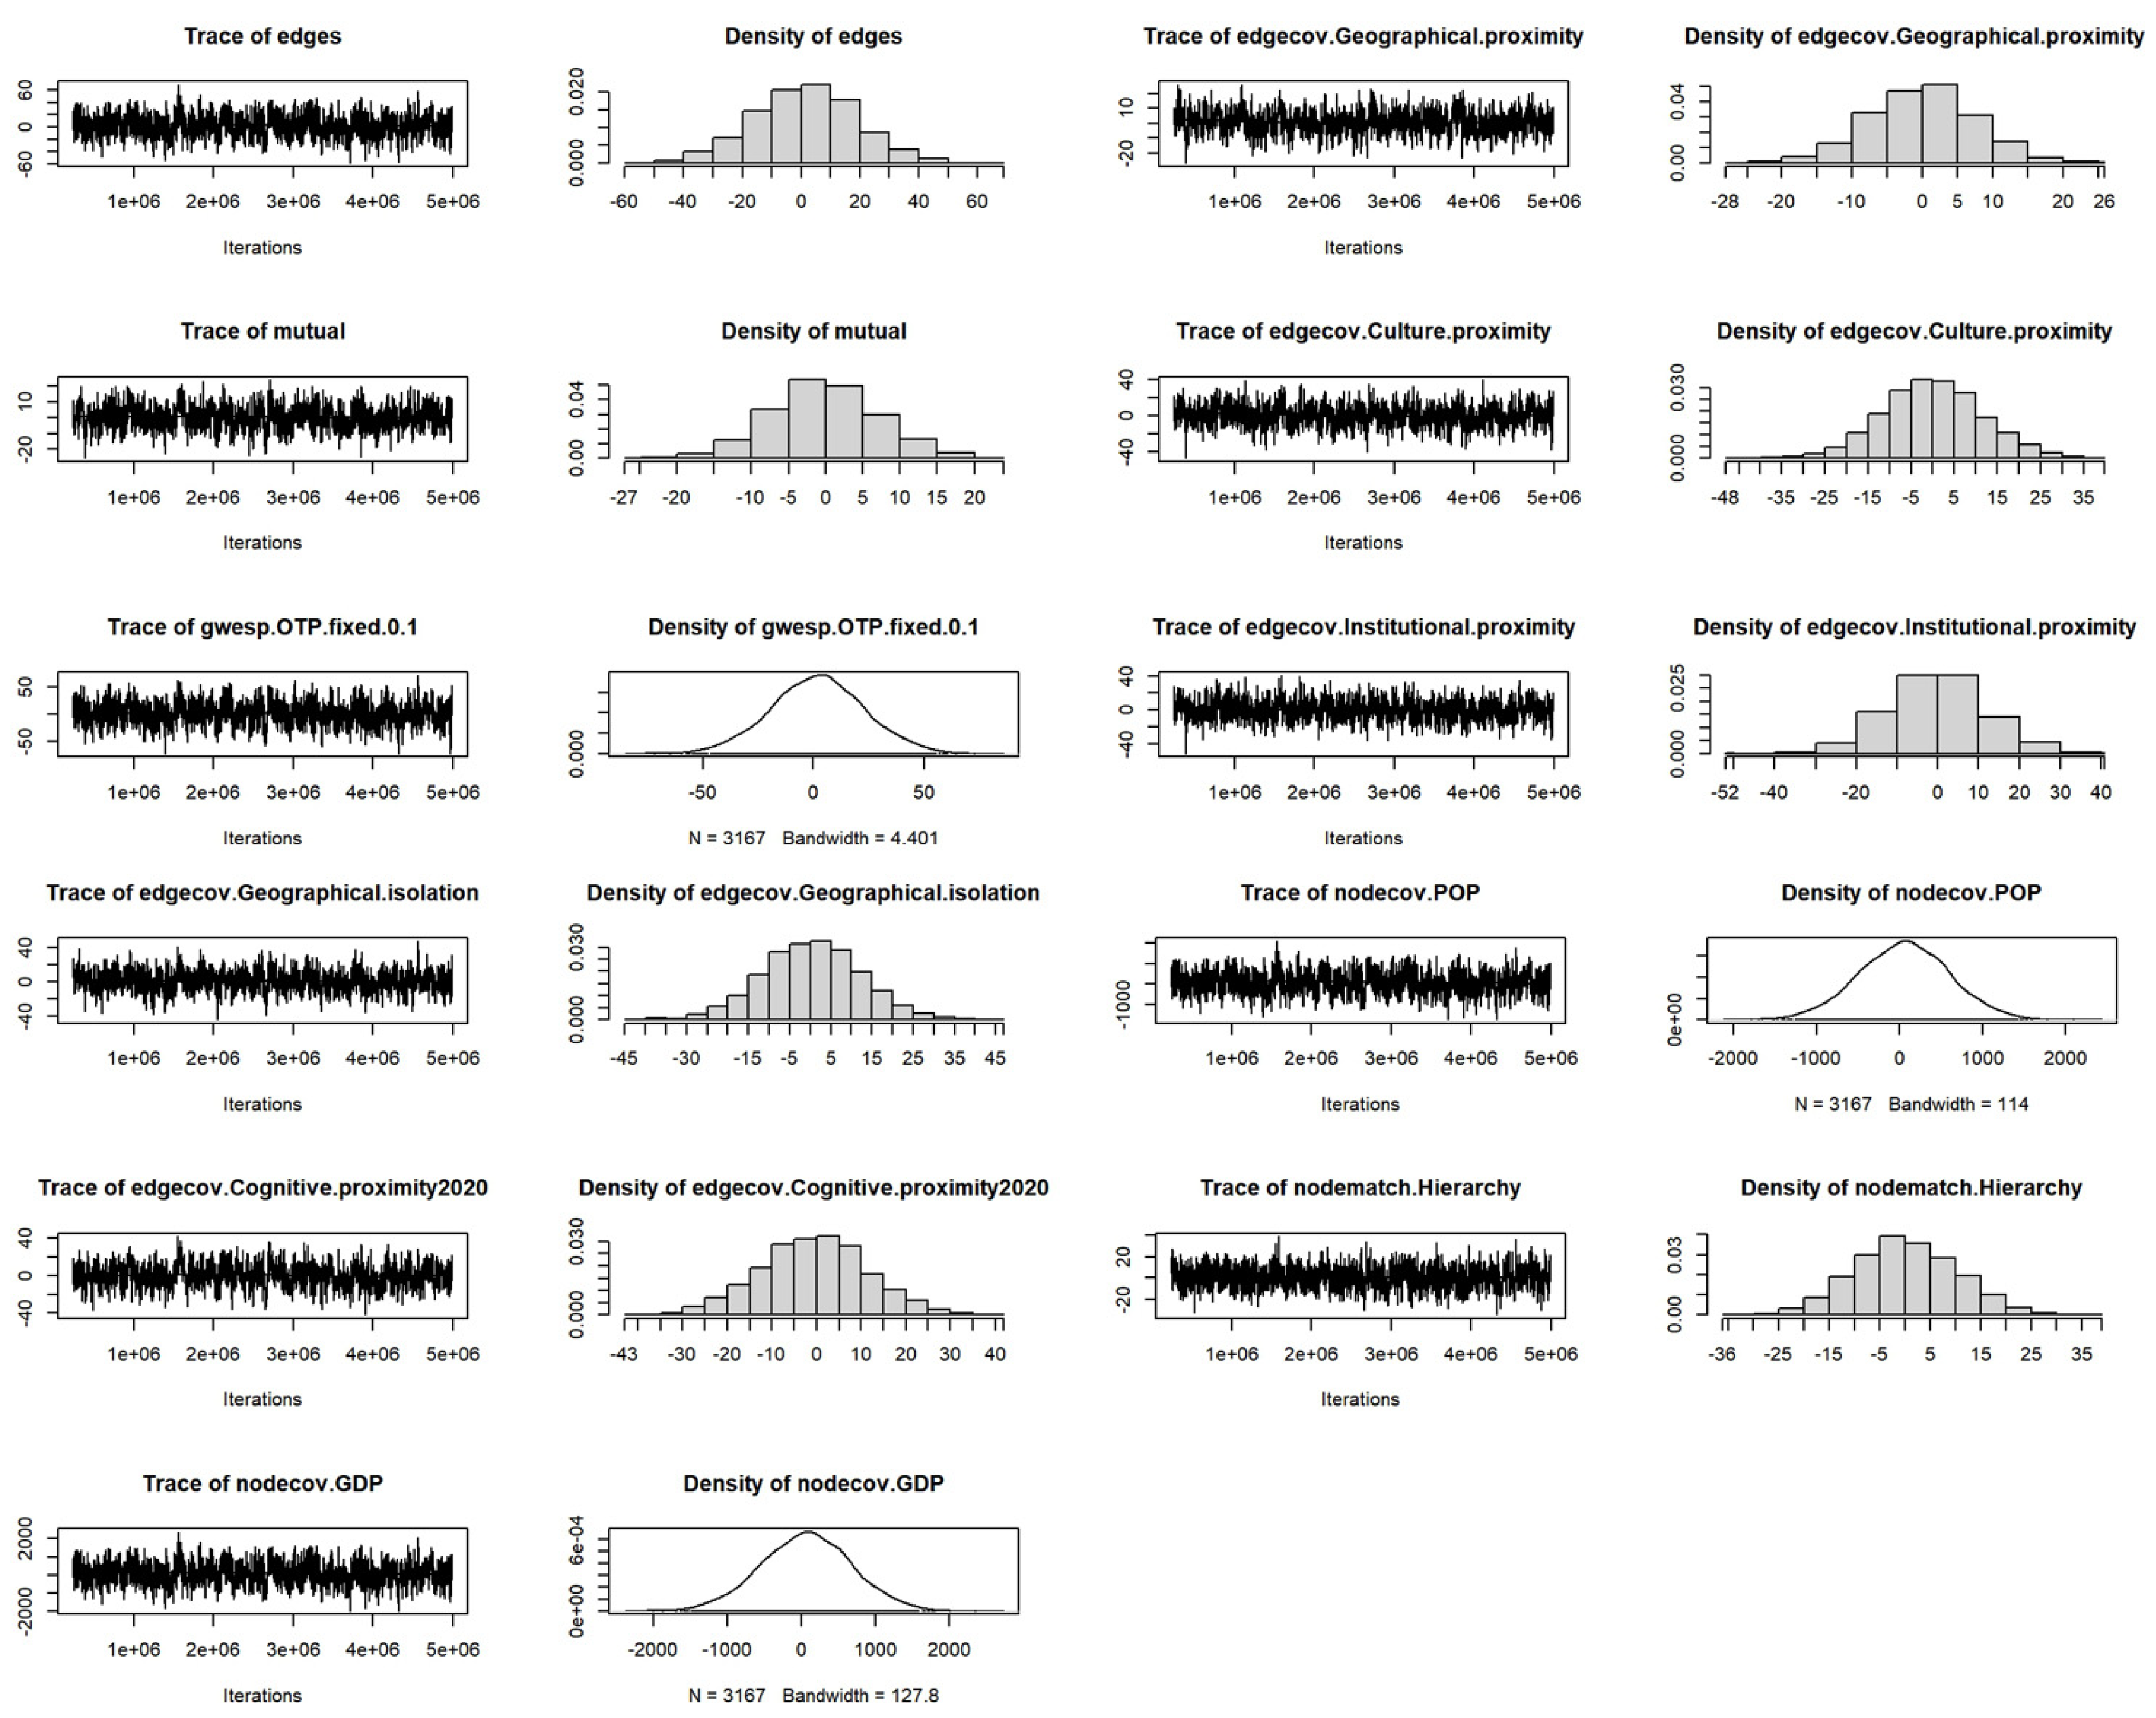
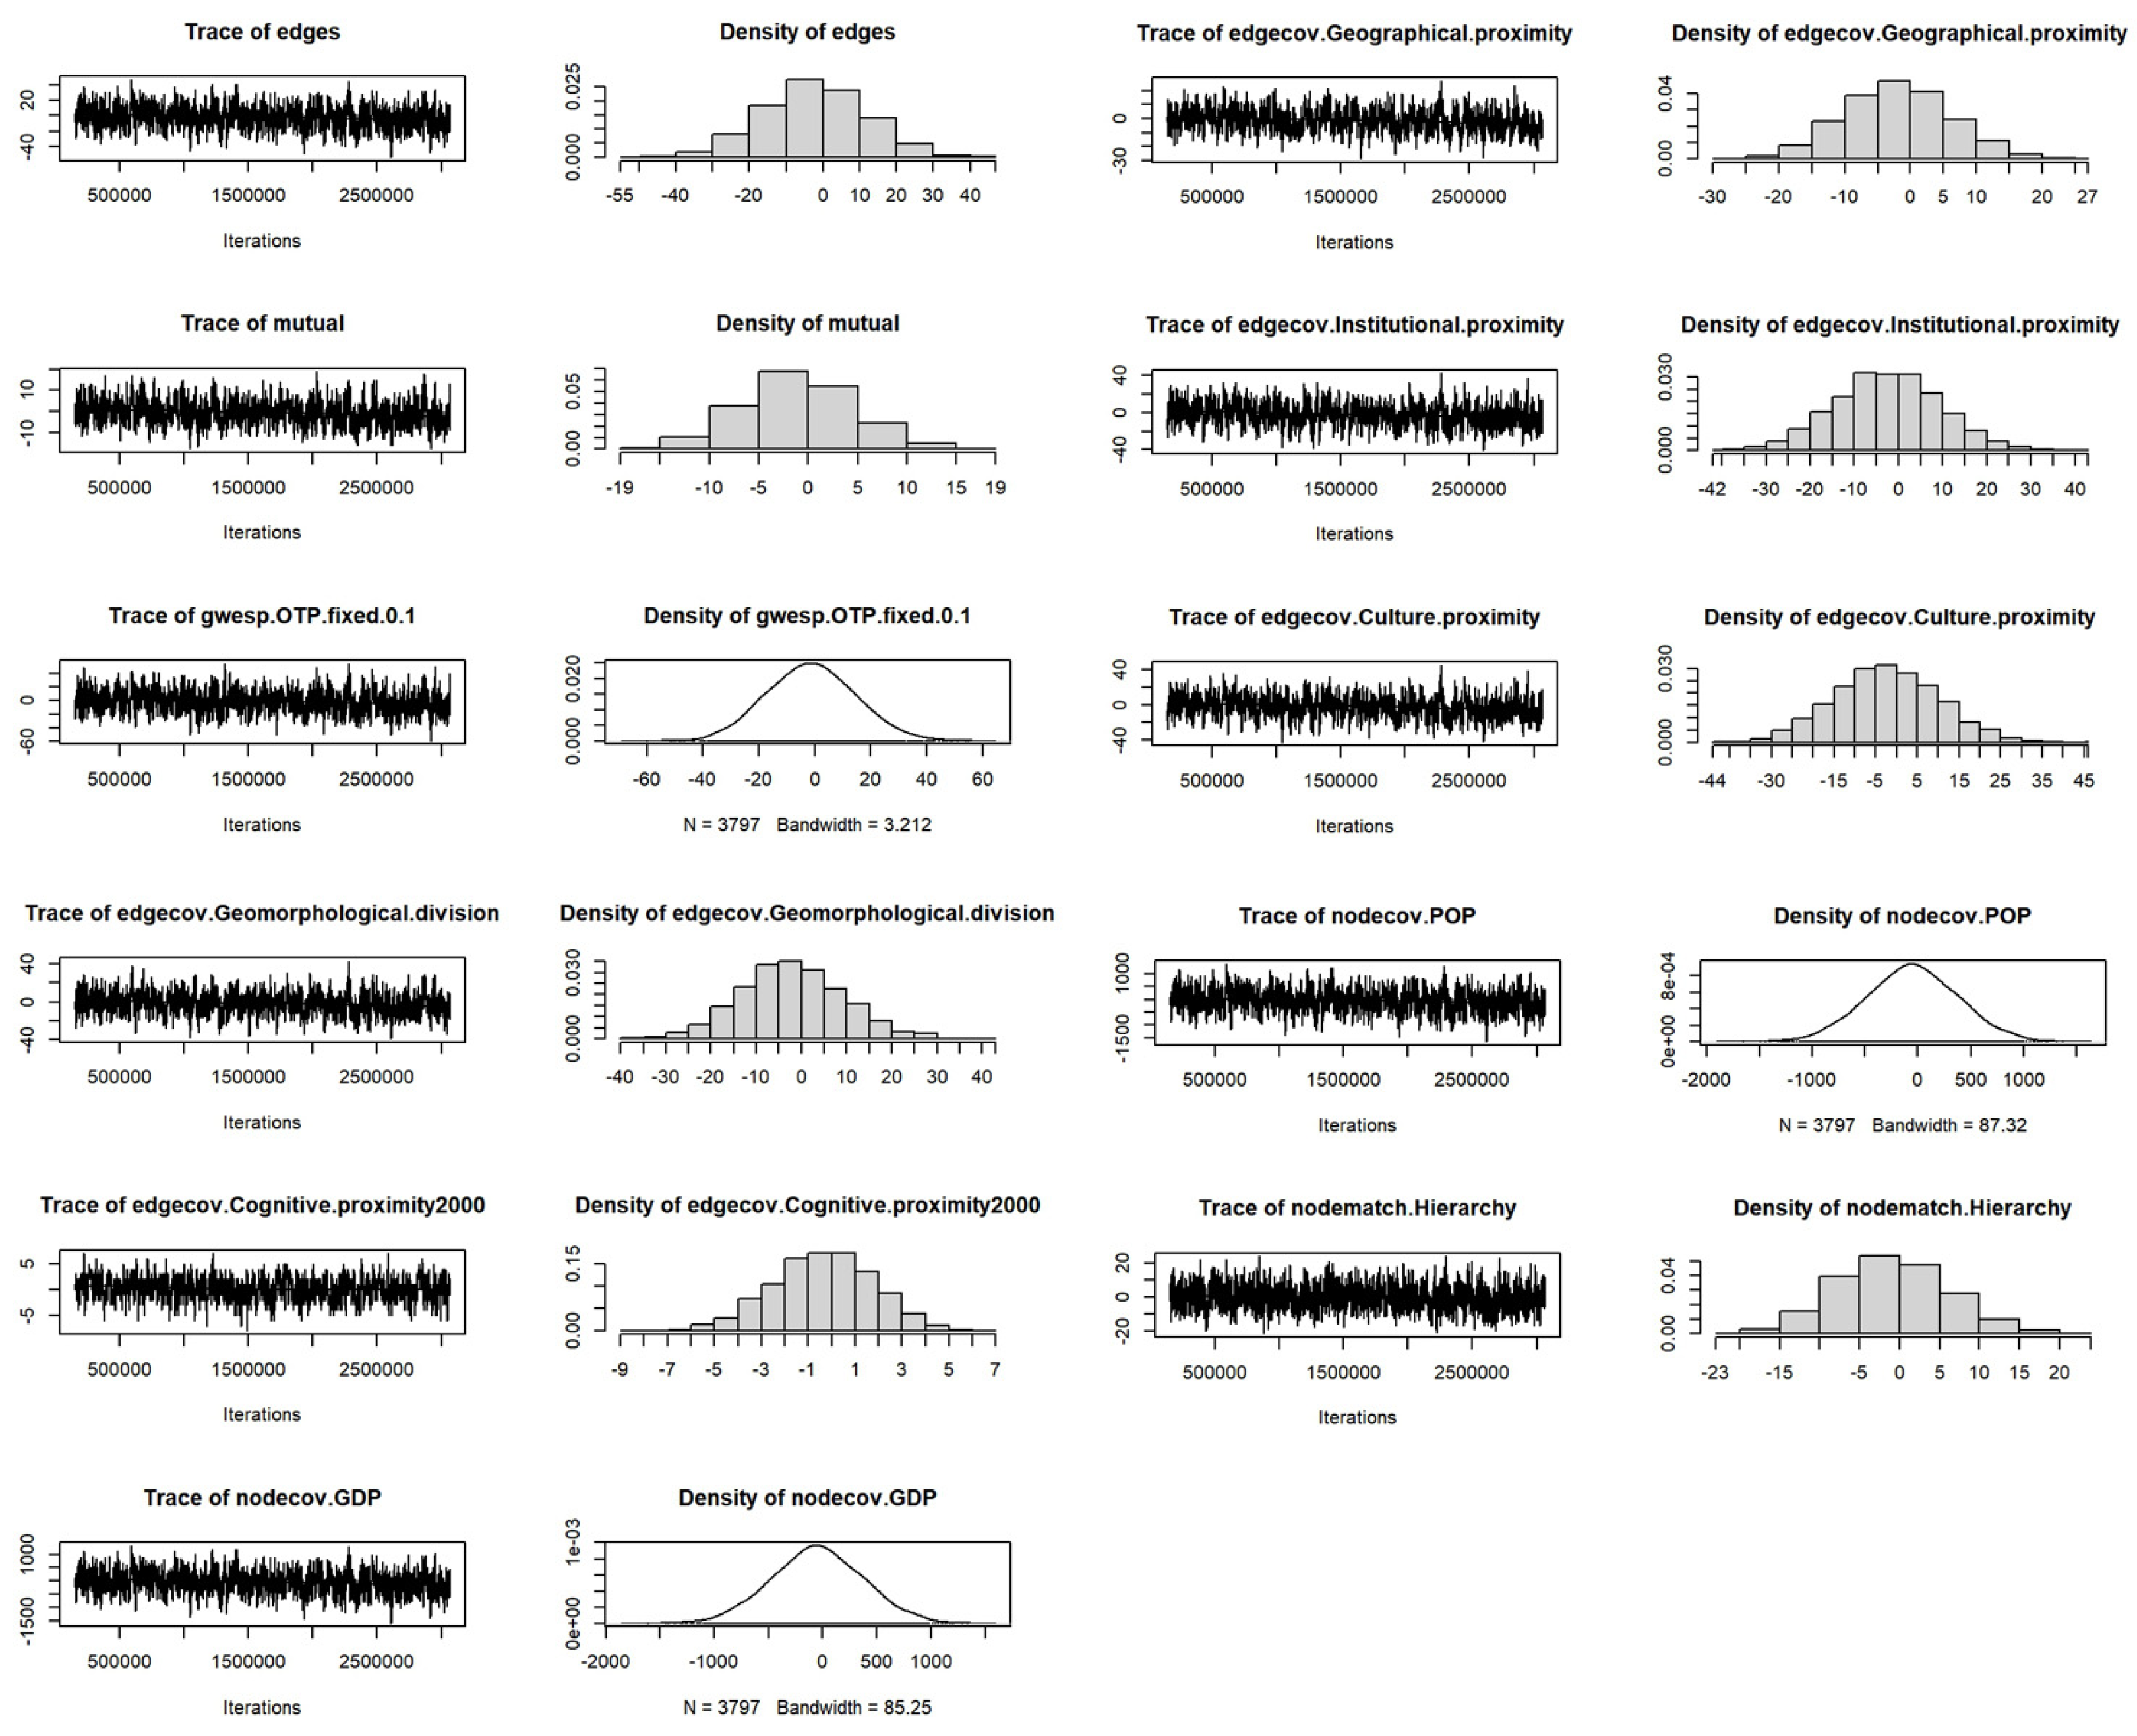
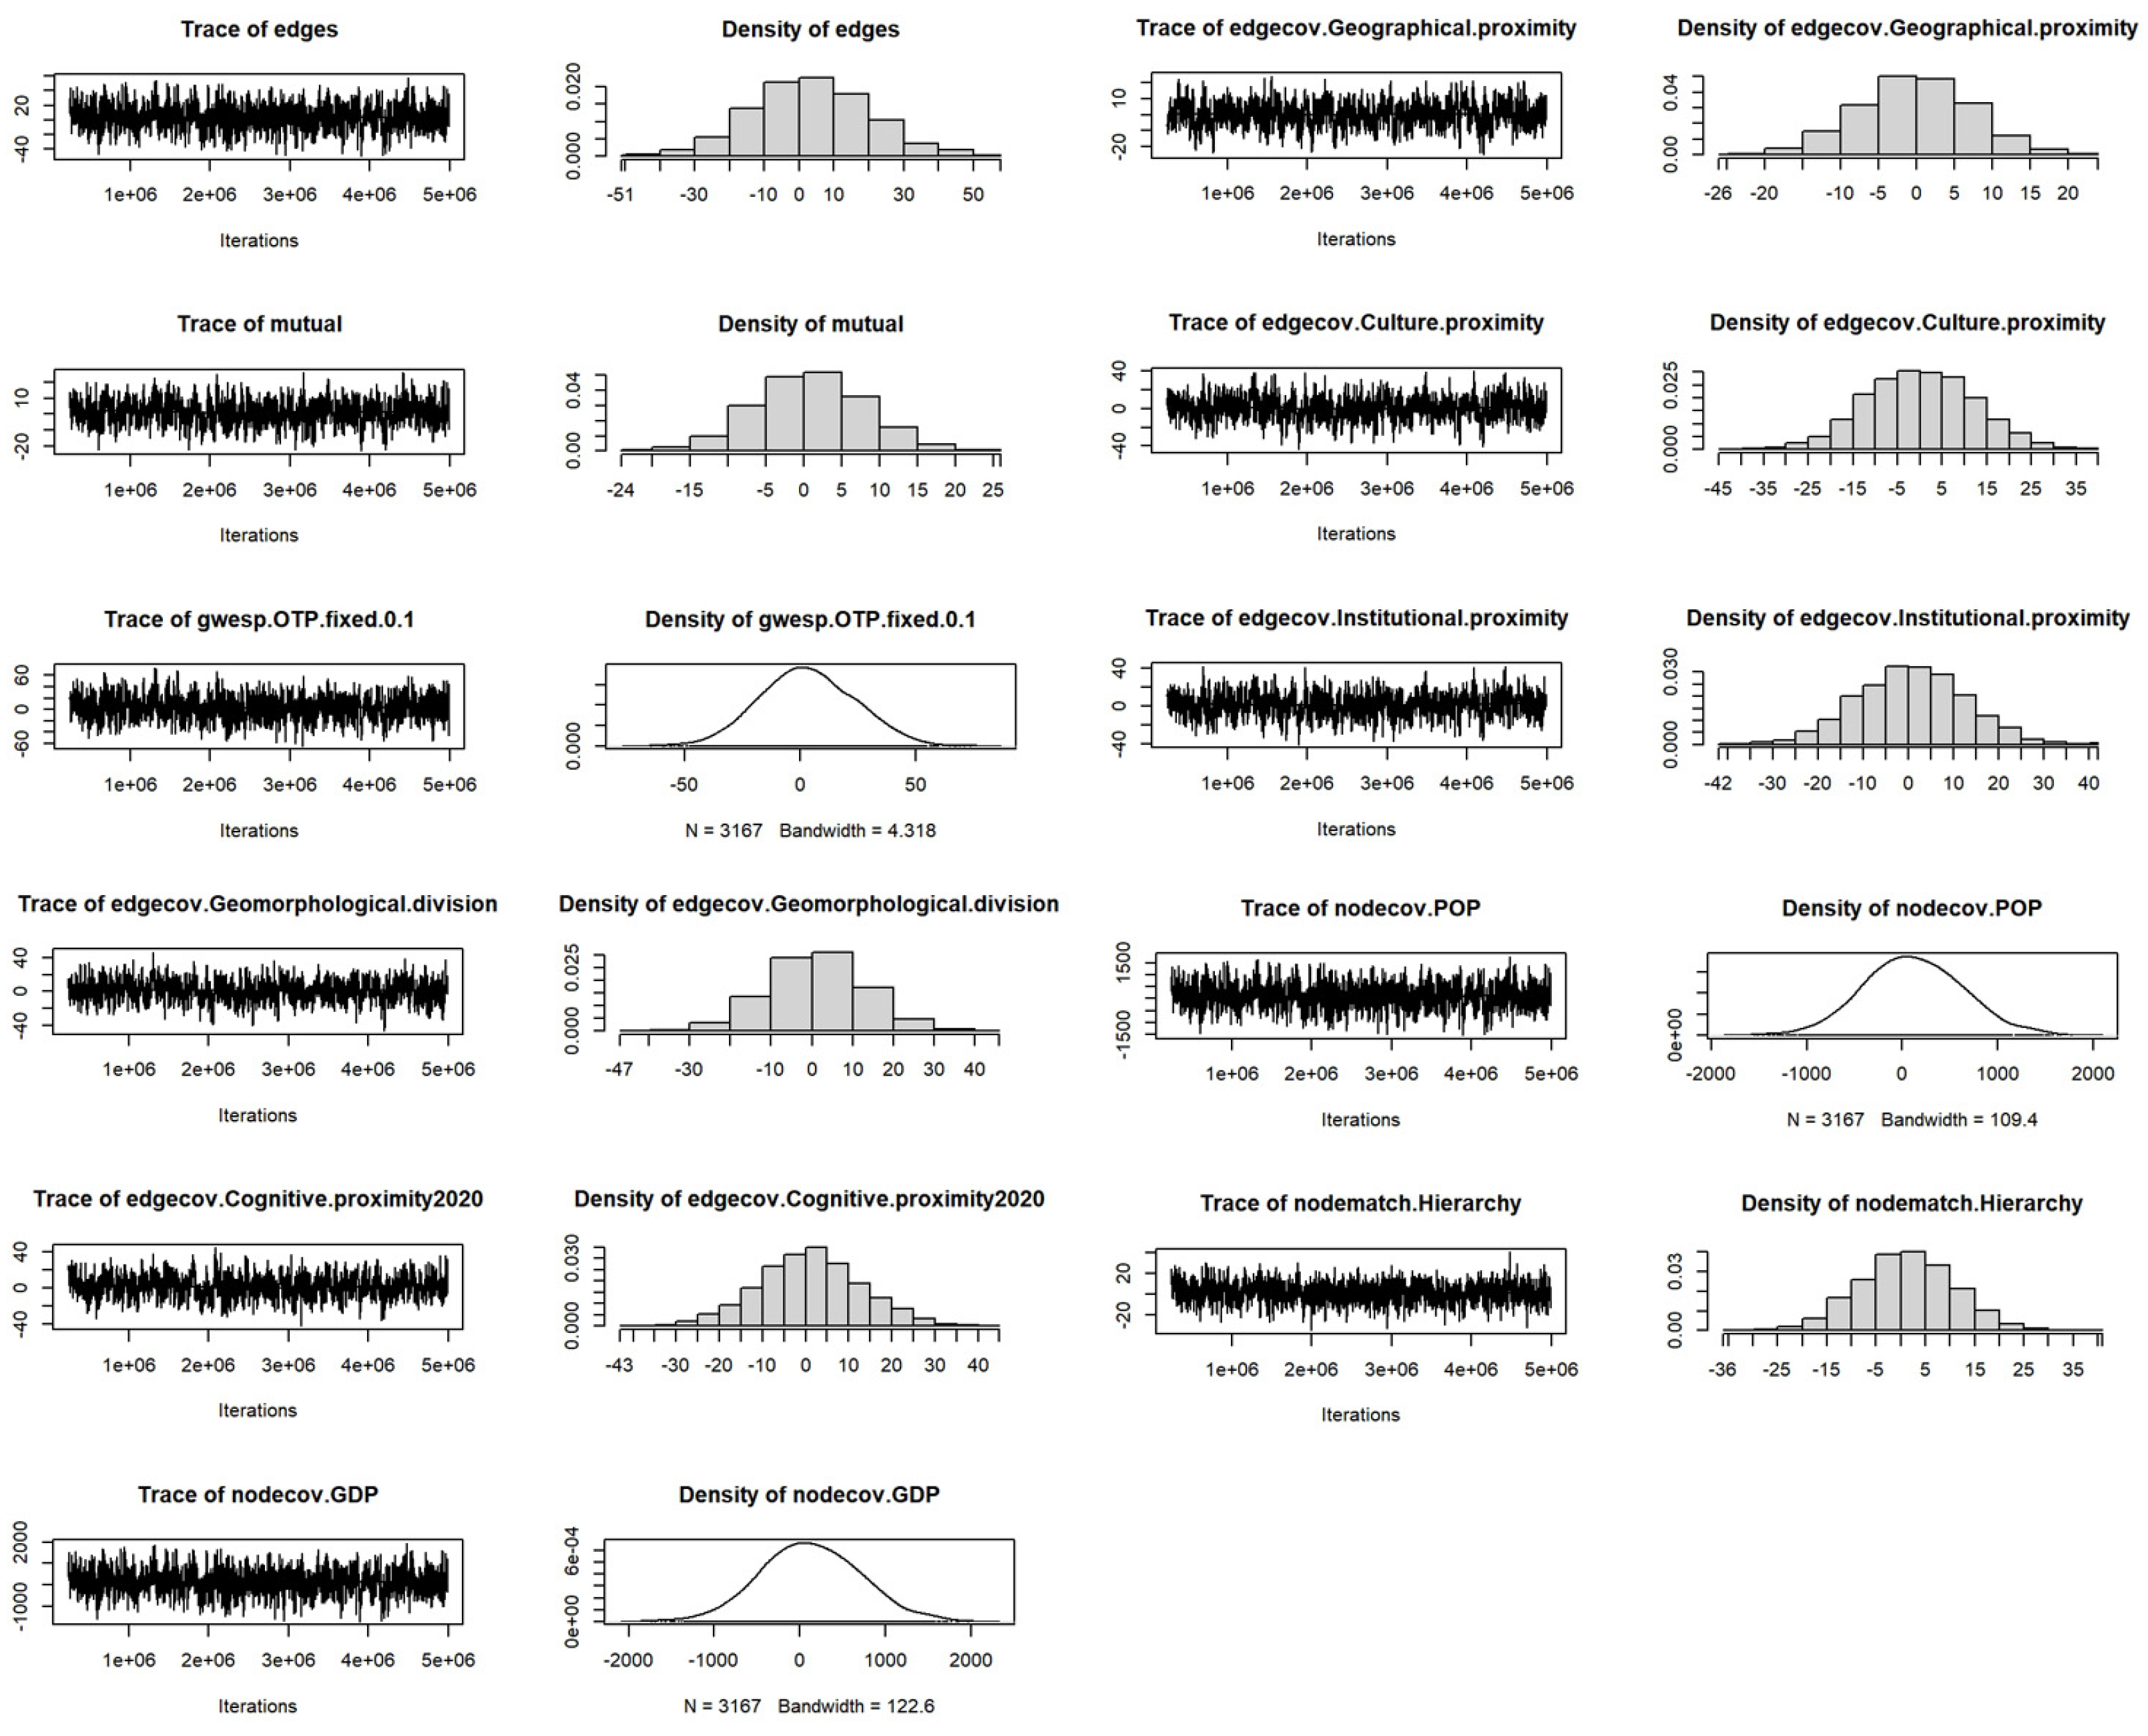
ERGMs estimation typically involves model diagnostics, parameter estimation, and simulation to assess convergence and goodness-of-fit. We used MCMC diagnostics to examine model convergence for our baseline models (model4 for 2000 and 2020). As shown in Figure 5 and Figure 6, the trace plots for all variables in these baseline models show random fluctuations centered around zero with no obvious temporal trends, while the density plots exhibit bell-shaped curves approximating a normal distribution centered at zero. In addition, the Geweke diagnostic p-values for all parameters are above 0.05. These results indicate good mixing of the MCMC chains and successful convergence of the baseline models, yielding stable estimates. For robustness check models, we also verified convergence; the results are provided in Appendix A.

4.4. Model Robustness and Goodness of Fit

4.4.1. Model Robustness Test

To ensure the reliability of the earlier conclusions in Table 4, robustness tests were conducted on the models. As depicted in Table 5, the enterprise network was binarized using thresholds based on non-zero means: 0.0010 for the year 2000 and 0.0083 for 2020, maintaining consistency with other variables. Due to the non-zero means being higher than the means including zeros, the number of relationships in the networks for 2000 and 2020 decreased to 182 and 352, respectively. As shown in Table 5, while there were variations in the coefficients of the main variables across Model 1 to Model 4, and the significance level of population decreased from 0.1% to 1% for 2000, the overall directional significance of other variables remained largely unchanged. This robustness analysis affirms the findings presented in Table 4.

4.4.2. Model Fit Test

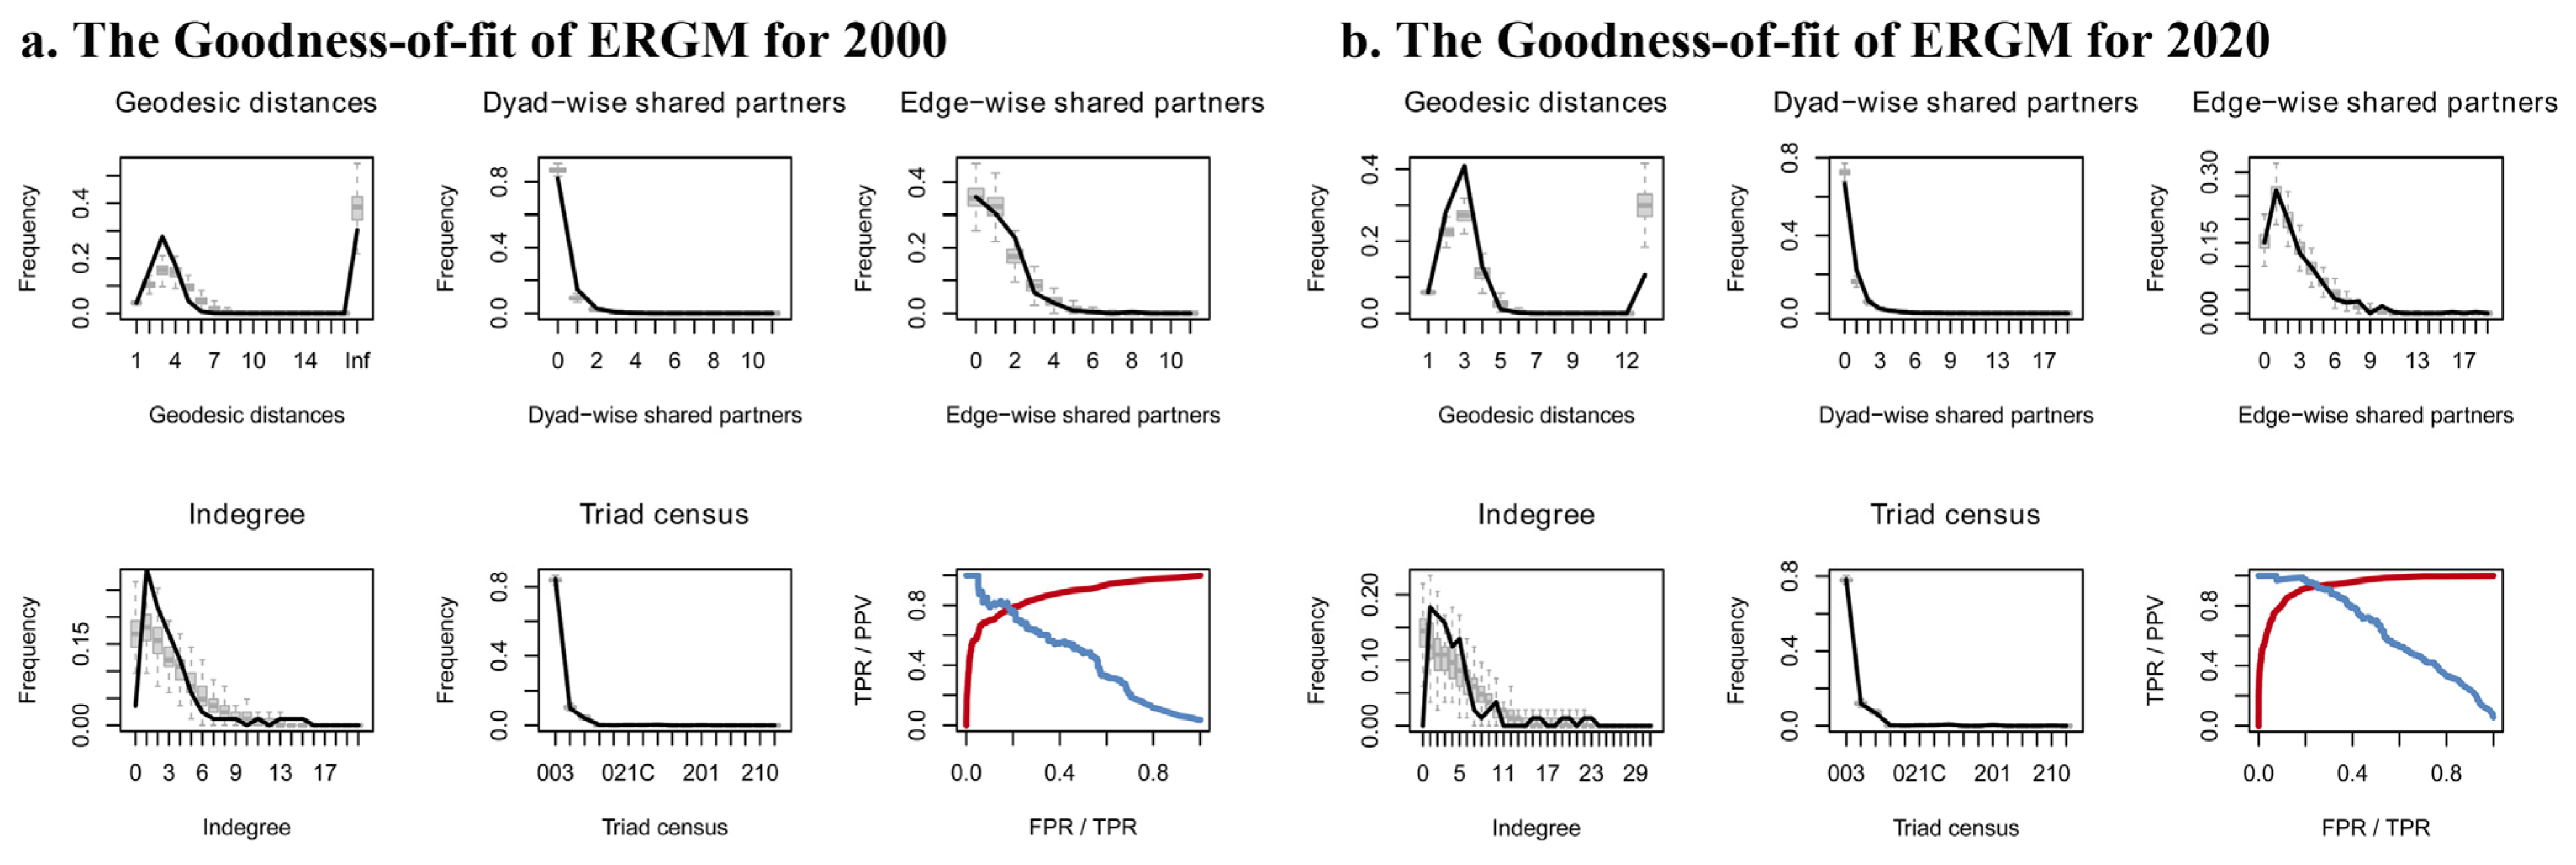
ERGMs typically employ Goodness-of-Fit (GOF) tests to compare essential network parameters between simulated networks (box plots) and observed networks (solid black lines). A well-fitting model shows that if the median of the simulated network’s box plot aligns closely with that of the observed network, the model is deemed appropriate. What is more, the model’s GOF is further assessed by comparing the Receiver Operating Characteristic (ROC) curve for the actual network with the ROC curve (red) of a random network of the same sample size. The closer the ROC curve is to the upper-left corner, the better the model’s predictive accuracy.
As depicted in Figure 7, the GOF tests for the years 2000 and 2020 reveal that key network parameters—such as geodesic distance, dyad-wise shared partners, indegree, and edge-wise shared partners—fall either within or close to the 95% confidence interval of the simulated network. Furthermore, the medians of most indicator values closely approximate those of the observed network parameters, indicating a good fit for the ERGMs. Additionally, the Receiver Operating Characteristic curve is positioned in the upper-left corner, respectively, confirming that both models exhibit strong GOF.

5. Conclusions and Discussion

5.1. Conclusions

From 2000 to 2020, the YRB experienced significant polycentric and networked development. Despite this, overall urban network development remained modest, with pronounced regional disparities. Development tended to decrease from east to west within the basin, with higher urban network development observed in the eastern plains compared to the western plateau and mountainous areas.
The urban network in the YRB was centered around core nodes such as Jinan, Qingdao, Zhengzhou, Taiyuan, and Xi’an, characterized by multiple isolated “core-periphery” radial networks. Strong connections were concentrated within each province’s major cities and their immediate surroundings, while horizontal connections across provincial borders were weaker. Administrative divisions and the prevalence of an “administrative region economy” persisted prominently. From 2000 to 2020, the urban network evolved from isolated core–periphery radial networks to corridor networks where some core nodes became interconnected.
The urban network dynamics in the YRB resulted from the combined influences of the city size-based preferential attachment mechanism, network self-organization mechanism, and multi-dimensional proximity mechanisms, and geographical boundary effect. Enterprises tended to establish branches or make investments in cities with spatial proximity and larger economic scales. Reciprocal and transitive structures significantly facilitated urban network formation. In addition, institutional proximity, geographical proximity, cultural proximity, cognitive proximity, and geomorphological division all exerted varying degrees of influence on investment connections between cities. Cities with closer geographical distances and stronger cultural identities tended to exhibit stronger enterprise connections. Furthermore, cities within the same geomorphological unit were more likely to form network connections, although the impact of geomorphological division diminished over time, while the positive effect of cognitive proximity tended to strengthen.

5.2. Discussion

The potential marginal contributions of this paper are twofold. First, unlike studies confined to limited large enterprises (e.g., listed companies and advanced producer services) or those examining only vertical headquarters–branch ties, this paper integrates both vertical and horizontal firm linkages using firm-level big data. The two are complementary, capturing intra-firm command-and-control relationships and inter-firm horizontal investment ties, respectively. This integration provides a more comprehensive and accurate measurement of inter-city firm linkages: incomplete or inaccurate measurement may lead to misjudgments of network structure, urban hierarchy, and evolutionary trends. Thus, this study provides a more reliable empirical foundation for future firm-based urban network research. Second, based on firm-level big data and the ERGMs, this paper concludes that the urban network dynamics in the YRB is driven by four main mechanisms and effects: the preferential attachment mechanism, the network self-organization mechanism, the multi-dimensional proximity mechanism, and the geographical boundary effect, thereby deepening the theoretical understanding of urban network dynamics.
This study reveals that the economic scale of cities significantly influences the establishment of intercity network relationships, illustrating a preferential attachment mechanism based on economies of scale. Larger cities with greater economic scale benefit from pronounced agglomeration effects, prompting enterprises to prefer establishing branches or investing in these cities to access broader markets and higher profits. This finding supports previous conclusions that “GDP and GDP per capita are influential factors affecting urban network evolution” [30,31]. However, contrary to prior research findings [28,31], this study finds that population size and city hierarchy do not significantly impact intercity network connections. This discrepancy can be attributed to two main factors. First, the urban network in the YRB remains relatively underdeveloped, primarily characterized by metropolitan areas centered around major cities. Network connections predominantly occur between a few major cities and their proximate cities within the same province, where significant disparities in population size and city hierarchy between core and peripheral cities exist. Consequently, the structure exhibits multiple isolated “core–periphery” radial network patterns. Second, the YRB continues to experience significant geographical, geomorphological, and administrative divisions, which further weaken intercity enterprise connections across provincial boundaries.
The endogenous structural dependency effect of the network indicates that enterprise connections are more likely to occur between cities with reciprocal and transitive relationships. This highlights the importance of establishing mechanisms for benefit sharing, exchanging information, and fostering communication platforms among enterprises, governments, and other stakeholders to mitigate administrative divisions in the YRB and enhance urban network connections. Historically, the YRB has lacked comprehensive coordinated development planning and institutional arrangements. Looking forward, it is crucial to establish mechanisms such as inter-provincial joint meetings and urban alliances. Cooperative endeavors should prioritize cross-regional industrial transfer, ecological compensation, water resource management, and collaborative pollution prevention and control.
In terms of multi-dimensional proximity mechanisms, cultural proximity based on provincial boundaries has the most significant impact on enterprise connections. This conclusion aligns with previous studies highlighting that provincial boundaries exert the strongest influence on inter-city connections [32]. Additionally, our research supports findings that while geomorphological divisions also affect urban network [33,34], the impact of geomorphological division is diminishing over time [35]. Institutional proximity based on urban agglomeration boundaries does not significantly influence the establishment of enterprise connections between cities within the region. One possible explanation is that current urban agglomerations in the YRB are primarily planning concepts rather than functionally integrated. Their spatial scope is relatively large, leading to insufficiently strong connections between cities within these clusters.
In theoretical terms, previous studies have summarized mechanisms driving urban network dynamics, such as preferential attachment [34], path dependence [36], and assortative effects [37]. In addition to these mechanisms, our study finds that urban network dynamics in the YRB are significantly influenced by natural boundaries due to geomorphological divisions and cultural boundaries stemming from administrative divisions. Furthermore, network self-organizing mechanisms and multi-dimensional proximity—such as geographical, cultural, and cognitive proximity—also play crucial roles in shaping urban network dynamics.

5.3. Limitations

This study has several limitations. First, due to the lack of existing research on whether vertical or horizontal firm linkages are more important for shaping urban network connections, this study adopted equal weights when integrating the two perspectives. Which type plays a dominant role in network dynamics, or whether their roles vary across different stages of development, awaits further investigation. Future research could assign different weights to the two types of linkages or employ dynamic network models to reveal their differentiated effects on urban network formation.
Second, the endogenous structural variables influencing urban network dynamics encompass not only reciprocity and transitivity but also critical factors such as k-star, GWDSP, among others. Future studies could benefit from including a broader array of structural variables.
Third, geographical proximity should be considered as a variable that evolves over time alongside changes in transportation accessibility. The static nature of the geographical proximity matrix used in this study underscores the need for future research to develop dynamic geographical proximity measures that reflect evolving transportation accessibility.
Fourth, while the ERGMs comprehensively incorporates urban attribute variables, endogenous network structure variables, and exogenous network covariates, it does not account for temporal effects and path dependence influencing network dynamics. Future research should explore how historical network shape current network dynamics and investigate path dependence effects using advanced methodologies such as temporal exponential random graph models (TERGMs).

Supplementary Materials

The following supporting information can be downloaded at: https://www.mdpi.com/article/10.3390/systems14050490/s1.

Author Contributions

Conceptualization, S.H.; data curation, S.H.; writing—original draft preparation, S.H.; funding acquisition, S.H. and Y.S.; software, J.W.; visualization, J.W.; formal analysis, J.W.; writing—review and editing, J.H. and X.H.; methodology, J.H. and X.H.; resources, X.H.; supervision, Y.S.; project administration, Y.S. All authors have read and agreed to the published version of the manuscript.

Funding

This research was funded by the National Natural Science Foundation of China (Grant Nos. 42201229 and 42401212), the General Project of Ministry of Education Foundation on Humanities and Social Sciences (Grant No. 22YJC790043), and the Natural Science Foundation of Henan Province (Youth Project, Grant No. 242300421640).

Data Availability Statement

The original data presented in this study are included in the article or Supplementary Materials. The calculation code/software is available from the corresponding author upon reasonable request.

Conflicts of Interest

The authors declare no conflict of interest.

Appendix A. Convergence Diagnostics for Robustness Check Models

Figure A1. MCMC convergence diagnostics for the robustness check model (2000).
Systems 14 00490 g0a1
Figure A2. MCMC convergence diagnostics for the robustness check model (2020).
Systems 14 00490 g0a2

References

  1. Capello, R. The city network paradigm: Measuring urban network externalities. Urban Stud. 2000, 37, 1925–1945. [Google Scholar] [CrossRef]
  2. Meijers, E. From central place to network model: Theory and evidence of a paradigm change. Tijdschr. Voor Econ. Soc. Geogr. 2007, 98, 245–259. [Google Scholar] [CrossRef]
  3. Taylor, P.; Catalano, G.; Walker, D. Measurement of the world city network. Urban Stud. 2002, 39, 2367–2376. [Google Scholar] [CrossRef]
  4. Rossi, E.C.; Taylor, P.J. Banking networks across Brazilian cities: Interlocking cities within and beyond Brazil. Cities 2005, 22, 381–393. [Google Scholar] [CrossRef]
  5. Zhao, M.; Liu, X.; Derudder, B.; Zhong, Y.; Shen, W. Mapping producer services networks in mainland Chinese cities. Urban Stud. 2015, 52, 3018–3034. [Google Scholar] [CrossRef]
  6. Zhang, X. Multiple creators of knowledge-intensive service networks: A case study of the Pearl River Delta city-region. Urban Stud. 2018, 55, 2000–2019. [Google Scholar] [CrossRef]
  7. Taylor, P.J.; Evans, D.M.; Pain, K. Application of the interlocking network model to mega-city-regions: Measuring polycentricity within and beyond city-regions. Reg. Stud. 2008, 42, 1079–1093. [Google Scholar] [CrossRef]
  8. Pan, F.; Bi, W.; Liu, X.; Sigler, T. Exploring financial centre networks through inter-urban collaboration in high-end financial transactions in China. Reg. Stud. 2018, 54, 162–172. [Google Scholar] [CrossRef]
  9. Gu, X.; Tang, X.; Chen, T.; Liu, X. Predicting the network shift of large urban agglomerations in China using the deep-learning gravity model: A perspective of population migration. Cities 2023, 145, 104680. [Google Scholar] [CrossRef]
  10. Ma, H.; Huang, X. Visualizing the urban network constructed by the most innovative enterprises in China. Reg. Stud. Reg. Sci. 2022, 9, 343–346. [Google Scholar] [CrossRef]
  11. Martinus, K.; Sigler, T.J.; Searle, G.; Tonts, M. Strategic globalizing centers and sub-network geometries: A social network analysis of multi-scalar energy networks. Geoforum 2015, 64, 78–89. [Google Scholar] [CrossRef]
  12. Hu, X.; Wang, C.; Wu, J.; Stanley, H.E. Understanding interurban networks from a multiplexity perspective. Cities 2020, 99, 102625. [Google Scholar] [CrossRef]
  13. Shen, Y.; Karimi, K. Urban function connectivity: Characterisation of functional urban streets with social media check-in data. Cities 2016, 55, 9–21. [Google Scholar] [CrossRef]
  14. Jin, X.; Hu, G.; Ding, H.; Ye, S.; Lu, Y.; Lin, J. Evolution of spatial structure patterns of city networks in the Yangtze River Economic Belt from the perspective of corporate pledge linkage. Growth Change 2020, 51, 833–851. [Google Scholar] [CrossRef]
  15. Timberlake, M. Review of world city network: A global urban analysis. J. World-Syst. Res. 2018, 24, 230–235. [Google Scholar] [CrossRef]
  16. Pan, F.; Bi, W.; Lenzer, J.; Zhao, S. Mapping urban networks through inter-firm service relationships: The case of China. Urban Stud. 2017, 54, 3639–3654. [Google Scholar] [CrossRef]
  17. Van Oort, F.; Burger, M.; Raspe, O. On the economic foundation of the urban network paradigm: Spatial integration, functional integration and economic complementarities within the Dutch Randstad. Urban Stud. 2010, 47, 725–748. [Google Scholar] [CrossRef]
  18. Pan, F.; He, Z.; Fang, C.; Yang, B.; Liang, J. World city networks shaped by the global financing of Chinese firms: A study based on initial public offerings of Chinese firms on the Hong Kong Stock Exchange, 1999–2017. Netw. Spat. Econ. 2018, 18, 751–772. [Google Scholar] [CrossRef]
  19. Alderson, A.S.; Beckfield, J. Power and Position in the World City System. Am. J. Sociol. 2004, 109, 811–851. [Google Scholar] [CrossRef]
  20. Taylor, P.J. Specification of the world city network. Geogr. Anal. 2001, 33, 181–194. [Google Scholar] [CrossRef]
  21. Zhang, F.; Ning, Y.; Lou, X. The evolutionary mechanism of China’s urban network from 1997 to 2015: An analysis of air passenger flows. Cities 2020, 109, 103005. [Google Scholar] [CrossRef]
  22. Wen, H.; Zhang, Q.; Zhu, S.; Huang, Y. Inter-and intra-city networks: How networks are shaping China’s film industry. Reg. Stud. 2020, 55, 533–545. [Google Scholar] [CrossRef]
  23. Zhang, Y.; Song, R.; Zhang, K.; Wang, T. The characteristics and modes of urban network evolution in the Yangtze River Delta in China from 1990 to 2017. IEEE Access 2021, 9, 5531–5544. [Google Scholar] [CrossRef]
  24. Herman, P.R. Modeling complex network patterns in international trade. Rev. World Econ. 2021, 158, 127–179. [Google Scholar] [CrossRef]
  25. Chakraborty, M.; Byshkin, M.; Crestani, F. Patent citation network analysis: A perspective from descriptive statistics and ERGMs. PLoS ONE 2020, 15, e0241797. [Google Scholar] [CrossRef]
  26. Van Der Pol, J. Introduction to network modeling using exponential random graph models (ergm): Theory and an application using R-project. Comput. Econ. 2018, 54, 845–875. [Google Scholar] [CrossRef]
  27. Hu, S.; Chen, G.; Miao, C. Understanding the structural evolution and driving mechanisms of urban network using firm-level big data and TERGM modeling. Cities 2025, 161, 105869. [Google Scholar] [CrossRef]
  28. Gao, P.; He, D.; Sun, Z.; Ning, Y. Characterizing functionally integrated regions in the Central Yangtze River Megaregion from a city-network perspective. Growth Change 2020, 51, 1357–1379. [Google Scholar] [CrossRef]
  29. Boschma, R. Proximity and Innovation: A Critical Assessment. Reg. Stud. 2005, 39, 61–74. [Google Scholar] [CrossRef]
  30. Liu, X.; Derudder, B.; Liu, Y. Regional geographies of intercity corporate networks: The use of exponential random graph models to assess regional network-formation. Pap. Reg. Sci. Assoc. 2015, 94, 109–127. [Google Scholar] [CrossRef]
  31. Chong, Z.; Pan, S. Understanding the structure and determinants of city network through intra-firm service relationships: The case of Guangdong-Hong Kong-Macao Greater Bay Area. Cities 2020, 103, 102738. [Google Scholar] [CrossRef]
  32. Zhang, W.; Derudder, B.; Wang, J.; Shen, W. Regionalization in the yangtze river delta, China, from the perspective of inter-city daily mobility. Reg. Stud. 2017, 52, 528–541. [Google Scholar] [CrossRef]
  33. Martinus, K.; Sigler, T.J. Global city clusters: Theorizing spatial and non-spatial proximity in inter-urban firm networks. Reg. Stud. 2017, 52, 1041–1052. [Google Scholar] [CrossRef]
  34. Vinciguerra, S.; Frenken, K.; Valente, M. The geography of internet infrastructure: An evolutionary simulation approach based on preferential attachment. Urban Stud. 2010, 47, 1969–1984. [Google Scholar] [CrossRef]
  35. He, D.; Zhang, Z.; Han, M.; Kang, Y.; Gao, P. Multi-dimensional boundary effects and regional economic integration: Evidence from the Yangtze River Economic Belt. Int. Reg. Sci. Rev. 2022, 45, 472–498. [Google Scholar] [CrossRef]
  36. Scott, T.A. Analyzing policy networks using valued exponential random graph models: Do government-sponsored collaborative groups enhance organizational networks? Policy Stud. J. 2016, 44, 215–244. [Google Scholar] [CrossRef]
  37. Radil, S.M. A network approach to the production of geographic context using exponential random graph models. Int. J. Geogr. Inf. Sci. 2021, 33, 1270–1288. [Google Scholar] [CrossRef]
Figure 1. The analytical framework for the urban network dynamics in the YRB.
Systems 14 00490 g001
Figure 2. The urban agglomerations and major cities in the YRB.
Systems 14 00490 g002
Figure 3. Urban network structure in the YRB from different perspectives.
Systems 14 00490 g003
Figure 4. The geomorphological division in the YRB.
Systems 14 00490 g004
Figure 5. MCMC convergence diagnostics plots for the baseline ERGMs in 2000.
Systems 14 00490 g005
Figure 6. MCMC convergence diagnostics plots for the baseline ERGMs in 2020.
Systems 14 00490 g006
Figure 7. GOF test for ERGMs.
Systems 14 00490 g007
Table 1. Urban network structure analysis index.
IndexFormulaMeaning
Degree centrality D C i = j = 1 N X i j i j Measures the node’s control and influence in the network
Network density D 1 = i = 1 N j = 1 N X i j N ( N 1 ) Measures the tightness of connections in the network
Modularity Q = r = 1 m [ n r N ( S r 2 N ) 2 ] Measures the quality of network community divisions, with values ranging from 0 to 1; typically, Q values between 0.3 and 0.7 indicate effective community partitioning.
Note: in the table, i and j denote nodes, N represents the total number of network nodes, Xij indicates the number of connections between nodes i and j; r denotes communities, m is the computed number of network communities; nr is the number of cities in the r community; Sr is the total number of nodes connected to each city in community r.
Table 2. Urban network structure change in the YRB from different perspectives.
YearHeadquarters-Branch NetworkInvestment NetworkIntegrated Network
Degree CentralityNetwork DensityModularity and CommunityDegree CentralityNetwork DensityModularity and CommunityDegree CentralityNetwork DensityModularity and Community
20002.350.030.55 (13)4.630.060.61 (8)7.010.090.61 (7)
201012.30.160.49 (8)12.070.150.54 (6)20.20.250.53 (6)
202040.80.490.619 (5)26.040.330.51 (6)47.10.570.56 (6)
Table 3. Index System for the Influencing Factors of Urban Network Dynamics in the YRB.
Variable TypeVariable NameMechanism or EffectVariable Explanation
Attribute variablesPopulation sizeCity size-based preferential attachmentDo cities with larger populations tend to establish urban network relationships?
Economic scale (GDP)Do cities with larger economic scales tend to establish urban network relationships?
Urban hierarchyDo cities with higher hierarchy tend to establish urban network relationships?
Endogenous structural variablesEdges (Systems 14 00490 i001)Network self-organizationThe foundational effect in network formation.
Reciprocity
(Systems 14 00490 i002)
Does the existing mutual or symmetric structure between cities facilitate the formation of urban network relationships?
Transitivity
(Systems 14 00490 i003)
Does the triangle-based transitivity structure facilitate the formation of urban network relationships?
Exogenous network covariatesGeographic proximityMulti-dimensional proximityAre cities that are geographically close tend to form urban network relationships?
Institutional proximityAre cities within the same urban agglomeration inclined to establish urban network relationships?
Cultural proximityAre cities within the same provincial boundary likely to build urban network relationships?
Cognitive proximityAre cities with close patent cooperation prefer to establish urban network relationships?
Geomorphological divisionGeographical boundary effectAre cities within the same geomorphological region more likely to forge urban network relationships?
Table 4. Influencing Factors of Urban Network Dynamics in the YRB from 2000 to 2020.
Variable TypeVariablesModel 1Model 2Model 3Model 4
20002020200020202000202020002020
Attribute variableGDP 1.00 ***
(0.09)
1.50 ***
(0.10)
0.47 ***
(0.09)
0.91 ***
(0.13)
Population −0.44 ***
(0.10)
−0.55 ***
(0.11)
−0.34 ***
(0.09)
−0.42 ***
(0.12)
Urban hierarchy −0.45 **
(0.14)
−0.10
(0.11)
−0.77 ***
(0.15)
−0.50 ***
(0.14)
Endogenous variableEdges−3.24 ***
(0.06)
−2.78 ***
(0.05)
−18.94 ***
(2.00)
−36.95 ***
(1.92)
−4.57 ***
(0.10)
−4.93 ***
(0.10)
−8.18 ***
(1.70)
−22.53 ***
(2.45)
Reciprocity 2.66 ***
(0.24)
2.77 ***
(0.17)
1.63 ***
(0.27)
1.17 ***
(0.24)
Transitivity 1.33 ***
(0.11)
1.65 ***
(0.07)
0.69 ***
(0.13)
0.63 ***
(0.14)
Exogenous covariateGeographical proximity 0.88 ***
(0.16)
1.23 ***
(0.19)
Institutional proximity −0.22
(0.22)
−0.30
(0.22)
Cultural proximity 1.75 ***
(0.25)
1.88 ***
(0.24)
Cognitive proximity 0.80
(0.45)
1.27 ***
(0.14)
Geomorphological division 0.44 **
(0.15)
0.27
(0.14)
Model fittingAIC2183.803034.191961.122462.401738.492040.351379.231562.29
BIC2190.603041.011988.422489.701758.972260.831454.311637.37
Log Likelihood−1090.90−1516.09−976.56−1227.20−866.25−1117.64−678.61−770.15
Note: In the R Statnet package, *, **, and *** represent significance at the 5%, 1%, and 0.1% levels, respectively.
Table 5. Robustness test of influencing factors on urban network structure from 2000 to 2020.
Variable TypeVariablesModel 1Model 2Model 3Model 4
20002020200020202000202020002020
Attribute variableGDP 1.12 ***
(0.10)
1.49 ***
(0.10)
0.58 ***
(0.11)
0.87 ***
(0.13)
Population −0.53 ***
(0.12)
−0.53 ***
(0.11)
−0.40 ***
(0.12)
−0.39 **
(0.12)
Urban hierarchy −0.64 ***
(0.17)
−0.16
(0.12)
−1.01***
(0.19)
−0.56 ***
(0.15)
Endogenous variableEdges−3.59 *** (0.08)−2.91 ***
(0.05)
−20.2 ***
(2.39)
−37.33 **
(2.03)
−4.62 *** (0.10)−4.90 ***
(0.12)
−9.49 ***
(2.10)
−22.34 ***
(2.57)
Reciprocity 2.97 ***
(0.30)
3.00 ***
(0.21)
1.60 ***
(0.33)
1.45 ***
(0.26)
Transitivity 1.27 ***
(0.12)
1.55 ***
(0.12)
0.41 **
(0.15)
0.47 ***
(0.14)
Exogenous covariateGeographical proximity 0.94 ***
(0.19)
1.12 ***
(0.19)
Institutional proximity −0.31
(0.28)
−0.45
(0.24)
Cultural proximity 2.31 ***
(0.32)
2.03 ***
(0.26)
Cognitive proximity 0.83
(0.48)
1.34 ***
(0.16)
Geomorphological division 0.51 **
(0.19)
0.29 ** (0.15)
Model fittingAIC1679.332772.671486.112254.271359.472022.531028.581392.17
BIC1686.162779.501513.412281.571379.952043.011103.671467.25
Log Likelihood−838.67−1385.34−739.05−1123.14−676.73−1018.26−503.29−685.08
Note: In the R Statnet package, *, **, and *** represent significance at the 5%, 1%, and 0.1% levels, respectively.
Disclaimer/Publisher’s Note: The statements, opinions and data contained in all publications are solely those of the individual author(s) and contributor(s) and not of MDPI and/or the editor(s). MDPI and/or the editor(s) disclaim responsibility for any injury to people or property resulting from any ideas, methods, instructions or products referred to in the content.