1. Introduction
Data, as a new production element, is redefining global economic paradigms and accelerating the digital transition of enterprises, thereby catalyzing the growth of the digital economy [
1]. Data elements also function as the foundational “fuel” for artificial intelligence (AI) systems, enabling us to mitigate climate change and advance sustainable development [
2]. Concurrently, global greenhouse gas emissions continued to rise in 2023, and achieving dual control of total carbon emissions and carbon emission intensity remains a core challenge in global climate change governance. According to the Emissions Gap Report 2024, countries must collectively commit in the next round of Nationally Determined Contribution (NDCs) to diminish annual greenhouse gas emissions by 42% by 2030 and 57% by 2035. Failure to undertake immediate and coordinated measures will result in the breach of the 1.5 °C target established by the Paris Agreement in the near future.
Recent breakthroughs in AI and big data analytics offer a new approach, facilitating real-time monitoring, precise identification of emission sources, and dynamic optimization of industrial processes. Numerous existing studies have examined the carbon reduction effects of data elements from the perspectives of digitalization, big data applications, and policy intervention. For carbon emissions total volume, the Big Data Comprehensive Pilot Zones policy has been confirmed to reduce carbon emissions [
3,
4,
5,
6]. Also, the advancements in AI technology can enhance the effectiveness of carbon emission reduction [
7], and agricultural digitization can curb sector-specific emissions through precision monitoring and resource optimization [
8]. For carbon emissions intensity, enterprise digital transformation is proved to significantly reduce carbon emission intensity by enhancing technological innovation, internal governance, and environmental transparency [
9,
10]. Meanwhile, the development of the digital economy and digital infrastructure can significantly reduce carbon emissions intensity via industrial upgrading and green technological innovation [
11,
12,
13]. Concurrently, the digital economy’s carbon emission performance is shaped by mechanisms like energy intensity modulation and urban afforestation, with AI-enabled predictive models enhancing the precision of energy efficiency assessments [
14,
15]. Current research mentioned above primarily investigates the isolated effects of data-driven interventions on singular carbon emissions metrics (total volume or intensity), but China exhibits distinct disparities in the spatial distribution and control pathways of carbon emissions and carbon emission intensity [
16]. Therefore, it is difficult to accurately assess the simultaneous trends of carbon emissions and intensity if dual-control indicators are not established.
Noticeably, the correlation between the digital technology and carbon emissions is not always negative. The dual nature of artificial intelligence, capable of producing both beneficial and detrimental effects, necessitates rigorous academic attention. Studies demonstrate that artificial intelligence, machine learning, and waste management systems have made significant contributions to improving energy efficiency and reducing carbon emissions [
17,
18], and the AI adoption is anticipated to decrease U.S. office emissions by 8–19% by 2050 [
19]. However, digital technology may induce an energy rebound effect due to improved efficiency, and automation could also lead to the risk of expansion of high-energy-consuming production, both of which are not conducive to carbon emission reduction [
20]. Other studies indicate that the advancement of China’s digital economy has intensified carbon emissions due to a lack of improvement in energy efficiency [
21]. Also, the environmental outcomes of digitalization exhibit heterogeneous patterns: urban carbon emissions intensity declines with digital economy development via green technological innovation and industrial upgrading [
13,
22], yet per-capita emissions may experience a temporary increase due to rebound effects from energy-intensive digital activities [
11,
23].
Certain research indicates that the relation between digital technology and carbon emissions is influenced by multiple contextual factors. For instance, an inverted U-shaped correlation between digitization and carbon emissions has been identified in certain studies, where initial increases in energy use and non-green technologies are later offset by structural shifts toward green innovation and energy efficiency [
24,
25], particularly in eastern and non-resource-based cities where industrial maturity accelerates emission decoupling. Spatial analyses reveal that digital technology can cut carbon emissions in adjacent cities via technology diffusion [
26], but government intervention may mitigate this decrease effect [
27]. Similarly, digital technology can substantially amplify the synergistic effects of energy conservation and carbon emission reduction, and the Chief Digital Officer may further augment this influence [
28]. Due to the significant disparities in energy structures, technological substitution capacity, and regulatory environments between high-pollution industries (such as steel and cement) and low-pollution industries (such as pharmaceuticals and electronics), it is essential to examine whether data elements can effectively reduce carbon emissions in both total volume and intensity under varying constraints. Yet this critical issue remains largely unexplored.
As a summary, two research gaps can be identified based on existing studies. First, most articles have examined the carbon reduction effects of data elements, but often treat carbon emissions and carbon emission intensity independently, without constructing indicators of the dual control degree of carbon emissions to connect the two. Second, existing research generally lacks a systematic examination of industry heterogeneity. Therefore, our aim is to rectify these shortcomings by initially constructing a “bridge” that connects carbon emissions total volume with carbon emission intensity, and assessing the influence of data elements on dual control of carbon emissions via the lens of industry differentiation.
Marginal contributions are as follows. First, we innovatively construct a composite index integrating both total carbon emissions and emission intensity, providing a more comprehensive measurement framework for dual carbon governance than unitary indicators used in the prior literature. Second, this paper adopts an industry heterogeneity perspective to empirically evaluating the impact of data elements on carbon emission dual control, enriching theoretical understanding of heterogeneous policy implementation mechanisms within environmental regulation and digital transformation paradigms. Finally, we examine the pathways of capacity utilization and green technology innovation to dissect the divergent mechanisms data elements exert on dual control of carbon emission, thereby proposing tailored optimization strategies.
2. Hypothesis Formulation and Research Framework
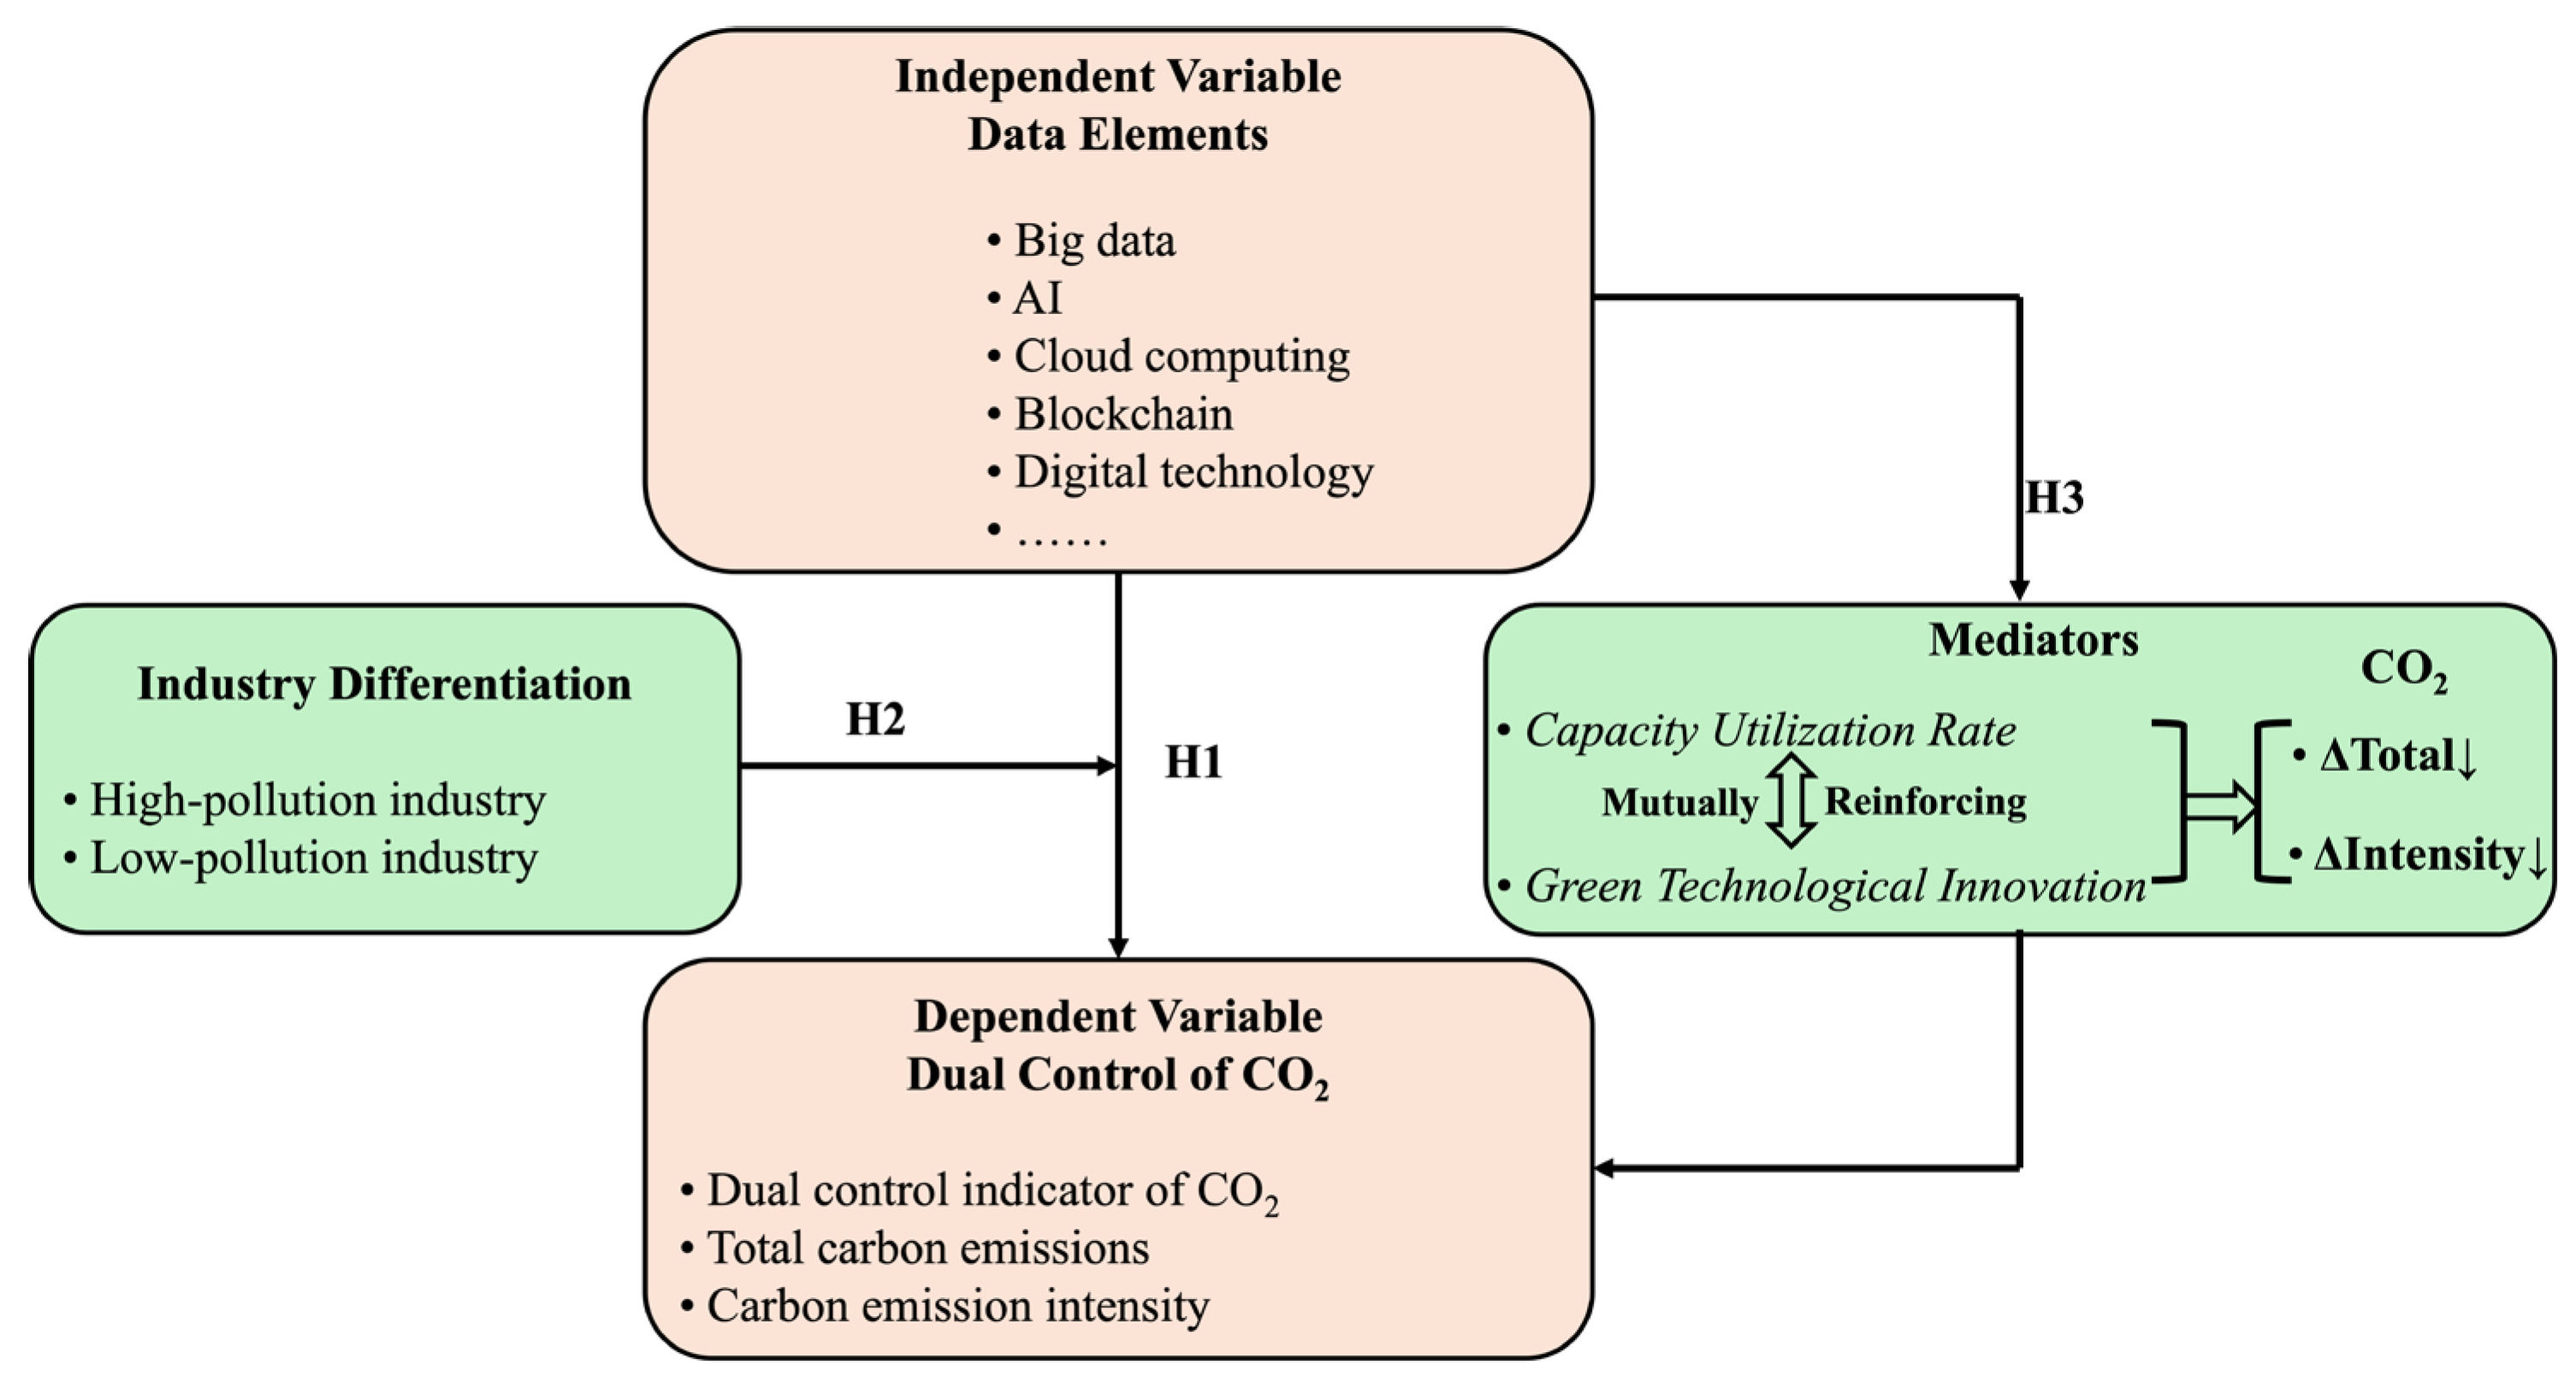
This section proposes three research hypotheses and constructs a theoretical analytical framework to evaluate the influence of data elements on the dual control of carbon emissions, as can be seen in
Figure 1.
A growing body of empirical work substantiates the positive linkages between digitalization and green total factor productivity [
29], big data analytics and environmental benefits of e-procurement [
30], and big data application and green innovation [
1]. In this case, data elements may allow firms to concurrently tackle two critical aspects of decarbonization: emission intensity and emissions total volume. For example, empirical evidence suggests that data technologies, including AI-driven energy analytics in smart manufacturing systems, reduce per-unit emissions by 30–50% while preserving output quality [
17], thereby controlling both carbon emissions and carbon intensity simultaneously. Concurrently, institutionalized data infrastructures, exemplified by China’s Big Data Comprehensive Pilot Zones (BDCPZs), have achieved absolute CO
2 emission reductions through industrial restructuring and enhanced green total factor productivity [
4]. Digital technology substantially aids in diminishing carbon emissions intensity by fostering green technology innovation and enhancing industrial structure [
22].
Unlike conventional factors constrained by trade-offs between efficiency and scale, firms may synchronize production scales with ecological thresholds without sacrificing profitability by utilizing detailed information from blockchain-enabled supply chains and machine learning simulations. By utilizing the data elements, companies can employ predictive models to dynamically modify their output in accordance with sustainable resource capacity. The high efficiency, integration and green features of digital technology can simultaneously achieve carbon emission reduction and ecological improvement through the advancement of energy efficiency and green technological innovation [
31]. Also, blockchain technology enables supply chain transparency and helps track the carbon footprint throughout the life cycle [
32]. In addition, the emergence of green AI services, which utilize renewable energy to power the Internet of Things (IoT) devices for executing AI tasks at the edge [
33], renders IoT applications more low-carbon and reduces carbon emission costs. In this context, the progressive decrease in carbon emission costs for enterprises will encourage greater adoption of IoT. This, in turn, facilitates the dynamic adjustment of emission targets based on real-time corporate operational data, thereby achieving dual control of carbon emissions. Our paper contends that intelligent infrastructure and various digital technologies enable enterprises to enhance their dual control over carbon emissions. Consequently, we present Hypothesis 1 as stated below.
H1. Data elements can significantly improve corporate dual control of carbon emissions.
The effectiveness of data elements in enabling dual control of carbon emissions is likely shaped by sectoral heterogeneity, particularly industrial pollution intensity. High-pollution industries, which are characterized by carbon-intensive technological dependencies, rigid regulatory quotas, and entrenched infrastructure, face mounting environmental pressure and compliance costs. This regulatory and operational urgency may paradoxically render them more responsive to the transformative potential of data elements, as digital solutions offer pathways to reconcile emission reduction mandates with production continuity. In contrast, low-pollution sectors, benefiting from greater operational flexibility and fewer regulatory constraints, may lack the immediate impetus to leverage data for systemic decarbonization, potentially resulting in more muted effects.
Several factors may explain why high-pollution industries stand to benefit more from data-driven decarbonization. For instance, AI-enabled process optimization in manufacturing has been shown to significantly reduce energy intensity [
18], and in high-pollution sectors where energy consumption is concentrated, even marginal efficiency gains can translate into substantial absolute emission reductions. Moreover, while high-pollution firms have historically prioritized short-term compliance over systemic innovation [
24], the increasing stringency of environmental regulations may be shifting this calculus, incentivizing investment in scalable data systems that deliver both compliance and productivity gains. Conversely, low-pollution sectors, despite exhibiting enhanced adaptability in integrating data for green innovation, as evidenced by their rapid adoption of digital twins and circular supply chains [
34], may face diminishing returns given their already lower emission baselines. Spatial analyses further reveal that digitalization’s emission reduction effects are more pronounced in technologically mature regions where high-pollution industries often undergo intensive transformation [
25].
A critical yet often underappreciated factor is the rebound effect, which occurs when efficiency gains from digital technologies lower the marginal cost of production, thereby incentivizing firms to expand their output and partially offsetting initial emission reductions. This mechanism carries distinct implications for total emissions across industry types. In high-pollution industries, which are typically capital-intensive and operate with thin profit margins, efficiency improvements could theoretically trigger output expansion [
23,
35]. However, in the context of binding emission caps and stringent environmental oversight, such rebound effects may be contained or even outweighed by the scale of efficiency gains, resulting in net dual-control improvements. By contrast, low-pollution industries, characterized by lower marginal abatement costs and greater technological agility, may experience weaker rebound effects but also smaller baseline gains from data deployment. This asymmetric balance between efficiency gains and rebound potential helps explain why data elements may yield more pronounced dual-control outcomes in high-pollution sectors. Evidence from the preceding analysis indicates pronounced industry heterogeneity in the impact of data elements on dual carbon control, with effects potentially concentrated in pollution-intensive industries. Accordingly, we propose Hypothesis 2.
H2. The impact of data elements on dual control of CO2 exhibits significant disparities between high-pollution and low-pollution industries.
Building on the consensus that optimizing resource allocation and promoting technological innovation are key mechanisms for the digital economy to reduce carbon emission intensity [
11], we dissect the black box via a dynamic synergy lens: data elements can recreate the fundamental logic of dual control over corporate carbon emissions via a synergistic mechanism including enhanced capacity utilization and expedited green technology innovation.
The capacity utilization rate quantifies the ratio of an enterprise’s actual output to its available capacity, serving as a crucial indicator of resource allocation efficiency and operational circumstances. As the capacity utilization rate of an enterprise rises, the decrease in inefficient energy consumption will directly lower total carbon emissions (ΔTotal↓). Simultaneously, the excess of idle capital will diminish, enhancing production efficiency, which will contribute to a reduction in energy consumption per unit of GDP and ultimately decrease carbon emission intensity (ΔIntensity↓). AI and data technologies critically enable operational efficiencies [
36] and systemic innovation (such as clean material discovery), synergistically contributing to carbon mitigation targets [
35]. Crucially, data technologies convert the capacity utilization rate from a static metric into a dynamic decarbonization lever through a three-tiered path: (1) Real-time monitoring. Artificial intelligence-driven systems may decrease building carbon emissions by as much as 15% with real-time monitoring and adaptive management measures [
37]. (2) Predictive optimization. Data elements could guide enterprises to accurately match production capacity and demand through high-precision carbon emission prediction and efficiency evaluation, reduce idle resources, and thus optimize capacity utilization [
38]. (3) Structural intensification. For instance, data technology enables structural optimization in waste ecosystems, most notably through AI-driven logistics that reduce the transportation distance by 36.8%, cost by 13.35%, and time by 28.22% [
18]. To sum up, the application of data elements in enterprises can improve capacity utilization, thereby reducing resource waste, promoting structural upgrades, and simultaneously achieving total carbon emissions control and intensity control.
Meanwhile, large-scale data modeling and analysis, as part of the data elements, are essential for fostering green technology innovation through sustainable resource management, optimization of green supply chains, and foundational models for addressing green growth concerns [
39]. When the data elements are fully utilized, enterprises can develop high-precision carbon emission prediction models to identify emission reduction bottlenecks, thereby facilitating the generation of patents for clean production processes, such as low-carbon metallurgical technologies. Such innovative processes contribute to reducing both carbon emissions (ΔTotal↓) and the carbon emission intensity (ΔIntensity↓) of high-energy-consuming production lines.
Data-driven smart manufacturing acts as a catalyst for green technology innovation by offering low-cost and efficient opportunities for sustainable development [
40]. Through big data analysis of Industrial Internet of Things (IIoT) data, enterprises can accurately identify pollution sources within the production chain, thereby enabling targeted research and development of pollution control technologies and related patents, such as the modification of cleaning equipment.
Internal innovation resources and external innovation networks are essential tools for digital transformation to promote the coordinated reduction in corporate carbon emissions and pollutant emissions [
41]. As green technology innovation advances, it exhibits a “U-shaped” pattern on total factor carbon emission efficiency [
42]. In addition, it also exerts a significant suppressing effect on the carbon emission intensity of enterprises [
43] and demonstrates a long-term negative impact on overall carbon dioxide emissions [
44]. In the near term, the synergistic development of green technology innovation and the increasing adoption of renewable energy are expected to become key drivers in reducing energy consumption [
45].
Another point is that capacity utilization and green technology innovation can “promote each other”. For example, when a high idle rate exposes energy efficiency shortcomings, it can trigger green technology research and development. At the same time, green processes can feed back to improve capacity utilization while optimizing the equipment load capacity. When both types of mechanism variables are effective, the probability of a company’s carbon emissions and carbon emission intensity decreasing at the same time will be greater; that is, the degree of dual control of corporate carbon emissions will be significantly improved. Therefore, this paper proposes the following research Hypothesis 3.
H3. Data elements can enhance the dual control of CO2 by improving capacity utilization and green technological innovation.
4. Results
4.1. Descriptive Statistical Analysis
Table 2 presents the descriptive statistics for key variables. For the dual control index (
COC), constructed as the negative average of standardized carbon emissions and intensity, the mean is zero by construction with a standard deviation of 0.842.
COC values range from −13.154 to 0.479, with quartiles increasing progressively (P25 = 0.031, median = 0.347, P75 = 0.401), indicating that while most firms exhibit an above-average dual-control performance, a minority show severe underperformance. Carbon emissions (
CE) display a highly right-skewed distribution, with a mean (66.028) substantially exceeding the median (5.288), suggesting that a few high-emission firms elevate the industry average. Carbon intensity (
CI) exhibits a similar pattern (mean = 0.442, median = 0.142), indicating that most firms outperform the average intensity level. Capacity utilization (
CU) is concentrated around relatively high levels, with a mean of 0.755 and a median of 0.758. Green technology innovation (
GREENTEC) is highly skewed: the mean is 2.388 with a standard deviation of 13.653, and the median is zero, indicating that while most firms file few green patents, a small number demonstrate exceptional innovative performance.
4.2. Results of Baseline Model
Based on the model specification outlined in Equation (2),
Table 3 reports the regression results estimating the impact of data elements (
DE) on the dual control of carbon emissions. Column (1) presents the effect of
DE on total carbon emissions (
CE). The estimated coefficient is negative and statistically significant at the 5% level (coefficient = −51.32,
p < 0.05), indicating that data elements contribute significantly to the reduction in firms’ absolute carbon emissions. Column (2) examines the effect on carbon emission intensity (
CI). The coefficient is also negative and statistically significant at the 1% level (coefficient = −0.118,
p < 0.01), suggesting that data elements effectively lower carbon emissions per unit of output. Column (3) reports the effect on the composite dual control index (
COC). The coefficient is positive and statistically significant at the 1% level (coefficient = 0.188,
p < 0.01), confirming that data elements substantially enhance firms’ overall dual-control performance. Taken together, these findings demonstrate that data elements facilitate both the reduction in absolute emissions and emission intensity, thereby strengthening the synergistic control of carbon emissions—a result that provides robust empirical support for Hypothesis 1.
To further explore whether the effect of data elements varies across industry types, we introduce an interaction term between DE and industry type (TYPE) in Column (4), where the Type is 1 for high-pollution industries and 0 for low-pollution industries. The coefficient on the interaction term DE ∗ TYPE is positive and statistically significant at the 1% level (coefficient = 0.635, p < 0.01), indicating that the positive impact of data elements on dual control is significantly more pronounced in high-pollution industries than in their low-pollution counterparts. This finding implies that high-pollution industries, which face greater environmental pressures and more stringent regulatory oversight, may possess stronger incentives to adopt digital technologies for emission abatement, thereby realizing larger marginal gains from data elements.
Columns (5) and (6) present the results of sub-sample regressions for high-pollution and low-pollution industries, respectively. In the high-pollution sub-sample (Column 5), the coefficient of DE on COC is positive and statistically significant at the 5% level (coefficient = 0.406, p < 0.05). In contrast, for the low-pollution sub-sample (Column 6), the coefficient is positive but lacks statistical significance. These results are consistent with the interaction term analysis, confirming that the emission-reducing effect of data elements is primarily concentrated in high-pollution industries. A plausible explanation is that high-pollution industries typically operate with lower initial levels of digitalization and higher emission baselines, leaving greater scope for improvement through digital transformation. Furthermore, these industries are subject to more rigorous environmental regulations, which may compel them to adopt data-driven technologies more aggressively to achieve compliance and realize cost efficiencies. Low-pollution industries, by comparison, may already operate closer to the technological frontier, thereby limiting the marginal impact of additional data elements on carbon performance.
In summary, the baseline regression results provide consistent evidence that data elements significantly enhance firms’ dual control of carbon emissions, with this effect being particularly pronounced in high-pollution industries. These findings lend strong support to Hypotheses 1 and 2.
4.3. Robustness Checks
Four methods are applied in robustness tests to validate the baseline regression results, namely employing the Double/Debiased Machine Learning (DDML) model, adopting an alternative measure of data elements, conducting endogeneity tests, and using a firm-level continuous pollution measure.
4.3.1. Double/Debiased Machine Learning Model
The fixed-effects model’s functional form is predicated on stringent assumptions, rendering it ill-equipped to address nonlinear connections among variables or high-dimensional data. Fortunately, machine learning techniques offer a superior solution to address the functional form constraints of conventional methods. Therefore, we use a Double/Debiased Machine Learning approach that combines machine learning and classical causal inference techniques for robustness testing.
The regression results of the Double/Debiased Machine Learning method, using the Python environment and the random forest algorithm, are presented in
Table 4. The regression coefficients for the key variables align with those in
Table 3 regarding direction and significance, demonstrating the robustness of the original finding.
4.3.2. Alternative Measurement of Data Elements
To assess the robustness of our baseline findings, we construct an alternative measure of data elements based on the number of sentences containing relevant keywords in each firm’s annual reports (denoted as
SDE). This approach mitigates concerns that simple word counts may overweight repetitive or boilerplate disclosures, as sentence-level aggregation better captures the substantive emphasis placed on digital technologies within corporate narratives. The same 60-keyword dictionary is applied, and
SDE is scaled by 1000 to maintain coefficient readability. The regression results are presented in
Table 5.
Re-estimating all specifications with SDE yields results that are fully consistent with the baseline. Specifically, SDE negatively and significantly affects CE (coefficient = −62.00, p < 0.1) and CI (coefficient = −0.206, p < 0.01), while positively and significantly affecting COC (coefficient = 0.281, p < 0.01). Sub-sample regressions further confirm that the effect is concentrated in high-pollution industries (coefficient = 0.617, p < 0.05) and statistically insignificant in low-pollution industries. These results align closely with the baseline estimates in terms of sign, significance, and heterogeneity, confirming that our core conclusions are robust to alternative measurement of data elements.
4.3.3. Endogeneity Test
Although the fixed-effect model with individual and time effects mitigates concerns related to omitted variable bias, it does not fully address potential endogeneity arising from reverse causality. Specifically, while data elements may influence the dual control of carbon emissions, firms with better carbon performance might also be more inclined to adopt digital technologies, leading to simultaneous determination. To address this concern, we employ an instrumental variable (IV) approach using two-stage least squares (2SLS) estimation.
Following existing studies [
52], we select three instrumental variables for
DE: (1) the provincial-level internet penetration rate, (2) the industry average of
DE, and (3) the one-period lagged value of
DE. The rationale for their selection is twofold. First, these variables are strongly correlated with a firm’s level of data element utilization: internet infrastructure facilitates digital technology adoption, industry peers’ digitalization reflects common technological trends, and past
DE is naturally correlated with its current value. Second, and more importantly, these variables satisfy the exclusion restriction by not directly affecting firms’ carbon emissions except through
DE. Specifically, internet penetration is an exogenous regional characteristic that influences firm-level digitalization but does not directly determine emission outcomes. The industry average
DE captures sector-wide digital trends that are exogenous to the individual firm’s emission decisions. The lagged
DE is predetermined and, after controlling for firm fixed effects and other covariates, should not directly influence current carbon emissions. The regression results are presented in
Table 6.
As shown in
Table 6, the coefficients of
DE on
CE,
CI, and
COC remain consistent with the baseline results in terms of sign and significance. Diagnostic tests confirm the validity of our instruments: the Anderson canonical correlation LM test rejects the null of under-identification, the Cragg–Donald Wald F statistic exceeds the critical value for weak instruments, and the Sargan test for overidentification is not rejected. These results provide further support for Hypotheses 1 and 2, confirming that our main findings are robust to endogeneity concerns.
4.3.4. Firm-Level Continuous Pollution Measure
The industry-level classification of high- versus low-pollution sectors may mask within-industry heterogeneity in firm-level pollution intensity. To address this concern, we employ firm-level continuous pollution data—specifically, each firm’s total pollution equivalent (the sum of air and water pollutant equivalents), denoted as
POLL—and conduct two additional tests. First, we introduce an interaction term between
DE and
POLL in the fixed-effects model. As shown in Column (1) of
Table 7, the coefficient on
DE ∗
POLL is positive and statistically significant at the 1% level (coefficient = 38.00,
p < 0.01), indicating that the positive effect of data elements on dual control strengthens as firms’ pollution levels increase.
Second, we divide firms into quintiles based on their average pollution level over the sample period and re-estimate the baseline model for each subgroup. The results, presented in Columns (2)–(6) of
Table 7, reveal a clear pattern:
DE exerts a positive and significant effect on
COC for firms in the top three pollution quintiles (
POLL_3,
POLL_4, and
POLL_5), while the effect is insignificant for those in the lowest two quintiles (
POLL_1 and
POLL_2). These findings corroborate the baseline heterogeneity results and confirm that the moderating role of pollution intensity is robust to using firm-level continuous measures, effectively addressing the concern regarding within-industry heterogeneity.
4.4. Mechanism Analysis
Section 2 proposes two channels through which data elements may enhance the dual control of carbon emissions: improving capacity utilization (
CU) and fostering green technology innovation (
GREENTEC). These mechanisms are theoretically grounded in recent frameworks: Hasanov et al. [
53] link productivity gains to emission intensity reductions, supporting the
CU channel, while Ou et al. [
54] demonstrate how technological innovation enables carbon savings through material substitution, underpinning the
GREENTEC channel. To empirically examine these mechanisms, we take
CU and
GREENTEC as dependent variables and estimate Equation (2). The results are presented in
Table 8.
Table 8 reveals several important findings. In the full sample, DE exerts a positive and statistically significant effect on both
CU (coefficient = 0.19,
p < 0.1) and
GREENTEC (coefficient = 3.32,
p < 0.01), indicating that data elements enhance dual control through both channels. This provides full support for Hypothesis 3.
However, this aggregate effect masks considerable heterogeneity across industry types. In high-pollution industries,
DE significantly improves
CU (coefficient = 1.283,
p < 0.05), but its effect on
GREENTEC is statistically insignificant. Conversely, in low-pollution industries, DE significantly promotes
GREENTEC (coefficient = 4.371,
p < 0.05), while its effect on
CU is insignificant. These patterns suggest that the mechanisms through which data elements operate are context-dependent: in high-pollution industries, data elements primarily facilitate emission reductions by optimizing production processes and improving capacity utilization, consistent with the efficiency-driven framework of Hasanov et al. [
53]; meanwhile, in low-pollution industries, they function mainly by stimulating green technology innovation, resonating with the innovation-led perspective of Ou et al. [
54].
These findings offer a more nuanced understanding of how data elements translate into carbon performance. The contrasting mechanism profiles between high- and low-pollution industries help reconcile the seemingly inconsistent patterns observed in earlier analyses and underscore the importance of considering industry heterogeneity when examining the channels of digitalization’s environmental impact.
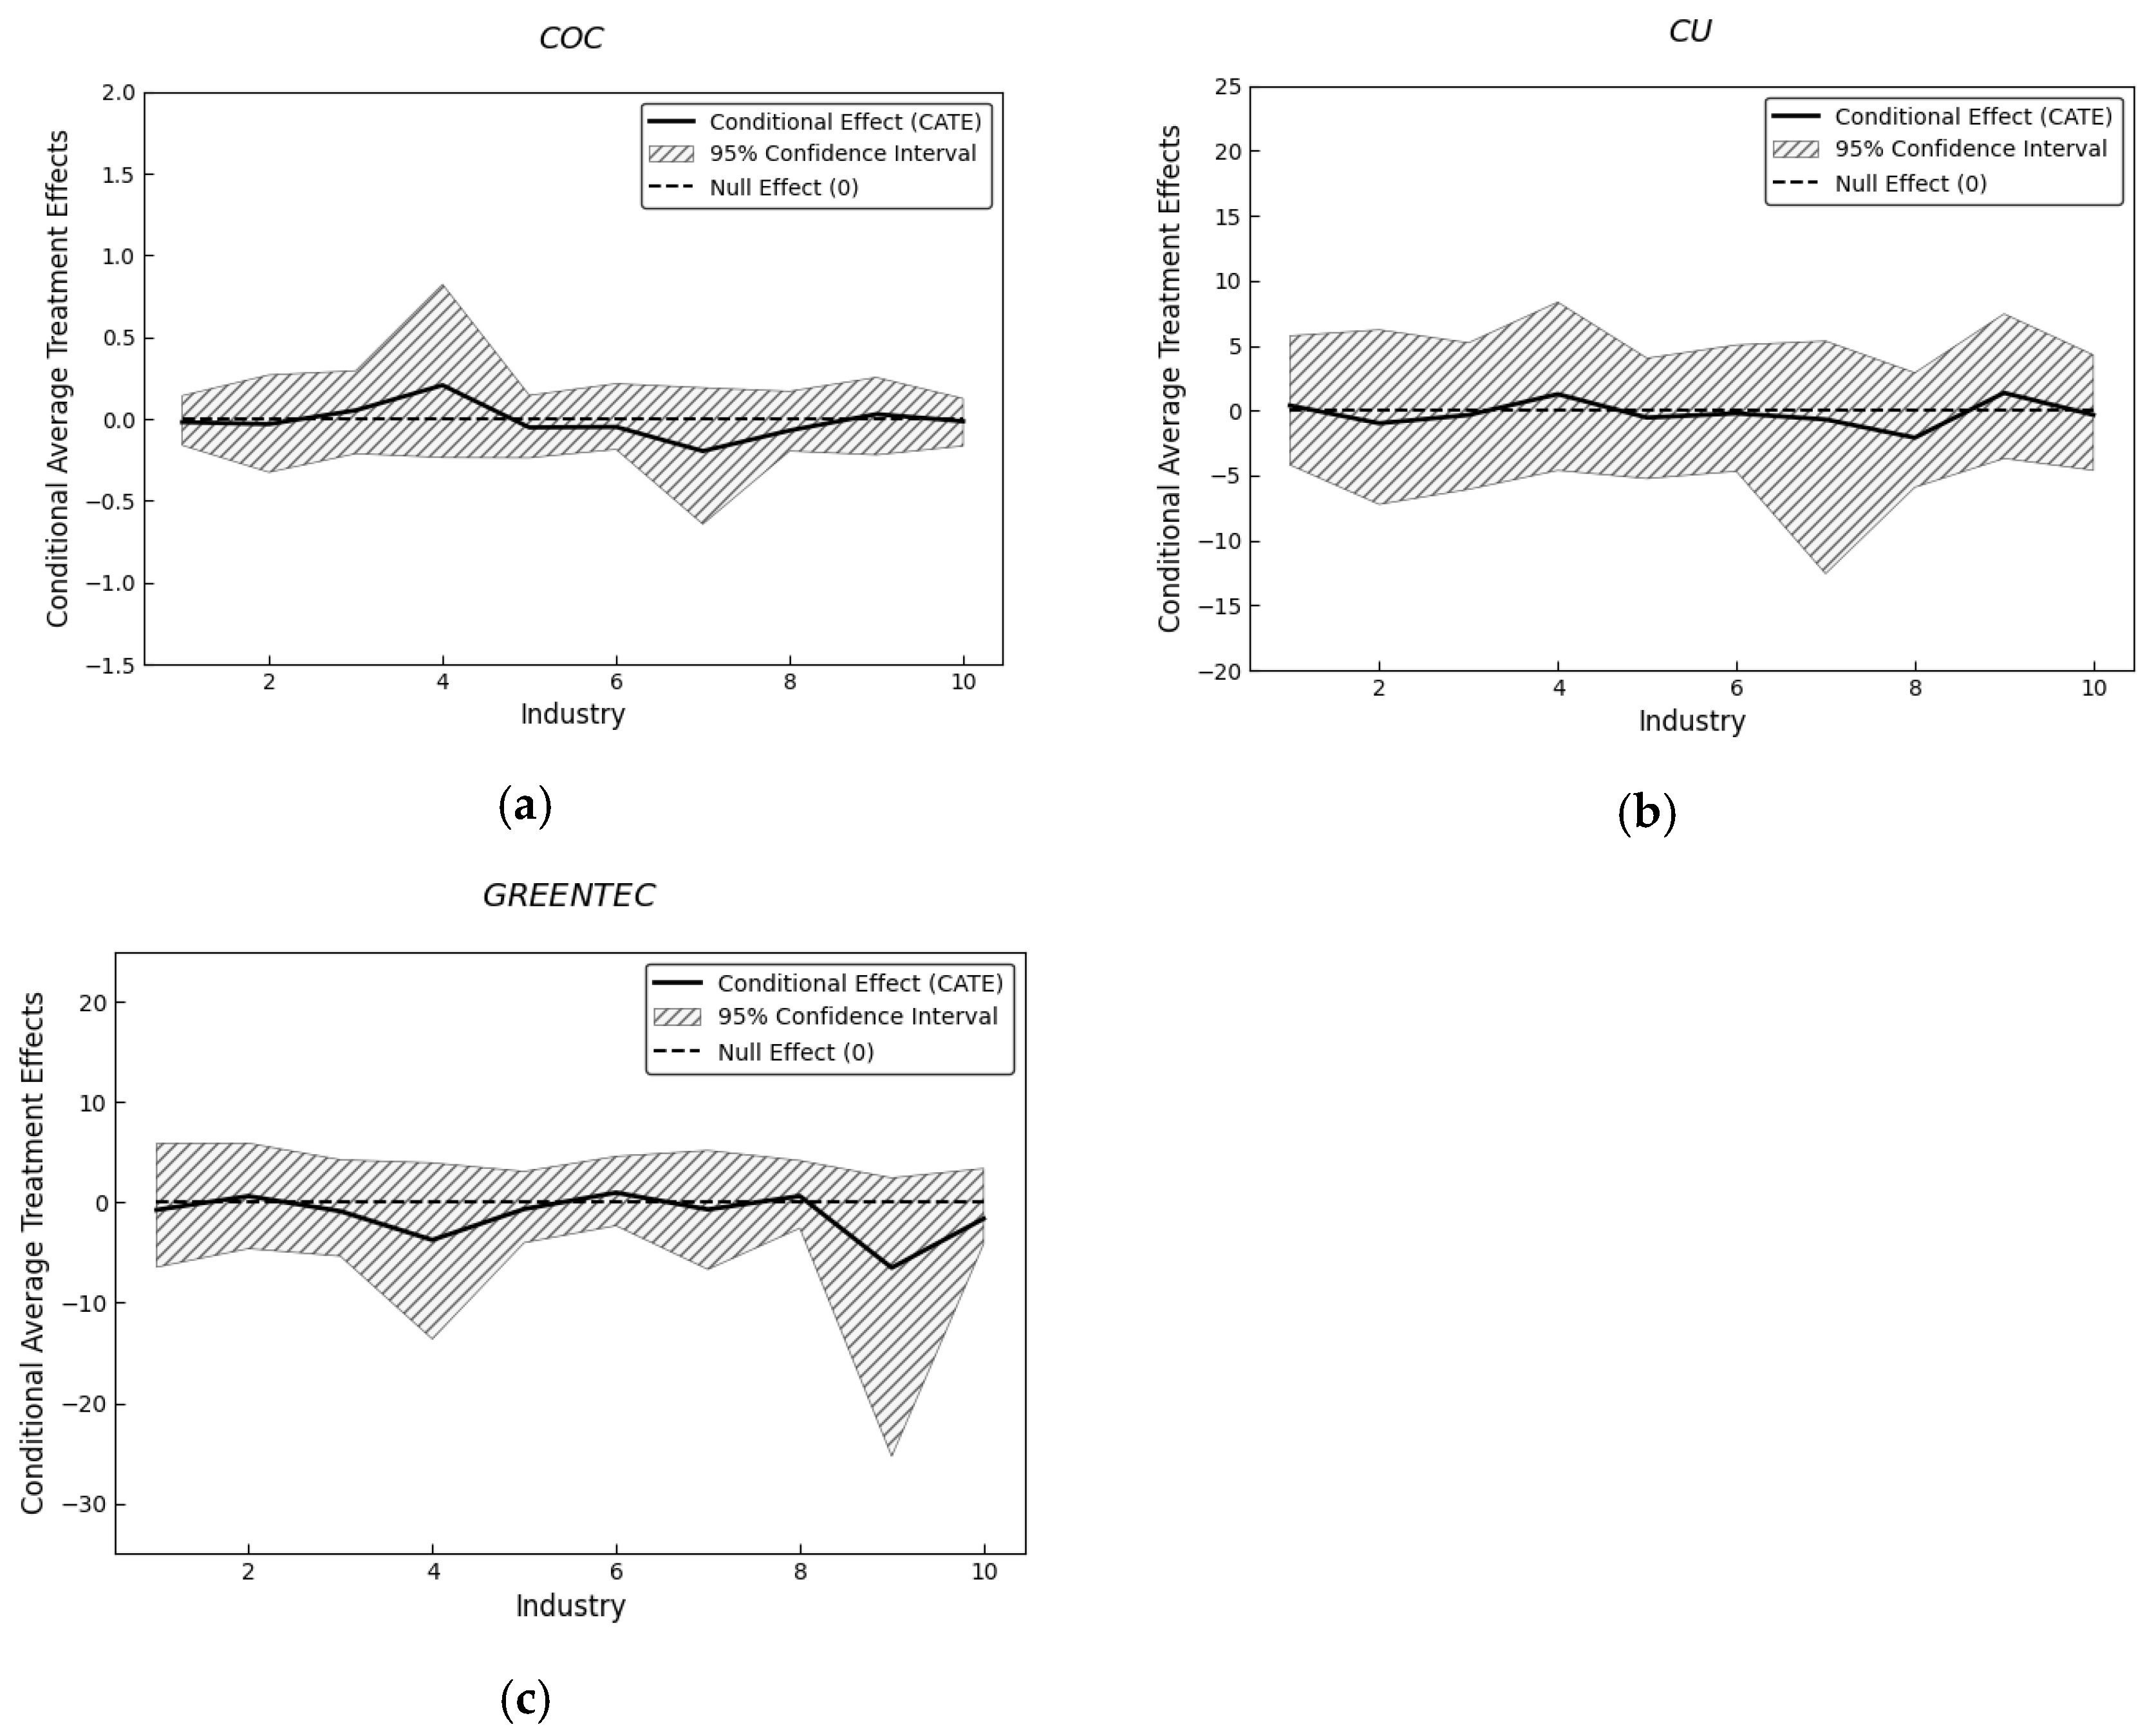
To further explore the nuanced industry heterogeneity underlying these aggregate patterns, we employ a causal forest model using the EconML package in Python (Version 3.12.4). This approach allows us to estimate the conditional average treatment effects (CATE) of
DE on
COC,
CU, and
GREENTEC across different industry categories, capturing the distribution of individual treatment effects within each industry. The results are presented in
Figure 2, where the red line denotes the baseline value of zero, the blue line represents the estimated CATE for each industry, and the blue shaded region delineates the interval between the 10th and 90th percentiles of individual treatment effects, encompassing 80% of firms within each industry. Industry classifications are detailed in
Table 1, with industries 1, 2, 6, 7, and 10 categorized as low-pollution, and industries 3, 4, 5, 8, and 9 as high-pollution.
Figure 2a presents the heterogeneous effects of
DE on
COC across industries. The results reveal that in Industry 4—which encompasses non-metallic mineral products, metal products, and ferrous and non-ferrous metal smelting and processing, all classified as high-pollution—the treatment effect is strongly positive and statistically significant. In contrast, Industry 7, comprising other manufacturing and comprehensive utilization of waste resources, exhibits a significantly negative treatment effect. This pattern corroborates our baseline finding that the positive impact of data elements on dual control is concentrated in high-pollution industries, while low-pollution industries may face different dynamics.
Figure 2b displays the heterogeneous effects of
DE on
CU. The treatment effects are significantly positive for Industry 4 and Industry 9 (wood processing and related products, a high-pollution sector), indicating that data elements have effectively enhanced capacity utilization in these industries. Conversely, Industries 2 (agricultural and sideline food processing, beverage and food manufacturing), 6 (textile, apparel, leather and related products), and 7 (other manufacturing and waste resource utilization)—all low-pollution—exhibit predominantly negative treatment effects. This suggests that capacity utilization in these low-pollution industries has yet to be fully activated by data elements. A plausible explanation lies in the structural characteristics of these industries: they often involve decentralized production processes, limited flexible management capabilities, and lower levels of information system integration, which hinder the rapid translation of data investments into improvements in capacity allocation efficiency. Consequently, these segments of low-pollution industries still possess substantial untapped potential for capacity optimization.
Figure 2c presents the heterogeneous effects of
DE on
GREENTEC. Notably, Industries 4 and 9 exhibit significantly negative treatment effects, indicating that data elements have not yet fostered green technology innovation in these sectors. By contrast, Industry 6 shows a significantly positive treatment effect. This pattern suggests that the green innovation benefits of data elements are currently concentrated in specific low-pollution industries, particularly those with lighter environmental footprints and greater agility in adopting new technologies. The negative effects observed in high-pollution industries may reflect structural barriers to green transformation, including long-standing reliance on resource-intensive development paths, weak innovation foundations, and fragmented R&D systems that impede the effective integration of data resources into green technology development.
Taken together, these findings offer a more nuanced understanding of how data elements translate into carbon performance across different industry contexts. The contrasting mechanism profiles between high- and low-pollution industries—with capacity utilization gains concentrated in the former and green innovation benefits in the latter—help reconcile the seemingly inconsistent patterns observed in earlier analyses and underscore the importance of considering industry heterogeneity when examining the channels of digitalization’s environmental impact. These results also carry important policy implications: fostering green digital transformation requires tailored strategies that account for the unique foundations and transformation challenges inherent to specific industries, thereby enhancing the substantive impact of data elements on the dual control of carbon emissions.
These results reveal a clear asymmetry. In high-pollution industries such as metal smelting and non-metallic mineral products, data elements enhance dual control primarily through improved capacity utilization. In low-pollution industries such as textiles, food processing, and waste resource utilization, they operate mainly via green technology innovation. This mechanism-based heterogeneity resolves apparent inconsistencies in prior findings and underscores the need for differentiated digital transformation strategies tailored to industry-specific pollution profiles.
4.5. Further Analysis
Although the preceding analysis establishes that data elements significantly enhance the dual control of carbon emissions, this aggregate effect masks considerable heterogeneity across industry types. Specifically, the positive impact is concentrated in high-pollution industries, while the effect in low-pollution industries remains statistically insignificant. Moreover, the underlying mechanisms exhibit a pronounced cross-industry asymmetry. Data elements effectively improve capacity utilization in high-pollution industries but fail to stimulate green technology innovation in these sectors. Conversely, they drive green technology innovation in low-pollution industries while leaving capacity utilization unchanged. This mechanism-based heterogeneity highlights the need to identify and evaluate moderating factors capable of amplifying the targeted impacts of data elements within each industry context. To this end, we propose two policy-related moderating mechanisms, namely strengthening ESG information disclosure systems and implementing green credit interest subsidy policies, and subject them to empirical scrutiny.
ESG information disclosure can systematically address the data fragmentation challenge prevalent in high-pollution industries by mandating standardized environmental reporting, thereby facilitating the integration of disparate data resources essential for green innovation. The “Green Credit Subsidy Policy” provides financial support by linking capital access to sustainability performance, potentially enabling data-driven capacity enhancements, particularly in sectors where such improvements remain unrealized.
4.5.1. ESG Information Disclosure System
ESG performance may serve as a critical moderating factor that amplifies the effectiveness of data elements in driving carbon dual control. Theoretically, ESG can strengthen the impact of data elements through three interrelated channels. First, from a governance perspective, strong ESG practices entail robust environmental management systems and board oversight, which facilitate the integration of data elements into corporate decision-making and ensure that digital investments are aligned with sustainability objectives. Second, from a financing perspective, firms with higher ESG ratings enjoy better access to green financing and lower capital costs, enabling them to secure the resources needed to implement data-driven emission reduction initiatives. Third, from an innovation perspective, ESG-oriented firms are more likely to embed environmental considerations into their R&D processes, creating synergies between data analytics capabilities and green technology development. Together, these channels suggest that ESG performance enhances the translation of data elements into tangible improvements in capacity utilization, green innovation, and ultimately carbon dual control.
To empirically examine this moderating effect, we construct an interaction term between
DE and
ESG, where
ESG is measured by the Huazheng ESG rating data for each firm from 2015 to 2022. We estimate the moderating effect model for the full sample as well as for high-pollution and low-pollution sub-samples. The results are presented in
Table 9.
Table 9 reveals several important patterns. In the full sample, the coefficients on
DE ∗
ESG are positive and statistically significant for
COC (coefficient = 0.305,
p < 0.01),
CU (coefficient = 5.796,
p < 0.01), and
GREENTEC (coefficient = 0.135,
p < 0.05). These results indicate that, on average, stronger ESG performance significantly enhances the positive effects of data elements on dual control, capacity utilization, and green innovation, consistent with the theoretical channels outlined above.
However, this aggregate effect masks substantial heterogeneity across industry types. In high-pollution industries, the moderating effect of ESG exhibits a dual pattern: DE ∗ ESG is negatively associated with CU but positively associated with GREENTEC. This suggests that in high-pollution sectors, ESG strengthens the green innovation channel of data elements while potentially weakening the capacity utilization channel. A plausible explanation is that stringent environmental disclosure requirements in these industries may divert managerial attention and resources toward compliance-driven green innovation at the expense of short-term operational efficiency gains. Moreover, high-pollution industries often face trade-offs between deep decarbonization investments and immediate production optimization, and ESG pressures may tilt the balance toward the former.
In low-pollution industries, by contrast, the moderating effects are uniformly positive. DE ∗ ESG is significantly positively associated with CU and GREENTEC. These findings indicate that in low-pollution sectors, ESG performance reinforces both channels through which data elements contribute to carbon reduction. Low-pollution industries typically operate with greater technological flexibility and face less regulatory stringency, allowing them to leverage ESG-driven governance improvements, green financing, and innovation synergies more effectively to enhance both capacity utilization and green innovation.
In sum, these results demonstrate that ESG performance positively moderates the impact of data elements on dual control of carbon emissions, with the specific pattern of moderation varying across industry contexts. The findings underscore the importance of considering ESG as a complementary mechanism that can amplify the environmental benefits of digital transformation, while also highlighting the need for industry-specific strategies in leveraging ESG to enhance data elements’ effectiveness.
4.5.2. Green Credit Interest Subsidy Policy
The green credit interest subsidy policy, implemented by over 16 provinces and 50 cities in China since 2017, serves as a financial instrument to facilitate green transformation. By reducing borrowing costs, it alleviates financing constraints for data-driven carbon reduction initiatives—particularly in high-pollution industries where upfront digital investments are substantial. Additionally, policy conditionality (e.g., emission reduction targets and data governance requirements) incentivizes firms to leverage data elements more effectively for energy monitoring, emissions management, and process optimization.
To examine this moderating effect, we construct a policy dummy variable,
GCI, indicating whether a firm is subject to the subsidy policy each year, and interact it with
DE. The results are presented in
Table 10. In the full sample,
DE ∗
GCI is positively and significantly associated with
COC (coefficient = 0.186,
p < 0.01) and
CU (coefficient = 2.393,
p < 0.01), but insignificant for
GREENTEC, suggesting the policy enhances data elements’ impact on overall dual control and capacity utilization, but not green innovation.
Substantial heterogeneity emerges across industry types. In high-pollution industries, DE ∗ GCI is positively and significantly associated with COC, CU, and GREENTEC. This indicates the policy amplifies all three channels in these sectors, likely because greater regulatory pressure makes them more responsive to policy incentives, reducing risk premiums for both operational efficiency and green innovation. In low-pollution industries, DE ∗ GCI is positively and significantly associated with COC and CU, but insignificant for GREENTEC. Here, the policy primarily strengthens capacity utilization by lowering financing thresholds for data-driven optimization, yet proves insufficient to activate the more resource-intensive green innovation channel.
These findings demonstrate that the green credit interest subsidy policy positively moderates the impact of data elements on carbon dual control, with effects concentrated across all channels in high-pollution industries but limited to capacity utilization in low-pollution sectors.
5. Discussion
This study investigates the role of data elements in enhancing enterprise-level carbon emission dual controls (emission intensity and total volume), with an emphasis on heterogeneity across high-pollution and low-pollution industries. Next, we place these insights in the context of the broader literature and show how this research contributes to the digital and green transformation of enterprises.
We introduce a dual-control indicator quantifying enterprises’ simultaneous reduction in total carbon emissions and carbon emission intensity, a composite metric that is absent from prior empirical frameworks. While the existing literature extensively analyzes carbon emissions or intensity separately, our integrated approach captures synergistic decarbonization dynamics critical to achieving net-zero transitions. Despite recognizing the conceptual need for multi-dimensional carbon governance (e.g., Zhang et al.’s [
14] “carbon reduction performance,” Ma et al.’s [
28] “synergistic energy-carbon management”), few studies operationalize dual-control rigor. By applying this index, we reveal that data elements significantly reduce total emissions and emission intensity simultaneously, a synergistic effect that unitary indicators in the existing literature fail to capture.
We find that the impact of data elements on dual carbon control varies significantly by industry. Specifically, they enhance such control in high-pollution industries but exhibit no significant effect in low-pollution ones, a result that diverges notably from prior research. Most literature implicitly assumes homogeneous impacts or focuses on aggregated data, overlooking sectoral differences. For instance, studies like Shang et al. [
9] and Huang et al. [
22] demonstrate that digital transformation uniformly reduces emissions through efficiency gains, but they analyze datasets pooled across industries without stratifying by pollution levels. Similarly, Zhang et al. [
55] leverage digital infrastructure data to show carbon intensity reduction, yet emphasize city-level effects without distinguishing high-pollution industries like manufacturing or mining. This aggregate approach is echoed in other works, such as Cheng et al. [
26], which quantifies a U-shaped relationship for the digital economy’s influence on emissions but lacks firm-level pollution granularity. Our heterogeneous impact model challenges these broad-brush claims by revealing that the benefits of data elements are concentrated in high-pollution sectors, a nuance that remains invisible to aggregate analyses.
The concentration of positive effects in high-pollution industries finds indirect parallels in the literature, suggesting that sectors with higher emission baselines and greater environmental pressure possess larger room for improvement. Articles like that from Wang et al. [
56] allude to digital technology’s potential by noting that emissions-heavy sectors stand to gain more from efficiency-oriented digital investments. However, few studies have provided direct empirical evidence that dual controls are strengthened specifically in high-pollution firms. Our research fills this gap by validating significant heterogeneity across pollution types and identifying the specific industries driving these effects, namely metallurgy and mineral products in high-pollution sectors and other manufacturing and waste resource utilization as the source of null results in low-pollution sectors.
Crucially, our mechanism analysis reveals that capacity utilization and green technology innovation serve as distinct transmission channels across industry contexts. In high-pollution industries, data elements enhance dual control primarily through improved capacity utilization, particularly in metallurgy, mineral products, and wood processing sectors. This finding bridges a gap in the literature: while studies like Wang et al. [
48] indirectly allude to scale adjustments through resource optimization, they do not explicitly quantify capacity utilization as a strategy. Similarly, Hu [
3] and Liu et al. [
57] assess industrial restructuring for emission control but remain macro-focused, with no mention of data-triggered capacity effects. In low-pollution industries, data elements operate mainly through green technology innovation, with significant effects concentrated in agro-processing and textile industries. This channel resonates with digital decoupling theories in papers like that of Liu et al. [
27] but has rarely been empirically validated at the firm level with industry-specific granularity.
Our proposal for stronger ESG disclosure and the Green Credit Interest Subsidy Policy as compensatory moderators offers a unique, dual-focus application for manufacturing firms. We find that both mechanisms amplify the impact of data elements on dual control and help mitigate industry heterogeneity, though with notable limitations: ESG disclosure does not significantly strengthen effects in low-pollution industries, while the green credit policy exhibits limited efficacy in activating green innovation. This builds on but extends findings like those in Zhang et al. [
14], which emphasize the need for “digital governance” to optimize emission outcomes. By demonstrating specific moderating effects and their boundary conditions, particularly that ESG disclosure enforces accountability primarily in high-pollution contexts, we address a gap where prior research often treats these mechanisms as uniformly effective.
This study has several limitations. First, the sample is confined to listed manufacturing firms, so the findings should be generalized cautiously. Second, our carbon emissions data from CSMAR are estimated using the emission factor method, which captures firms’ directly controllable emissions but does not fully account for indirect emissions from supply chains. Future research with more granular data could further examine these indirect channels. Third, the mechanism analysis lacks micro-level production chain evidence. Finally, our policy adjustment does not fully account for strategic interactions between financial institutions and firms. Addressing these limitations offers avenues for subsequent research.
6. Conclusions
This paper investigates the impact of data elements on the dual control of carbon emissions using panel data from 1235 listed manufacturing firms in China over the 2015–2022 period. The main findings are as follows.
First, data elements significantly reduce both total carbon emissions and emission intensity, thereby enhancing firms’ overall dual-control performance. However, this effect exhibits pronounced industry heterogeneity: data elements substantially improve dual control in high-pollution industries, yet show no significant impact in low-pollution industries. Specifically, the positive effect in high-pollution sectors is driven primarily by metallurgy and mineral products industries, while the null result in low-pollution sectors is largely attributable to other manufacturing and waste resource utilization industries, where data elements exert a negative influence.
Second, capacity utilization and green technology innovation serve as key mediating mechanisms, but their roles differ fundamentally across industry contexts. In high-pollution industries, data elements enhance dual control mainly through improved capacity utilization, particularly in metallurgy, mineral products, and wood processing industries. In low-pollution industries, data elements operate primarily through green technology innovation, with significant effects concentrated in agro-processing and textile industries. The insignificance of green innovation in high-pollution industries mainly stems from metallurgy, mineral products, and wood processing sectors, while the failure of capacity utilization in low-pollution sectors mainly originates from agro-processing, textile, and other manufacturing industries.
Third, both ESG disclosure and the Green Credit Interest Subsidy Policy serve as effective moderators that amplify the impact of data elements on dual control and help mitigate industry heterogeneity. However, notable limitations remain: ESG disclosure does not significantly strengthen the effect of data elements in low-pollution industries, while the green credit policy exhibits limited efficacy in activating the green innovation channel.
These findings carry important policy implications. Given the pronounced industry heterogeneity documented above, policymakers should move beyond uniform approaches and adopt differentiated strategies tailored to the specific constraints and opportunities of each industry type.
For high-pollution industries, policy priority should be given to removing structural barriers that impede the translation of data elements into green innovation. The negative innovation effects observed in Industry 4 and Industry 9 suggest that these sectors face deep-seated technological lock-in and resource-intensive path dependencies. To address this, governments should establish industry-specific data-sharing platforms that consolidate energy consumption, production processes, and emission data across supply chains. Such platforms can help firms identify efficiency gaps and innovation opportunities, thereby overcoming production rigidity and technological inertia. Additionally, tax credit policies should be designed to incentivize investment in data-enabled fundamental green technologies—such as digital modeling of carbon capture processes—particularly in sectors where innovation lags despite capacity utilization gains.
For low-pollution industries, the primary challenge lies in activating the capacity utilization channel. The insignificance of capacity utilization in Industries 2, 6, and 7 indicates that these sectors lack the infrastructure or incentives to leverage data for operational efficiency. Policymakers should introduce mandatory capacity utilization monitoring standards, requiring industrial IoT platforms to integrate equipment operation data and energy efficiency metrics. This would enable precision diagnostics through data fusion analytics, helping firms identify underutilized capacity and optimize production scheduling. Concurrently, efforts to strengthen the green innovation channel in low-pollution industries should focus on expanding technology markets and accelerating the commercialization of green patents, particularly in Industry 2 and Industry 6, where innovation effects are already pronounced.
Regarding the moderating mechanisms, the limitations of ESG disclosure and green credit policy point to specific areas for refinement. For ESG disclosure, the insignificant moderating effect in low-pollution industries suggests that current disclosure frameworks may not adequately capture data-driven environmental improvements in these sectors. Regulators should consider enhancing ESG rating methodologies to better recognize the role of digitalization in achieving incremental environmental gains. For the Green Credit Interest Subsidy Policy, its failure to activate green innovation channels—particularly in high-pollution industries—indicates a need for more targeted design. Subsidy criteria should be expanded to explicitly reward data-driven innovation investments, such as AI-enabled emission monitoring systems or digital twins for process optimization, rather than focusing solely on output-based emission reductions.
In summary, realizing the full potential of data elements for carbon dual control requires a nuanced, industry-specific policy approach that addresses heterogeneous constraints, leverages mediating mechanisms, and refines moderating instruments accordingly.