Article

Modeling User Requirement for Value-Oriented Design: A Multi-Dimensional Perception Evidence from the Automobile Market


1
School of Design, Hunan University, Changsha 410082, China
2
College of Mechanical and Vehicle Engineering, Hunan University, Changsha 410082, China
3
State Key Laboratory of Advanced Design and Manufacturing for Vehicle Body, Hunan University, Changsha 410082, China
4
Institute of Culture and Media Computing, Hunan University, Changsha 410082, China
*
Author to whom correspondence should be addressed.
Systems 2026, 14(3), 251; https://doi.org/10.3390/systems14030251
Submission received: 23 January 2026 / Revised: 20 February 2026 / Accepted: 25 February 2026 / Published: 28 February 2026
(This article belongs to the Section Systems Practice in Social Science)

Abstract

Aligning system design with evolving user expectations remains a critical challenge in contemporary digital markets. While online reviews offer vast potential for informing product development, transforming unstructured feedback into actionable system intelligence requires rigorous analytical frameworks. This study proposes a unified framework that synthesizes topic-related text analysis, sentiment analysis, and time-series trends to model user requirements as indicators of multidimensional system value. Based on this framework, we introduce the Product Online User Perception Score to quantify user perception of product attributes through the integration of attention, discussion richness, and sentiment. Crucially, a User Requirement Value model is developed to assess the strategic priority of requirements. The model applies a discussion richness dimension to filter superficial noise and employs a reverse valuation mechanism to identify systematic gaps between high attention and low satisfaction. Comparative evidence from the Chinese automotive market highlights the evolution of user needs during the transition from fuel-powered to new energy vehicles. While manufacturers prioritize enterprise-centric intelligent features, user dissatisfaction is systematically concentrated on basic ergonomic deficits, revealing that foundational operational value remains a prerequisite for overall system success. This study shifts the analytical paradigm from descriptive monitoring to diagnostic system valuation, providing a measurable and diagnostic instrument for supporting evidence-based product iteration.

1. Introduction

User requirements constitute a critical foundation for product innovation, resource allocation, and strategic decision making. In particular, in the field of systems engineering, the ultimate objective of design is shifting from identifying static requirements to creating multidimensional system value. Value extends beyond economic and technical factors to embrace the multifaceted sociotechnical ecosystem, necessitating a holistic view of how users perceive and experience products [1]. In contemporary digital markets, an increasing share of user requirements is articulated through large volumes of online user expressions, such as evaluations, discussions, and experience sharing [2]. The continuous stream of data represents a dynamic feedback loop, enabling manufacturers to engage in value co-creation with end-users within an open innovation ecosystem [3]. Such user-generated content provides timely, dynamic, and large-scale insights into how products are experienced in real world usage scenarios, offering significant opportunities for understanding evolving user needs beyond the scope of conventional elicitation methods [4]. At the same time, the dispersed, unstructured, and continuously changing nature of such expressions makes it challenging to systematically identify, compare, and prioritize user requirements in ways that are both analytically rigorous and practically applicable to product development. Addressing this challenge is essential for organizations seeking to translate abundant user expressions into actionable design guidance for precise experience optimization.
The automotive industry provides a representative context in which these challenges become particularly salient. The ongoing transition from fuel-powered vehicles (FPVs) to new-energy vehicles (NEVs) has fundamentally reshaped product technologies, usage conditions, and user expectations. Beyond traditional concerns related to performance, reliability, and comfort, users increasingly express diverse and sometimes competing requirements associated with driving range [5], charging convenience, sustainability [6], intelligent functions [7], and digital services [8]. These requirements are not only numerous but also unevenly articulated across user groups and usage scenarios. For manufacturers, the ability to systematically assess the relative value of such requirements is crucial for guiding product strategy, prioritizing design resources, and maintaining user trust during periods of technological transition. However, existing approaches often struggle to translate large volumes of fragmented user expressions into structured representations that can directly inform product design decisions.
The growing availability of online user expressions offers new opportunities to address these challenges. Online reviews and related user-generated contents capture spontaneous evaluations, experiential feedback, and implicit expectations [9] that are difficult to elicit through structured research surveys [10]. At scale, such data enable the observation of emerging pain points, shifting priorities, and patterns of dissatisfaction across different product attributes [11]. Existing methods typically rely on frequency counts designated as user attention or simple sentiment scores. However, these metrics are often isolated and fail to capture the information richness of user feedback, treating a simple mention the same as a detailed review. Furthermore, current approaches rarely quantify the discrepancy between attention and satisfaction. Without a systematic way to measure this gap, it remains difficult to distinguish urgent pain points from general product features, limiting the ability to prioritize design resources effectively.
Motivated by these limitations, this study proposes a quantitative modeling approach for user requirements that integrates multi-dimensional user perception data. By systematically incorporating perceptual information across behavioral, emotional, and cognitive dimensions, we construct an analytical framework that bridges the gap between fragmented user expressions and strategic design prioritization. Within this framework, requirement value is no longer treated as a singular or static indicator; instead, it is conceptualized as a composite construct emerging from the dynamic interplay of user behavior, affective response, and cognitive evaluation. In doing so, the study advances a structured pathway for translating perceptual evidence into actionable design decisions. In summary, this research makes three primary contributions:
  • We propose a multi-dimensional Product Online User Perception Score (POUPS). By introducing a “Discussion Richness” (R) dimension alongside Attention (S) and Sentiment (F), our model captures the complexity of user-perceived system value, overcoming the limitations of traditional methods that rely solely on frequency or sentiment polarity.
  • We develop a reverse valuation mechanism for User Requirement Value (URV). Instead of treating high satisfaction as the goal, our model assigns higher value to requirements that exhibit high user attention but low satisfaction. This logic systematically quantifies the gap between user expectations and actual experience to prioritize design improvements.
  • We provide a measurable foundation for user-centered product iteration. Through a case study of the Chinese automobile market, we demonstrate how integrating these perceptual dimensions enables the quantifiable prioritization of dispersed user requirements, transforming unstructured feedback into actionable design indices.
The remainder of this paper is structured as follows: Section 2 discusses related work and identifies the research gap. Section 3 details the construction of the POUPS model and URV. Section 4 validates our method using data from the Chinese automobile market. Finally, Section 5 summarizes the implications and limitations of our research.

2. Literature Review

The exponential growth of user-generated content has fundamentally transformed requirement elicitation from a structured hypothesis-driven process into an unstructured data-driven exploration [12]. The challenge of analyzing user requirements is further amplified by their dynamic nature. User requirements are not static or uniformly expressed, but rather continuously evolve as products, technologies, and usage contexts change. Dynamic requirements refer to the continuous evolution of user expectations for product performance, functionality, interaction quality, features, and overall experience over time and across usage scenarios [13]. This dynamic characteristic is especially evident in industries undergoing rapid technological transformation, where new product attributes, usage scenarios, and value propositions emerge alongside existing expectations. As a result, organizations must not only identify what users express at a given moment but also understand how different requirements gain or lose importance over time and how they interact across multiple dimensions of user experience. Conventional requirement elicitation approaches, such as interviews, questionnaires, focus groups, and user observation, remain valuable for capturing in depth qualitative insights, but they are often limited in scale, frequency, and temporal sensitivity [14,15]. These limitations make it difficult to support continuous product iteration and comparative feature evaluation in fast-evolving market environments.
Researchers have also explored big data-driven solutions to address these challenges, among which textual analytics has emerged as a foundational methodological approach. By leveraging computational techniques such as Naïve Bayes, support vector machines, TF-IDF, and TextRank, scholars have sought to directly analyze large-scale textual data to identify user needs [16]. Early computational approaches primarily relied on keyword frequency or term frequency–inverse document frequency to identify user interests [17]. The underlying assumption was that frequently mentioned attributes represented the most critical user needs. While effective for capturing explicit topics, these frequency-based methods often fail to account for the semantic context of user expressions, leading to fragmented insights. To address this limitation, recent scholarship has increasingly adopted probabilistic topic modeling, such as Latent Dirichlet Allocation (LDA) [18], BERT modeling [19] and deep learning-based embeddings [20] to aggregate dispersed keywords into coherent semantic themes. These techniques enable researchers to map the latent structure of user requirements across diverse domains, ranging from sustainable design [21] to epidemiology [22], providing a scalable alternative to traditional qualitative coding.
However, accurately identifying what users are discussing is only the first step. A critical challenge lies in determining the quality and depth of these discussions. As noted by Visser [23], different forms of data collection led to varying depths of user experience insights. Most existing frameworks treat user attention as a unidimensional metric derived solely from mention counts. This approach creates a bias towards popularity, where a superficial mention in a short comment is weighted equally to a detailed review. In consumer psychology, the depth of elaboration is a key indicator of cognitive involvement and feedback quality. Yet, current quantitative models rarely incorporate the dimension of information richness, which reflects the semantic density and complexity of user feedback. The lack of such a metric results in analytical models that are sensitive to noise, potentially obscuring substantively rich requirements that offer deeper design guidance [24].
Furthermore, the translation of user requirement into product development value remains a contentious area in design research. Sentiment analysis is widely used to gauge user satisfaction [25], and recent studies have combined it with the topic model [26], large language models [27], quality methods like Kano [28], QFD [29], hierarchical clustering [30] and Grounded theory [31] to categorize requirements into functional levels. Models such as Kano have been employed to structure requirements and translate them into actionable design improvements [32]. While recent works have illustrated how tracking temporal changes in user perceptions can inform adaptive product development, few frameworks have operationalized a reverse valuation logic into a mathematical model. There remains a gap in quantifying the specific discrepancy between high attention and low satisfaction, which is essential for pinpointing urgent pain points that require immediate design intervention.
This analytical gap is particularly acute in the automotive industry, which is undergoing a paradigm shift towards intelligent and electric mobility. While numerous studies have examined macro-level adoption factors for new energy vehicles [33], there is a paucity of research that quantifies micro-level experiential requirements. Social media analytics has already revealed how consumers interpret new model designs [34], yet existing approaches typically present attention and sentiment as isolated metrics. These discussions capture real-world product experiences and implicit requirements that are often difficult to elicit through structured questioning [35,36]. Consequently, manufacturers struggle to prioritize conflicting requirements. This study addresses these limitations by proposing the Product Online User Perception Score, a multi-dimensional model that integrates behavioral attention, cognitive richness, and affective sentiment to provide a quantifiable foundation for precise product iteration.

3. Methods

This study integrates interdisciplinary analytical methods from statistics, social sciences, and computer science to analyze large-scale user-generated data, including social media posts and online reviews. These methods were employed to extract user requirements, analyze user behavior patterns, and examine consumers’ overall evaluations of existing products, as well as the evolving trends of user requirements across different product attributes.

3.1. Data Mining

3.1.1. Topic Modeling

Semantic keyword extraction was conducted using BERT embeddings. Sentence-level embeddings were generated for each user comment, and semantic similarity was computed to identify representative keywords and product features. Extracted features were stored with their contextual sentences for subsequent sentiment and topic analysis. LDA was applied to extract latent themes from the corpus. For each topic, the top keywords and representative user comments were identified. This study followed the method proposed by Brzustewicz and Singh [37], selecting the number of topics based on the topic perplexity index. A lower perplexity index indicates a better model fit. LDA is used to establish a corpus-level topic layer that serves as the macro discourse context. Subsequent sentiment analysis and time series modeling are conducted at the attribute level and are organized under this topic layer through explicit mapping rules described in Section 3.3.

3.1.2. Sentiment Analysis

Aspect-based sentiment analysis was conducted using a fine-tuned BERT model released by IDEA CCNL and made available via Hugging Face [38]. The model was trained on eight Chinese sentiment analysis benchmarks and achieved an accuracy of 97.31%. It has been widely adopted in prior studies analyzing Chinese social media corpora [39]. For each identified product feature, sentiment polarity was classified as positive, neutral, or negative. This allowed for the identification of feature-specific emotional tendencies, enabling a more precise mapping between design attributes and user sentiment. The sentiment results were aggregated at the topic level to reveal the overall emotional profile of each UX dimension.

3.1.3. Time Series Model

Time series data were used to capture the dynamic characteristics of user perceptions over time. Changes in users’ emotional orientation and engagement with product attributes were reflected through variations in attention frequency, positive sentiment, and negative sentiment. A higher frequency of attribute mentions indicates greater user attention to that attribute. Changes in sentiment values reflect shifts in users’ evaluations of product attributes over time. In this study, the Mann–Kendall trend test was applied to analyze temporal trends in user attention and sentiment associated with product attributes [40,41]. This method is suitable for detecting monotonic increasing or decreasing trends in time series data.

3.2. Quantitative Evaluation of User Perception

We proposed that the value of user requirements is not determined by a single variable but results from the combined effects of multiple user experience factors. Among these factors, user perception serves as the foundation, while user attention and user satisfaction are two direct influencing variables that jointly affect the evaluation of requirement value. This study introduces the Product Online User Perception Score (POUPS) to quantify users’ perception of a product. The primary objective of POUPS is to integrate user requirement mining techniques to accurately identify core user requirements and quantify them in a measurable manner. The selection of specific product attributes for POUPS analysis is evidence-based, targeting keywords that exhibit both high prevalence within their latent clusters and significant growth trends identified in the preceding time series modeling. The POUPS for a specific brand is calculated using the following formula:
POUPSi = α1Si * α2Ri * α3Fi
In Equation (1), Si represents the discussion intensity of users regarding a specific product attribute. Its value is derived from online text data related to the product and reflects the level of user engagement with that attribute. Fi denotes favorability, which measures the emotional tendency users display toward the product attribute, determined through sentiment analysis. Ri indicates richness, representing the diversity of topics associated with the attribute and reflecting the complexity of user needs in that dimension. The coefficients α1, α2, and α3 are scaling coefficients used to integrate the three normalized dimensions through logarithmic transformation.
The value Si of is obtained by counting the frequency of the i-th product attribute’s occurrence in user-generated content, representing the intensity of user engagement with that attribute. The Ri value is computed using a vector space model to measure the semantic similarity between the attribute and other keywords. Keywords with high similarity scores are selected to form an extended discussion set closely related to the attribute. To ensure that discussion richness Ri captures cognitive depth rather than linguistic redundancy, a rigorous semantic filtering mechanism is applied during the construction of the extended word set. Only keywords with a cosine similarity exceeding 0.8 within the BERT vector space are included in the calculation. A high Ri value signifies that users have employed a diverse and semantically aligned vocabulary to describe specific attributes, which typically reflects higher cognitive involvement and information density. This refinement ensures that Ri serves as a reliable proxy for information density. The total frequency of these similar terms is then used to derive Ri, indicating the diversity and complexity of user requirements. The Fi value is obtained through sentiment analysis, which evaluates users’ emotional tendencies in the text to determine the favorability associated with the product attribute.
Since the original dimensions and value distributions of Si, Ri, and Fi differ considerably, a normalization strategy combining logarithmic compression and linear mapping was introduced to eliminate dimensional effects, enhance comparability, and prevent any single dimension from dominating the overall evaluation. This approach effectively preserves feature characteristics and scales numerical values. When Ri or Fi exhibit extremely high values, the logarithmic transformation helps prevent overamplification. By integrating the three dimensions of user attention, sentiment, and demand complexity, this formula establishes a text-based product perception metric with strong scientific validity and scalability. This multi-dimensional structure also aligns with the holistic perspective of system value [1], ensuring that both the operational relevance and emotional experience of the system are captured.
The multiplicative formulation in Equation (1) is adopted as a modeling choice to operationalize multidimensional user perception at the aggregated corpus level. Within this framework, attention, discussion richness, and favorability are treated as interacting components in a unified valuation structure. The multiplicative aggregation introduces a conservative integration mechanism in which low performance in one dimension proportionally reduces the composite perception score. It should be noted that this structure is not intended as a direct representation of individual-level perceptual formation, but rather as an operational proxy for large-scale text-based perception analysis. To assess the robustness of this aggregation strategy, a comparative analysis with a linear additive formulation was conducted on a random sample of 1000 user comments. The comparison indicated broadly consistent ranking patterns across aggregation strategies, while revealing differences in score dispersion. In addition, a 20% perturbation test was applied to the scaling coefficients α1, α2, and α3. The prioritization results remained stable under these variations.

3.3. Quantitative Evaluation of User Requirement Value

This study proposes a user requirement value assessment method that systematically evaluates the value level of various product requirement attributes by integrating user perception performance with corporate strategic objectives through three main steps.
Step 1: Identify key requirement attributes by combining demand growth trends with brand positioning. To ensure the objectivity of the analysis and avoid circular dependency, the candidate requirement set is not pre-selected but emerges from a multi-stage discovery funnel that integrates topic modeling and time-series trend analysis. Based on the previous analysis and the demand trend forecast results from the time-series model, core requirements with strong user expectations and high growth potential are identified. Corporate brand positioning and strategic objectives are introduced as a final alignment filter to select key attributes that are consistent with the differentiated competitive strategy of the brand.
Step 2: Quantitatively calculate the user perception values of key requirement attributes. After identifying the key attributes, the user perception values of these requirements are quantified. According to the ranking of quantitative perception values, attributes with lower user perception should receive more focused attention. Each attribute is systematically mapped to its corresponding LDA topic based on the maximum probability loading rule where the attribute is assigned to the cluster where it exhibits the highest statistical probability loading.
Step 3: Evaluate and categorize requirement value based on user perception performance. Based on the quantified perception values, a systematic evaluation and classification of user requirement value are conducted using a perception reverse mapping and emotion-weighted attention mechanism.
In accordance with the characteristics of Chinese natural language expression, a keyword-based method is established to extract user requirements, focusing on authentic user-generated content that expresses emotional experiences related to specific product functions or service features, such as evaluations and suggestions. For example, expressions like “I want,” “I hope,” and “I expect” are categorized as requirement indicators since they directly reflect users’ intentions and expectations. When analyzing user pain points, if the probability of negative emotion exceeds that of positive and neutral emotions, the text is labeled as negative, representing a user pain point. After the initial screening of user requirement and pain-point texts, their large volume makes it difficult for researchers to effectively identify and interpret them. To address this challenge and to enable a clearer assessment of user requirement value, this study integrates three core factors, namely user perception performance (Pi), attention weight (Wi), and emotional tendency (Ei), to systematically measure the potential value of user requirements. The analytical workflow is governed by a hierarchical inheritance logic where attribute i inherits the weight Wi of the topic cluster to which it belongs. The calculation model is as follows:
URVi = Pi * Wi * Ei
where i denotes the i-th product attribute. Equation (3) represents the reverse mapping logic that “the poorer the user experience, the higher the requirement value.” When a specific attribute shows a lower perception score in user feedback, it indicates that the current function does not meet user expectations and has potential for optimization. Therefore, a higher Pi value reflects a higher requirement value. As detailed in the previous section, the discussion intensity Si and richness Ri serve as threshold gatekeepers. If a requirement arises only from minor extreme user complaints or semantic noise, its Si and Ri values remain low, which prevents the resulting perception score from generating a high URV regardless of the Pi value. This non-compensatory evaluation ensures that the model captures genuine systemic design bottlenecks rather than stochastic outliers or naturally negative attributes.
Pi = maxj (POUPSj)/(POUPSi + ε)
where j represents all product attributes, and ε is a small constant introduced to avoid division by zero. In addition, to ensure consistency between the evaluation results and the enterprise’s strategic objectives, the model calculates perception scores only for the key attributes identified through demand growth trends and brand positioning in the preliminary stage.
Wi represents the degree of user attention to each topic clusters and can be calculated using the following formula:
W i   =   U i k = 1 M U k
In Equation (4), M represents the total number of topics in the dataset. Ui denotes the number of times the i-th topic is mentioned by users, while Uk is used as an index to sum the mention counts across all topics. By calculating the proportion of each topic’s mention count to the total number of mentions, this formula accurately determines the degree of user attention to each topic. In online user texts, a higher frequency of mentions of a product attribute indicates that users attach greater importance to the performance of that attribute, thus reflecting a higher level of attention.
Ei represents the emotional contribution, which is obtained from sentiment analysis applied to each piece of text and reflects the user’s emotional tendency toward the corresponding topic. For negative sentiment, the emotional contribution is transformed as (1 − Ei). When the sentiment is positive or neutral, Ei is directly used for subsequent computations. The magnitude of the sentiment intensity intuitively reflects the degree of user satisfaction with the product feature.

4. Case Study

4.1. Automotive User Requirements Research Background

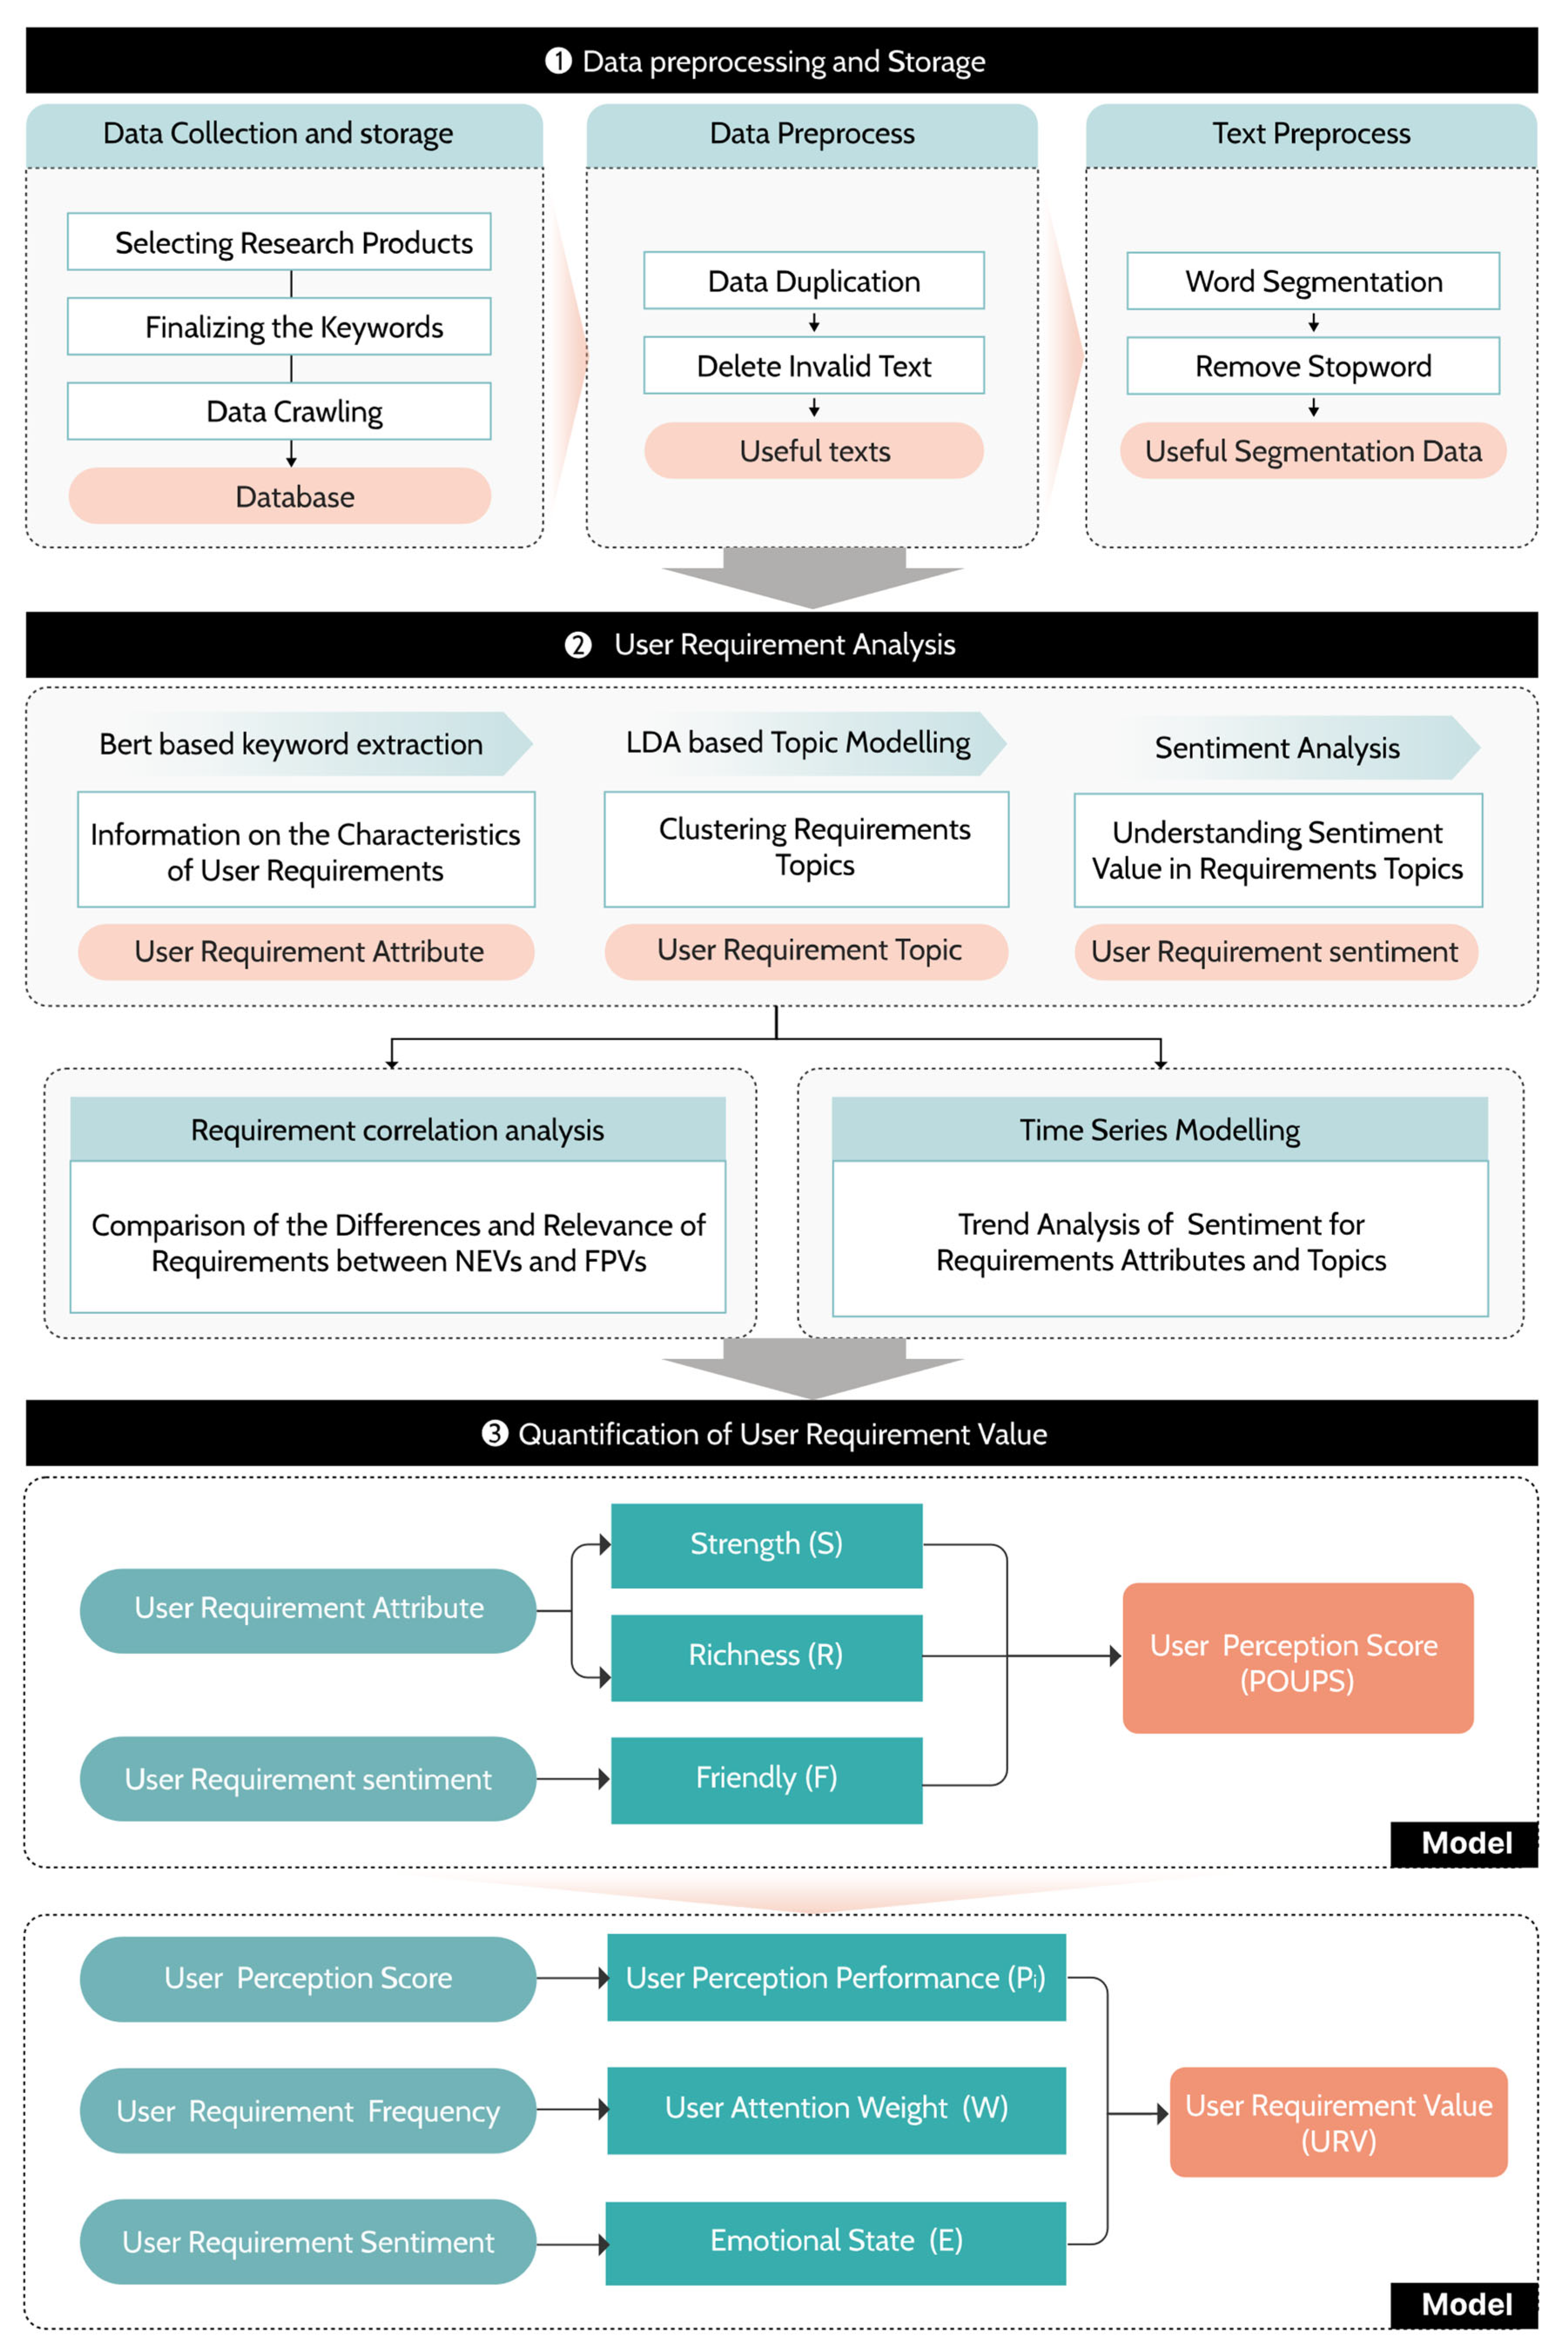
The Bayerische Motoren Werke AG (BMW) is a globally renowned luxury automobile brand with high market status and influence, and the brand has always been committed to technological innovation and research and development. Significant results have been achieved in the transition of automobiles from fuel to NEVs. This study selects BMW as a case study to validate the proposed framework because luxury vehicle users often act as lead users whose high sensitivity to ergonomic details and service quality provides a rigorous testbed for identifying systemic value deficits. By applying text mining technology, it objectively analyses the dynamic changes in Chinese users’ requirements for FPVs and NEVs, to verify the feasibility and scientific validity of the proposed methods. In this case study, the sequence of the main research framework is shown below (Figure 1). This case study captured the online automotive community’s sharing content from the last five years, including the three most popular online automotive community platforms in China: Autohome.com, yiche.com, and DCar. In this study, 789,504 data were collected over five years (from January 2019 to December 2023). The collected fields included a username, users’ shared text, users’ discussions in the vehicle community, etc. The collected raw data was initially archived in a structured excel format. A comprehensive data preprocessing pipeline was executed using Python 3.8 scripts. This automated workflow encompassed five distinct stages. First, repetitive and default reviews were systematically eliminated to ensure the authenticity of user expressions. Second, invalid characters and whitespace were removed to standardize the textual corpus. Third, an advertising tag lexicon was utilized to filter out promotional content such as marketing campaigns. Fourth, verified official and institutional accounts were excluded to focus the analysis on individual consumer experiences. Finally, geographic filtering was applied to restrict the dataset to internet protocol addresses within Mainland China to ensure market consistency. This rigorous sequence transformed the unstructured raw text into a high-quality diagnostic database.

4.2. Word Frequency Analysis

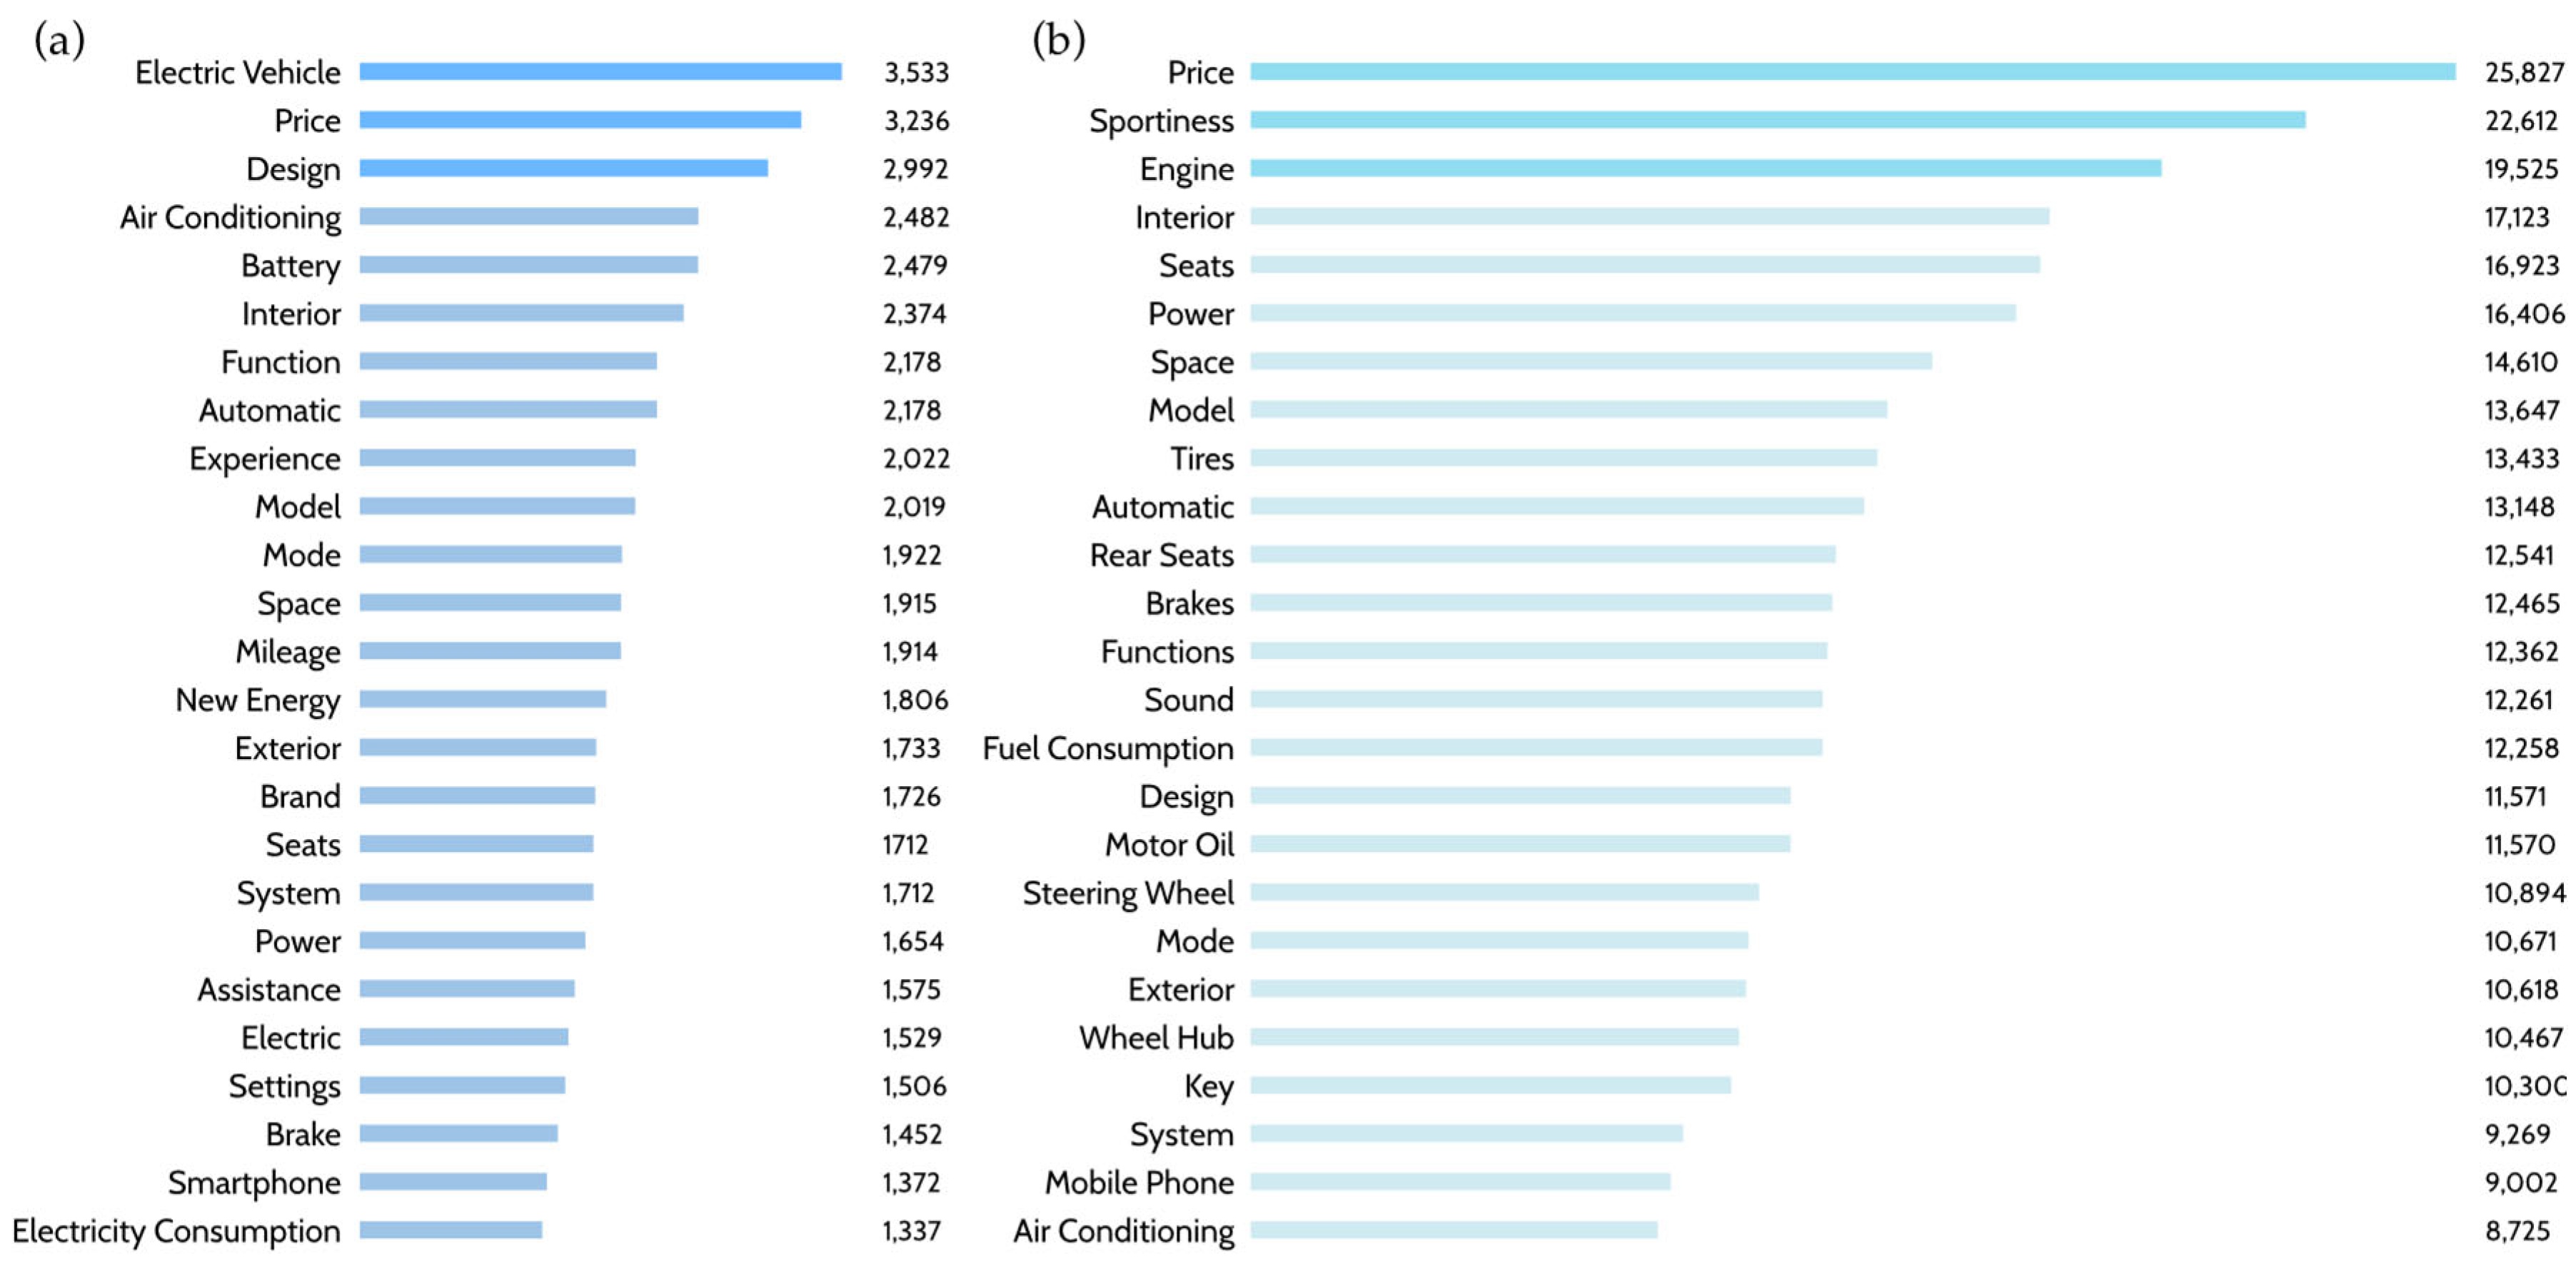
To examine changes in user requirements for BMW automotive products over time and extract key insights from online user texts, this case study first identified the product design attributes present in the collected data. Specifically, we determined which aspects of the product were the focus of user discussions and shared content. After precise Chinese word segmentation, terms unrelated to automotive design or user experience were excluded to ensure the validity of the word frequency analysis. Figure 2 presents the keyword frequency results for BMW’s NEVs and FPVs.
In NEV-related discussions, “Electric Vehicle” appeared most frequently, indicating strong user interest in the electric attributes of these models. High-frequency terms such as “Battery,” “Electric,” and “Electricity Consumption” reflected attention to technological development, sustainability, power performance, range, and charging infrastructure. The prominence of “Price” in both NEV and FPV discussions suggested that cost remained a key factor in purchase decisions, with value-for-money considerations influencing comparisons between traditional and new energy options. The high frequency of “Design” in NEV discussions (third in rank) indicated that design was a major focus, encompassing not only exterior styling but also interior layout, human–machine interaction, functionality, and spatial configuration. Other notable design-related terms included “Interior,” “Function,” “Experience,” “Exterior,” and “Brand.”
For FPVs, “Sport” was the most prominent performance-related term, reflecting the continued appeal of sporty driving characteristics and BMW’s brand association with performance. Frequent mentions of “Engine” and “Power” reinforced the importance of performance attributes. Terms such as “Interior,” “Seats,” “Space,” and “Rear Seats” indicated a strong focus on comfort and interior space. References to “Automatic,” “Function,” “System,” and “Mobile phone” showed that users also valued technological and intelligent features, with specific attention to usability, compatibility, and system intelligence.
A comparison of NEV and FPV keyword lists revealed both commonalities and differences. For FPVs, “Sport” had a higher frequency, reflecting greater emphasis on sportiness. For NEVs, “Mileage” and “Consumption” were more common, indicating concerns about range and energy use, often associated with range anxiety. Terms related to intelligent features, such as “System” and “Automation,” appeared in both categories, but with higher frequency in NEVs, suggesting faster development and greater user focus on intelligence in this segment. Regardless of vehicle type, high-frequency design- and comfort-related terms such as “Design,” “Interior,” “Seats,” and “Exterior” highlighted the consistent importance of aesthetics, ergonomics, and ride comfort. Across both categories, the presence of “System” and “Mobile phone” suggested increasing user expectations for automotive intelligence and connectivity.

4.3. Theme Extraction Analysis

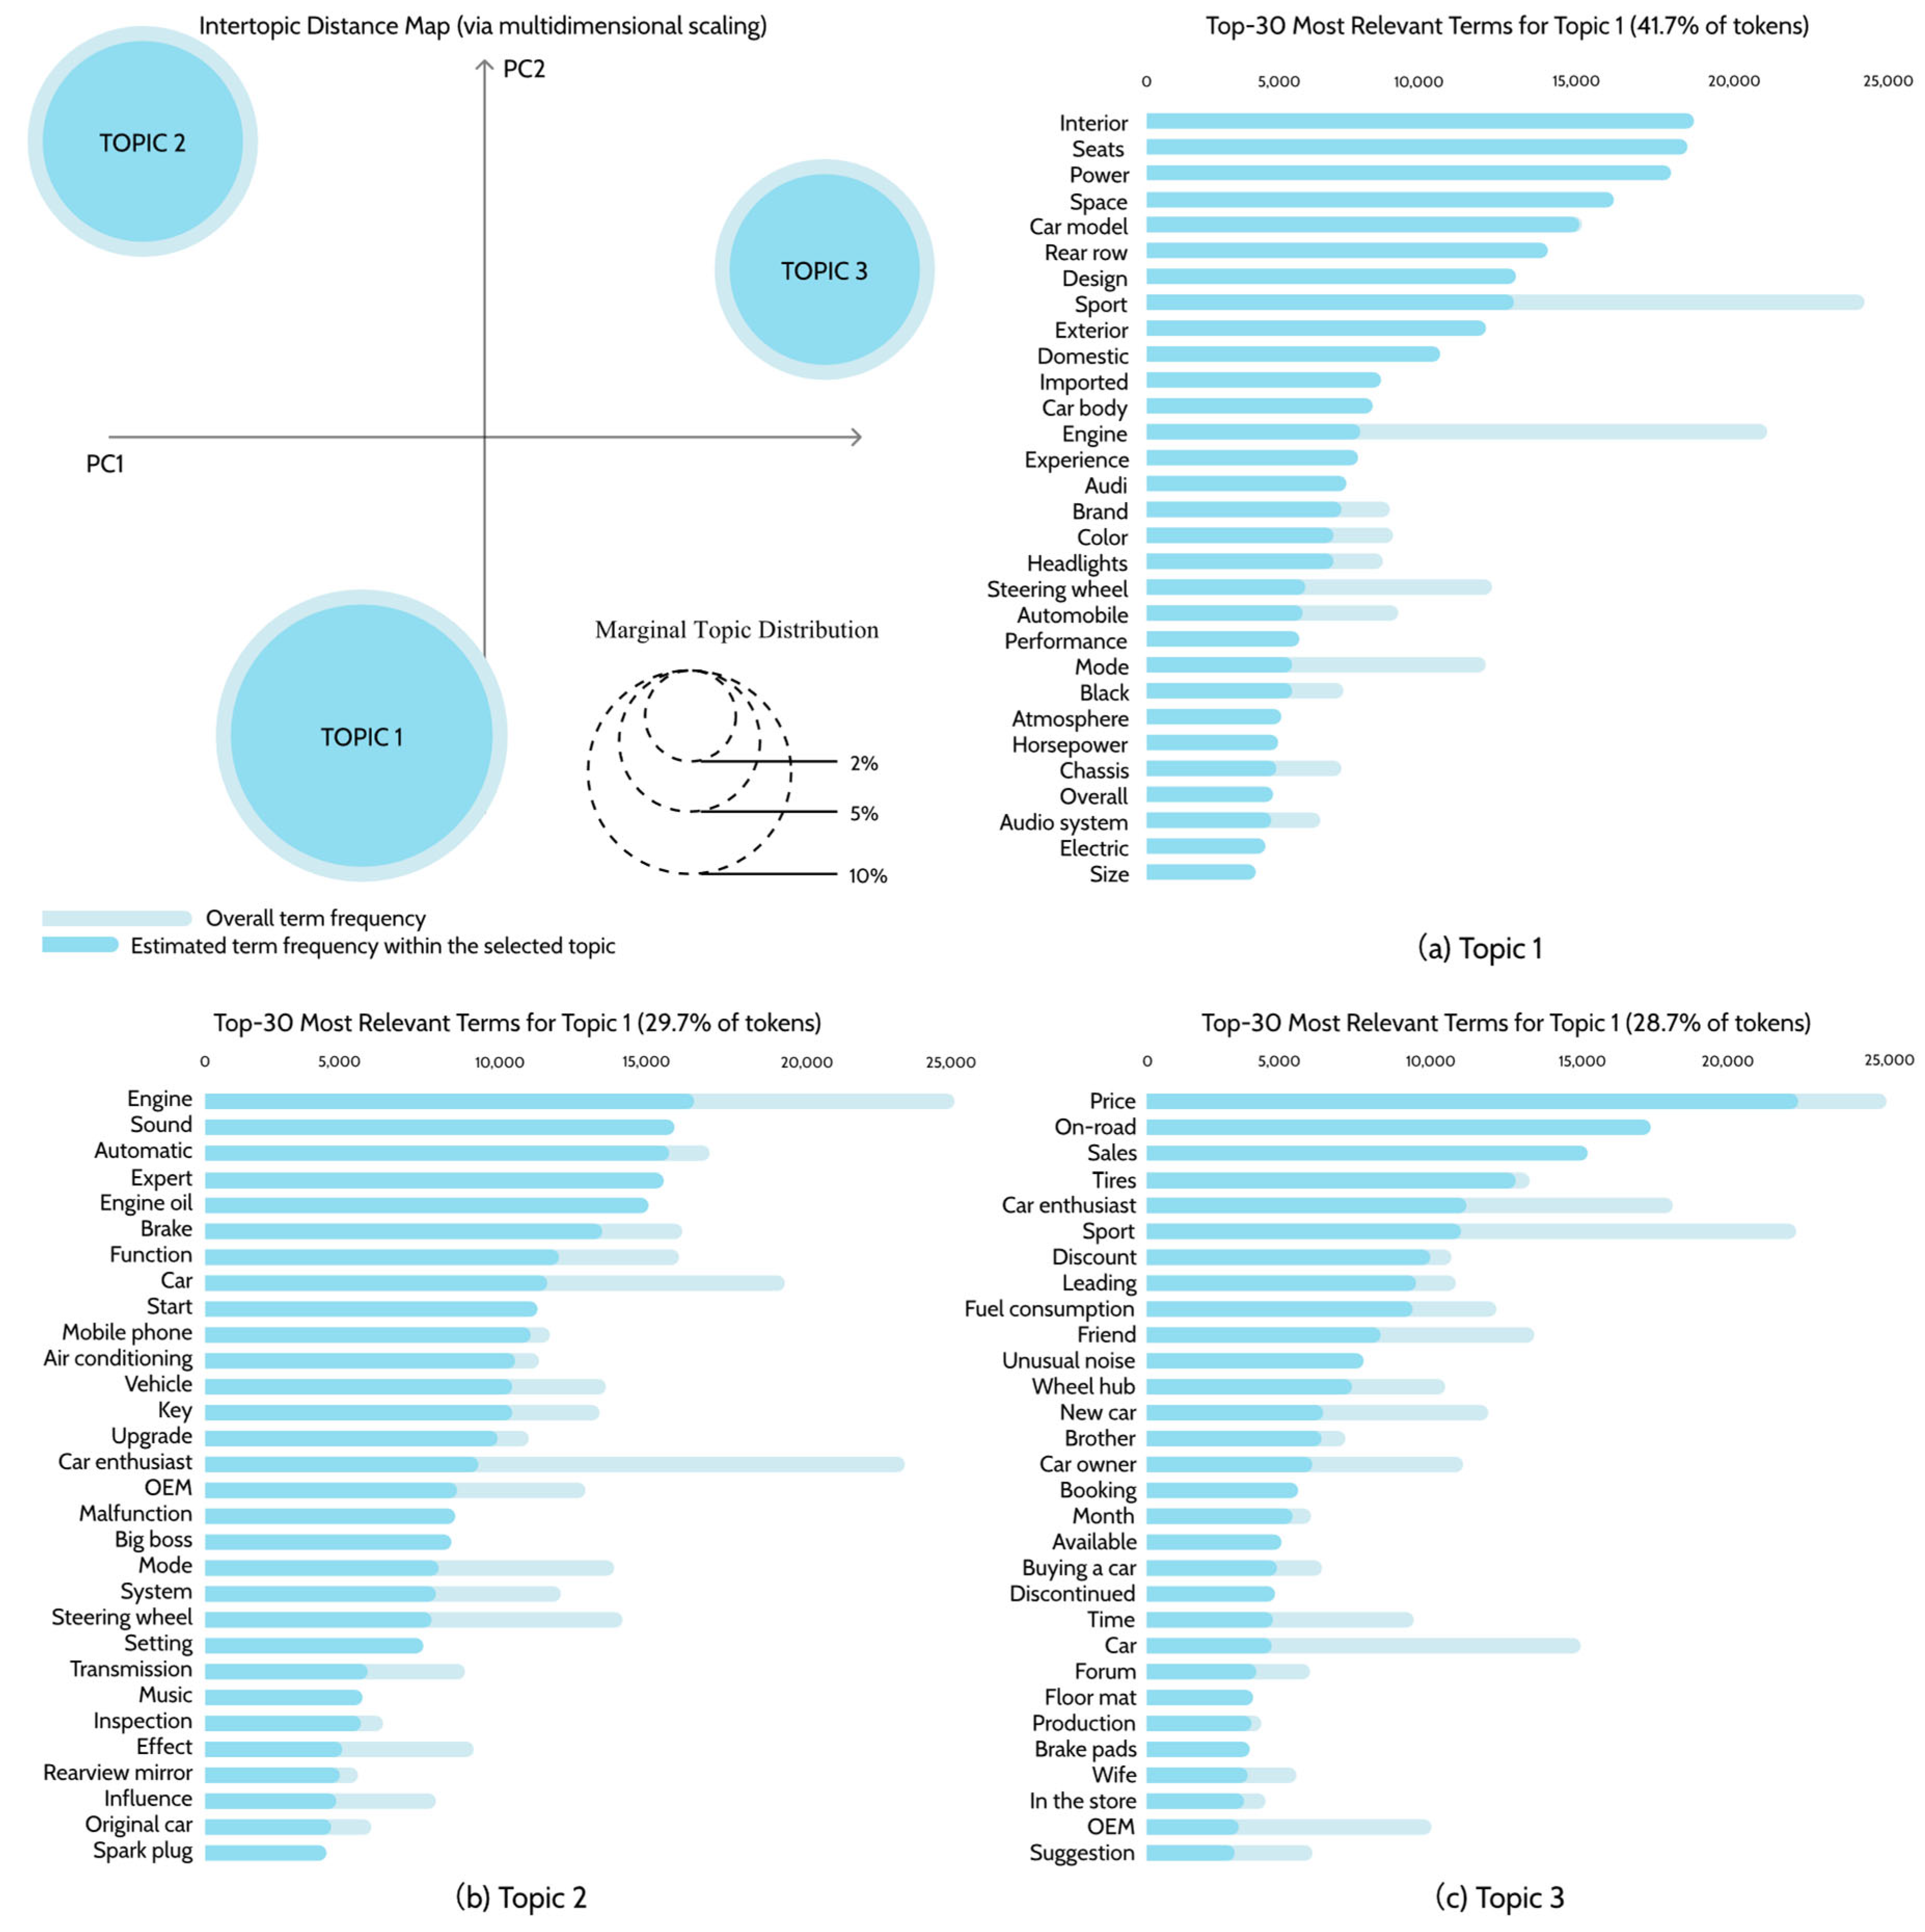
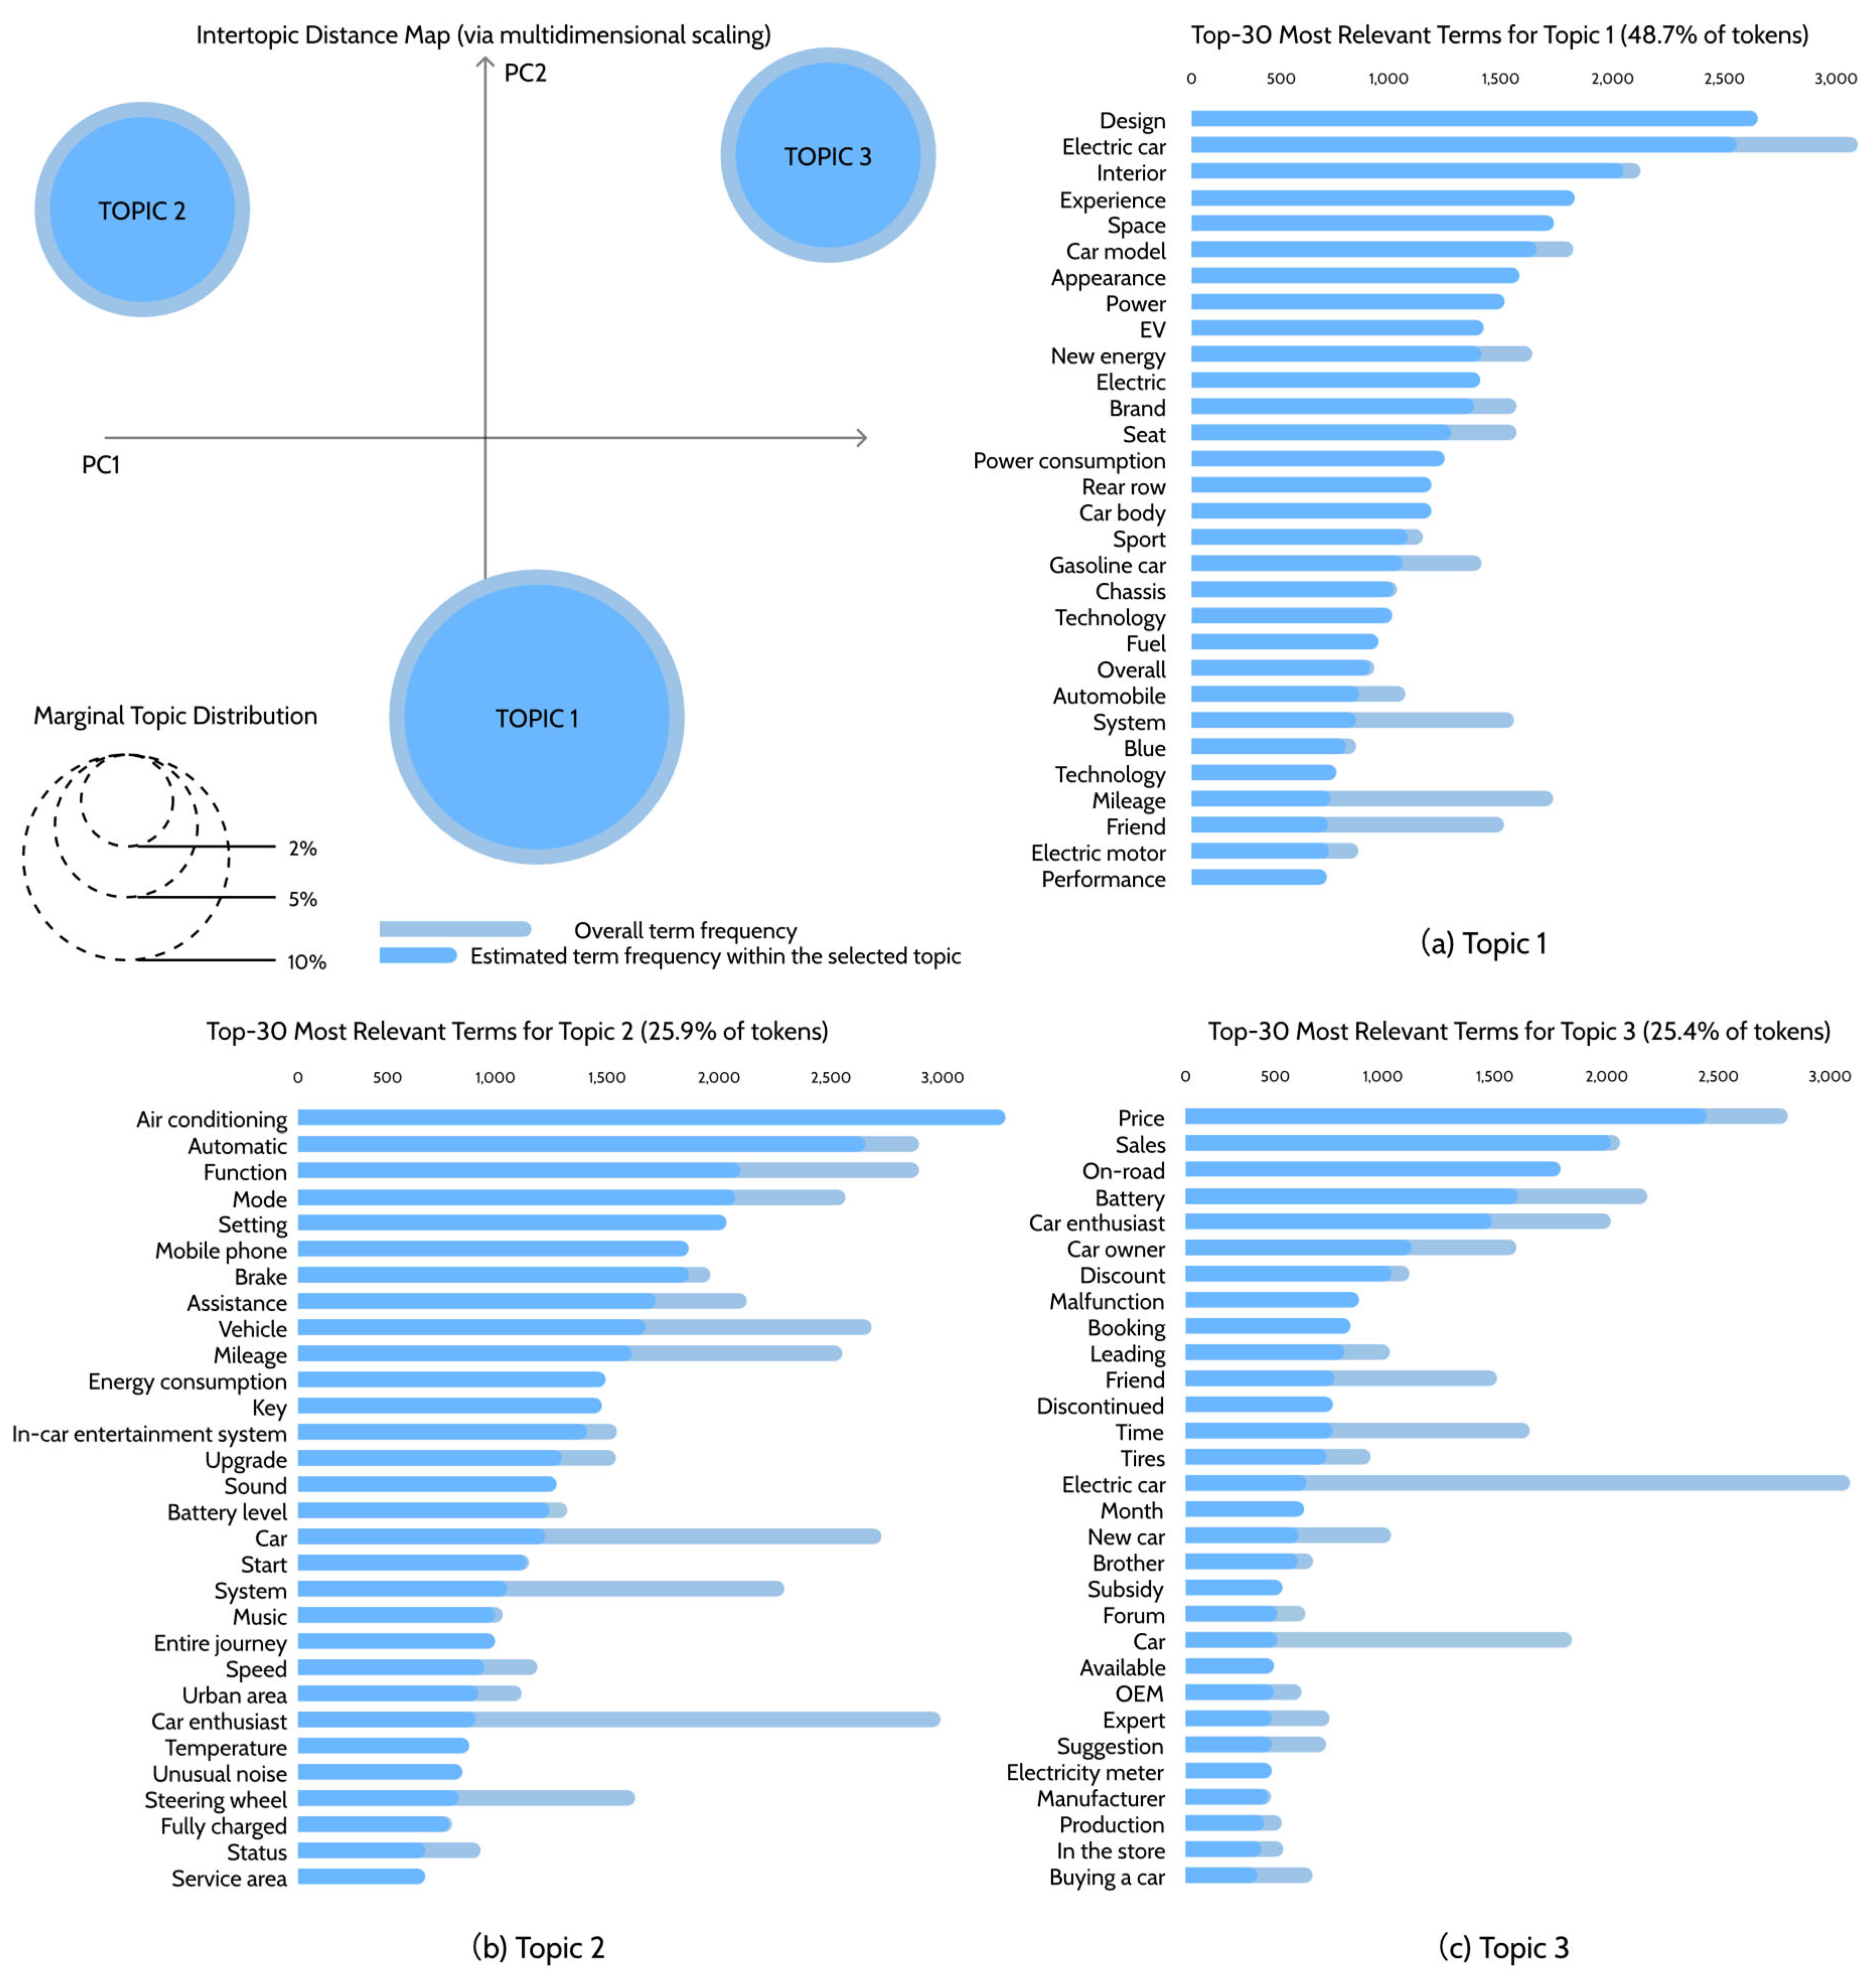
A critical step in theme modelling is determining the optimal number of topics. In this study, Clustering results were compared, and the extraction was considered optimal when the number of potential topics in the automotive online reviews was set to three. Figure 3 presents a visual representation of the topic extraction for user comments. On the left, numbered circles represent the identified topics. The size of each circle corresponds to the probability of the topic’s occurrence. On the right, the top 30 most frequent words associated with the selected topic are displayed. For each word, the light-colored portion of the bar indicates its frequency across the entire corpus, while the dark-colored portion shows its weight within the current topic.
The results reveal three major clusters of user attention that reflect different layers of automotive product perception and requirement formation. Users consistently emphasize fundamental aspects of vehicle performance and design, as indicated by high-frequency terms related to engines, braking, interior and exterior styling, and handling quality, showing that physical affordances and embodied interaction remain central to product evaluation. A second theme highlights purchase decisions and market dynamics, where concerns around pricing, sales, discounts, tire selection, and peer recommendations demonstrate that user requirements extend beyond technical features and are shaped by value judgment, social influence, and market context. The third theme focuses on intelligent functions and ownership experience, reflected in references to automation, mobile phone connectivity, system functions, and everyday usage factors such as fuel consumption, air conditioning, software updates, maintenance, and in-car entertainment. Together, these findings illustrate that user requirements span mechanical performance, economic decision-making, and intelligent interaction, emphasizing the need for design approaches that integrate functional, contextual, and experiential dimensions.
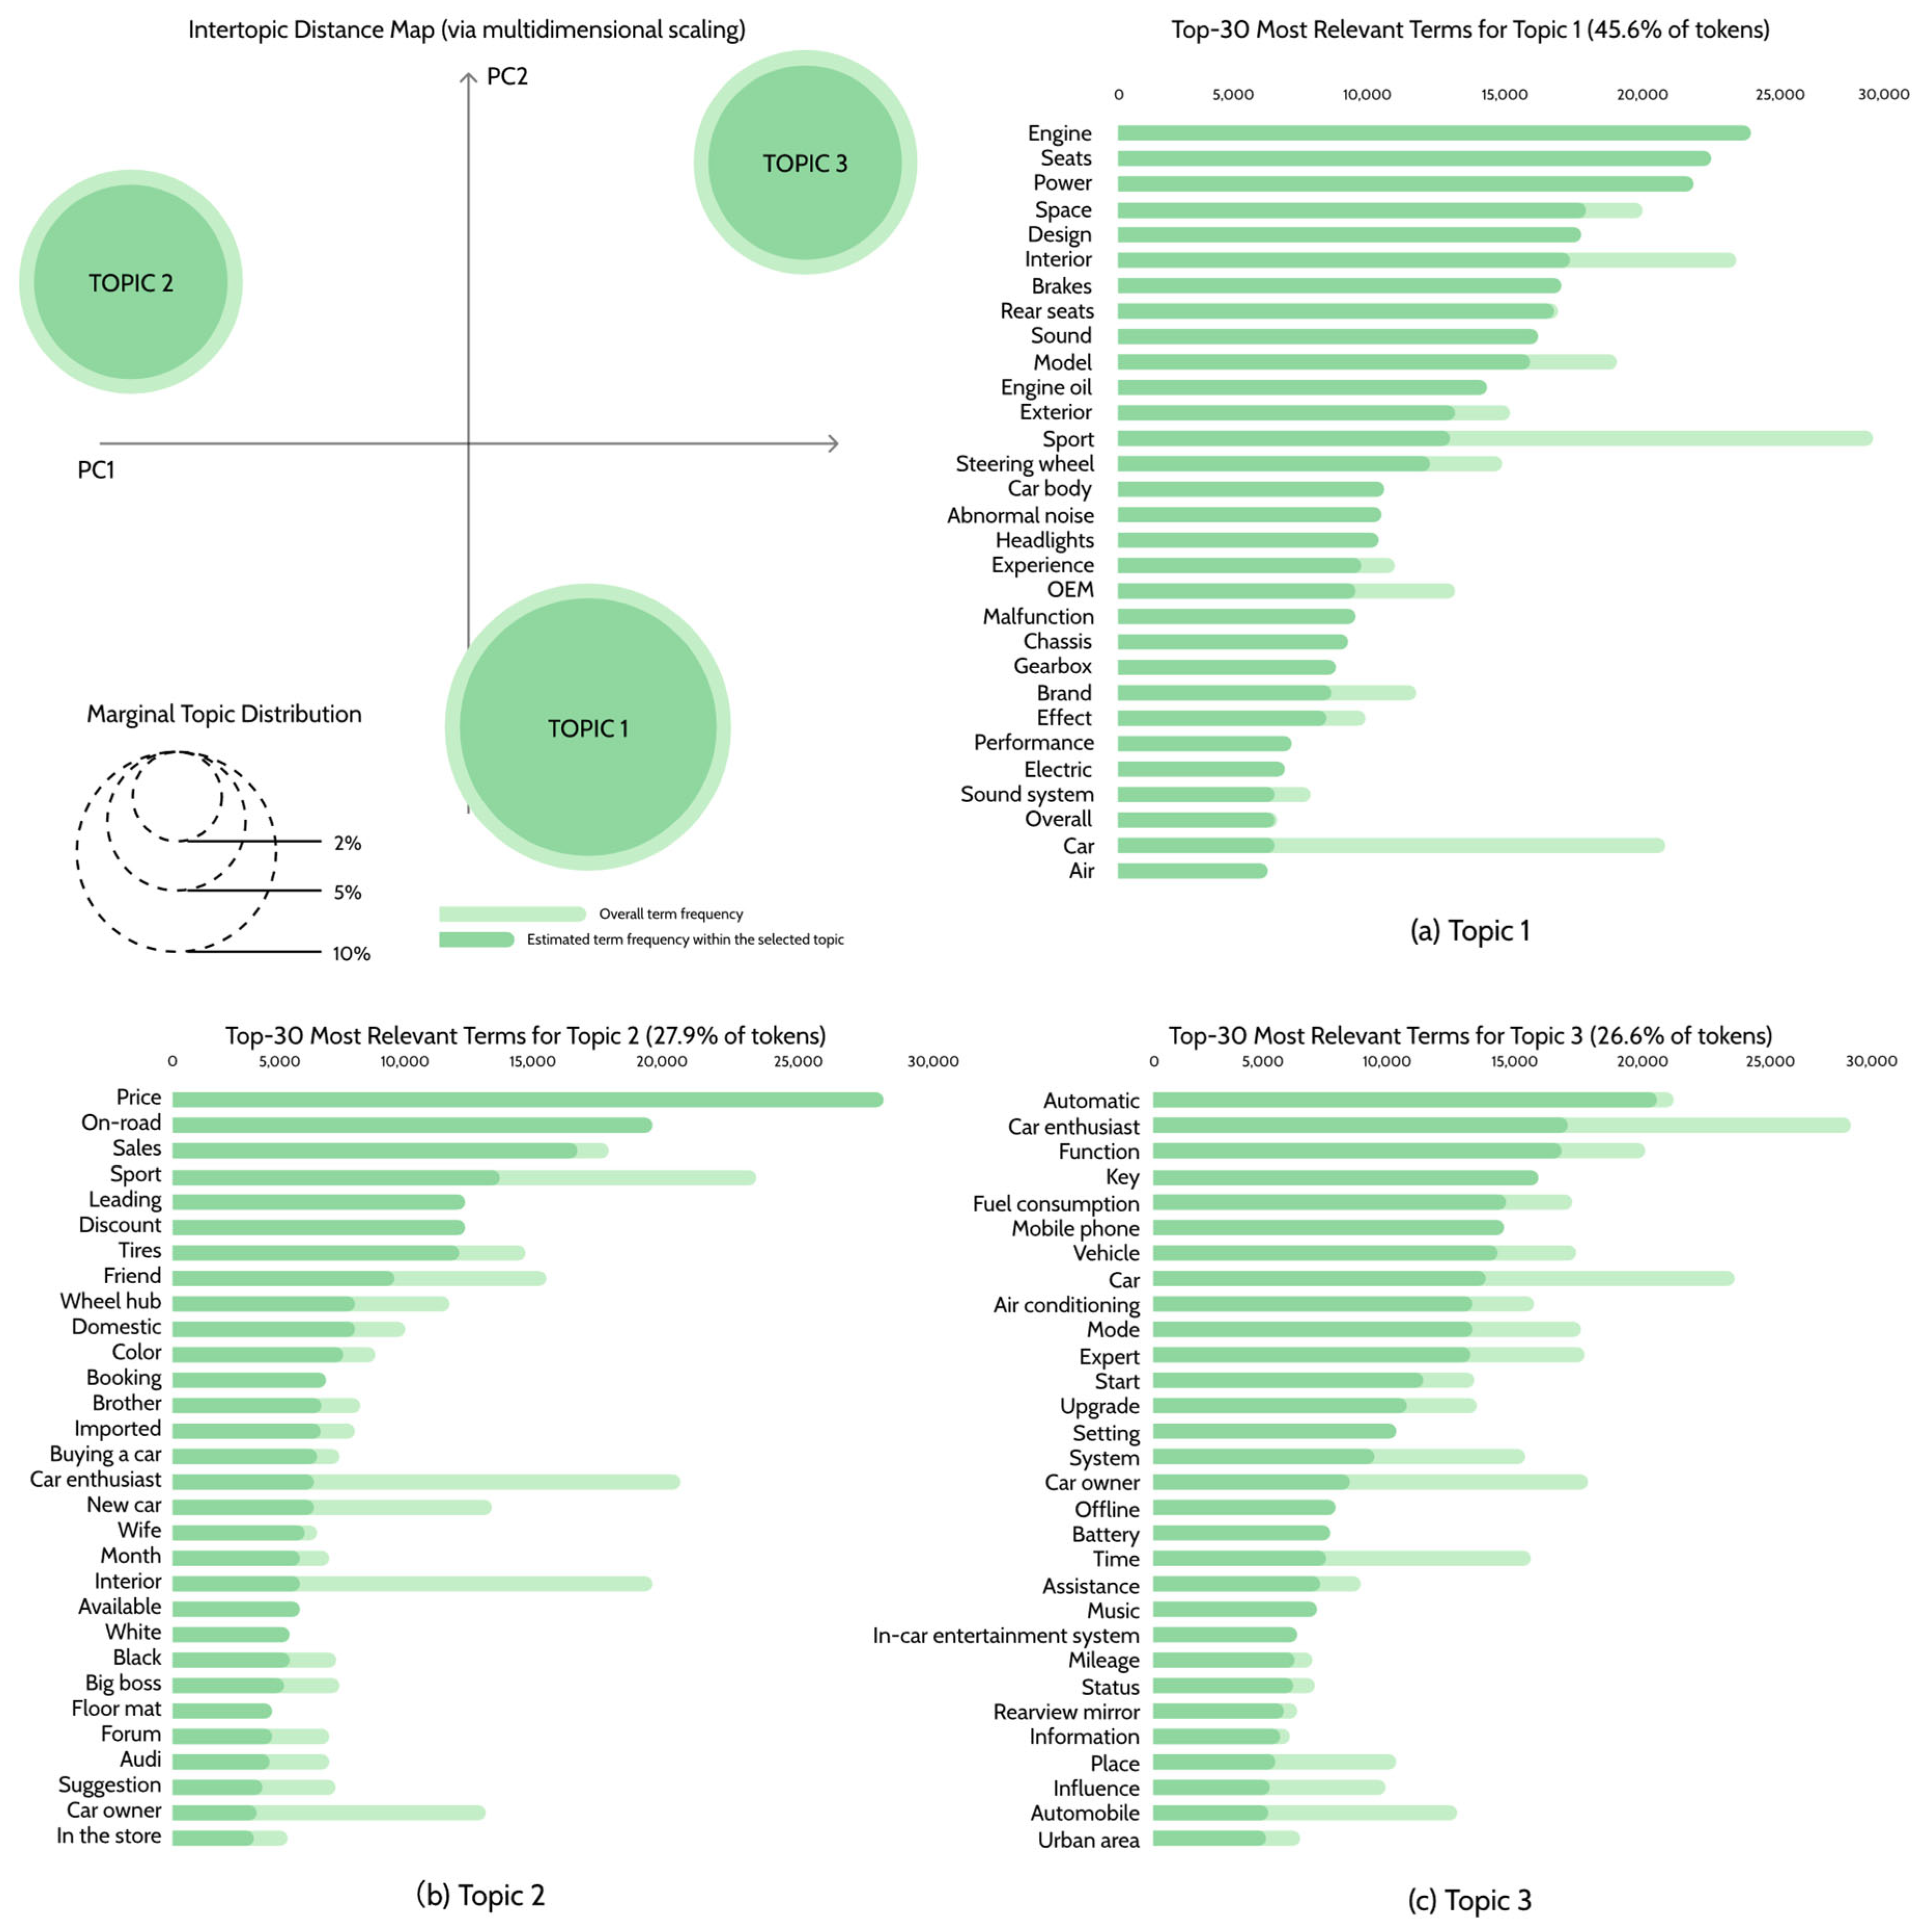
Following the overall topic analysis, separate thematic clustering was conducted for NEVs and fuel-powered vehicles to identify segment-specific UX priorities. Figure 4 presents the three-cluster results for NEVs.
The first topic captures users’ evaluations of overall product attributes and experience, reflected in keywords related to design quality, interior comfort, power performance, brand perception, seating experience, energy consumption, spatial layout, and chassis stability. These terms indicate that users place considerable emphasis on the embodied and sensory qualities of the vehicle, as well as their trust in technological capability and brand value. The second topic highlights concern around vehicle functionality and intelligent technology. Frequent references to air-conditioning performance, autonomous driving functions, system settings, mobile phone connectivity, braking performance, assisted driving systems, and start-up responsiveness illustrate users’ growing expectations for intelligent, convenient, and seamlessly integrated in-vehicle experiences. The third topic centers on pricing and sales services, encompassing considerations such as vehicle price, sales incentives, on-road procedures, battery performance, after-sales service, fault repair, ordering schedules, new model releases, and subsidy policies. These keywords demonstrate that users’ requirements extend beyond product performance and include economic cost, service assurance, and reliability throughout the ownership journey.
Figure 5 shows the FPVs after three-part clustering separately. The results reveal three clusters of user concerns regarding BMW FPVs. The first topic centers on exterior design and performance experience, where users emphasized interior material quality, seat comfort, power smoothness, cabin space, overall styling, brand influence, and the driving feel. These terms show that aesthetic appeal and embodied driving experience jointly shape users’ evaluations. The second topic highlights expectations for functionality and intelligent features, including engine performance and sound, automated driving functions, start-up convenience, connectivity, air-conditioning effectiveness, system stability, and reliability of components. This reflects users’ desire for technologically advanced yet dependable vehicles. The third topic focuses on price, sales services, and purchasing issues, with attention to overall cost, promotions, fuel consumption, tire quality, launch information, ordering and delivery timelines, and potential faults.
Across NEVs, FPVs, and the full set of vehicle models, the three-cluster results demonstrated a consistent pattern in which user discussions concentrated on three central themes: vehicle performance, vehicle design, and pricing and sales considerations. These themes encompassed users’ evaluations of mechanical capabilities, aesthetic and ergonomic qualities, and economic factors such as price and promotional activities. In addition to these shared concerns, model-specific orientations also emerged. For NEVs, lexical items related to electrification, including electric vehicles, energy consumption, and battery performance, appeared with higher frequency, indicating that consumers attach particular importance to these attributes when choosing new energy cars. In contrast, FPV clusters showed a stronger presence of terms such as engine and fuel consumption, suggesting that users place greater emphasis on combustion-engine performance when evaluating fuel-powered vehicles.

4.4. User Online Text Sentiment Analysis

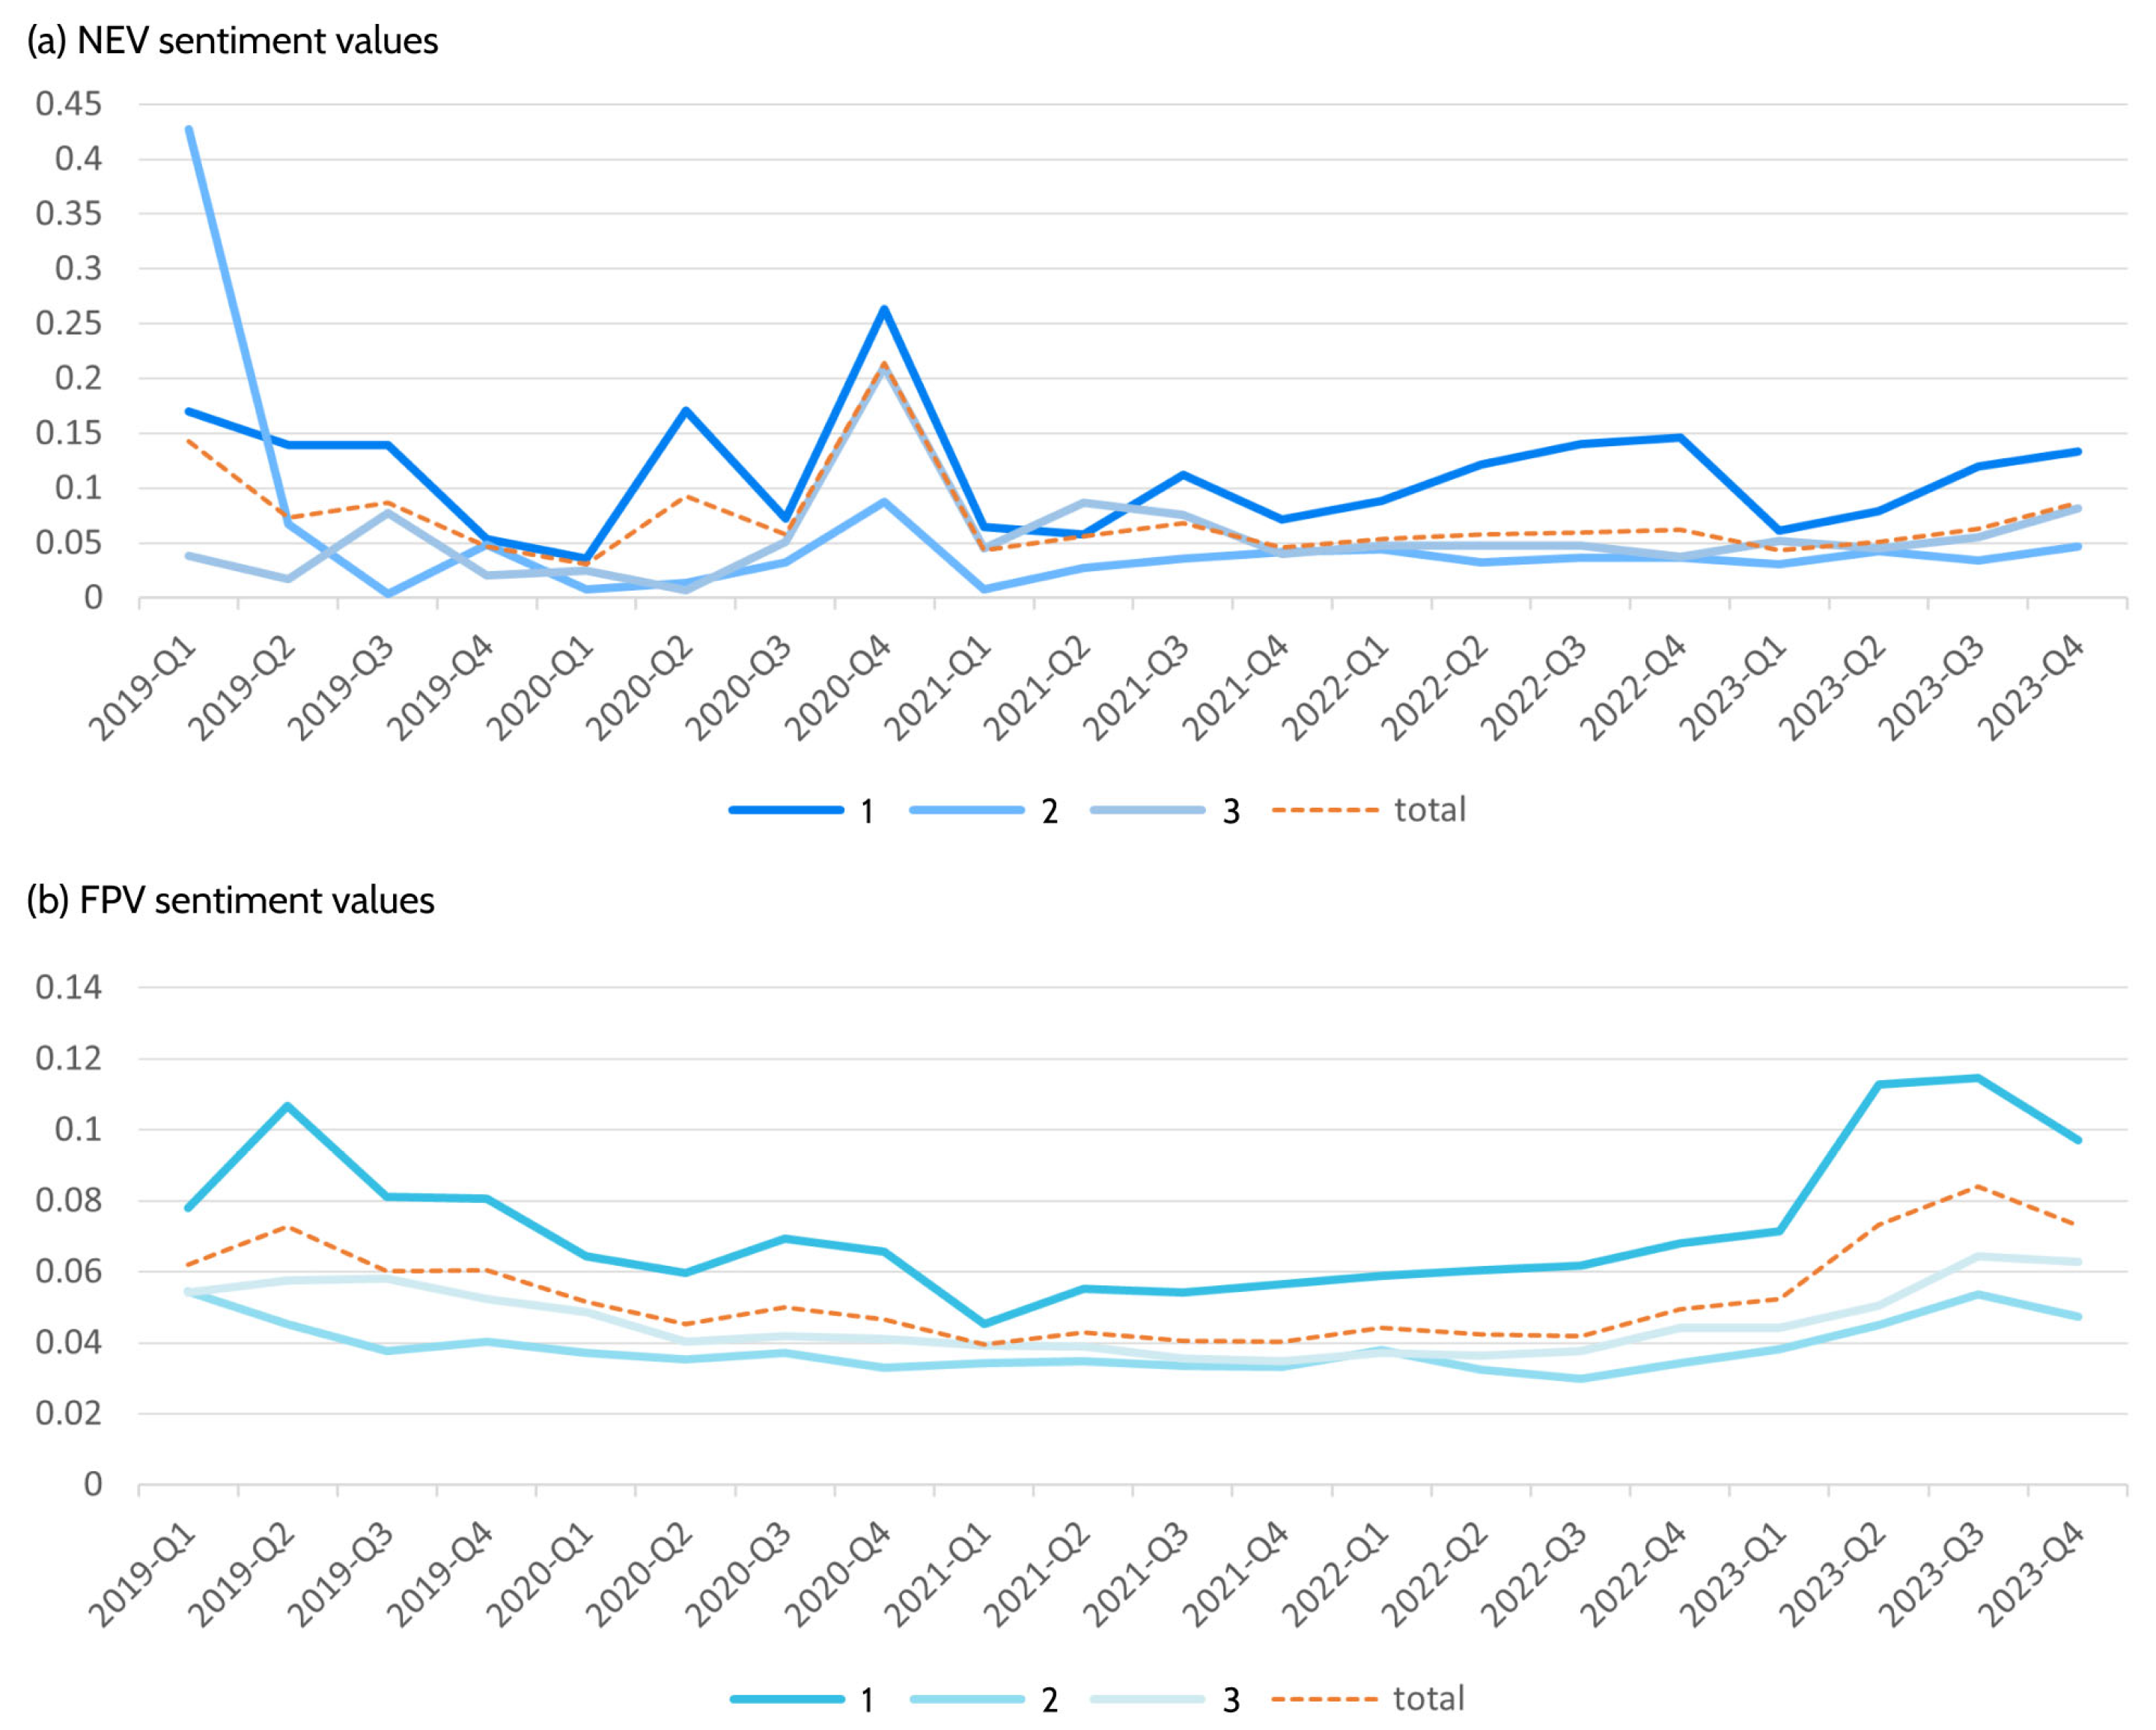
Sentiment analysis was conducted to quantify the emotional tendencies expressed by users. In line with the method described in Section 3, a fine-tuned BERT-based aspect sentiment analysis model was applied. These sentiment values were linked to specific topics identified through LDA clustering. The dataset was further divided by energy supply mode into NEVs and FEVs. For each category, sentiment values were calculated separately for topic 1, topic 2, and topic 3. Quarterly averages were then computed for each topic to track temporal changes.
Figure 6 presents the sentiment distribution curves, where curves 1, 2, and 3 correspond to topic 1, topic 2, and topic 3 respectively, and the “total” curve represents the aggregated sentiment across all topics in that category. Results indicate that for both NEVs and FPVs, topic 1 (vehicle performance and design) consistently achieved higher average sentiment values than the overall average, indicating relatively stronger positive emotional expression within this topic domain. In contrast, topic 3 (price and sales service) showed consistently lower average sentiment values, suggesting comparatively more critical sentiment intensity in discussions related to pricing and sales service.

4.5. Time Series Modelling Requirement Trend Forecasts

This section applies the time trend test to examine how consumer sentiment toward different attributes of BMW vehicles, and their corresponding topics, has evolved over time. The time-series analysis is intended to detect directional signals of topic salience and emotional engagement. The analysis integrates product attributes and related expressions identified through word frequency analysis with the three topics extracted from topic modeling. Table 1 presents the Mann–Kendall test results for trends in user attention, positive sentiment, and negative sentiment associated with product attributes under the three topics.
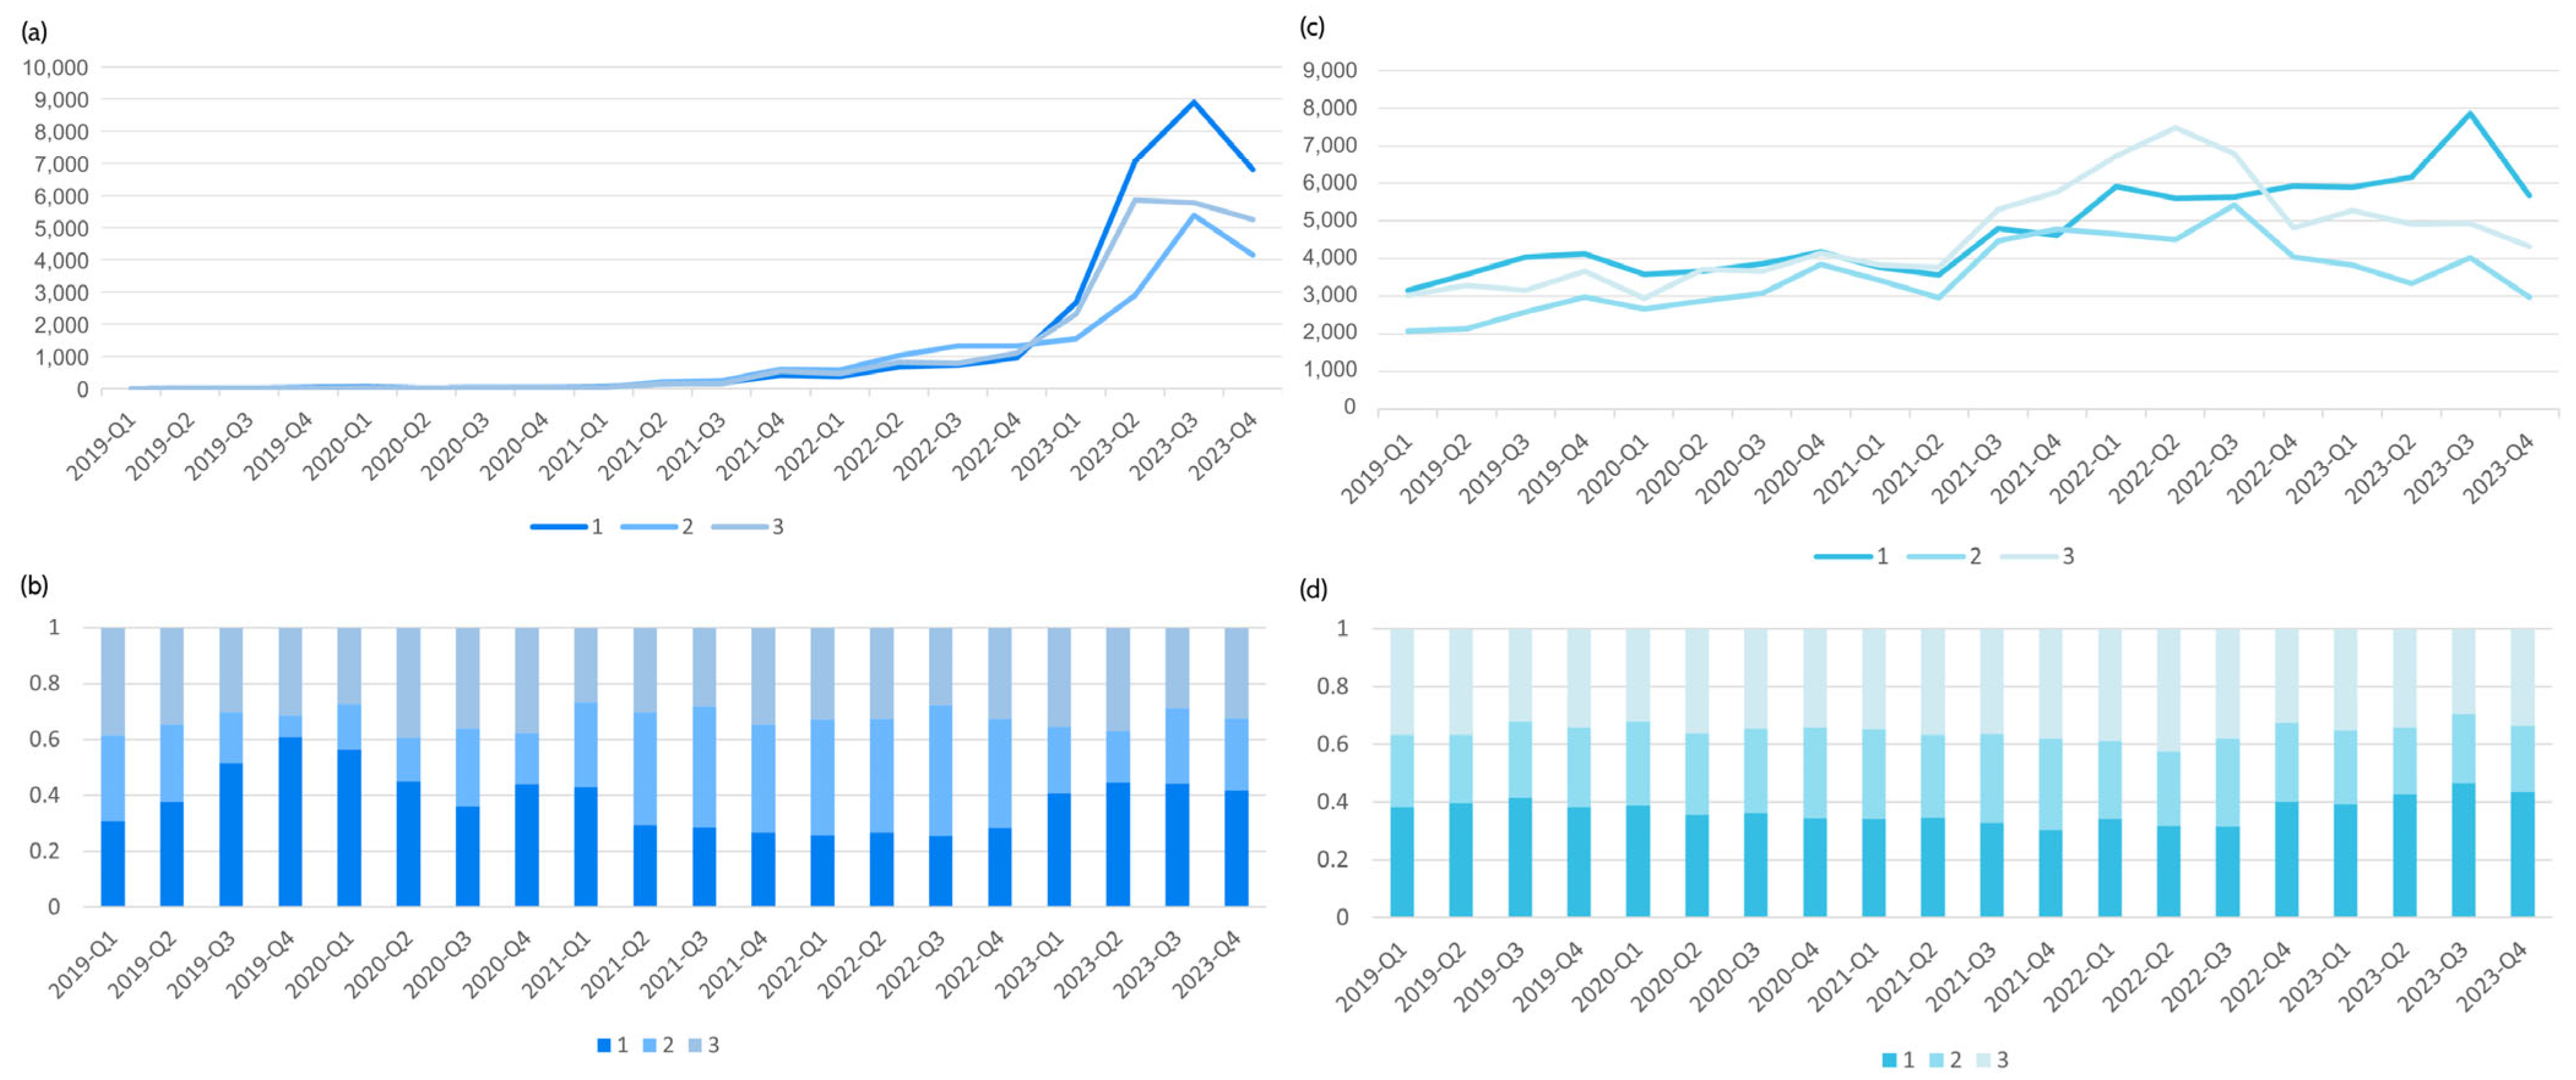
User attention to all three themes of NEVs and FPVs has grown significantly. User positive and negative sentiments on all three topics of NEVs have grown significantly, which reflects increased discussion activity and heightened emotional engagement surrounding NEVs over time. The concurrent growth of positive and negative sentiment volumes suggests an expansion in topic salience and emotional expression intensity. In contexts of increasing platform participation and broader market exposure, growth in both sentiment directions may partly reflect scale effects associated with rising overall discussion volume (see Figure 7).
For FPVs, no significant trend was observed in positive sentiment toward topic 1 (vehicle performance and design), while negative sentiment in this area increased significantly. This pattern reflects intensified critical evaluation within this topic domain. For topic 2 (purchase decisions and market dynamics), both positive and negative sentiments increased, with the growth in negative sentiment being more pronounced. This indicates elevated emotional engagement and greater variability in user evaluations within this topic. For topic 3 (vehicle intelligence and ownership experience), both positive and negative sentiment values increased. Such simultaneous increases reflect stronger topic visibility and more active opinion expression within this domain. These trend results are subsequently used to identify attributes with rising attention and emotional intensity, forming the input for the POUPS and URV evaluation framework.

4.6. Requirement Correlation Analysis

Assessing the correlation between user requirements for NEVs and fuel-powered vehicles is essential for guiding product improvement and strategic development. Based on the analytical framework described in Section 3, this study integrated product attributes identified through BERT-based keyword extraction, LDA topic modeling, and sentiment value computation to compare requirement patterns for the two product types.
The results show that NEVs and FPVs present different correlation patterns in both sentiment values (Table 2) and attention (Table 3) across the three topics. For topic 2 (purchase decisions and market dynamics), the Pearson correlation coefficient of sentiment values was 0.550 (p = 0.012), indicating a statistically significant correlation between the two product types. For topic 1 (vehicle performance and design), the Pearson correlation coefficient was 0.533 (p = 0.016), also showing a significant correlation. This suggests that when users are interested in the performance and design of NEVs, they are also more likely to pay attention to related performance and design attributes in FPVs. In contrast, the correlations for topic 3 (vehicle intelligence and ownership experience) were comparatively weaker, suggesting greater differentiation in user evaluation patterns between NEVs and FPVs within this domain.
These findings indicate that the introduction of new products can influence the market and user requirements for existing products. High correlation between a requirement in one product category and a requirement in another signals the need for designers to prioritize that requirement in product development and incorporate it into improvement planning.

4.7. Quantification of User Requirement Value

The analytical results derived from the integrated discovery sequence including LDA, sentiment analysis, and trend analysis provided the empirical foundation for identifying key requirements. We identified a candidate set of 22 core requirement features that exhibited both high semantic prevalence within the topic clusters and significant growth trends in the preceding time series modeling. To assess the practical relevance of these findings, the identified requirement set was subjected to an expert validity review. Following several rounds of discussion with five experts from the enterprise, these data-derived features were cross-referenced with internal engineering feedback. This consultation process indicated that the identified requirements were broadly consistent with current engineering priorities and ongoing design considerations. The experts noted that several attributes identified as high value by the proposed model corresponded to areas currently receiving attention in product development iterations. This validation step suggests that the hierarchical selection process captures requirement features that demonstrate both statistical salience and practical relevance.
To provide a transparent demonstration of the User Requirement Value quantification process, we selected six representative keywords including audio system, in vehicle system, key, automatic, seat, and rearview mirror as diagnostic cases. Based on the constructed quantitative calculation framework for user perception, the POUPS and URV scores for these product requirements were computed to illustrate the prioritization mechanism. As shown in Table 4 and Table 5, seats obtain the highest POUPS values for both NEVs and FPVs, whereas rearview mirror–related attributes rank the lowest. However, differences emerge in the mid-level rankings: for NEVs, automatic features show relatively higher priority, whereas for FPVs, audio-related attributes rank higher.
We quantitatively evaluated user requirement values. As shown in Table 6, the analysis ranks user requirements in descending order and extracts and categorizes the textual content associated with low user perception for focused analysis. In practical applications, reinforcing core design elements consolidates product advantages and enhances brand distinctiveness, whereas improving high-attention yet low-satisfaction aspects helps address product weaknesses and alleviate user pain points.

5. Discussion

The first significant contribution of this research is the validation of a multi-dimensional valuation mechanism that transcends traditional frequency-based or sentiment-based approaches. While previous scholarship has effectively utilized topic modeling to map the landscape of user interests [42,43], our results demonstrate that identifying the content of user discussions is insufficient for prioritization without understanding the strategic value implication of that discussion. User feedback serves as a critical indicator of the value proposition within the sociotechnical ecosystem. Our model functions as a multidimensional evaluation framework that differentiates between high-frequency feedback and substantive requirement deficits by adopting a multiplicative and non-compensatory structure. This ensures that a deficiency in any single dimension, such as a lack of discussion richness or a collapse in sentiment, results in a disproportionately low perception score, thereby providing a more rigorous diagnostic for system integrity than traditional additive models. In the analysis of new energy vehicles, while general topics like design and performance maintained high sentiment scores, our model successfully isolated specific features such as rearview mirrors, and highlighted car key-related functions as requirements with relatively high strategic value. Traditional analysis might overlook these features due to their relatively lower volume compared to dominant topics like batteries. However, by integrating the dimension of discussion richness and applying a reverse valuation logic, our model highlights these basic functional attributes as critical bottlenecks in user experience. This finding supports the theoretical proposition of asymmetry in user requirements and the theoretical proposition that value creation is hierarchical [44,45], suggesting that dissatisfaction with necessities often carries greater strategic significance for maintaining system integrity than satisfaction with attractive features.
A comparative analysis of new energy vehicles and fuel-powered vehicles reveals a counterintuitive misalignment between user expectations and system attributes. Despite the intense market focus on intelligent cockpits and autonomous driving for new energy vehicles, our results indicate that user dissatisfaction is unexpectedly concentrated on basic ergonomic features and fundamental interactions. This phenomenon can be interpreted through two theoretical lenses. First, it suggests a cognitive load trade-off [46,47]. As manufacturers aggressively stack complex intelligent functions, the allocation of design resources and user cognitive attention may shift away from foundational usability, potentially leading to a perceived degradation in basic experiences. Second, it reflects a shifting reference point in user expectations [48,49]. The high correlation found between new energy and fuel-powered vehicle requirements regarding design and performance implies that users view new energy vehicles not as a completely distinct species but as an evolution of the automobile. Consequently, they carry over their rigorous expectations for mechanical reliability and ergonomic comfort from the fuel-powered era. When high-tech vehicles fail to meet these legacy standards, the psychological gap between expectation and reality widens, resulting in a disproportionately high requirement value score. Furthermore, the increasing negative sentiment observed in fuel-powered vehicle topics suggests a relative deprivation effect, where the satisfaction of users is dampened by the emerging benchmarks set by new energy vehicles. This underscores the dynamic nature of system value: as technological frontiers expand, features once considered delighters transition into basic needs, and the failure to maintain the integrity of basic value becomes a critical liability for the system.
Our findings suggest a differentiated framework for optimizing design resource allocation to maximize overall system value. The hierarchical ranking provided by the User Requirement Value model offers a quantifiable basis for prioritizing product iterations. For attributes identified as high-value pain points, such as specific interaction interfaces or ergonomic components, the priority is immediate remediation. These features, characterized by high user attention but low satisfaction, represent critical functional deficiencies that disproportionately impact overall user experience. Addressing them yields the highest marginal return on user satisfaction and is essential for maintaining baseline product competitiveness. Conversely, for attributes that consistently exhibit high sentiment scores, such as vehicle handling and exterior styling, the strategy shifts towards reinforcement and evolutionary refinement. These elements constitute the core competitive advantage of the product line and require sustained investment to prevent regression. Furthermore, the significant correlation observed between user requirements for NEVs and FPVs implies that manufacturers should adopt a cross-platform design strategy. By standardizing core ergonomic modules and design languages across different powertrain types, companies can ensure the continuity of operational value while maximizing economies of scale in research and development. This suggests that the optimization of system value, which is achieved by balancing the remediation of operational deficits with the introduction of emotional innovations, is more critical for long-term user retention than an exclusive focus on the proliferation of peripheral features. The models we proposed function as a diagnostic instrument tailored to the specific sociotechnical ecosystem of the brand. While this case study focuses on a luxury segment, the proposed framework is fundamentally brand-agnostic and can be applied to diverse market tiers to reveal specific supply and demand misalignments.
While this study offers robust insights into requirement valuation, several limitations must be acknowledged. First, the data source is limited to a single premium automotive brand. Although examining a market leader provides insights from lead users that often predict broader industry trends, the generalizability of these findings to mass-market segments requires further validation. Second, the keyword-based rule for requirement extraction utilizing indicators such as “I want, or I hope” is essentially a heuristic approach. While this ensures computational efficiency for a large-scale dataset, it may fail to capture implicit or indirectly expressed requirements in informal online discourse. Finally, the proposed model primarily identifies and prioritizes problematic features but does not explicitly extract the root causes of user dissatisfaction. Future research could beneficially integrate this quantitative prioritization with qualitative methods, such as large language model-based cause extraction, to provide a comprehensive framework that links problem identification directly to specific engineering solutions.

6. Conclusions

This study addresses the disconnect between the ambiguity of online user expressions and the precision required for value-oriented design. We conclude that integrating information richness with the asymmetry between attention and satisfaction provides a more reliable basis for valuing user requirements than traditional metrics. This research establishes a rigorous link between unstructured user feedback and actionable system value priorities, moving beyond descriptive monitoring to diagnostic valuation. The synthesis of our empirical findings elucidates a critical discrepancy in the context of technological transitions. The filtering of richness revealed that high-frequency discussions are often diluted by low-quality noise, whereas the application of reverse valuation logic exposed that the most urgent design imperatives are deeply rooted in fundamental ergonomic deficits rather than the absence of novel features. Collectively, these results demonstrate that foundational usability becomes a prerequisite in the face of intelligent innovation. If degraded, these basic elements disproportionately impact the overall integrity of the product experience, suggesting that design strategies must balance the pursuit of new features with the consolidation of essential functions. For the domain of product design and market strategy, this work challenges the conventional focus on feature stacking. Our results suggest that prioritizing the remediation of functional deficits can yield greater benefits for system robustness than an exclusive focus on peripheral innovations. This approach allows manufacturers to objectively allocate resources: focusing on immediate remediation for high-value deficits to stop user churn, while reinforcing established strengths to maintain competitiveness.
While this study relies on data from a lead market segment, laying the groundwork for broader validation, it opens a significant avenue for the future of computational design. The next frontier lies in the generative synthesis of solutions. Future research should aim to bridge this valuation model with generative artificial intelligence to create a closed-loop system. Such a system would not only identify high-priority value deficits but also automatically propose preliminary design concepts to address them, thereby realizing the vision of a self-optimizing product development ecosystem.

Author Contributions

Conceptualization, S.P. and H.T.; methodology, S.P. and D.Y.; validation, D.Y. and S.P.; formal analysis, S.P. and D.Y.; investigation, S.P.; data curation, D.Y.; writing—original draft preparation, D.Y. and S.P.; writing—review and editing, S.P. and H.T.; visualization, S.P. and D.Y.; supervision, H.T.; project administration, H.T. All authors have read and agreed to the published version of the manuscript.

Funding

This research was funded by the Hunan Science and Technology Innovation Project (Grant No. 2025JJ60818), the Science and Technology Innovation Program of Hunan Province (Grant No. 2025RC1029), and the National Natural Science Foundation of China (Grant No. T2192933).

Data Availability Statement

Data will be made available on request.

Conflicts of Interest

The authors declare no conflicts of interest.

References

  1. Lavi, E.; Reich, Y. Supporting Decision Making in Value-Oriented Design: A Multidomain System Value Model. IEEE Trans. Eng. Manag. 2024, 71, 15084–15095. [Google Scholar] [CrossRef]
  2. Cai, M.; Yang, W.; Du, Y.; Tan, Y.; Lu, X. Automatic requirements elicitation from user-generated content: A review of data, methods, and representations. Eng. Appl. Artif. Intell. 2025, 156, 111110. [Google Scholar] [CrossRef]
  3. Gagliardi, A.R.; Carrubbo, L.; Megaro, A. Only Platformization? No, Community First! Systems 2024, 12, 554. [Google Scholar]
  4. Jin, L.; Ryu, M.H. User dissatisfaction and behavioral intention toward personalized advertising recommendation services in Chinese social networking services. Humanit. Soc. Sci. Commun. 2025, 12, 1857. [Google Scholar] [CrossRef]
  5. Wang, J.; Tu, R.; Wang, A.; He, D. Trust in range estimation system in battery electric vehicles—A mixed approach. IEEE Trans. Hum.-Mach. Syst. 2024, 54, 250–259. [Google Scholar] [CrossRef]
  6. Ning, T.; Lu, B.; Ouyang, X.; Ouyang, H.; Chen, J. Prospect and sustainability prediction of China’s new energy vehicles sales considering temporal and spatial dimensions. J. Clean. Prod. 2024, 468, 142926. [Google Scholar] [CrossRef]
  7. Pei, M.; Huang, Z.; Zhang, Z.; Wang, K.; Ye, X. Range anxiety and willingness to pay: Psychological insights for electric vehicle. J. Renew. Sustain. Energy 2025, 17, 015902. [Google Scholar] [CrossRef]
  8. Baden, K.B. More than just miles: Range anxiety unplugged. Transp. Res. Part A Policy Pract. 2025, 200, 104661. [Google Scholar] [CrossRef]
  9. Tan, H.; Peng, S.; Liu, J.-X.; Zhu, C.-P.; Zhou, F. Generating personas for products on social media: A mixed method to analyze online users. Int. J. Hum.–Comput. Interact. 2022, 38, 1255–1266. [Google Scholar] [CrossRef]
  10. Baier, D.; Decker, R.; Asenova, Y. Collecting and Analyzing User-Generated Content for Decision Support in Marketing Management: An Overview of Methods and Use Cases. Schmalenbach J. Bus. Res. 2025, 77, 419–455. [Google Scholar] [CrossRef]
  11. Li, Y.; Dong, Y.; Cao, J.; Chen, L.; Zhang, N. Incorporating the dynamic natures into prioritization of customer requirements. J. Eng. Des. 2025, 37, 1063–1098. [Google Scholar] [CrossRef]
  12. Chen, Y.; Zhang, Z. Exploring public perceptions on alternative meat in China from social media data using transfer learning method. Food Qual. Prefer. 2022, 98, 104530. [Google Scholar] [CrossRef]
  13. Sha, K.; Li, Y.; Dong, Y.; Zhang, N. Modelling the dynamics of customer requirements considering their lability and sensitivity in product development. Adv. Eng. Inform. 2024, 59, 102296. [Google Scholar] [CrossRef]
  14. Zappavigna, M.; Patrick, J. Eliciting tacit knowledge about requirement analysis with a Grammar-targeted Interview Method (GIM). Eur. J. Inf. Syst. 2010, 19, 49–59. [Google Scholar] [CrossRef]
  15. Azadegan, A.; Papamichail, K.N.; Sampaio, P. Applying collaborative process design to user requirements elicitation: A case study. Comput. Ind. 2013, 64, 798–812. [Google Scholar] [CrossRef]
  16. Huo, Y.; Liu, J.; Xiong, J.; Xiao, W.; Zhao, J. Machine learning and CBR integrated mechanical product design approach. Adv. Eng. Inform. 2022, 52, 101611. [Google Scholar] [CrossRef]
  17. DeJong, G. Automatic schema acquisition in a natural language environment. In Proceedings of the Second AAAI Conference on Artificial Intelligence, Pittsburgh, PA, USA, 18–20 August 1982; pp. 410–413. [Google Scholar]
  18. Zhang, N.; Qin, L.; Yu, P.; Gao, W.; Li, Y. Grey-Markov model of user demands prediction based on online reviews. J. Eng. Des. 2023, 34, 487–521. [Google Scholar] [CrossRef]
  19. Cui, H.; Gong, L.; Yan, Y. A data-driven design parameter recommendation approach based on personalized requirements for product conceptual design. Comput. Ind. Eng. 2025, 201, 110885. [Google Scholar] [CrossRef]
  20. Cui, H.; Zhang, X.; Liu, H.; Zhang, L.; Yan, Y. Tracing the evolution of user requirements: A sentiment analysis—Based method for smart PSS innovative design. J. Eng. Des. 2025, 1–28. [Google Scholar] [CrossRef]
  21. He, X.; Zhou, Y.; Yuan, X.; Zhu, M. The coordination relationship between urban development and urban life satisfaction in Chinese cities-An empirical analysis based on multi-source data. Cities 2024, 150, 105016. [Google Scholar] [CrossRef]
  22. Tan, H.; Peng, S.-L.; Zhu, C.-P.; You, Z.; Miao, M.-C.; Kuai, S.-G. Long-term effects of the COVID-19 pandemic on public sentiments in mainland China: Sentiment analysis of social media posts. J. Med. Internet Res. 2021, 23, e29150. [Google Scholar] [CrossRef]
  23. Visser, F.S.; Stappers, P.J.; Van der Lugt, R.; Sanders, E.B. Contextmapping: Experiences from practice. CoDesign 2005, 1, 119–149. [Google Scholar] [CrossRef]
  24. Lai, X.; Zhang, Q.; Chen, Q.; Huang, Y.; Mao, N.; Liu, J. The analytics of product-design requirements using dynamic internet data: Application to Chinese smartphone market. Int. J. Prod. Res. 2019, 57, 5660–5684. [Google Scholar] [CrossRef]
  25. Jiang, H.; Sabetzadeh, F. A Chaos-Driven Fuzzy Neural Approach for Modeling Customer Preferences with Self-Explanatory Nonlinearity. Systems 2025, 13, 888. [Google Scholar] [CrossRef]
  26. Liu, Y.; Zhang, D.; Wan, Q.; Lin, Z. Innovative Mining of User Requirements Through Combined Topic Modeling and Sentiment Analysis: An Automotive Case Study. Sensors 2025, 25, 1731. [Google Scholar] [CrossRef]
  27. Li, Q.; Lin, J.; Wang, C.; Xiao, S.; Jiang, X.; Hu, Z. Navigating the shifting landscape of multi-level user demands: A novel hybrid approach for identifying product opportunities and directions. J. Retail. Consum. Serv. 2026, 88, 104460. [Google Scholar] [CrossRef]
  28. Wang, H.; Chen, Y. Research on the classification and optimization strategies of civil aviation customer service based on BERTopic and the Kano model. J. Air Transp. Manag. 2026, 133, 102959. [Google Scholar] [CrossRef]
  29. Zheng, L.; Sun, L.; He, Z.; He, S. The identification of dynamic product innovation opportunities using the multi-phase QFD: The customer requirement and technology development perspectives. Humanit. Soc. Sci. Commun. 2025, 12, 1351. [Google Scholar] [CrossRef]
  30. Cai, M.; Tan, Y.; Ge, B.; Dou, Y.; Huang, G.; Du, Y. PURA: A product-and-user oriented approach for requirement analysis from online reviews. IEEE Syst. J. 2021, 16, 566–577. [Google Scholar] [CrossRef]
  31. Gao, Z.; Li, Z. A cosmetic packaging design method based on online reviews. Eng. Appl. Artif. Intell. 2026, 163, 112865. [Google Scholar] [CrossRef]
  32. Qi, J.; Zhang, Z.; Jeon, S.; Zhou, Y. Mining customer requirements from online reviews: A product improvement perspective. Inf. Manag. 2016, 53, 951–963. [Google Scholar] [CrossRef]
  33. Austmann, L.M.; Vigne, S.A. Does environmental awareness fuel the electric vehicle market? A Twitter keyword analysis. Energy Econ. 2021, 101, 105337. [Google Scholar] [CrossRef]
  34. Giannakis, M.; Dubey, R.; Yan, S.; Spanaki, K.; Papadopoulos, T. Social media and sensemaking patterns in new product development: Demystifying the customer sentiment. Ann. Oper. Res. 2022, 308, 145–175. [Google Scholar] [CrossRef]
  35. Praveen, S.; Gajjar, P.; Ray, R.K.; Dutt, A. Crafting clarity: Leveraging large language models to decode consumer reviews. J. Retail. Consum. Serv. 2024, 81, 103975. [Google Scholar] [CrossRef]
  36. Jia, M.; Zhao, Y.; Zhang, X. Navigating the perceived credibility and adoption of AI-generated review summaries in online shopping: An affordance perspective. Inf. Process. Manag. 2026, 63, 104404. [Google Scholar] [CrossRef]
  37. Brzustewicz, P.; Singh, A. Sustainable consumption in consumer behavior in the time of COVID-19: Topic modeling on twitter data using lda. Energies 2021, 14, 5787. [Google Scholar] [CrossRef]
  38. Zhang, J.; Gan, R.; Wang, J.; Zhang, Y.; Zhang, L.; Yang, P.; Gao, X.; Wu, Z.; Dong, X.; He, J. Fengshenbang 1.0: Being the foundation of chinese cognitive intelligence. arXiv 2022, arXiv:2209.02970. [Google Scholar]
  39. Hou, J.; Tan, Z.; Zhang, S.; Hu, Q.; Wang, P. Detecting fake review intentions in the review context: A multimodal deep learning approach. Electron. Commer. Res. Appl. 2025, 70, 101485. [Google Scholar] [CrossRef]
  40. Li, C.; Niu, Y.; Wang, L. How to win the green market? Exploring the satisfaction and sentiment of Chinese consumers based on text mining. Comput. Hum. Behav. 2023, 148, 107890. [Google Scholar] [CrossRef]
  41. Shen, C.; Wang, A.; Fang, Z.; Zhang, Q. Trend mining of product requirements from online reviews. Chin. J. Manag. Sci. 2021, 29, 211–220. [Google Scholar]
  42. Li, X.; He, G.; Guo, P.; Guo, Z.; Lin, S.; Du, S. Topic modeling help enhancing sustainable mobility. J. Clean. Prod. 2025, 534, 147068. [Google Scholar] [CrossRef]
  43. He, D.; Tang, Z.; Chen, Q.; Wang, Y.; Lu, Y. Two-stage dynamic topic modeling approach for identifying consumer demands of animated series. Multimed. Syst. 2025, 31, 228. [Google Scholar] [CrossRef]
  44. Berger, C.; Blauth, R.; Boger, D. Kano’s methods for understanding customer-defined quality. Cent. Qual. Manag. J. 1993, 2, 3–35. [Google Scholar]
  45. Li, J.; Kim, K. Kano-QFD-based analysis of the influence of user experience on the design of handicraft intangible cultural heritage apps. Herit. Sci. 2023, 11, 59. [Google Scholar] [CrossRef]
  46. Sweller, J. Cognitive load theory. In Psychology of Learning and Motivation; Elsevier: Amsterdam, The Netherlands, 2011; Volume 55, pp. 37–76. [Google Scholar]
  47. Ma, J.; Li, J.; Wang, W.; Huang, H.; Zhang, X.; Zhao, J. Exploring the impact of the passenger’s display on driver workload and driving performance. Appl. Ergon. 2024, 114, 104138. [Google Scholar] [CrossRef] [PubMed]
  48. Oliver, R.L. A cognitive model of the antecedents and consequences of satisfaction decisions. J. Mark. Res. 1980, 17, 460–469. [Google Scholar] [CrossRef]
  49. Bollenbach, J.; Halbrügge, S.; Wederhake, L.; Weibelzahl, M.; Wolf, L. Customer satisfaction at large charging parks: Expectation-disconfirmation theory for fast charging. Appl. Energy 2024, 365, 122735. [Google Scholar] [CrossRef]
Figure 1. The research framework.
Systems 14 00251 g001
Figure 2. (a) NEV User Online Text Keywords; (b) FPV User Online Text Keywords.
Systems 14 00251 g002
Figure 3. Visual display of topic extraction: (a) Topic 1: Vehicle Performance and Design; (b) Topic 2: Car Buying Decisions and Market Dynamics; (c) Topic 3 Vehicle Intelligence and Owner Experience.
Systems 14 00251 g003
Figure 4. The visual display of topic extraction of NEVs: (a) Topic 1: Overall vehicle attributes and user experience; (b) Topic 2: Vehicle features and smart technology; (c) Topic 3: Pricing and sales services.
Systems 14 00251 g004
Figure 5. The visual display of topic extraction of FPVs: (a) Topic 1: Vehicle appearance and performance experience; (b) Topic 2: Vehicle features and smart technology; (c) Topic 3: Pricing and sales services.
Systems 14 00251 g005
Figure 6. User online text quarterly sentiment values: (a) NEV sentiment values; (b) FPV sentiment values.
Systems 14 00251 g006
Figure 7. NEVs and FVs by Topic Requirement Time Dimension Attention and Percentage visualization Chart: (a) NEV user interest; (b) Proportion of each topic for NEVs; (c) FPV user interest; (d) Proportion of each topic for FPVs.
Systems 14 00251 g007
Table 1. Results of the trend test of requirements for each topic of NEVs versus FPVs.
ContentAttentionPositiveNegative
NEVsTopic-1increasing ***increasing ***increasing ***
Topic-2increasing ***increasing ***increasing ***
Topic-3increasing ***increasing ***increasing ***
FPVsTopic-1increasing ***no trendincreasing ***
Topic-2increasing ***increasing **increasing ***
Topic-3increasing ***increasing **increasing **
*** indicates a highly significant trend, when p < 0.001; ** indicates a significant trend, when p < 0.01.
Table 2. Pearson Correlations Among Sentiment Value of Requirements for Each Theme.
Topicrp
all (NEV) & all (FPVs)0.0620.795
1 (NEVs) & 1 (FPVs)0.1030.665
2 (NEVs) & 2 (FPVs)0.550 *0.012
3 (NEVs) & 3 (FPVs)−0.0840.724
* indicates a significant trend, when 0.01 < p < 0.05.
Table 3. Pearson Correlations Among Attention of Requirements for Each Theme.
Topicrp
1 (NEVs) & 1 (FPVs)0.533 *0.016
2 (NEVs) & 2 (FPVs)0.2400.308
3 (NEVs) & 3 (FPVs)0.1760.458
* indicates a significant trend, when 0.01 < p < 0.05.
Table 4. BMW NEV user’s perceived quantitative ranking requirement attributes (Partial).
Requirement
Attribute
SRFα1Sα2Rα3FPOUPS
Seats26823,0160.0812.4284.3620.0810.858
Automatic67316,0480.0352.8284.2050.0350.416
In-vehicle system52543,1790.0322.7204.6350.0320.403
Audio system33912,1730.0272.5304.0850.0270.279
key38714930.0292.5883.1740.0290.238
Rearview mirror7123,9420.01761.8514.3790.0180.146
Table 5. BMW FPV user’s perceived quantitative ranking requirement attributes (Partial).
Requirement
Attribute
SRFα1Sα2Rα3FPOUPS
Seats4646170,6800.0643.6675.2320.0641.228
Audio system545693,7880.0373.7374.9720.0370.687
In-vehicle system2237299,1290.0323.3505.4760.0310.569
Automatic5874124,7200.0253.7605.0960.0250.479
key402415,0740.0313.6004.1780.0310.466
Rearview mirror1177188,8880.0173.0715.2760.0170.275
Table 6. Quantitative Evaluation of Requirement Value for BMW FPVs (Partial).
User TextRequirement Attribute
Keyword
EWPURV
BMW 6 Series Gran TurismoAt night, both the side mirrors and the interior rearview mirror are completely unclear, just like a blind person feeling an elephant.rearview mirror,
driving blind.
0.0010.3804.4201.678
BMW 5 SeriesThere is no seat ventilation, which is uncomfortable in summer. Has anyone noticed that when shifting into reverse, the side mirror tilts downward too much, making it impossible to see the rear bumper or the wheels? Can the tilt angle be adjusted?rearview mirror, seat, ventilation, rear, bumper, wheels0.0010.2804.4121.234
BMW 3 SeriesBy the way, the reverse mirror of BMW’s side mirrors is extremely excessive, you can’t see anything behind at all.rearview mirror, side mirrors0.0030.2804.4121.232
Disclaimer/Publisher’s Note: The statements, opinions and data contained in all publications are solely those of the individual author(s) and contributor(s) and not of MDPI and/or the editor(s). MDPI and/or the editor(s) disclaim responsibility for any injury to people or property resulting from any ideas, methods, instructions or products referred to in the content.