Article

Gender and Household Food Expenditure as a Complex System: Evidence from Türkiye

1
Department of Agricultural Economics, Faculty of Agriculture, Cukurova University, 01330 Adana, Türkiye
2
Department of Industrial Engineering, Faculty of Engineering, İstanbul University—Cerrahpaşa, 34098 İstanbul, Türkiye
3
Department of Industrial Engineering, Faculty of Management, İstanbul Technical University, 34475 İstanbul, Türkiye
*
Author to whom correspondence should be addressed.
Systems 2026, 14(3), 250; https://doi.org/10.3390/systems14030250
Submission received: 4 January 2026 / Revised: 2 February 2026 / Accepted: 18 February 2026 / Published: 27 February 2026

Abstract

Household food expenditure reflects not only income differences, but also how demographic, economic, and institutional factors interact within the household. This study examines household food expenditure in Türkiye from a systems perspective, with a particular focus on the role of gender in shaping economic vulnerability. Using microdata from the 2018 Household Budget Survey, the analysis employs a two-stage framework that combines Artificial Neural Networks and a Tree-Augmented Bayesian Network. In the first stage, non-linear relationships among household characteristics are identified and the most influential determinants of food expenditure shares are determined. In the second stage, a probabilistic system model is constructed to conduct counterfactual “what-if” simulations. The results show that household food expenditure emerges as a systemic outcome influenced by income, education, employment stability, savings capacity, and asset ownership, with gender playing a central role. Female-headed households—particularly those living alone and facing limited education and unstable employment—have a substantially higher probability of allocating a large share of their budget to food. These findings are consistent with Engel’s law and highlight the gendered nature of economic vulnerability. The study suggests that food security policies should address employment stability, human capital, and access to productive assets alongside income support.

1. Introduction

Household food expenditure has long been used as a key indicator of welfare and economic conditions. Since Engel’s early work, the inverse relationship between income and the share of food expenditure has been widely documented, making food spending a common proxy for poverty and living standards [1,2]. However, empirical evidence increasingly shows that household food consumption patterns cannot be explained by income alone. Characteristics such as education, age, employment status, household size, and asset ownership play an important role in shaping budget allocation decisions [3,4,5,6]. In recent years, food price volatility, climate-related production risks, and the economic disruptions caused by the COVID-19 pandemic have further highlighted the complexity of household food expenditure behavior [7,8,9]. In countries such as Türkiye, where households have been exposed to repeated economic shocks, these developments have strengthened the need for detailed household-level analyses [10,11].
Gender constitutes one of the most important dimensions of this complexity. A substantial body of research indicates that households headed by women often face disadvantages in access to stable employment, income security, and productive assets, which increases their exposure to economic vulnerability [4,5]. This disadvantage is frequently reflected in higher food expenditure shares, suggesting limited scope to adjust consumption in response to income fluctuations [6,8]. In Türkiye, rising divorce rates and the growing number of single-person households have increased the prevalence of female-headed households, making gender differences in household welfare more visible [10,11]. Food expenditure should not be viewed solely as a direct outcome of income, but rather as the result of interacting socio-economic conditions in which gender plays a central role. Taken together, these patterns suggest that approaches relying on independent and linear effects are insufficient to explain household food expenditure.
Previous studies examining household food consumption have emphasized the role of socio-economic and demographic characteristics beyond income. Education, employment status, household composition, and asset ownership have been shown to influence both the level and structure of food expenditures across different contexts [12,13,14]. In particular, gender-related differences in household behavior has attracted increasing attention, with evidence suggesting that female-headed households often allocate a larger share of their budgets to basic needs such as food [15,16,17]. This pattern has been linked to higher poverty rates, limited access to stable employment, and weaker asset positions among women-headed households [18,19]. Empirical studies from diverse regions, including Africa, Latin America, and Asia, consistently report that female-headed households face greater risks of food insecurity and exhibit higher expenditure shares devoted to food consumption [20,21,22,23,24]. These findings underline that food expenditure patterns are shaped by structural inequalities rather than by income differences alone. In this study, “gender” refers to the sex of the household head, while “female-headed household” denotes households in which the primary economic decision-maker is a woman. “Single-person households” constitute a distinct structural category and may overlap with female headship but are analytically treated as a separate household type.
In Türkiye, similar dynamics have emerged alongside rapid socio-economic and demographic transformations. Changes in household structure, including rising divorce rates and the increasing prevalence of single-person and female-headed households, has altered traditional patterns of household welfare and consumption behavior [25,26]. Studies focusing on Türkiye highlight that disparities in education, employment opportunities, and asset ownership play a critical role in shaping household food expenditure decisions [27,28]. At the same time, conventional consumption models often struggle to capture how these factors interact, particularly when gender intersects with labor market vulnerability and household structure [16,18,20,23]. This evidence suggests that household food expenditure in Türkiye should be understood as the outcome of interacting socio-economic conditions rather than as the result of isolated determinants. This approaches can account for the interdependencies among household characteristics and provide a more comprehensive picture of consumption behavior in a context marked by inequality and economic uncertainty [15,16,17,18,19,20,21,22,23,24,25,26,27,28].
Recent studies focusing on household structure and consumption behavior emphasize that changes in family composition play a decisive role in shaping welfare outcomes. In particular, the rise in single-person households and the growing share of female-headed households have altered traditional patterns of consumption and vulnerability [16,25,26]. This structural shift is closely associated with differences in access to income, employment security, and social support mechanisms, which in turn affect how households allocate resources to food and other basic needs [27]. Evidence from Türkiye suggests that households with fewer risk-sharing opportunities—such as single-person or single-parent households—are more exposed to economic shocks and tend to devote a larger share of their budgets to essential consumption items [28]. Such findings indicate that household food expenditure cannot be fully understood without considering how household structure interacts with broader socio-economic constraints.
At the same time, the literature points to important limitations in conventional approaches used to analyze these dynamics. Studies examining food expenditure and welfare often rely on linear frameworks that inadequately capture the overlapping effects of household structure, gender, and labor market conditions [12,13,18,27,29]. As a result, the cumulative nature of disadvantage—particularly among female-headed households—may be under-stated when determinants are analyzed separately. Recent contributions highlight the need for analytical perspectives that can better reflect the joint influence of demographic change, economic insecurity, and institutional context on household consumption behavior [15,19,22,29]. In this respect, treating household food expenditure as part of a broader social system offers a more suitable framework for understanding how gendered and structural inequalities translate into persistent differences in consumption outcomes. Unlike classical linear or logit-type models, the ANN–BN framework allows for non-linear relation-ships, interaction effects, and conditional dependencies to be identified without imposing a priori functional forms. This is particularly relevant when gender effects are indirect and emerge through combinations of socio-economic constraints rather than through a single coefficient.
In recent years, many studies have relied on alternative analytical tools to better capture the complexity and uncertainty observed in household consumption behavior. In contrast to traditional approaches, system-oriented and machine-learning-based methods allow researchers to capture non-linear relationships, feedback mechanisms, and joint effects among socio-economic variables [30,31,32,33,34]. In the context of household food expenditure, such methods are particularly useful for exploring how gender, employment status, education, and asset ownership interact rather than operate independently. Previous studies applying these approaches demonstrate that consumption outcomes often reflect hidden structures and conditional dependencies that remain obscured in linear models [30,31,32,33,34]. These methodological developments provide a strong foundation for rethinking household food expenditure as a system-level outcome shaped by multiple, interconnect-ed factors.
Building on this perspective, the present study adopts a system-based analytical framework to examine household food expenditure in Türkiye, with a specific focus on gendered patterns of economic vulnerability. By integrating non-linear prediction with probabilistic reasoning, the approach allows both the identification of key determinants and the examination of their interactions within a unified structure [30,31,32,33,34]. This framework is well suited to the Turkish context, where households faces heterogeneous eco-nomic conditions and where gender, labor market attachment, and asset ownership jointly influence consumption behavior [25,26,27,35,36]. Instead of focusing on isolated marginal effects, the analysis examine how specific combinations of household characteristics are associated with distinct food expenditure outcomes.
Accordingly, this study applies a two-stage analytical framework that combines Artificial Neural Networks and Bayesian Networks to model household food expenditure as a complex system. The first stage captures non-linear relationships among household characteristics and identifies the most influential factors affecting food expenditure shares. The second stage models these relationships probabilistically and enables counterfactual “what-if” analyses to assess how changes in household conditions alter consumption outcomes [37,38,39,40]. By doing so, the study contributes to the literature in two main ways: first, by providing system-level evidence on the gendered nature of household food expenditure in Türkiye; and second, by demonstrating the value of integrated analytical approaches for policy-relevant research on household welfare and food security.

2. Materials and Methods

This study employs a two-stage integrated empirical framework to analyze Türkiye’s food consumption system, combining the predictive capacity of Artificial Neural Networks (ANN) with the probabilistic inference capabilities of Bayesian Networks (BN). In the first stage, an ANN model is estimated, and a comprehensive sensitivity analysis is performed to isolate the most influential determinants of household food consumption value. These results inform and structurally validate the BN model developed in the second stage, which is subsequently used to conduct counterfactual simulations to evaluate system dynamics and derive policy-relevant insights. The empirical analysis uses cross-sectional microdata from the 2018 Household Budget Survey conducted by the Turkish Statistical Institute (TURKSTAT). The year 2018 was chosen because the COVID-19 pandemic started in 2019 and strongly affected household behavior. We focus on 2018 not only because it precedes COVID-19, but also because it offers a clean baseline year in which household budgets were shaped by ‘normal’ economic and demographic conditions rather than emergency-driven behavior. In Türkiye, the pandemic years and the subsequent period involved a sequence of major shocks—lockdowns and mobility re-strictions, changes in work arrangements, policy transfers, and sharp price dynamics—that can mechanically alter both the numerator and denominator of expenditure shares. Using 2018 allows us to study the household system before these structural breaks, and to interpret the gendered vulnerability patterns without mixing them with pandemic-specific mechanisms. Another practical reason is data consistency and comparability; the 2018 Household Budget Survey provides a large, nationally representative microdataset with stable definitions that align well with the variables required by the ANN–BN framework and with much of the pre-pandemic literature used in our discussion. Descriptive statistics for all variables are reported in Table 1.
In this study, “gender” refers to the sex of the household head, while “female-headed household” denotes households in which the primary economic decision-maker is a woman. “Single-person households” constitute a distinct structural category and may overlap with female headship but are analytically treated as a separate household type. Food expenditure shares are discretized into tertiles to ensure a balanced distribution of observations across categories and to improve the performance and interpretability of the Bayesian Network, which operates more robustly with categorical variables. Assets with low prevalence are interpreted cautiously, and their role is primarily assessed through their contribution to broader asset capacity rather than as isolated predictors.

2.1. Artificial Neural Network (ANN) Framework

ANNs have been used for classification, prediction, and pattern recognition in the literature for various problems [30,37,41]. Their ability to work with non-linear data makes them more competitive than conventional statistical models. Our study aims to determine the relationship between food expenditure share and the remaining 16 variables. Table 1 presents a description, summary statistics, and means of the male- and female-headed household characteristics.
There are two main types of ANNs: supervised and unsupervised. Prediction models require supervised training consisting of input, output, and hidden layers. The number of neurons in the input layer is equal to the number of independent variables. In contrast, there are as many neurons as the dependent variables in the output layer. However, the number of neurons in the hidden layer must also be determined.
The main difficulty in constructing an ANN is the determination of the network topology. To model the problem efficiently, the researcher must determine the number of hidden layers, number of neurons in the hidden layer, and learning rate or learning algorithm. Abiodun, Jantan [30], Elsheikh, Sharshir [41] and Panda and Bhoi [42] can be read to extend the literature on ANNs.
When constructing the ANN, the data must initially be prepared in an appropriate format before feeding the ANN. For this purpose, we: (i) discretized the “age” variable into four groups (age ≤ 29, 30 ≤ age ≤ 44, 45 ≤ age ≤ 59, age ≥ 60) and used a binary indicator for each category; (ii) normalized the food consumption ratio, annual income, and household size to take values between 0 and 1; and (iii) created binary indicators for the categories of education and employment2.
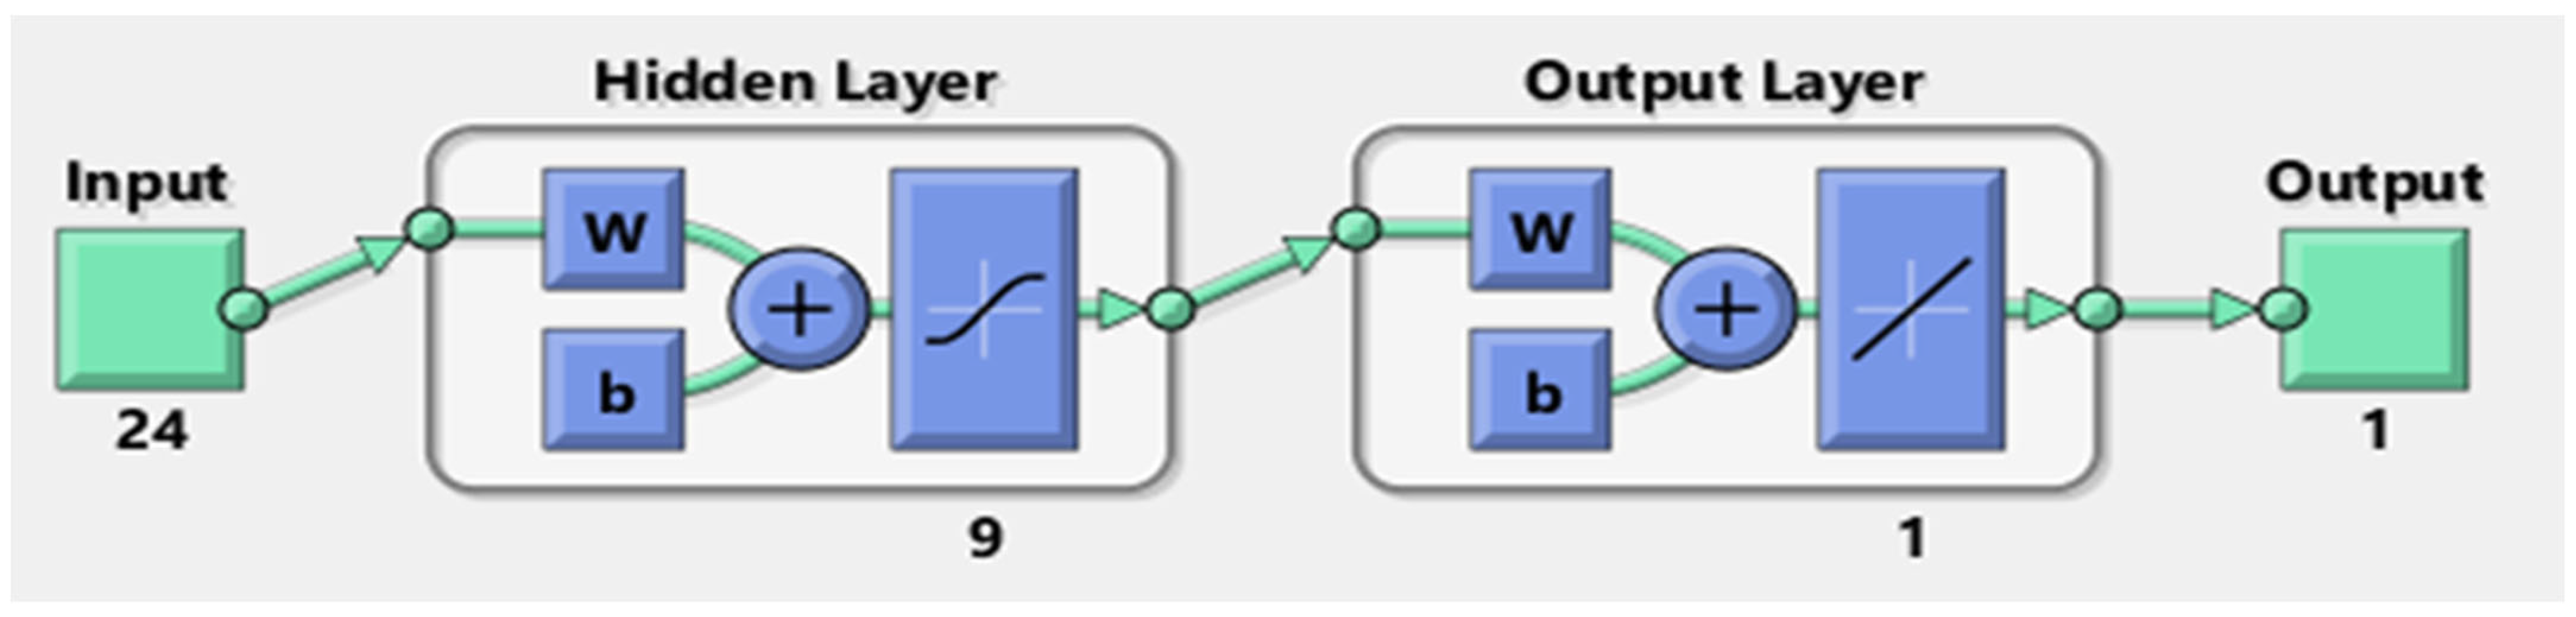
The resulting model had 24 input variables, one output variable (i.e., food consumption ratio), and nine hidden neurons, as shown in Figure 1. The determination of the number of hidden neurons requires a trial-error effort to determine the best topology. We started with two hidden neurons and then increased the number of hidden neurons to find the best ANN topology that is, creating the one with the minimum MSE, as proposed by [43]. Moreover, ref. [37] suggested running each ANN structure ten times for each hidden neuron number to avoid a possible local optimality problem.
For the training/validation/testing proportions, 70/15/15, the default values of MATLAB, were used. The Levenberg–Marquardt training algorithm was used. According to the analysis, the best ANN structure for modeling our problem had nine hidden neurons. For the test data, the MSE value was 0.016.
After determining the best ANN structure, a sensitivity analysis was conducted to identify the most influential factors in the food consumption ratio. For this purpose, the ANN was run 16 times using a zero-column vector for each input variable, one after another.
The difference in the MSE values between the original ANN and that with a fixed value of 0 as the input variable can be used to measure the importance of the input [44]. The Artificial Neural Network analyses were implemented using MATLAB (version R2022b). The results of the sensitivity analysis are listed in Table 2.

2.2. Bayesian Networks (BN) Framework

Bayesian Networks (BN) are probabilistic models used for understanding and analyzing complex systems that can be used for diagnostic reasoning, predictive reasoning, and inter-causal reasoning [40,45]. Since they are represented as graphical models, interpreting the relations between variables is easier, and benefiting from probability makes them more efficient in dealing with uncertainty. BNs consist of nodes that represent variables and directed arrows that represent conditional probabilities.
The type of dependency between variables is determined by assigning marginal and conditional probability distributions to the nodes [38]. Using the chain rule, the joint probability distribution of variables can be computed by multiplying the probabilities of their parent nodes. Marcot and Penman [34], Marcot [39], Martínez-Martínez et al. [46], and Tavana et al. [44] can be used to extend the BN literature.
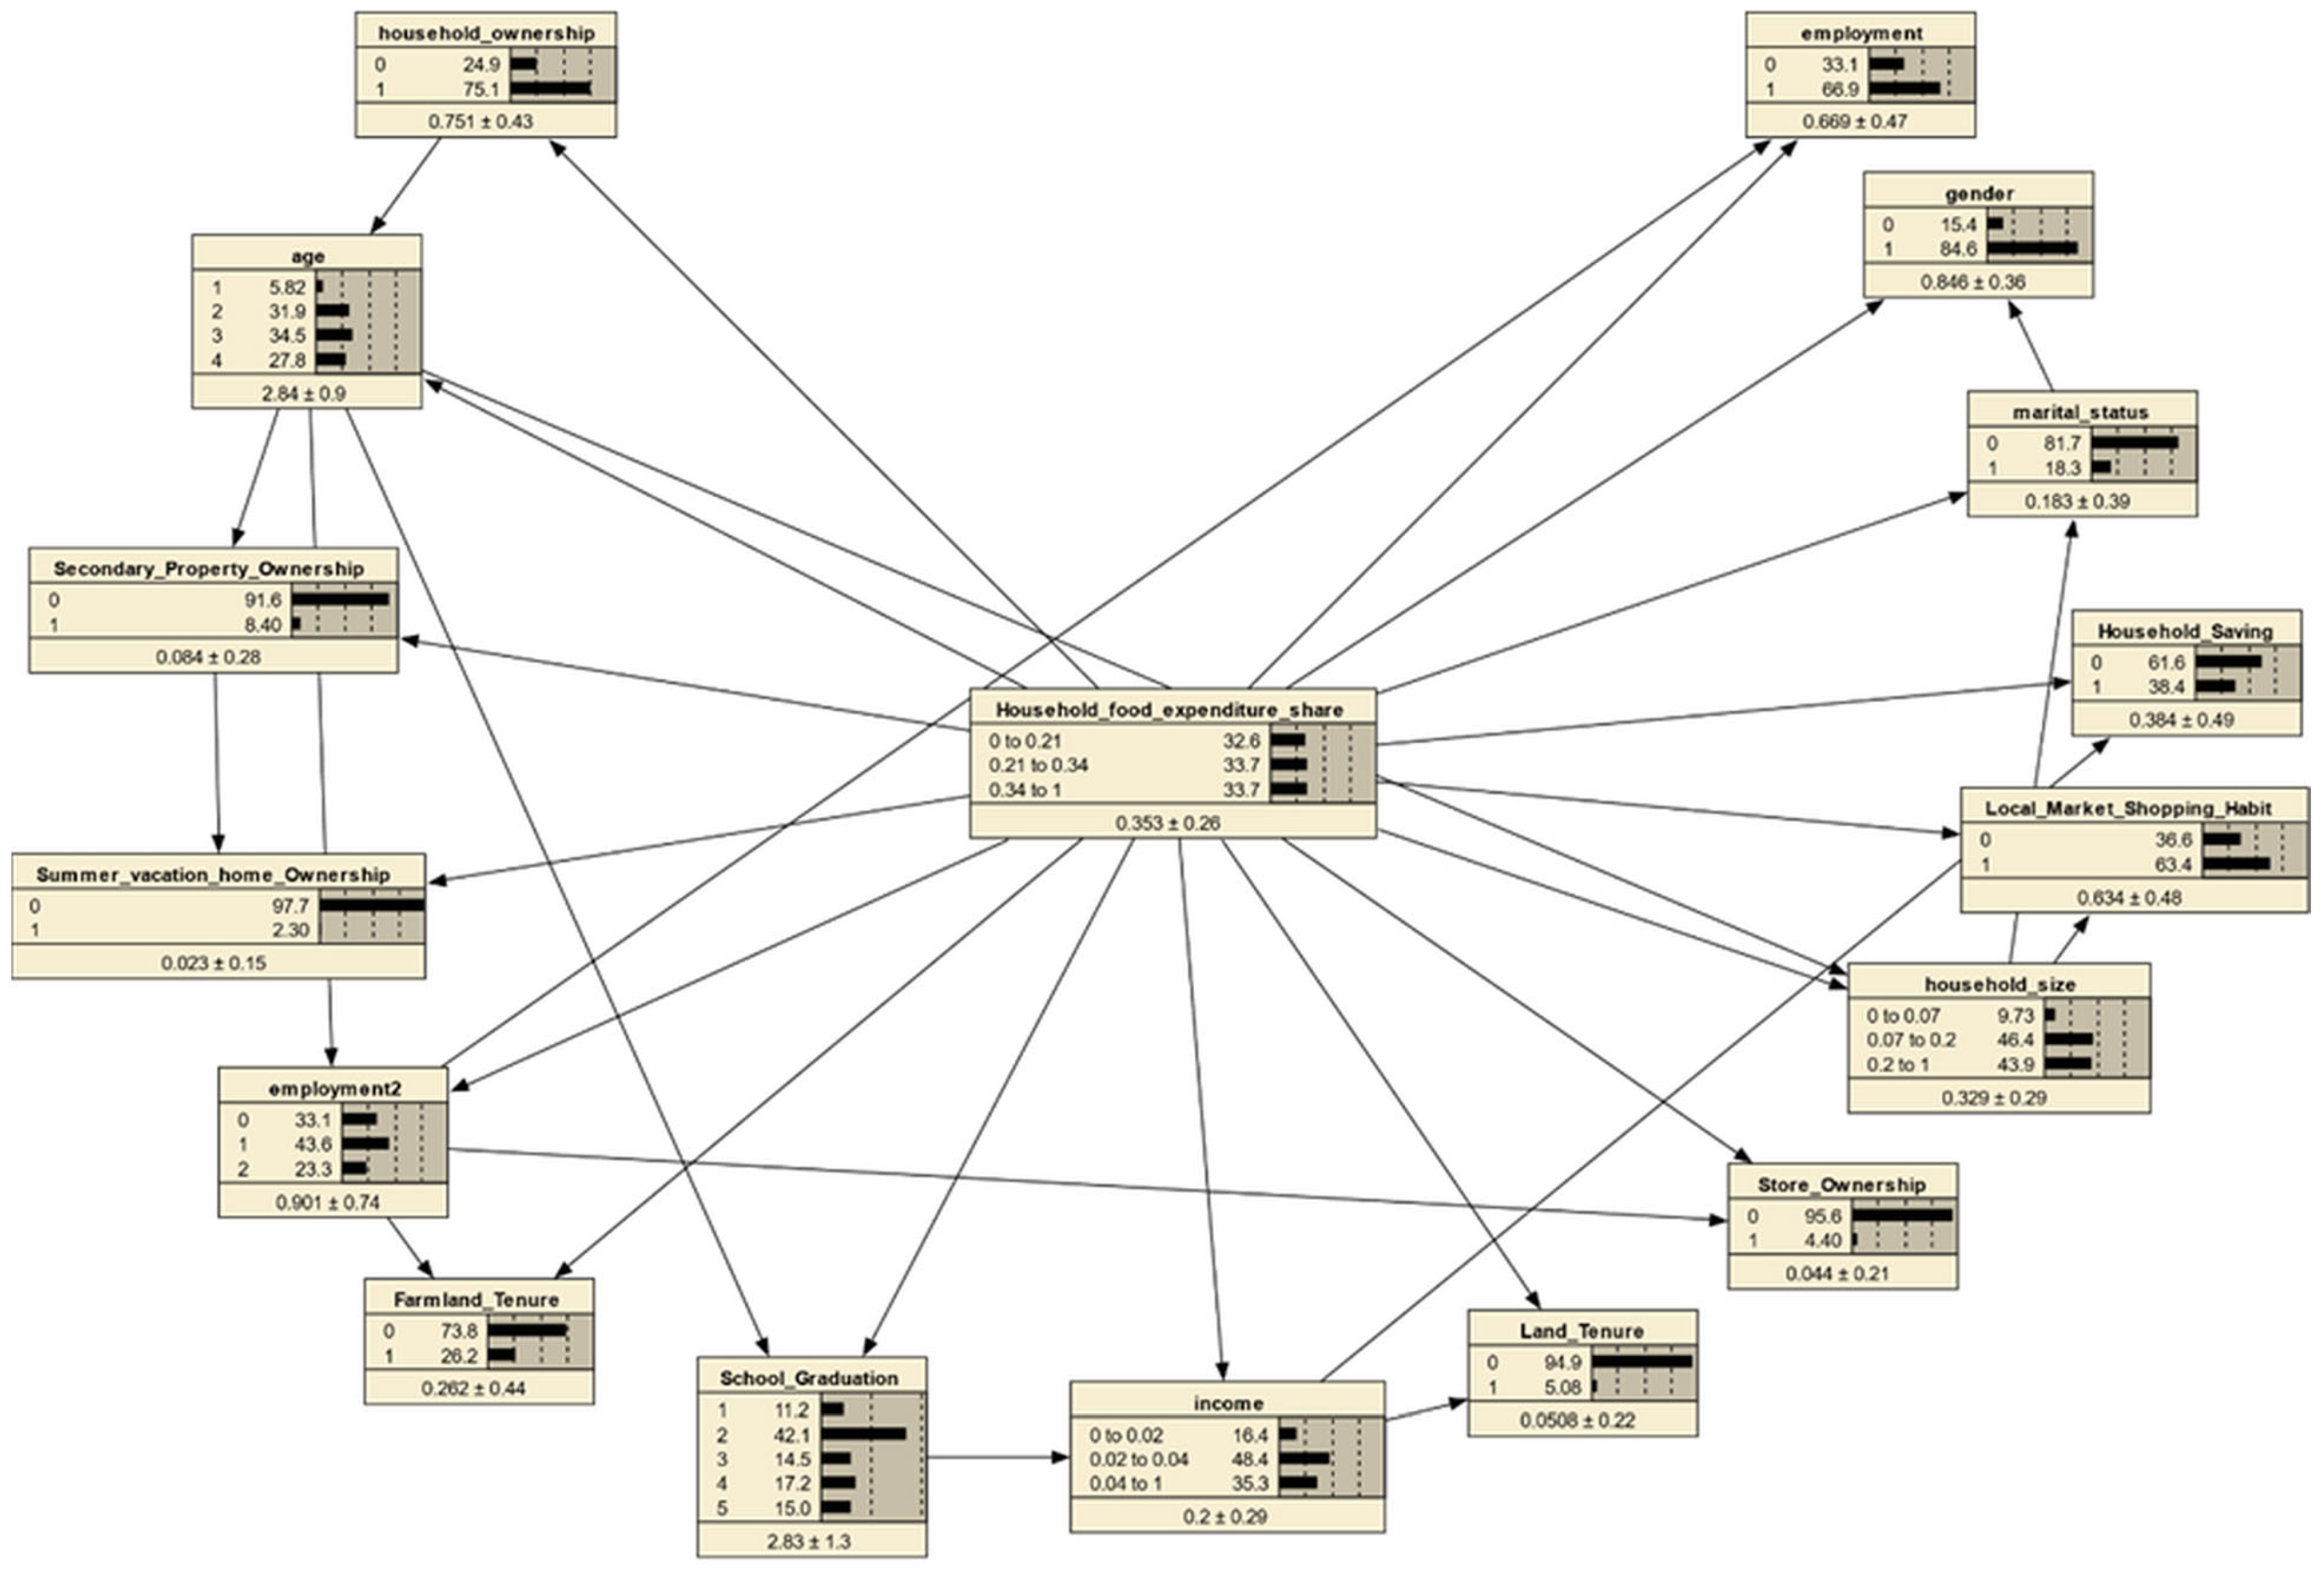
In this study, we propose the use of a Tree Augmented Bayesian Network (BN-TAN) structure. This type of tree structure allows finding the conditional probability structure among the variables while considering each variable’s direct relation with the class variable “food consumption ratio”, in our case, independently. The details of the BN-TAN algorithm can be found in [33]. The Netica software (version 6.09) was used for structure learning, and the resulting net with 18 variables is shown in Figure 2. Three different scores in Netica measured the performance of the BN-TAN. The first score is “Logarithmic Loss.” It is calculated using the natural log, which is between zero and infinity, with zero indicating the best performance. The second score that Netica produces is “Quadratic Loss” which considers both the probability predicted for the correct state and the probability predicted for each state j. It is also known as the Brier score, and is between 0 and 2, with zero being the best. The third score, “Spherical Payoff,” is between zero and one, with one being the best. For our networks, the scores were 0.97, 0.58, and 0.64, respectively.
Along with these three performance measures, in this study, we conducted a sensitivity analysis to accomplish (1) the comparison of the results with those of ANN and, in this way, verify the constructed BN and (2) investigate the effect of each variable on the “food consumption” variable. The sensitivity analysis gives us the variance reduction on the “food consumption” variable due to the given information (evidence) on the investigated variable. Table 3 presents the results of sensitivity analysis. When the sensitivity results of ANN (Table 2) were compared with the sensitivity results of BN (Table 3), it was seen that the first three variables that had the most influential effect on food consumption were the same for both the ANN and BN methods.
Food expenditure shares are discretized into tertiles to ensure a balanced distribution of observations across categories and to improve the performance and interpretability of the Bayesian Network, which operates more robustly with categorical variables. After the Bayesian Network is specified and validated, several what-if analyses, including diagnostic and predictive reasoning, can be conducted [39]. This allows the BN to be analyzed from a systems perspective by setting evidence on selected variables and observing how probability distributions adjust throughout the network. Because Bayesian Networks are acyclic graphs, these changes may involve both direct and indirect relationships. The Bayesian Network and Tree-Augmented Naïve Bayes models were estimated using Netica software (version 6.09).

3. Results

3.1. Determinants of Food Consumption Expenditure

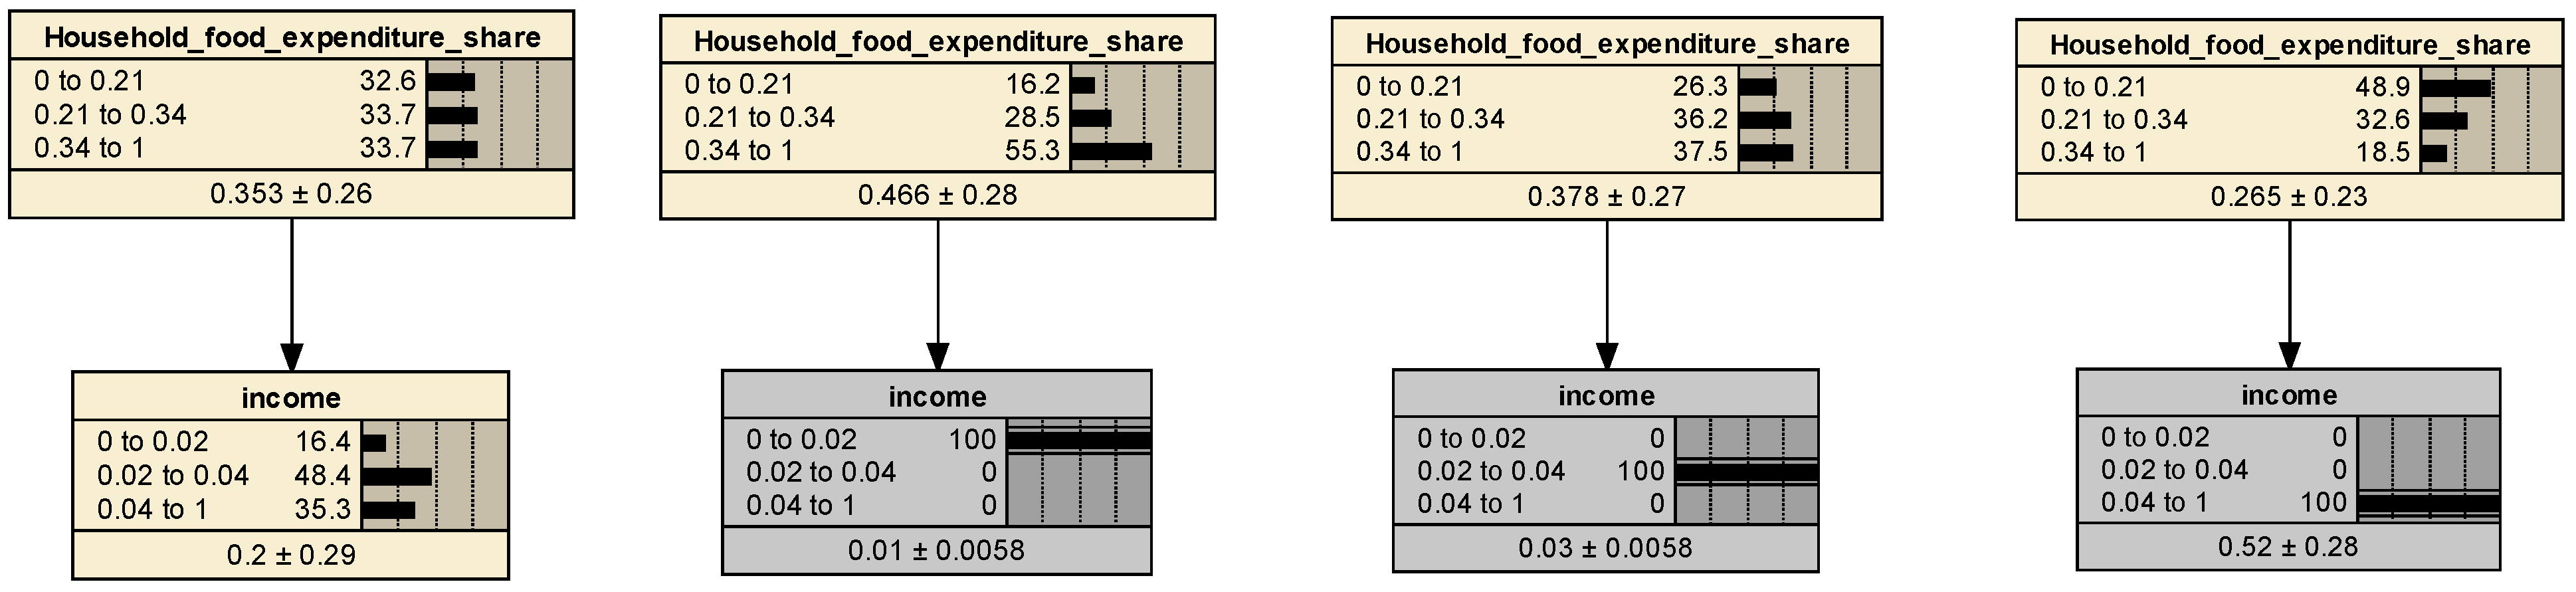
According to Central Bank of the Republic of Türkiye (CBRT) data, the average Turkish lira/US dollar exchange rate was 0.2064 in 2020, while it declined to 0.1244 in 2021 [47]. This depreciation implies that, ceteris paribus, the monthly income of households in Türkiye declined when expressed in US dollar terms. According to our analysis, if more households in Türkiye fall into the low-income group, the probability that the share of household food expenditure will be in the “high” state increases from 33.7% to 55.3%, as can be seen in Figure 3. The analysis suggests a strong association between low-income status and higher food expenditure shares. As the number of households in the low-income group increases, a larger proportion of households are likely to allocate a substantial share of their budget to food. The increase in the share of household food expenditure could result in households sacrificing other essential expenses, such as healthcare, education, and housing.
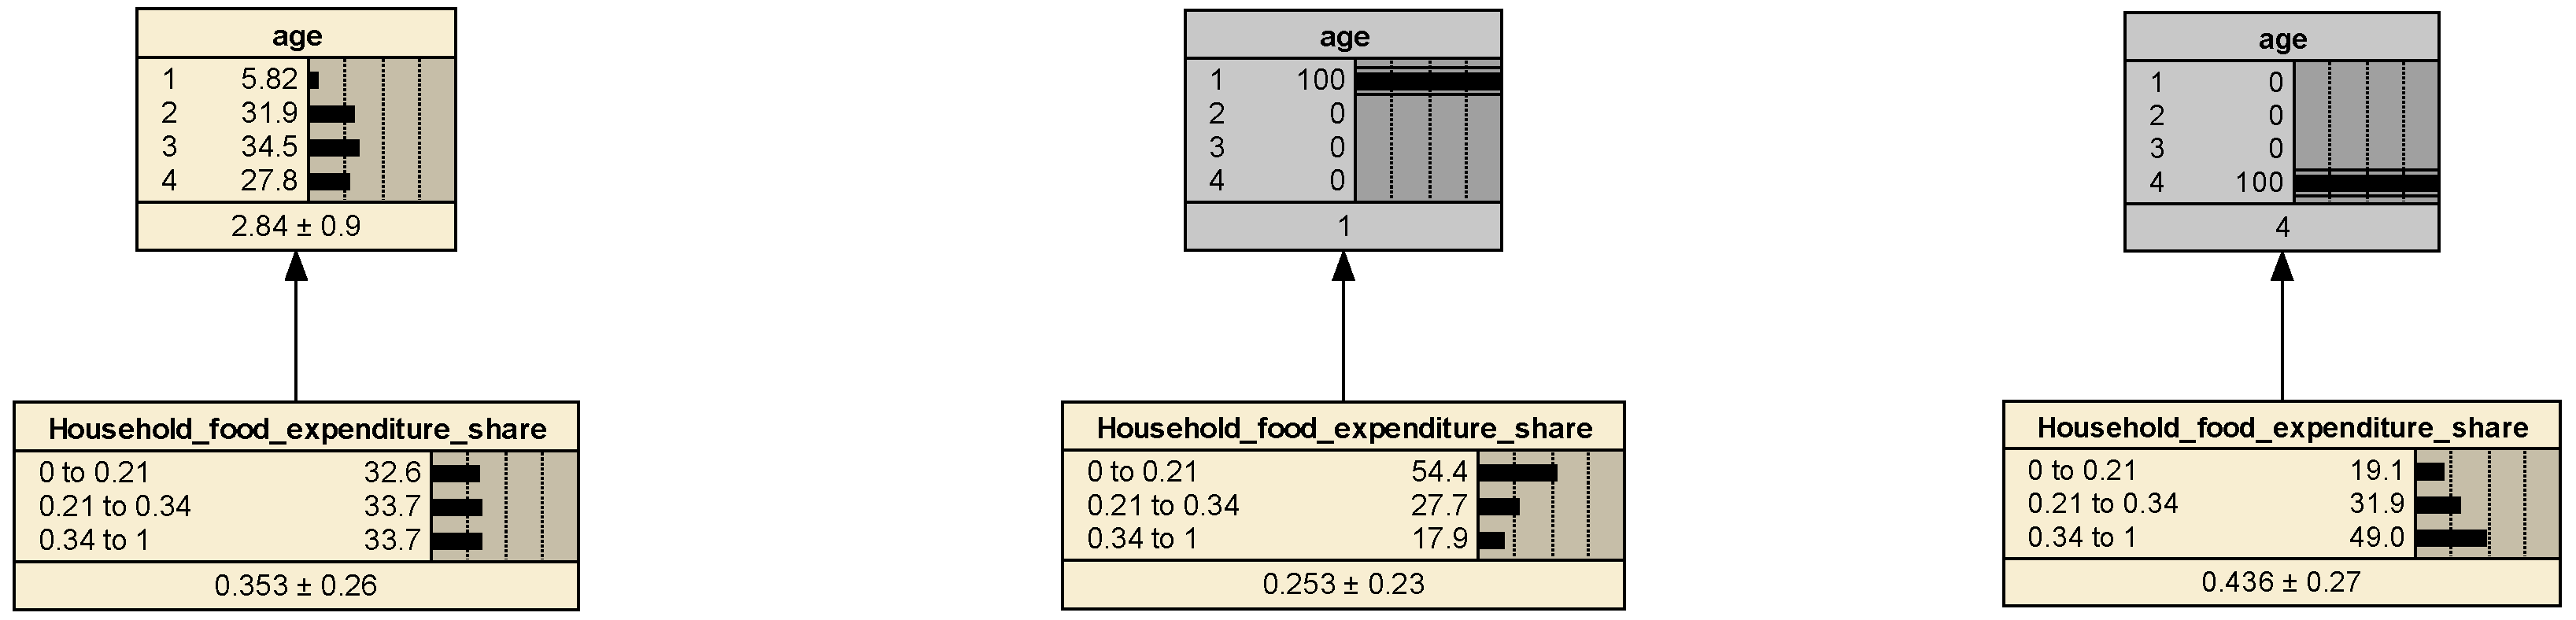
As in many parts of the world, the age of first marriage in Turkey has been increasing over the years. The age at which men first marry was 27.8 in 2018, 27.9 in 2020, and 28.3 in 2024. For women, these figures rose to 24.8 in 2018, 25.1 in 2020, and 25.8 in 2024 [48]. Depending on this trend, if the average age of the head of the family increases, the probability that the share of household food expenditure will be in the “high” state increases from 33.7% to 49.0% (Figure 4). By contrast, if the age decreases, the probability of a high share decreases to 17.9%. This may be due to several factors such as the health needs of older individuals and their dietary requirements, which could require a higher share of the household’s income to be spent on food.
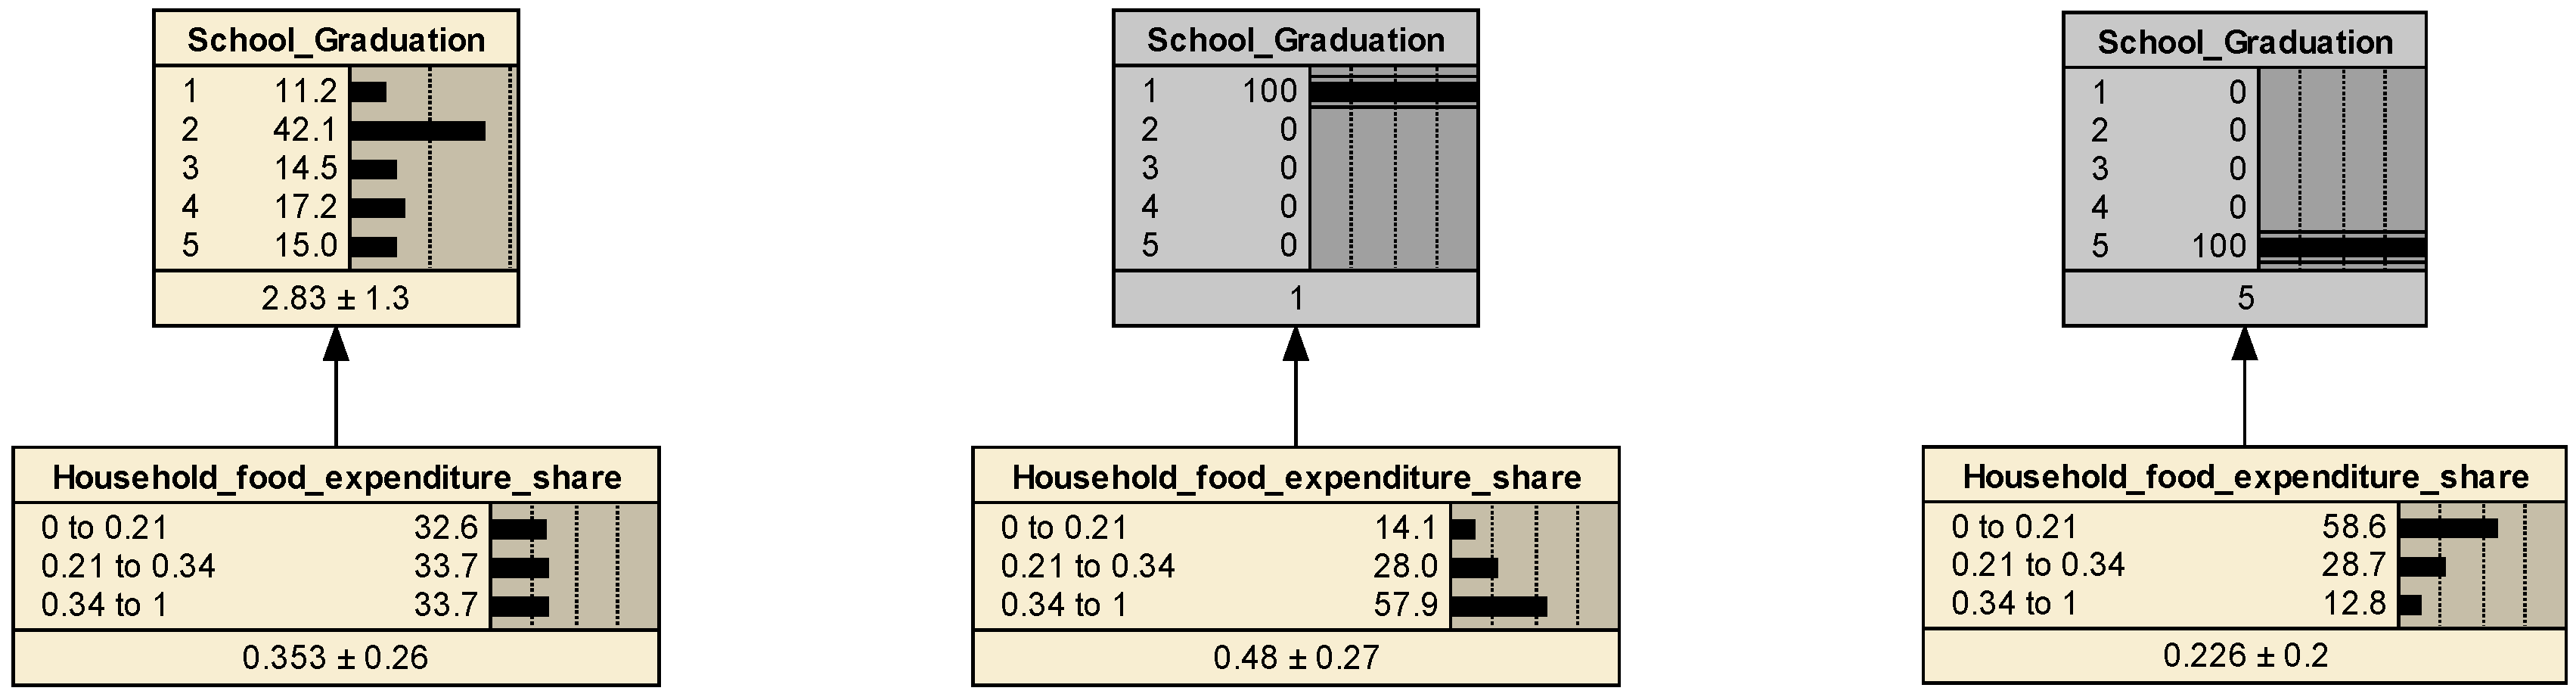
Another variable we examined was the educational level of the head of the household. Among individuals aged 25 and over, the percentage of high school graduates was 20.4% in 2018, 21.4% in 2020, and 49.4% in 2024 [49]. Similarly, the rates of university graduates in the same group in these years were 17.3% and 19%, respectively. If the education level of household heads in Türkiye also increases, the probability that the share of household food expenditure will be in “high” state decreases from 33.7% to 12.8% (Figure 5). On the other hand, if the education level decreases, the probability of a high share increases to 57.9%. This result highlights the role of education in improving the financial well-being of households, as households with more educated heads are more likely to have higher incomes and, therefore, a lower share of their income allocated to food.
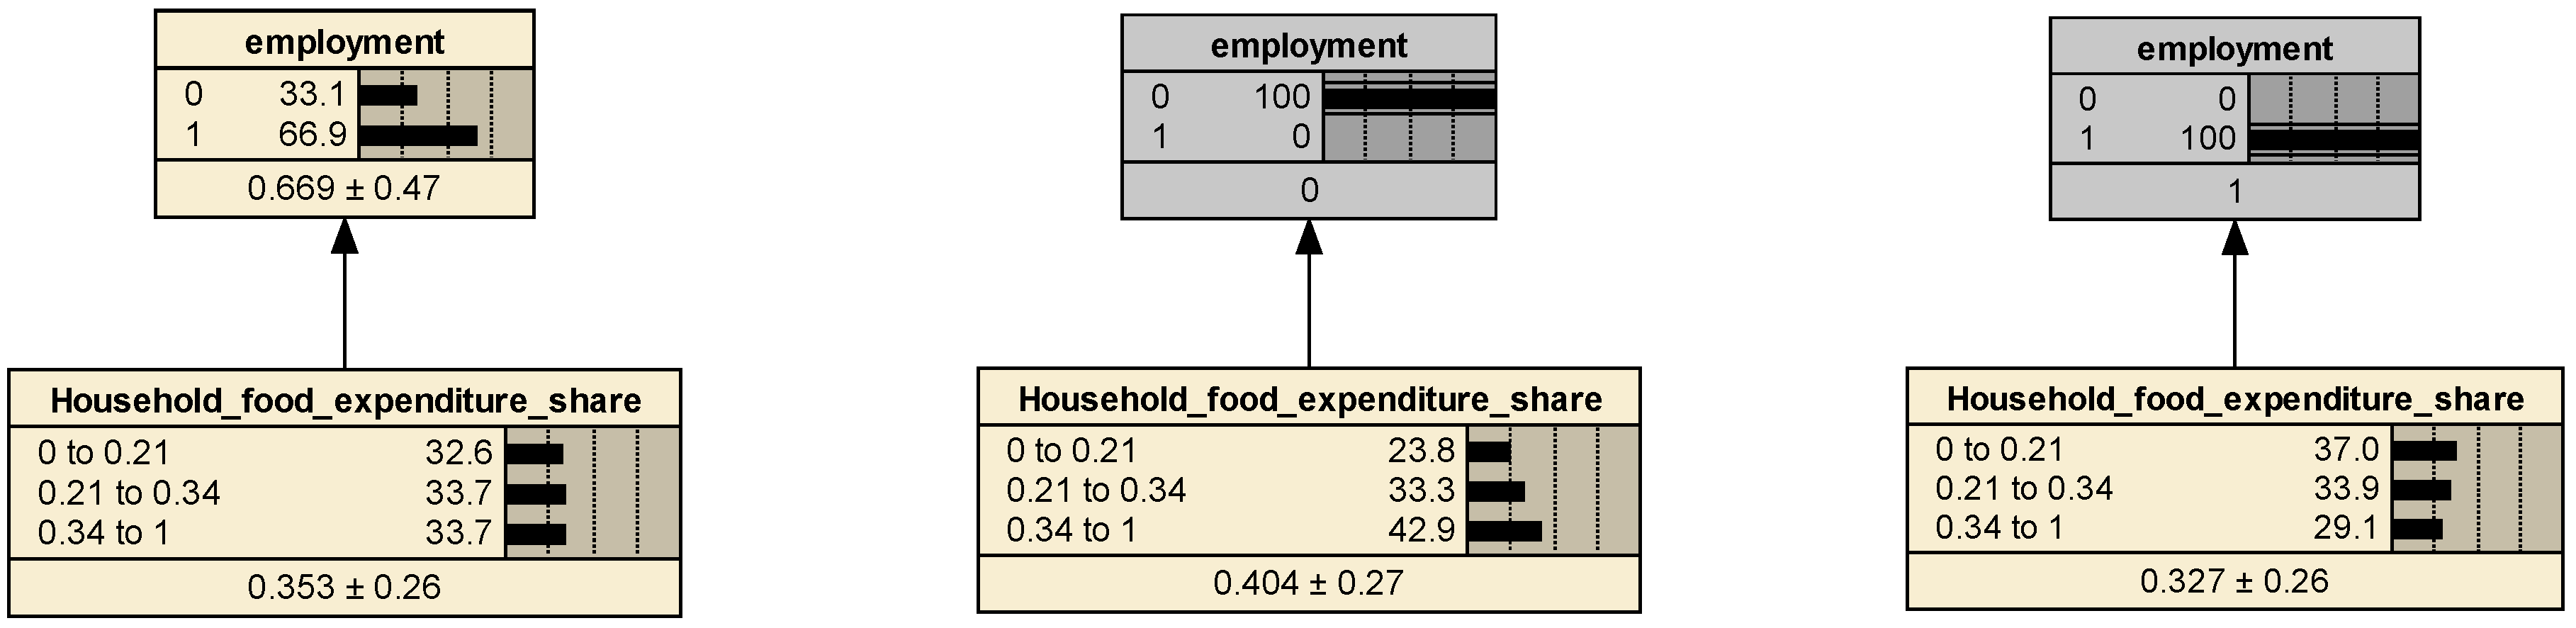
Unemployment is another important determinant of household food expenditures in Turkey. The unemployment rate, which was 11% in 2018, rose to 13.2% in 2020 and fell to 8.2% in 2024 [50]. Our analysis indicates that the rate of unemployment among household heads in Türkiye has a significant impact on the probability of a household spending a high share of its income on food. In case of an increase in the rate of unemployed among household heads in Türkiye, the probability that the share of household food expenditure will be in “high” state increases from 33.7% to 42.9% (Figure 6). By contrast, if the rate decreases, the probability of a high share decreases to 29.1%. Households with unemployed heads may face financial constraints and difficulties meeting their basic needs, including food.
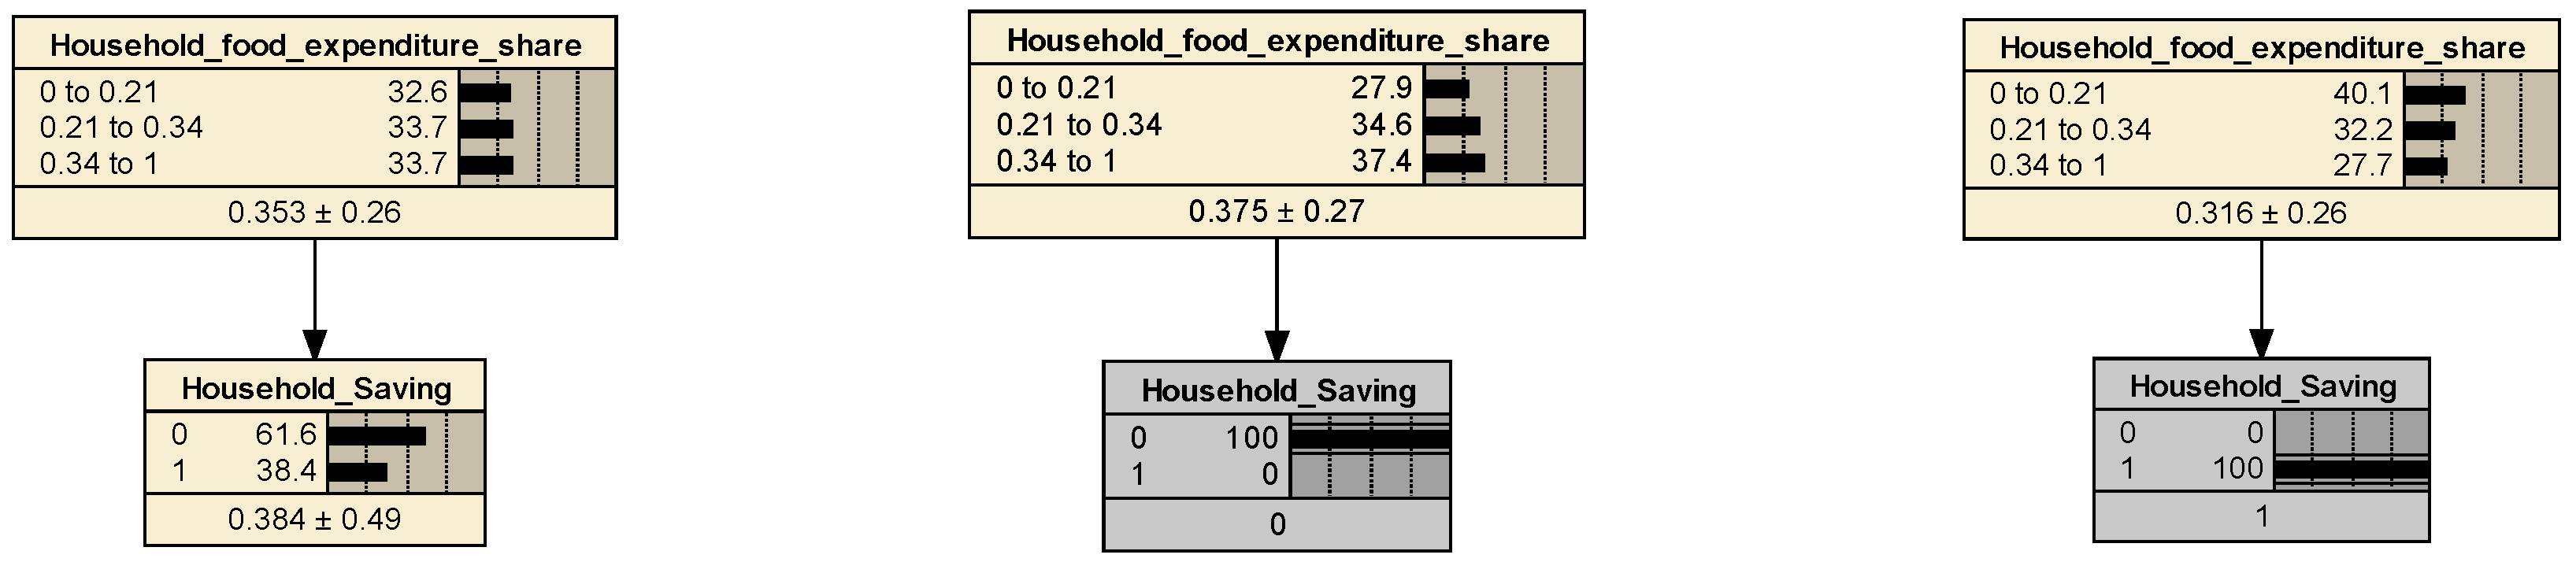
The last variable we analyze is the household savings rate. If the household saving rate in Türkiye decreases, the probability that the share of household food expenditure will be in “high” state increases from 33.7% to 37.4% (Figure 7). If the savings rate increases, the probability of a high share decreases to 27.7%.
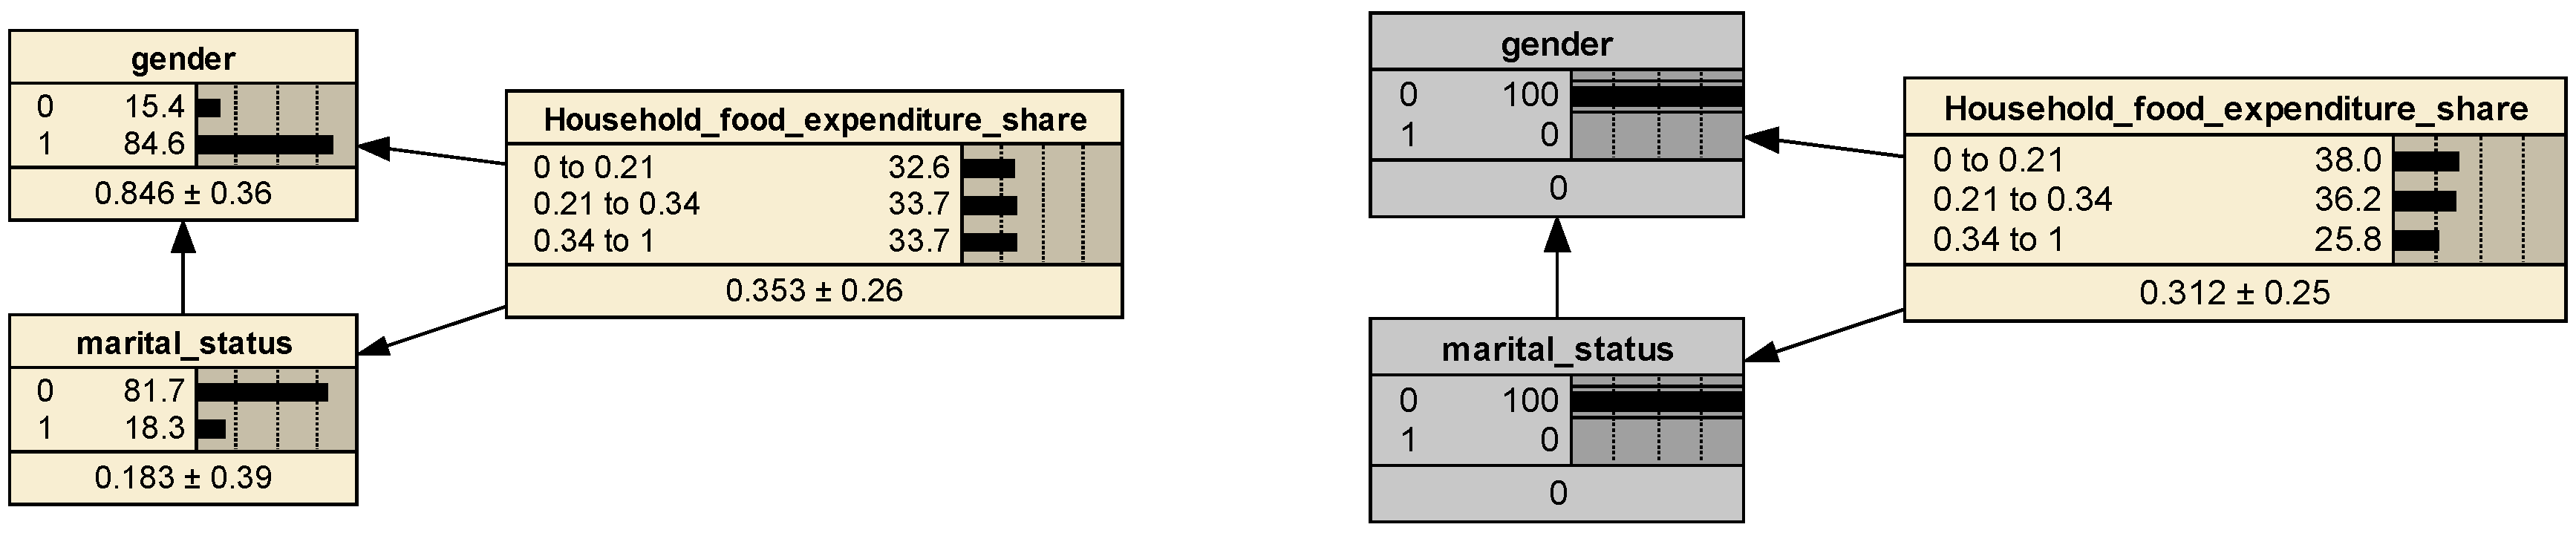
The proportion of female-headed nuclear families is increasing worldwide [26]. Many studies have examined the effects of this situation on household food consumption, particularly in developing countries [51,52]. To observe the effect of a similar trend in Türkiye, a simple what-if analysis was conducted. If the proportion of female-headed families increases the probability that the share of household food expenditure will be in “low” state increases from 32.6% to 38.0% (Figure 8).
Although the direct variance reduction associated with gender is relatively small, gender operates mainly through indirect channels mediated by income, education, and household structure within the system.

3.2. Scenario Analysis

In the Netica Software, when we determine the status of the evidence variables by setting the values of the corresponding nodes to 100%, the probabilities of the variables in the entire network are updated. Five scenarios were designed in this study. The scenario magnitudes are illustrative and are not intended to represent feasible real-world transitions; rather, they are used to highlight the direction and relative strength of system responses. Table 4 presents variables, scenarios, and results.
This study employs scenario-based analyses to examine the impact of gender, educational level, and farmland ownership on household food expenditure in Türkiye. Scenarios 1 and 2 explore the differences in food expenditure patterns between households headed by males and females. In Scenario 3, we investigated the effect of educational level on household food expenditure. In Scenario 4, we examined the impact of farmland ownership on food expenditure patterns. Finally, in Scenario 5, we analyzed the effect on food expenditure when the household head was a paid worker or owner of his/her own business. By conducting these scenario-based analyses, our study provides valuable insights into the determinants of household food expenditure and the factors influencing it. These five scenarios were chosen to generate useful information for policymakers regarding the food expenditure of specific population groups in Türkiye—such as single-person and female-headed households—whose prevalence has increased in recent years. While the poverty rate of single-person households in Türkiye was 5.2% in 2008, it increased to 10.9% in 2020 [53]. While the divorce rate in Türkiye was 1.4% in 2008, it increased to 2.1% in 2021 [54]. In Türkiye, the proportion of single-person households has been increasing each year, and within these households, the share of women—as well as the overall share of female-headed households—has also been rising [25,26]. In addition, it is known that the rural population and middle-class urban segment have significant weight in Türkiye [55].
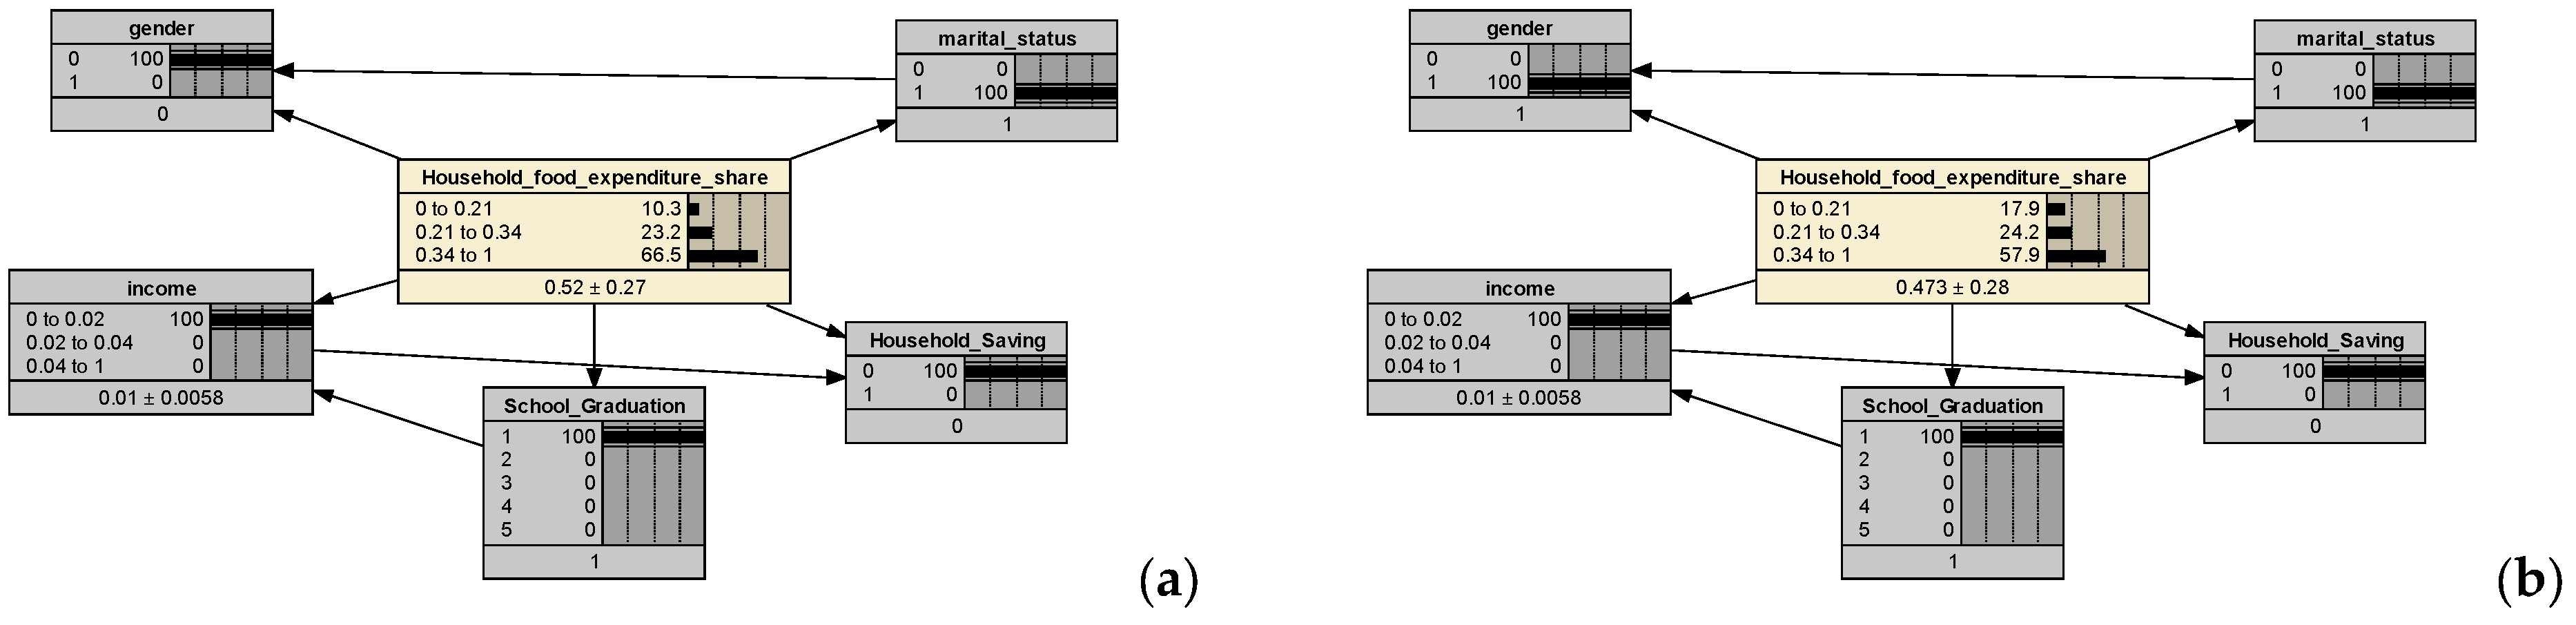
According to Scenario 1, if the household heads are single, uneducated females with low income and therefore have no savings, the probability that the share of household food expenditure will be in “high” state significantly increases from 32.6% to 66.5% as shown in Figure 9a. Under the same conditions (i.e., low income, not graduated from school, no household savings and single), if the household heads are male, the probability that the share of household food expenditure will be in “high” state will increase from 32.6% to 57.9%, instead of 66.5% (Figure 9b). This result illustrates that, under otherwise similar conditions, female-headed households face a higher probability of devoting a large share of their budget to food.
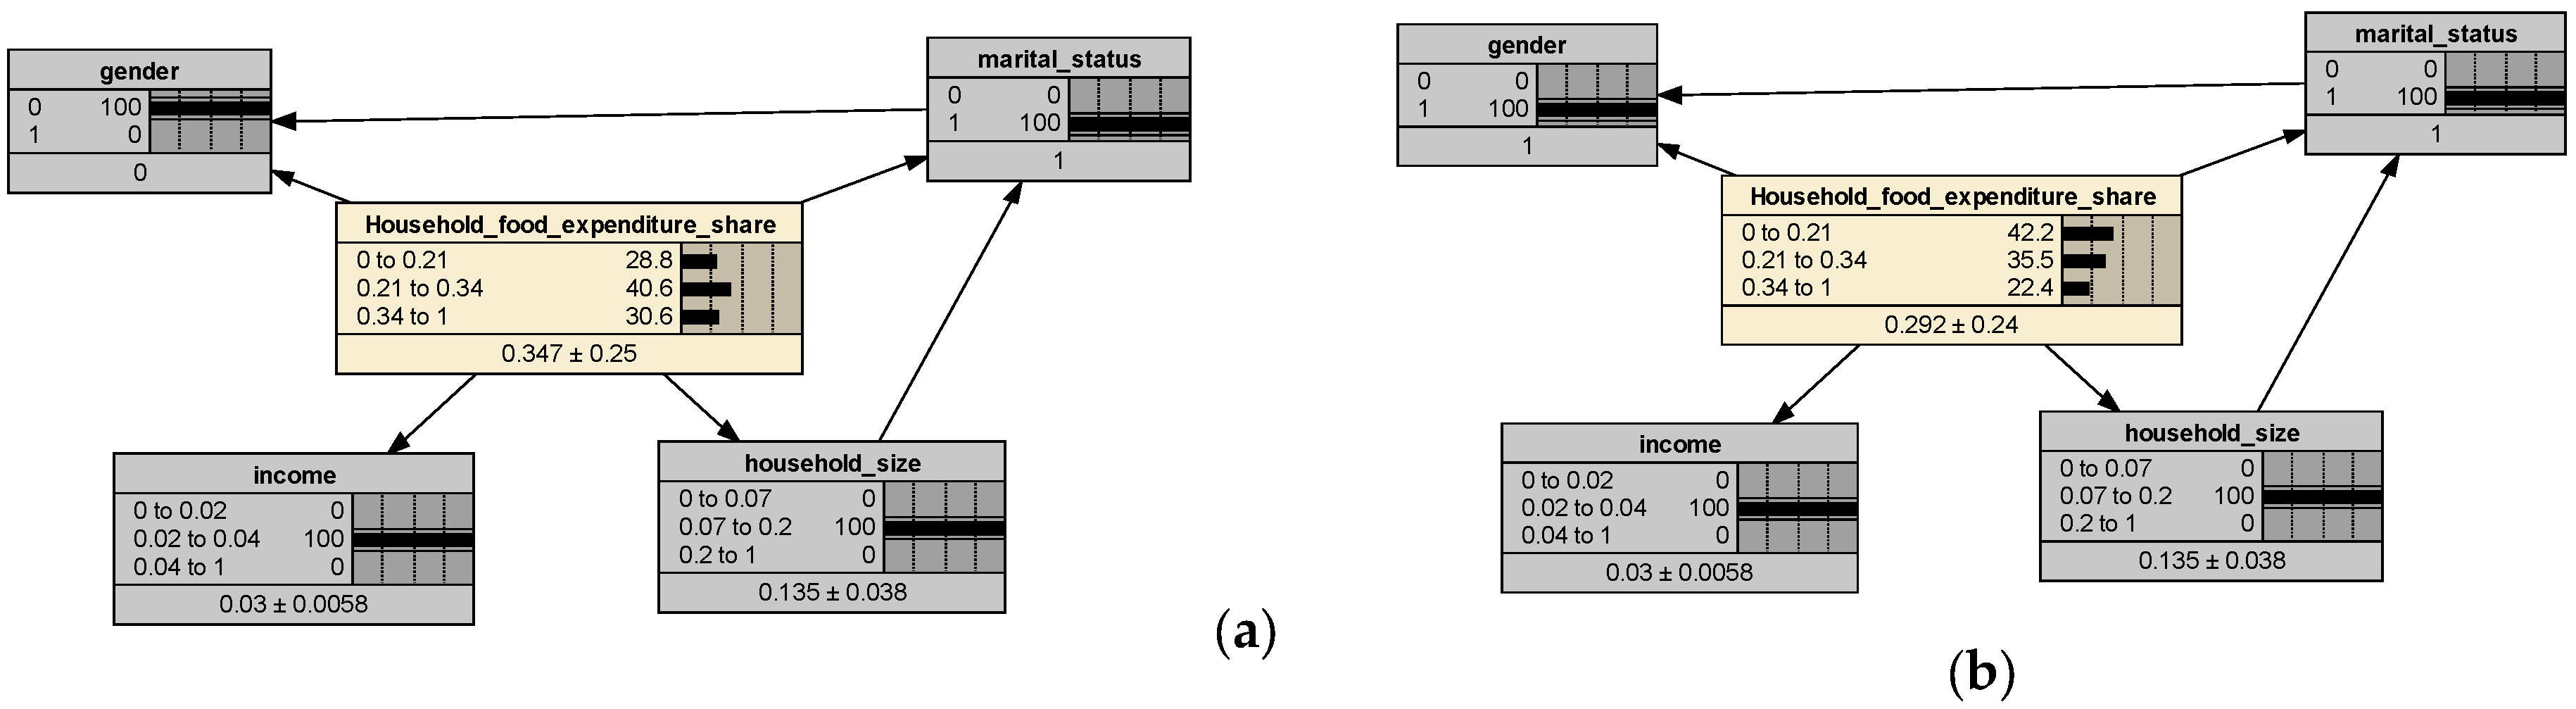
In Scenario 2, if the household heads are single females with middle-income in a middle-sized family, the probability that the share of household food expenditure will be in “high” state will decrease from 33.7% to 30.6%, as shown in Figure 10a. If the gender variable changes to male in the same scenario (i.e., single, middle household size, and middle income), the same probability will decrease to 22.4% (Figure 10b). This result also shows the effect of gender on food expenditure.
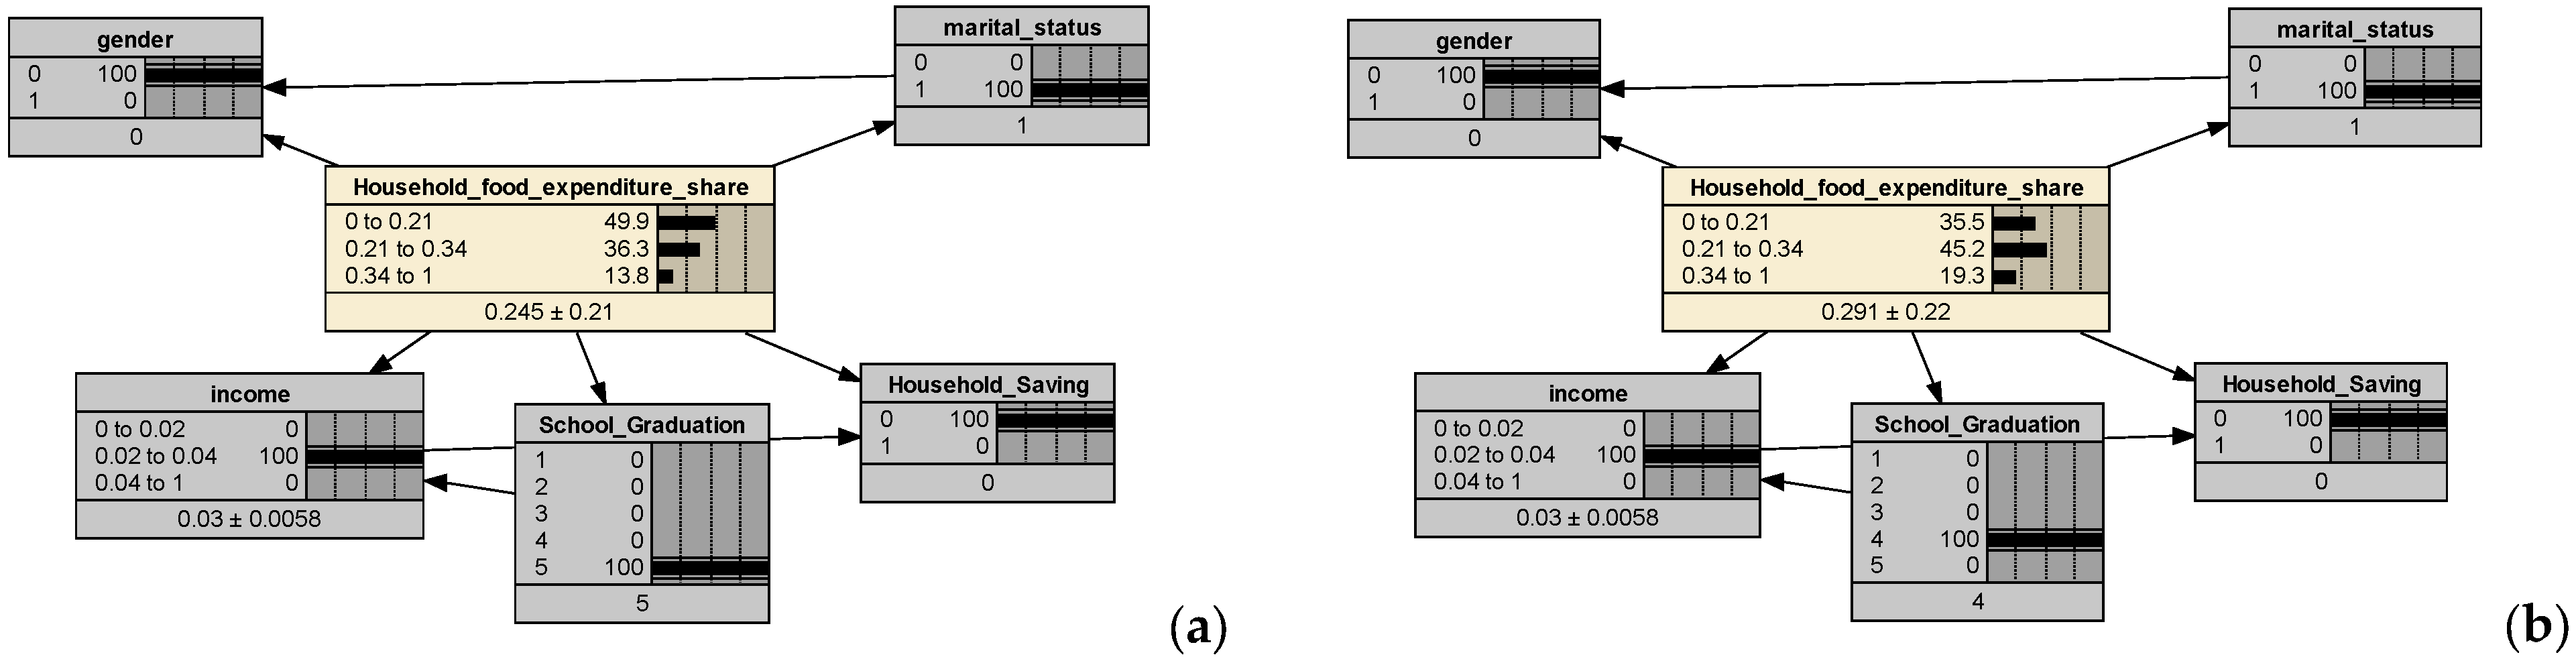
Scenario 3 examines household heads who are single females with a middle-income but do not have any budget for savings. If these household heads are university graduates, the probability that the share of household food expenditure will be in “high” state de-creases from 33.7% to 13.8%, as shown in Figure 11a. On the other hand, if these house-hold heads are high school graduates, the probability will decrease from 33.7% to 19.3%, instead of 13.8% (Figure 11b). This result shows the effect of educational level differences on food expenditure.
Previous studies have shown that a gender gap in food insecurity results in women having a higher probability of being food insecure [29]. Numerous studies have investigated the link between gender and food insecurity, with most reporting that being a woman increases the likelihood of suffering from food insecurity. However, this study differs from previous research in that it examined the relationship between food consumption and gender. Our findings demonstrate that having a female household head increases the probability of having a high food expenditure share, which is consistent with Engel’s law. This study provides new insights into the relationship between gender, food consumption, and poverty, highlighting the importance of gender in understanding household food consumption patterns.
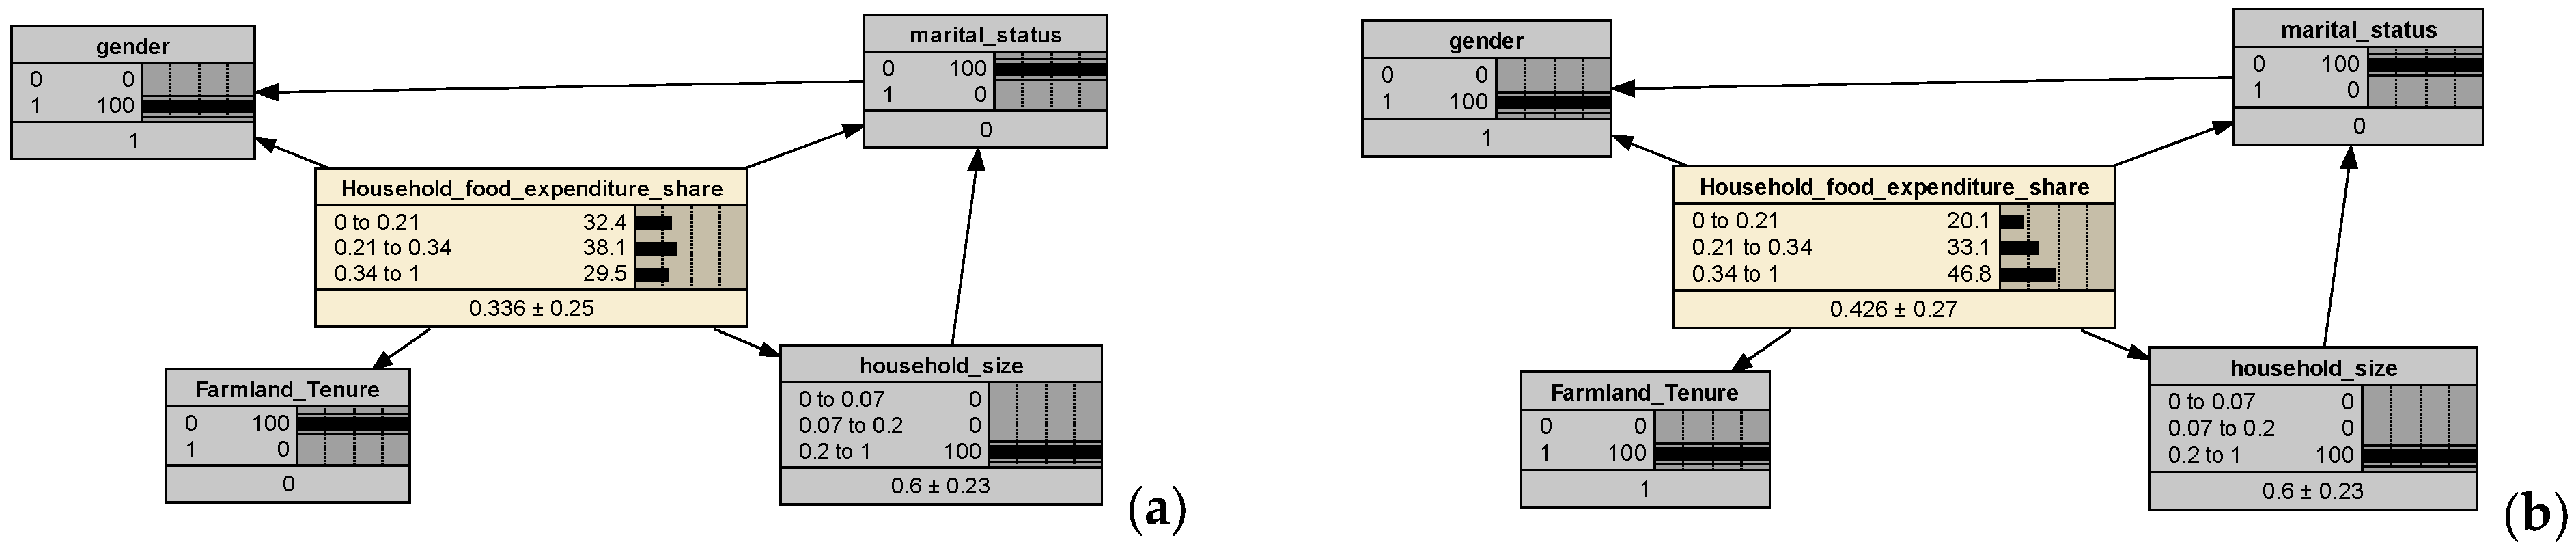
According to Scenario 4, if the household heads are married males who own farmland and live in a crowded family, the probability that the share of household food expenditure will be in the “high” state decreases from 33.7% to 29.5%, as shown in Figure 12a. In the same scenario (i.e., male, married, and large household size), if the household heads do not own farmland, the probability will increase to 46.8% (Figure 12b). This result shows the effect of farmland ownership differences on food expenditures.
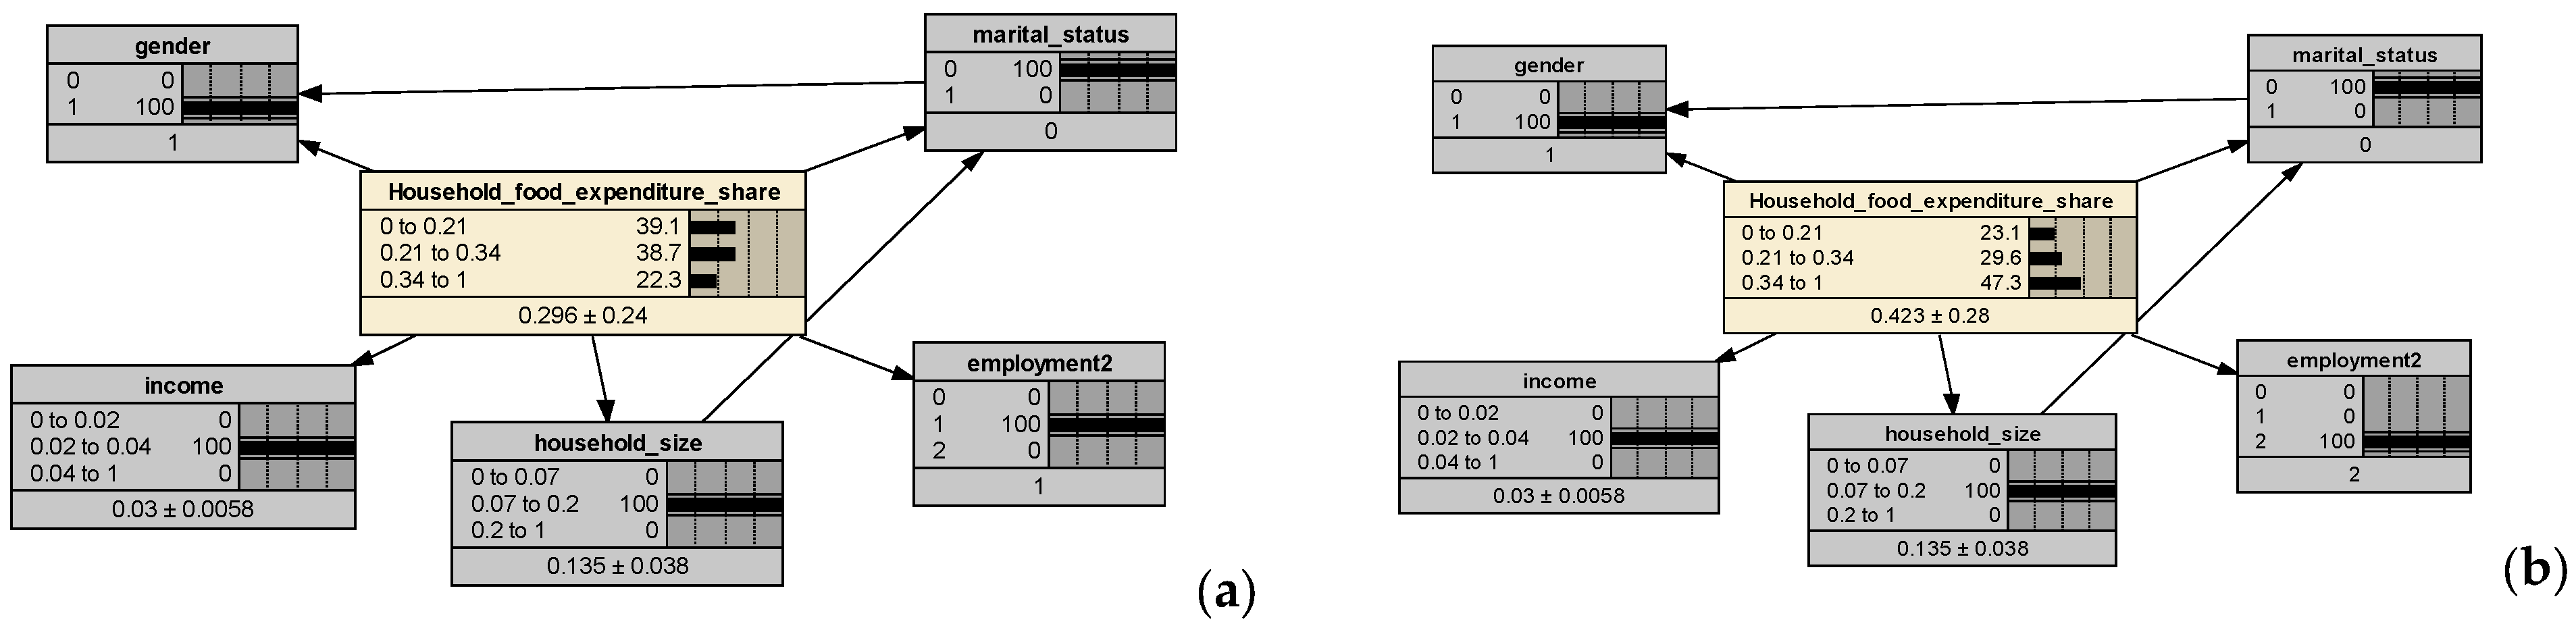
In Scenario 5, if the household heads are married male employees with middle in-come living in a middle-sized family, the probability that the share of household food expenditure will be in the “high” state decreases from 33.7% to 22.3% (Figure 13a). Under the same demographic and income conditions, if the household heads run their own businesses instead of being employees, this probability increases from 33.7% to 47.3% (Figure 13b). This result suggests that business ownership, compared with paid employment, may increase income volatility and the likelihood of allocating a high share of the budget to food.

4. Discussion

This study contributes to the literature by proposing an integrated methodology that utilizes ANN and BN methods with household survey data. Based on these results, we can conclude that if the probability of being in a low-income family increases, the share of food expenditure in the household budget also increases. That result is in line with Engel’s law, which states that poorer households allocate a larger proportion of their total expenditure to food than wealthier households. It is essential to recognize that an increase in the share of household food expenditure may also signal decline in the quality and nutritional value of the food consumed by households. Low-income households may not have the financial means to purchase nutrient-dense foods.
Gender disparities are evident in food expenditure, with a notable effect observed among low-income households headed by a single, uneducated individual. Specifically, the probability of higher food expenditure shares is more pronounced for females than for males in this demographic group. On the other hand, the probability of household food expenditure shares for middle-income households with a middle-sized family, headed by a single household member, decreases more for males than for females. According to Engel’s law, households that allocate a relatively larger share of their budget to food compared with other expenditures can be considered poorer. This result can be interpreted as single mothers being disadvantaged compared to single dads. This implication does not apply only to single-mother households but more broadly to female-headed households. The common per-capita-based poverty measurements disregarded the composition of families, such as FHHs and MHHs, which resulted in underestimating the incidence of poverty in FHHs [19,35]. Jayasinghe and Smith [19] found that the incidence of poverty is higher among FHHs. In addition, according to Brown and van de Walle [35], welfare is related to the gender of the head, and marital status and heterogeneity in household demographics are ignored. Considering these confounding factors, they revealed that female-headed households were poorer than male-headed households (MHHs) [56]. As Kroshus [57] emphasized, proportionate per capita household expenditure on commercially prepared food varies by marital status and gender.
If the unemployment rate increases and savings decrease, the share of food expenditure in the household budget also tends to increase [36]. Mowlaei and Intezar [58] also show that the effect of activity status (employment status) on household food expenditure is significant. Education level differences also have an effect on food expenditure. For instance, when the education level increases, the share of food expenditure in the household budget decreases. Venn et al. [59] found that more educated, wealthier, and less disadvantaged households spend a smaller proportion of their total household food budget on processed foods, and wealthy households devote a smaller portion of their food budget to unprocessed foods. This result can be interpreted as evidence that higher educational attainment increases the likelihood of accessing better-paid jobs, thereby raising household income. More specifically, among middle-income households without savings and headed by a single female, the probability of having a high food expenditure share is lower for university graduates than for high school graduates. Göktolga et al. [60] and Rae [61] found similar results when considering individuals’ educational levels.
Our analysis reveals that household food expenditures are influenced by various factors. According to our findings, households with larger household sizes, those living in rural areas, and those owning agricultural land have lower food expenditures compared to households without agricultural land [62]. This finding is consistent with the literature, which shows that farmers’ land ownership and adaptation to sustainable agricultural technologies contribute positively to household welfare [63,64]. According to our analysis results, married, working, middle-income, medium-sized households headed by men spend proportionally less on food than households headed by women. Furthermore, household size and shopping habits also negatively affect the share of household food expenditures. These findings are consistent with the literature, which shows that multiple factors must be considered to understand household food expenditures [9,19,27,29,35].
Regional context matters in Türkiye, and the same variable can “work” differently depending on local labor markets, settlement patterns, and the urban–rural mix [25,27,55]. Earlier evidence already points in this direction: comparative work for Türkiye emphasizes that socio-economic drivers of food spending are not uniform across population segments, while broader studies underline that geography itself is a key layer shaping food expenditure profiles [27,32,59,61]. Against that backdrop, our system model should be read as a national baseline—an aggregate picture of conditional dependencies—rather than a claim that determinants carry identical weights in every part of the country [33,34,39]. This is also why policy implications drawn from the model are best interpreted through a regional lens, and a natural next step is to re-estimate the ANN–BN framework on TURKSTAT’s statistical regions and/or rural–urban partitions, where sample sizes allow, to make the heterogeneity visible in the same probabilistic language [34,39,44,55,65]. The exclusive focus on Türkiye reflects its specific institutional setting, labor-market structure, and household composition, which limit the direct comparability of the results with European welfare regimes.
Differences across results primarily reflect the distinction between direct effects captured in variance reduction metrics and indirect effects that emerge through conditional dependencies. In this sense, variables such as education and income appear dominant in isolation, while gender becomes salient when combined with structural household constraints.

5. Conclusions

This study examines household food expenditure in Türkiye by focusing on how eco-nomic and demographic conditions interact rather than operate in isolation. Based on microdata from the 2018 Household Budget Survey, the analysis follows a two-stage framework. Artificial Neural Networks are used to capture non-linear patterns, while a Tree-Augmented Bayesian Network is employed to examine probabilistic relationships and counterfactual scenarios.
Results from both analytical stages point to income, education, and age as the most influential factors shaping household food expenditure shares, while employment, savings capacity, and asset ownership further shaped household outcomes through conditional dependencies. The BN-TAN results show that shifts toward low-income status substantially raise the probability of a high food expenditure share, reinforcing Engel’s law in a system-based setting. Gender reinforces existing disadvantages within the household system, particularly when households face more than one source of vulnerability: under otherwise similar constraints, female-headed households—especially those that are single, have low education, and lack savings—face a higher likelihood of devoting a large share of their budget to food. Scenario analyses clarify that vulnerability is not driven by one factor in isolation; rather, it intensifies when disadvantages accumulate (e.g., low income combined with weak human capital, unstable labor-market attachment, and limited asset buffers). The findings also suggest that productive assets—such as farmland ownership in relevant household profiles—can materially alter consumption pressure, indicating that asset position matters alongside current income.
Taken together, these results indicate that gender differences in household food expenditure should be understood as the outcome of interacting constraints rather than the effect of a single dominant variable. The system perspective adopted in this study helps explain why similar income levels may translate into different consumption pressures depending on household composition, labor-market attachment, and asset position. This reading also clarifies why the analysis relies on a pre-pandemic baseline year and why the estimated relationships should be interpreted as a national reference structure rather than a region-specific ranking of determinants. In this sense, the main contribution of the study lies not only in identifying vulnerable household profiles, but in showing how gendered vulnerability emerges from the structure of everyday economic decisions.
These findings have direct implications for food security policy. Measures limited to price interventions or short-run transfers may be insufficient when vulnerability is generated by interacting constraints. Policies that strengthen stable employment, expand human capital, and support savings and asset accumulation—while explicitly recognizing gendered exposure to risk—are more consistent with the system dynamics observed here. The findings therefore do not suggest that gender is a dominant standalone determinant, but rather a conditioning factor that shapes vulnerability pathways within the household system. Rather than testing sharp null hypotheses, this study evaluates whether gender functions as a dominant standalone determinant or as a conditioning factor within the household system; the empirical evidence supports the latter interpretation.
Several limitations should be noted. The analysis is cross-sectional and focused on a single pre-pandemic year; it does not identify causal effects, nor does it fully incorporate regional price variation, nutritional quality, or climate-related shocks. Future research should extend the framework to multi-year data, integrate food price and shock indicators, and examine how policy interventions propagate through the household system over time.

Author Contributions

Conceptualization, B.Ö.; methodology, Ş.Ö.E.; software, Ş.Ö.E.; validation, B.Ö., Ş.Ö.E. and I.T.; formal analysis, Ş.Ö.E.; investigation, B.Ö.; resources, B.Ö.; data curation, B.Ö. and Ş.Ö.E.; writing—original draft preparation, B.Ö.; writing—review and editing, B.Ö., I.T.; visualization, B.Ö. and Ş.Ö.E.; supervision, Ş.Ö.E. and I.T.; project administration, B.Ö., Ş.Ö.E. and I.T. All authors have read and agreed to the published version of the manuscript.

Funding

This research received no external funding.

Institutional Review Board Statement

Not applicable. This study did not involve human or animal experiments and used only publicly available, anonymized data sources.

Informed Consent Statement

Not applicable. It is asserted that all data utilized in this study were obtained from publicly available sources.

Data Availability Statement

The data that support the findings of this study are available from the corresponding author upon reasonable request.

Acknowledgments

We are very grateful to Püren VEZİROĞLU BİÇER for very helpful advice on various sections of this paper. During the preparation of this manuscript, the authors used ChatGPT 5.0 for the purposes of English readability, grammar consistency, and structural clarity of the manuscript. The authors have reviewed and edited the output and take full responsibility for the content of this publication.

Conflicts of Interest

The authors declare no conflicts of interest.

References

  1. Diehl, J.A.; Oviatt, K.; Chandra, A.J.; Kaur, H. Household Food Consumption Patterns and Food Security among Low-Income Migrant Urban Farmers in Delhi, Jakarta, and Quito. Sustainability 2019, 11, 1378. [Google Scholar] [CrossRef]
  2. Gilbert, C.L.; Morgan, C.W. Food price volatility. Philos. Trans. R. Soc. B Biol. Sci. 2010, 365, 3023–3034. [Google Scholar] [CrossRef] [PubMed]
  3. Cuesta, J.; Htenas, A.; Tiwari, S. Monitoring global and national food price crises. Food Policy 2014, 49, 84–94. [Google Scholar] [CrossRef]
  4. Verpoorten, M.; Arora, A.; Stoop, N.; Swinnen, J. Self-reported food insecurity in Africa during the food price crisis. Food Policy 2013, 39, 51–63. [Google Scholar] [CrossRef]
  5. Torres Munguía, J. Identifying Gender-Specific Risk Factors for Income Poverty across Poverty Levels in Urban Mexico: A Model-Based Boosting Approach. Soc. Sci. 2024, 13, 159. [Google Scholar] [CrossRef]
  6. Gundersen, C.; Hake, M.; Dewey, A.; Engelhard, E. Food Insecurity during COVID-19. Appl. Econ. Perspect. Policy 2021, 43, 153–161. [Google Scholar] [CrossRef]
  7. Mueller, V.; Grépin, K.A.; Rabbani, A.; Navia, B.; Ngunjiri, A.S.W.; Wu, N. Food insecurity and COVID-19 risk in low- and middle-income countries. Appl. Econ. Perspect. Policy 2022, 44, 92–109. [Google Scholar] [CrossRef]
  8. Codjia, C.O.; Saghaian, S.H. Determinants of Food Expenditure Patterns: Evidence from U.S. Consumers in the Context of the COVID-19 Price Shocks. Sustainability 2022, 14, 8156. [Google Scholar] [CrossRef]
  9. Chai, A.; Moneta, A. Retrospectives: Engel Curves. J. Econ. Perspect. 2010, 24, 225–240. [Google Scholar] [CrossRef]
  10. Ayyıldız, B.; Erdal, G.; Çiçek, A.; Ayyıldız, M. Factors Influencing Rural Youth’s Tendency to Stay in Agriculture in Türkiye. Sustainability 2025, 17, 3313. [Google Scholar] [CrossRef]
  11. Öztornaci, B.; Şengül, H. Impact of social expenditures on multi-dimensional poverty in Turkey. New Medit. 2023, 22, 145–161. [Google Scholar] [CrossRef]
  12. Delgado, M.A.; Miles, D. Household characteristics and consumption behaviour: A nonparametric approach. Empir. Econ. 1997, 22, 409–429. [Google Scholar] [CrossRef]
  13. Lund, P.J.; Derry, B. Household food consumption: The influence of household characteristics. J. Agric. Econ. 1985, 36, 41–58. [Google Scholar] [CrossRef]
  14. Cheteni, P.; Khamfula, Y.; Mah, G. Exploring Food Security and Household Dietary Diversity in the Eastern Cape Province, South Africa. Sustainability 2020, 12, 1851. [Google Scholar] [CrossRef]
  15. Buvinić, M.; Gupta, G.R. Female-Headed Households and Female-Maintained Families: Are They Worth Targeting to Reduce Poverty in Developing Countries? Econ. Dev. Cult. Change 1997, 45, 259–280. [Google Scholar] [CrossRef]
  16. Fitzgerald, J.M.; Ribar, D.C. Transitions in welfare participation and female headship. Popul. Res. Policy Rev. 2004, 23, 641–670. [Google Scholar] [CrossRef][Green Version]
  17. Wondimu, H.; Delelegn, W.; Dejene, K. What do female-headed households’ livelihood strategies in Jimma city, South west Ethiopia look like from the perspective of the sustainable livelihood approach? Cogent Soc. Sci. 2022, 8, 2075133. [Google Scholar] [CrossRef]
  18. Amarante, V.; Colacce, M.; Scalese, F. Poverty and gender in Latin America: How far can income-based measures go? J. Int. Dev. 2022, 34, 109–129. [Google Scholar] [CrossRef]
  19. Jayasinghe, M.; Smith, C. Poverty Implications of Household Headship and Food Consumption Economies of Scales: A Case Study from Sri Lanka. Soc. Indic. Res. 2021, 155, 157–185. [Google Scholar] [CrossRef]
  20. Timsina, P.; Chaudhary, A.; Sharma, A.; Karki, E.; Suri, B.; Brown, B. Necessity as a driver in bending agricultural gender norms in the Eastern Gangetic Plains of South Asia. Int. J. Agric. Sustain. 2023, 21, 2247766. [Google Scholar] [CrossRef]
  21. Zingwe, D.E.; Manja, L.P.; Chirwa, E.W. The effects of engendered intra-household power dynamics on household food security and nutrition in Malawi. J. Gend. Stud. 2023, 32, 167–185. [Google Scholar] [CrossRef]
  22. Ede’O, A.Z.; Ketebo, J.H.; Chala, B.W. Feminization of multi-dimensional urban poverty in sub-Saharan Africa: Evidence from selected countries. Afr. Dev. Rev. 2020, 32, 632–644. [Google Scholar] [CrossRef]
  23. Kpoor, A. Assets and Livelihoods of Male- and Female-Headed Households in Ghana. J. Fam. Issues 2019, 40, 2974–2996. [Google Scholar] [CrossRef]
  24. Bairagi, S.; Mishra, A.K.; Tran, D.Q. Disentangling gender-differentiated impacts on food security and poverty: Empirical evidence from Vietnam. J. Int. Dev. 2022, 34, 493–511. [Google Scholar] [CrossRef]
  25. Başlevent, C. The Changing Household Structure in Turkey: How are the Single-person Households Doing? Yıldız Soc. Sci. Rev. 2020, 6, 17–31. [Google Scholar] [CrossRef]
  26. Öztürk, M.; Çetin, B.I. Poverty and Women in World and Turkey. J. Yasar Univ. 2009, 4, 2521–2542. [Google Scholar]
  27. Selim, S.; Demirkıran, E. Socio-Economic Factors Affecting Household Food Expenditure in Turkey: A Comparative Analysis. Hacet. Üniversitesi İktisadi İdari Bilim. Fakültesi Derg. 2020, 38, 297–321. [Google Scholar] [CrossRef]
  28. Sapmaz, K.; Yercan, M. Determination of Factors Affecting the Consumption of Private Label Food Products by Using Artificial Neural Networks and Logistic Regression Model: Case of İzmir Province. Tarım Ekon. Derg. 2017, 23, 311–322. [Google Scholar] [CrossRef][Green Version]
  29. Broussard, N.H. What explains gender differences in food insecurity? Food Policy 2019, 83, 180–194. [Google Scholar] [CrossRef]
  30. Abiodun, O.I.; Jantan, A.; Omolara, A.E.; Dada, K.V.; Mohamed, N.A.; Arshad, H. State-of-the-art in artificial neural network applications: A survey. Heliyon 2018, 4, e00938. [Google Scholar] [CrossRef]
  31. Azadeh, A.; Davarzani, S.; Arjmand, A.; Khakestani, M. Improved prediction of household expenditure by living standard measures via a unique neural network: The case of Iran. Int. J. Product. Qual. Manag. 2016, 17, 142–182. [Google Scholar] [CrossRef]
  32. Öztornaci, B.; Ata, B.; Kartal, S. Analysing Household Food Consumption in Turkey Using Machine Learning Techniques. Agris Line Pap. Econ. Inform. 2024, 16, 97–105. [Google Scholar] [CrossRef]
  33. Friedman, N.; Geiger, D.; Goldszmidt, M. Bayesian network classifiers. Mach. Learn. 1997, 29, 131–163. [Google Scholar] [CrossRef]
  34. Marcot, B.G.; Penman, T.D. Advances in Bayesian network modelling: Integration of modelling technologies. Environ. Model. Softw. 2019, 111, 386–393. [Google Scholar] [CrossRef]
  35. Brown, C.; van de Walle, D. Headship and Poverty in Africa. World Bank Econ. Rev. 2021, 35, 1038–1056. [Google Scholar] [CrossRef]
  36. Maestripieri, L. A Job of One’s Own. Does Women’s Labor Market Participation Influence the Economic Insecurity of Households? Societies 2018, 8, 7. [Google Scholar] [CrossRef]
  37. Tang, Z.; Fishwick, P.A. Feedforward neural nets as models for time series forecasting. ORSA J. Comput. 1993, 5, 374–385. [Google Scholar] [CrossRef]
  38. Misuri, A.; Khakzad, N.; Reniers, G.; Cozzani, V. A Bayesian network methodology for optimal security management of critical infrastructures. Reliab. Eng. Syst. Saf. 2019, 191, 106112. [Google Scholar] [CrossRef]
  39. Marcot, B.G. Metrics for evaluating performance and uncertainty of Bayesian network models. Ecol. Model. 2012, 230, 50–62. [Google Scholar] [CrossRef]
  40. Daniel, B.K.; Zapata-Rivera, J.-D.; McCalla, G.I. A Bayesian belief network approach for modeling complex domains. In Bayesian Network Technologies: Applications and Graphical Models; IGI Global: Hershey, PA, USA, 2007; pp. 13–41. [Google Scholar]
  41. Elsheikh, A.H.; Sharshir, S.W.; Abd Elaziz, M.; Kabeel, A.E.; Guilan, W.; Haiou, Z. Modeling of solar energy systems using artificial neural network: A comprehensive review. Sol. Energy 2019, 180, 622–639. [Google Scholar] [CrossRef]
  42. Panda, D.K.; Bhoi, R.K. Artificial neural network prediction of material removal rate in electro discharge machining. Mater. Manuf. Process. 2005, 20, 645–672. [Google Scholar] [CrossRef]
  43. Masters, T. Practical Neural Network Recipes in C++; Morgan Kaufmann: Boston, MA, USA, 1993. [Google Scholar]
  44. Tavana, M.; Abtahi, A.-R.; Di Caprio, D.; Poortarigh, M. An Artificial Neural Network and Bayesian Network model for liquidity risk assessment in banking. Neurocomputing 2018, 275, 2525–2554. [Google Scholar] [CrossRef]
  45. Ekici, Ş.Ö.; Kabak, Ö.; Ülengin, F. Improving logistics performance by reforming the pillars of Global Competitiveness Index. Transp. Policy 2019, 81, 197–207. [Google Scholar] [CrossRef]
  46. Martínez-Martínez, L.H.; Delgado-Hernández, D.J.; De-León-Escobedo, D.; Flores-Gomora, J.; Arteaga-Arcos, J.C. Woody debris trapping phenomena evaluation in bridge piers: A Bayesian perspective. Reliab. Eng. Syst. Saf. 2017, 161, 38–52. [Google Scholar] [CrossRef]
  47. TCMB. Indicative Exchange Rates. 2021. Available online: https://www.tcmb.gov.tr/kurlar/kurlar_en.html (accessed on 22 August 2021).
  48. TURKSTAT. Average Age at Marriage by Statistical Regions. 2025. Available online: https://veriportali.tuik.gov.tr/en/databrowser/tuik/categories/11/11_9/11_9_1/TR,DF_EVLENME_ORT_YAS,1.0 (accessed on 1 January 2026).
  49. TURKSTAT. Distribution of Population by the Level of Education Completed (25 Years of Age and Over). 2025. Available online: https://data.tuik.gov.tr/Kategori/GetKategori?p=egitim-kultur-spor-ve-turizm-105&dil=1 (accessed on 1 January 2026).
  50. TURKSTAT. Labour Force Statistics. 2025. Available online: https://data.tuik.gov.tr/Kategori/GetKategori?p=istihdam-issizlik-ve-ucret-108&dil=1 (accessed on 1 January 2026).
  51. Dunga, H.M. An empirical analysis on determinants of food security among female-headed households in South Africa. Int. J. Soc. Sci. Humanit. Stud. 2020, 12, 66–81. [Google Scholar]
  52. Lebni, J.Y.; Gharehghani, M.A.M.; Soofizad, G.; Khosravi, B.; Ziapour, A.; Irandoost, S.F. Challenges and opportunities confronting female-headed households in Iran: A qualitative study. BMC Women’s Health 2020, 20, 183. [Google Scholar]
  53. TURKSTAT. Number of the Relatively Poor and Poverty Rate by Household Type. 2022. Available online: https://data.tuik.gov.tr/Kategori/GetKategori?p=Gelir,-Yasam,-Tuketim-ve-Yoksulluk-107 (accessed on 1 January 2026).
  54. TURKSTAT. Number of Marriages, Crude Marriage Rate, Number of Divorces and Crude Divorce Rate. 2022. Available online: https://data.tuik.gov.tr/Kategori/GetKategori?p=nufus-ve-demografi-109&dil=1 (accessed on 1 January 2026).
  55. Yoloğlu, A.; Zorlu, F. Definition of Rurality and Rural Areas in Turkey: A Methodological Trial. Mersin Üniversitesi Sos. Bilim. Enstitüsü Derg. 2020, 3, 145–176. [Google Scholar]
  56. Eneyew, A.; Mengistu, S. Double Marginalized Livelihoods: Invisible Gender Inequality in Pastoral Societies. Societies 2013, 3, 104–116. [Google Scholar] [CrossRef]
  57. Kroshus, E. Gender, Marital Status, and Commercially Prepared Food Expenditure. J. Nutr. Educ. Behav. 2008, 40, 355–360. [Google Scholar] [CrossRef]
  58. Mowlaei, M.; Intezar, A. The Effects of Social Characteristics of Iranian Households on Food Consumption Expenditures. J. Money Econ. 2019, 14, 555–572. [Google Scholar]
  59. Venn, D.; Dixon, J.; Banwell, C.; Strazdins, L. Social determinants of household food expenditure in Australia: The role of education, income, geography and time. Public Health Nutr. 2018, 21, 902–911. [Google Scholar] [CrossRef] [PubMed]
  60. Goktolga, Z.G.; Bal, S.G.; Karkacier, O. Factors effecting primary choice of consumers in food purchasing: The Turkey case. Food Control 2006, 17, 884–889. [Google Scholar] [CrossRef]
  61. Rae, A.N. Food consumption patterns and nutrition in urban Java households: The discriminatory power of some socio-economic variables. Aust. J. Agric. Resour. Econ. 1999, 43, 359–383. [Google Scholar] [CrossRef][Green Version]
  62. Zeybek, O.; Erdoğan, E. Transforming Traditional Villages into Sustainable Communities: Evaluating Ecovillage Potential in Bursa, Turkey. Sustainability 2025, 17, 2095. [Google Scholar] [CrossRef]
  63. Sunny, A.F.; Lan, J.; Islam, A.M. Agrarian change through sustainable agri-tech adoption in a challenging rice farming region: A panel data analysis. Agric. Econ. 2024, 70, 606–620. [Google Scholar] [CrossRef]
  64. Zhang, M.; Huo, Z.; Yu, H. Digital Inclusive Finance, Household Livelihood, and Common Prosperity Among Chinese Farmers: A Configuration Analysis Based on Sustainable Livelihood Framework and Farmer Surveys in Zhejiang Province. Systems 2025, 13, 345. [Google Scholar] [CrossRef]
  65. Sharma, S.; Walton, M.; Manning, S. Social Determinants of Health Influencing the New Zealand COVID-19 Response and Recovery: A Scoping Review and Causal Loop Diagram. Systems 2021, 9, 52. [Google Scholar] [CrossRef]
Figure 1. The resulting ANN model.
Systems 14 00250 g001
Figure 2. The BN-TAN structure.
Systems 14 00250 g002
Figure 3. Income and Household Food Expenditure.
Systems 14 00250 g003
Figure 4. Age and Household Food Share.
Systems 14 00250 g004
Figure 5. Education Level and Household Food Expenditure.
Systems 14 00250 g005
Figure 6. Employment and Household Food Expenditure.
Systems 14 00250 g006
Figure 7. Household Savings and Household Food Expenditure.
Systems 14 00250 g007
Figure 8. Female-Headed Families and Household Food Expenditure.
Systems 14 00250 g008
Figure 9. The probability changes in household food expenditure share according to Scenario 1.
Systems 14 00250 g009
Figure 10. The probability changes in household food-expenditure share according to Scenario 2.
Systems 14 00250 g010
Figure 11. The probability changes in household food-expenditure share according to Scenario 3.
Systems 14 00250 g011
Figure 12. The probability changes in household food-expenditure share according to Scenario 4.
Systems 14 00250 g012
Figure 13. The probability changes in household food-expenditure share according to Scenario 5.
Systems 14 00250 g013
Table 1. Descriptive Statistics.
VariablesDescriptionMeanStd. Dev.
FemaleMaleTotal
Household Food
Expenditure Share
Share of food expenditures in total household expenditures (%)0.26 0.26 0.26 0.14
IncomeHousehold total monthly income (TL)42,766.44 59,346.44 56,786.83 55,042.70
Gender1 is male headed household, 0 is female headed household 0.840.36
AgeAge of the head of the household56.74 49.52 50.63 14.51
School GraduationThe educational institution where the head last graduated from (1: not graduated from school; 2: primary school; 3: secondary school; 4: high school; 5: university)2.36 2.912.831.27
Marital Status1 if the head is single, 0 if the head is married0.82 0.07 0.18 0.39
Employment0 if the head is unemployed, 1 if the head is employed0.29 0.74 0.33 0.47
Employment20 if the head is unemployed, 1 if s/he is employed, 2 if s/he runs her/his business0.37 0.99 0.90 0.74
Household SizeNumber of people living in the household2.23 3.66 3.44 1.75
Household Ownership1 if the residence is property, 0 otherwise (o/w)0.73 0.75 0.75 0.43
Secondary Property Ownership1 if the family has more than one house, 0 o/w0.07 0.09 0.08 0.28
Summer vacation home Ownership1 if the family owns a summer vacation home, 0 o/w0.02 0.02 0.02 0.15
Farmland Tenure1 if the family owns agricultural land, 0 o/w0.17 0.27 0.24 0.44
Land Tenure1 if the family owns the land, 0 o/w0.03 0.05 0.05 0.22
Store Ownership1 if the family owned a store, 0 o/w0.03 0.05 0.04 0.21
Local Market Shopping Habit1 if the family has a habit of shopping at the local market, 0 o/w0.56 0.65 0.63 0.48
Household Saving1 if the family can make budget for savings, 0 o/w 0.35 0.39 0.38 0.49
Note: Calculated using data from the 2018 Household Budget Survey (TURKSTAT).
Table 2. The results of sensitivity analysis for ANN.
VariableSensitivity Score
Age0.0428
School Graduation0.0365
Income0.0350
Employment0.0210
Household0.0193
Home ownership0.0190
Gender0.0189
Employment20.0183
Local market shopping habit0.0178
Marital status0.0178
Savings0.0177
Farmland tenure0.0177
Store ownership0.0176
Secondary property ownership0.0176
Summer vacation home ownership0.0176
Land tenure0.0175
Source: Authors’ calculations based on the 2018 Household Budget Survey.
Table 3. The results of sensitivity analysis for BN.
VariablesVariance Reduction
School Graduation10.8000
Age5.9100
Income5.6400
Household ownership3.1700
Farmland Tenure3.1000
Employment2.5500
Household Savings1.7300
Local market shopping habit0.8540
Summer vacation home ownership0.4980
Household Size0.3940
Employment20.3010
Marital Status0.2200
Secondary property ownership0.1920
Store ownership0.0934
Gender0.0143
Land Tenure0.0022
Source: Authors’ calculations based on the 2018 Household Budget Survey.
Table 4. Scenario Analysis and Variables.
VariableScenario 1Scenario 2Scenario 3Scenario 4Scenario 5
Genderchanging situationchanging situationfemalemalemale
Marital Statussinglesinglesinglemarriedmarried
Income levelLowmiddlemiddleNAmiddle
Education leveluneducatedNAchanging situationNANA
Savingno savingsNAno savingsNANA
Household sizeNAmiddleNAbigmiddle
Farmland TenureNANANAchanging situationNA
EmploymentNANANANAchanging situation
First Situationfemalefemaleuniversity gradfarmland ownerpaid worker
Second Situationmalemalehigh school gradnot farmland ownerruns own business
Resultfood exp.decreasedfood exp.decreasedfood exp. increasedfood exp. increasedfood exp. increased
Disclaimer/Publisher’s Note: The statements, opinions and data contained in all publications are solely those of the individual author(s) and contributor(s) and not of MDPI and/or the editor(s). MDPI and/or the editor(s) disclaim responsibility for any injury to people or property resulting from any ideas, methods, instructions or products referred to in the content.