Article

A Real-Time Early Warning Framework for Multi-Dimensional Driving Risk of Heavy-Duty Trucks Using Trajectory Data


1
School of Civil Engineering and Transportation, Guangzhou University, Guangzhou 510006, China
2
Guangzhou City Renewal Group Co., Ltd., Guangzhou 510030, China
3
Institute of Logistics Science and Engineering, Shanghai Maritime University, Shanghai 201306, China
4
State Key Laboratory of Maritime Technology and Safety, Shanghai Ship and Shipping Research Institute Co., Ltd., Shanghai 200135, China
*
Author to whom correspondence should be addressed.
Systems 2026, 14(2), 204; https://doi.org/10.3390/systems14020204

Submission received: 16 January 2026 / Revised: 6 February 2026 / Accepted: 13 February 2026 / Published: 14 February 2026
(This article belongs to the Section Systems Engineering)

Abstract

Frequent accidents involving heavy trucks and the inadequacy of existing dynamic monitoring technologies pose significant challenges to accurate early warning risk and safety management. To address these issues, this study proposes a multi-dimensional risk measurement and real-time early warning method for heavy truck driving behavior based on trajectory data. By extracting multi-dimensional trajectory features such as lateral position, speed, and acceleration, quantitative indicators for driving stability and car-following risk were constructed. Integrated with the CRITIC objective weighting method and the K-means++ clustering algorithm, a comprehensive risk measurement model was established to systematically characterize the dynamic evolution of driving behavior, overcoming the limitations of single-dimensional risk analysis. Experimental results based on the CQSkyEyeX trajectory dataset demonstrate that the proposed method categorizes driving behavior into six risk levels. Low-risk behavior accounted for 66.70%, while medium- to high-risk behaviors mainly included serpentine driving (26.69%) and close following (4.18%). High-risk behavior constituted only 0.03%. A multi-strategy real-time warning mechanism was further developed, achieving a warning accuracy of 98.36% with the final-value method, significantly outperforming the mode method (83.62%). The outcomes of this study demonstrate the effectiveness and practical utility of the proposed model for risk identification and early warning. On a practical level, the developed risk classification framework and management strategy establish a quantitative basis for differentiated supervision, enabling a closed-loop management process of “identification–intervention–optimization”. Future work will focus on three key directions: integrating multi-source data, extending the model to other typical operational scenarios, and incorporating advanced machine learning techniques to further enhance its generalization capability and warning accuracy. Overall, this research provides a feasible technical pathway for the precise quantification, dynamic monitoring, and tiered intervention of driving behavior in heavy-duty trucks, thereby contributing to enhanced safety in road freight transportation.

1. Introduction

Road freight transport is the dominant mode of goods movement in China, constituting nearly 80% of the total national freight volume and underscoring its foundational role in the logistics system [1]. However, heavy-duty trucks (HDTs) pose substantial safety challenges within the road transport ecosystem. Their inherent physical characteristics, including large mass and long braking distances, combined with the frequent occurrence of high-risk driving behaviors like sudden acceleration, harsh deceleration, and tailgating, lead to a disproportionately high rate of severe traffic accidents. HDT-involved accidents account for approximately 25% of all road traffic accidents, resulting in significant casualties and economic losses.
Current safety supervision mechanisms for HDTs remain largely reactive, predominantly relying on post-accident investigation rather than proactive prevention. This approach suffers from clear limitations in proactive intervention, coverage, and timeliness, highlighting a critical gap in modern intelligent transportation systems (ITSs). The advancement of ITSs offers new paradigms for safety management, shifting focus from traditional regulatory methods to data-driven, real-time monitoring and intervention [2]. In this context, trajectory data analysis for safety has emerged as a core technological enabler. The rich spatial-temporal information contained in vehicle trajectory data provides an unprecedented opportunity to quantify driving risk dynamically and accurately.
Therefore, to facilitate the essential transition from reactive “post-incident handling” to proactive “preventive management” within an ITS framework [3,4], there is an urgent need to develop accurate driving risk quantification models and real-time early-warning mechanisms based on trajectory analytics. Such models leverage multi-dimensional trajectory features (e.g., lateral position, speed, acceleration) to systematically assess driving behavior, thereby enhancing the intrinsic safety of HDT operations and supporting intelligent, preemptive safety management systems.
The remainder of this paper is organized as follows. Section 2 provides a literature review, covering driving behavior risk measurement, driving style clustering, and driving behavior risk warning. Section 3 details the proposed methodology, including data description and preprocessing, definition of risk metrics, development of the risk measurement model, the clustering procedure, and the real-time warning procedure. Section 4 presents the results and analysis, focusing on the outcomes of risk measurement and clustering, performance evaluation of the warning method, and a detailed case analysis. Section 5 offers a discussion interpreting the risk distribution, comparing model performance with prior work, examining the implications of rare high-risk event detection, and stating limitations alongside future research directions. Finally, Section 6 concludes the paper by summarizing the main findings and contributions.

2. Literature Review

Research on driving risk for heavy-duty trucks is crucial for developing effective safety management systems. Current investigations mainly revolve around three interconnected domains: risk measurement, driving style clustering, and risk warning. Advances in these domains, propelled by the availability of large-scale trajectory data and machine learning algorithms, collectively form the foundation for the systems above-mentioned. The following sections review the progress and key methodologies within each domain.

2.1. Driving Behavior Risk Measurement

The quantitative assessment of driving risk and the identification of its key contributing factors constitute a fundamental research focus [5,6,7,8]. Current studies have explored this challenge from various perspectives. On the one hand, some research has been dedicated to developing efficient risk identification methods. For example, Wang et al. [9] proposed an Optuna-optimized machine learning framework for truck driving risk identification. By comparing various tree-based models, they found that the LightGBM model optimized with the TPE algorithm performed best and identified the average speed as the most critical risk feature, providing methodological support for traffic management authorities in formulating control measures. On the other hand, numerous studies have focused on identifying specific behavioral indicators directly associated with high risk. Kovaceva et al. [10] established a correlation between the frequency of hard braking events and an aggressive driving style, which is inherently linked to a higher collision risk. Similarly, Hyun et al. [11] demonstrated a statistically significant association between insufficient headway and collision occurrence. Furthermore, to enable a more comprehensive risk assessment, some scholars have constructed integrated evaluation models. Chen et al. [12] defined four indicators, namely lateral stability, longitudinal stability, car-following risk, and lane-changing risk, to develop a comprehensive driving behavior risk quantification model. Based on this model, driving behaviors were classified into four categories: dangerous, aggressive, safe, and conservative.

2.2. Driving Style Clustering

Research on driving style clustering aims to group drivers based on their behavioral patterns, with its core processes typically including feature extraction, classification method development, and practical application [13,14,15,16]. Depending on the data sources and analytical objectives, existing studies have formed various technical approaches. Among methods based on real-world vehicle data, Li et al. [17] systematically classified driving styles by leveraging driving data from truck drivers near highway ramps, employing principal component analysis based on three dimensions: risk tolerance, longitudinal driving characteristics, and lateral driving characteristics. Zhu et al. [18] collected kinematic parameters such as speed, lateral, and longitudinal acceleration from 11 heavy-duty truck drivers. By applying the K-means clustering method using these parameters as metrics, they classified driving styles into three categories: cautious, normal, and aggressive, and established thresholds for each category. Regarding model and algorithmic innovations, Zepeda et al. [19] proposed a dynamic clustering-based identification and profiling method that can adaptively adjust clustering results according to changes in the surrounding environment. Chen et al. [20] introduced a clustering-driven feature selection method to distinguish between driving style and skill, thereby categorizing drivers into groups such as novice, cautious-experienced, and adventurous. Complementing this, Li et al. [21] proposed a recognition method based on representative behaviors, which not only distinguished multiple driving styles but also captured their dynamic variations over time.

2.3. Driving Behavior Risk Warning

Current research in risk warning focuses on integrating multi-source data, developing advanced models, and enhancing system adaptability in complex scenarios [22,23,24]. The trend is toward leveraging richer datasets and more sophisticated algorithms for real-time, context-aware interventions. For example, Shao et al. [25] developed a personalized forward collision warning mechanism for hazardous material trucks using a multi-objective optimization model and found that warning timing converged under high-risk conditions whereas differentiated warnings were required under medium- and low-level risks, and identified that aggressive drivers exhibited tighter car-following behavior and weaker risk-avoidance intentions. Meanwhile, Zhang et al. [26] integrated in-vehicle warning data into commercial vehicle crash risk models, finding that alerts such as yawning and smoking held a higher predictive value for risk than travel and driving behavior variables, providing a basis for shifting UBI insurance toward active safety management. Furthermore, Xie et al. [27] leveraged high-resolution microscopic trajectory data and hyperparameter-optimized machine learning techniques to introduce a risk identification and warning method for lane-changing maneuvers in connected vehicle weaving sections, demonstrating a significant improvement in real-time warning accuracy.
In summary, significant progress has been marked in the three interconnected domains of risk measurement, driving style clustering, and real-time warning systems for heavy-duty trucks. The rapid advancement of deep learning and big data technologies has been a key driver, injecting new momentum into the field by enabling the processing of massive datasets and the identification of complex, non-linear patterns [28,29,30]. The evolution within each domain reveals a clear trajectory toward greater precision and integration:
(1)
Risk measurement has evolved from evaluating single risk indicators to utilizing multi-dimensional dynamic features extracted from trajectory data. This data-driven approach, which captures subtle vehicle kinematics, has become the cornerstone for significantly enhancing the accuracy and timeliness of warnings, holding substantial technical value for the proactive prevention of traffic accidents.
(2)
Driving style clustering has progressed from simple behavior frequency counts to incorporating techniques such as feature engineering and unsupervised learning. By categorizing drivers into groups with distinct risk profiles, such as cautious, aggressive, or fatigue-prone, this approach enables the development of targeted safety interventions and management strategies.
(3)
Modern real-time warning systems have progressed beyond generic notifications to providing context-sensitive alerts. Through the integration of multi-source data and sophisticated models like LightGBM, these systems analyze complex scenarios (e.g., lane-changing or car-following on slopes) in real-time to evaluate dynamic risk levels. Consequently, they generate targeted guidance and decision-making support for drivers based on the specific driving context.
However, despite these advancements, two significant research gaps persist, which the present study aimed to address. Firstly, existing risk assessment methods often rely on single-dimensional indicators or analyze different risk types in isolation. This fragmented approach fails to establish a comprehensive metric that can simultaneously quantify and integrate diverse risk facets, including lateral stability risk (e.g., reflected in serpentine driving) and longitudinal car-following risk (e.g., reflected in close-following). Consequently, it limits the holistic perception of the vehicle’s overall dynamic risk state. Secondly, while research on driving style clustering has made progress in classifying macro-level behavioral patterns, there is a notable lack of frameworks capable of performing fine-grained, real-time clustering and dynamic evolution analysis of driving states. This gap hinders the ability to accurately characterize the instantaneous risk level of driving behavior and provide timely warnings, which is crucial for proactive safety intervention.
To address these specific limitations, this study proposes a novel framework for multidimensional risk measurement and real-time warning. Building on multi-dimensional trajectory data (including lateral position, velocity, and acceleration), the proposed method integrates the CRITIC objective weighting technique to construct a comprehensive measurement model that intrinsically synthesizes multiple risk indicators. This model is further combined with the K-means++ clustering algorithm to enable real-time behavioral clustering and systematically characterize the dynamic evolution of vehicle driving states. The framework is designed to overcome two key shortcomings identified in prior research: the fragmented nature of existing risk analyses and the inability to capture fine-grained, transient risk fluctuations.

3. Methodology

3.1. Data Description and Preprocessing

To establish a robust foundation for the development and validation of the risk measurement model, this study employed the CQSkyEyeX dataset [31,32], developed by the Road Traffic Safety Research Team at Chongqing Jiaotong University. This dataset was selected for its comprehensiveness, high quality, and relevance to the study’s objective of analyzing heavy-duty truck (HDT) driving behavior on expressways.
This study utilized 5.1 k high-resolution drone videos and employed advanced computer vision techniques to extract vehicle trajectory data, effectively overcoming challenges such as image jitter, vehicle misclassification, and missing road information. The dataset encompasses 650 min of traffic information from multiple expressways in China, including straight segments, merging and diverging areas, as well as various operational conditions such as road construction, wet and slippery pavement, and nighttime driving [33]. Key parameters required for risk measurement are presented in Table 1.
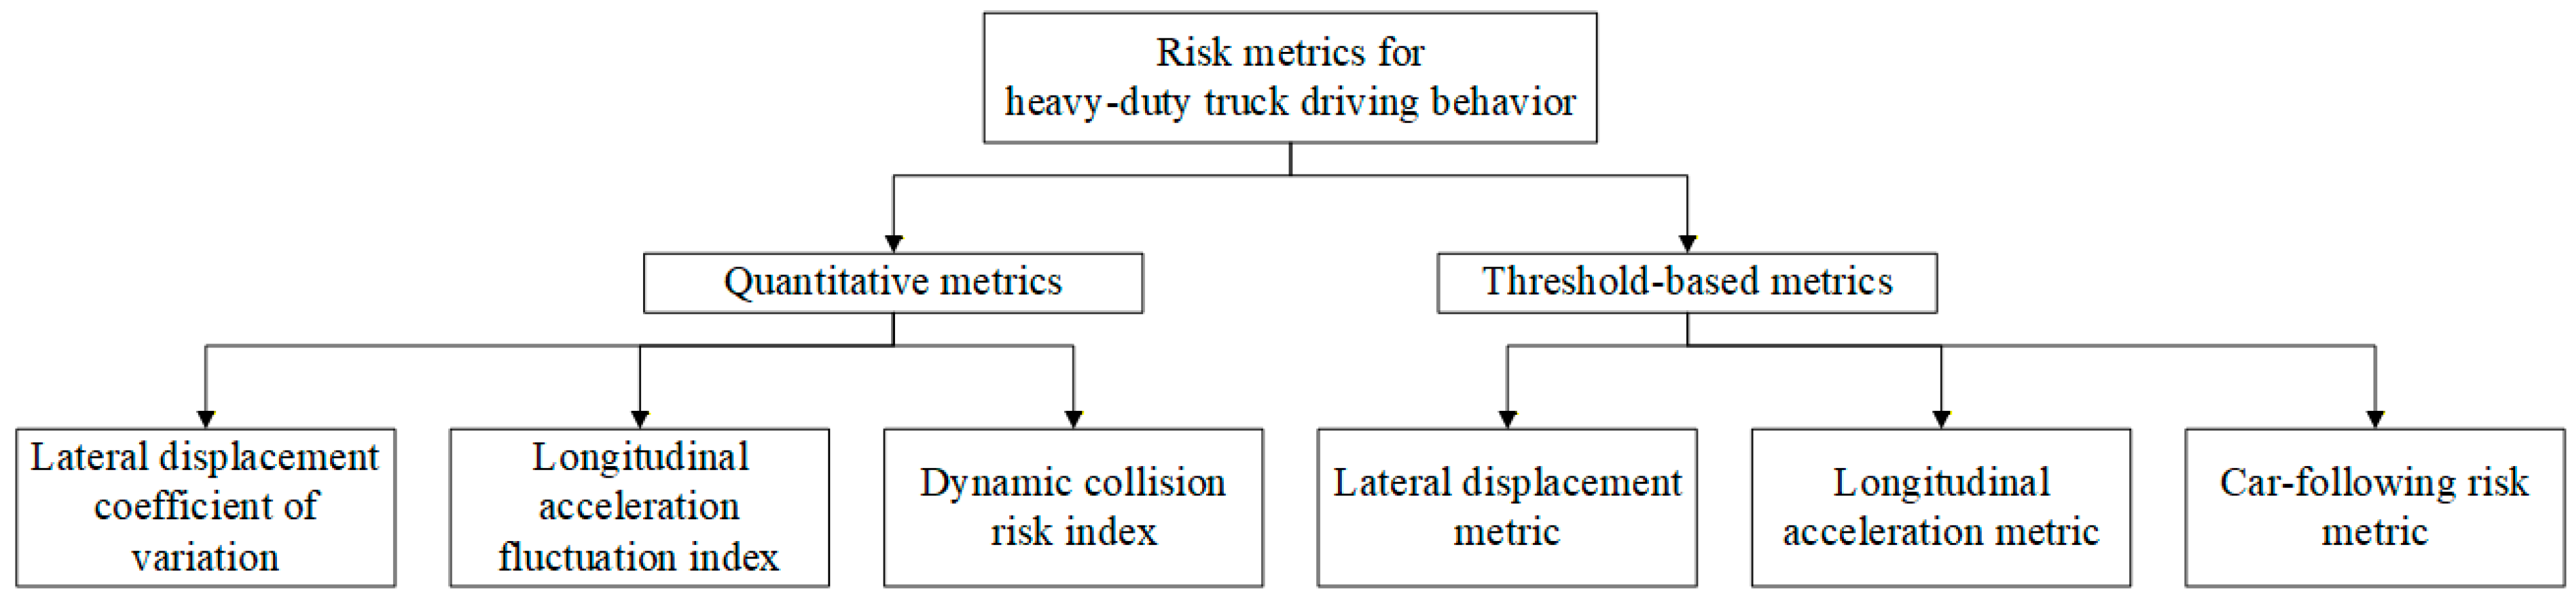
To accurately assess the driving risk of heavy-duty trucks (HDTs), this study defined a set of risk metrics from both quantitative and threshold-based perspectives. These metrics were designed to capture two critical aspects of driving behavior: driving stability risk and car-following risk. A total of six specific indicators were established to form a comprehensive evaluation framework, as illustrated in Figure 1.
To meet the requirements of risk measurement, trajectory data for vehicle type 3 (heavy-duty trucks) from datasets 4–9 were selected for analysis. These vehicles typically have a total mass exceeding 14 tons and are equipped with three or more drive axles, primarily used for intercity long-distance logistics transportation. The research data were collected on 3 August 2023, from 14:11 to 14:33, from a basic straight segment of the Yu-Rong Expressway (a six-lane bidirectional road section measuring 414 m in length). The data collection did not involve complex scenarios such as merging/diverging areas, construction zones, slippery conditions, or nighttime driving. The video frame rate was 25 frames per second. An aerial view of the experimental road section and its coordinate system are shown in Figure 1. Valid data were extracted starting from the 41st frame for each vehicle, comprising a total of 117 heavy-duty trucks and 44,723 valid trajectory frames.
In the process of risk quantification, the computation of each metric relies heavily on the configuration of a sliding time window. The size of this window plays a crucial role in the accuracy and reliability of the risk evaluation. If the time window is too short, it may fail to capture the sustained nature of certain high-risk behaviors—such as continuous lane weaving or prolonged tailgating—leading to the underestimation of risk. Conversely, an excessively large window could incorporate irrelevant data fluctuations and increase the probability of false positives. To balance temporal sensitivity and behavioral consistency, this study adopted a 40-frame sliding window after iterative experimental validation. The formal definitions of the risk metrics are given as follows.

3.2. Definition of Risk Metrics

To accurately assess the driving risk of heavy-duty trucks (HDTs), this study established a set of risk metrics within a two-dimensional framework encompassing both quantitative and threshold-based perspectives. The metrics were designed to capture two critical behavioral dimensions: driving stability risk and car-following risk. A total of six specific indicators were defined to operationalize this framework, as summarized in Figure 2.
The selection of the six specific metrics was grounded in the established traffic safety literature and the intrinsic characteristics of heavy-duty truck driving behavior. For driving stability risk, the coefficient of variation in lateral displacement directly quantifies lane-keeping performance and weaving tendency, reflecting directional instability. The longitudinal acceleration fluctuation index captures the smoothness of speed control, where high volatility is linked to erratic operation and potential instability. The standard deviation of steering wheel angle serves as a direct indicator of high-frequency correction and potential oversteering. For car-following risk, the inverse Time-to-Collision (TTC) is a well-validated surrogate for immediate rear-end collision risk. The following distance and its time derivative (relative speed) jointly describe the spatial and dynamic aspects of the car-following gap, crucial for assessing both instantaneous and evolving hazards.
Collectively, this two-dimensional, six-indicator framework offers three main advantages in measuring target risks: (1) Comprehensiveness: It captures both lateral/longitudinal vehicle control (stability) and longitudinal spacing management (car-following), covering the primary behavioral domains implicated in truck safety. (2) Dual Perspective: By integrating quantitative continuous metrics (e.g., variation coefficients) with threshold-based safety indicators (e.g., TTC), it balances sensitivity to gradual behavioral degradation with the identification of acute safety-critical events. (3) Operational Balance: The selected indicators are computable from standard vehicle trajectory data, ensuring the method’s applicability for real-world, large-scale analysis while maintaining a clear behavioral interpretation linked to known risk mechanisms.
In the process of risk quantification, the calculation of each metric depends critically on the configuration of a sliding time window, the size of which directly determines the accuracy and reliability of the risk assessment. An overly short window may fail to capture sustained high-risk behaviors (e.g., continuous lane weaving or prolonged tailgating), resulting in risk underestimation. Conversely, an excessively large window may introduce irrelevant signal variations and increase the false positive rate. To balance temporal sensitivity with behavioral consistency, this study systematically tested multiple window lengths through iterative experimentation and ultimately selected a 40-frame window, which optimally captures sustained risk patterns while minimizing noise and delay. The formal definitions of the risk metrics are provided below.

3.2.1. Quantitative Metrics

(1) 
Lateral displacement coefficient of variation R1(t)
The lateral stability during driving is quantified by the coefficient of variation in lateral displacement, calculated over a 40-frame window (encompassing frame t and its 39 predecessors). A higher coefficient value indicates greater dispersion in lateral displacement, implying an increased likelihood of weaving behavior and, consequently, poorer driving stability. The calculation is given by Equations (1) and (2). When the mean value is 0, R1(t) is set to 0.
D x t = X t X t 1 ( t     2 )
R 1 t = s t d D x t 39 , , D x t m e a n D x t 39 , , D x t ( t     41 )
where X(t) represents the vehicle’s lateral coordinate at frame t, Dx(t) denotes the lateral offset of the vehicle during the time interval [t−1, t], std represents the standard deviation, and mean is the arithmetic mean. The ratio of std to mean defines the coefficient of variation.
(2) 
Longitudinal acceleration fluctuation index R2(t)
The Longitudinal Acceleration Fluctuation Index quantifies variations in longitudinal acceleration. A higher index value indicates greater variability in acceleration, hence reflecting poorer driving stability. The calculation is given by Equation (3).
R 2 t = i = t T | a i a ¯ | T
where ai is the longitudinal acceleration of the vehicle at frame i, a ¯ is the average longitudinal acceleration of the vehicle over the time period T, and T is the total duration preceding frame i, which was set to a duration corresponding to 40 frames in this study. Here, the time span T was fixed to correspond to a duration of 40 frames, given a video frame rate of 25 fps, which is 1.6 s. The units of acceleration a i and a ¯ are meters per second squared (m/s2). Since the calculation starts from frame 41, T is always a positive number, avoiding the situation of division by zero. R2(t) has no specific edge cases, as the sliding window ensures that T > 0.
(3) 
Dynamic collision risk index R3(t)
This index is quantified as the inverse of Time-to-Collision (TTC). A shorter TTC yields a larger inverse value, corresponding to a higher collision risk during car-following. When the speed of the subject vehicle is lower than that of the leading vehicle, R3(t) is set to 0, denoting the minimum risk level. The calculation follows Equation (4).
R 3 t = 1 T T C ( t )
where TTC(t) denotes the time-to-collision at frame t. It is directly obtained from the CQSkyEyeX dataset as a predefined parameter. According to the dataset documentation, it is calculated as the instantaneous distance to the leading vehicle divided by the relative speed (when positive), representing the projected time to collision under constant velocity assumptions. R3(t) is set to 0 (denoting the minimum risk level) when the speed of the main vehicle is lower than that of the front vehicle or there is no front vehicle, as shown in Table 1 below. TTC is in seconds (s), and R3(t) is dimensionless.

3.2.2. Threshold-Based Metrics

(1) 
Lateral displacement threshold metric R4(t)
The difference between the maximum and minimum lateral coordinates of the vehicle within the current frame t and the preceding 39 frames is utilized. A value of 1 is assigned when this difference is greater than or equal to the effective lane width (calculated as the total lane width minus the vehicle width), indicating that the vehicle has crossed a lane marking; otherwise, a value of 0 is assigned. The calculation is given by Equation (5).
R 4 t = 1 ,   max ( X ) min X L t + R ( t ) C 0 ,   max ( X ) min X < L t + R ( t ) C
where max(X) and min(X) represent the maximum and minimum lateral coordinates of the target vehicle over the 40-frame window ending at frame t , respectively; L(t) denotes the distance from the vehicle’s position at frame t to the left lane marking; R(t) denotes the corresponding distance to the right lane marking (hence, L(t) + R(t) equals the total lane width); and C represents the vehicle width.
(2) 
Longitudinal acceleration threshold metric R5(t)
The longitudinal acceleration at frame t was selected as the basis for this metric. The threshold of 1.5 m/s2 was defined based on the dynamic performance characteristics of heavy-duty trucks, with reference to the relevant literature and actual vehicle dynamics data, in order to effectively distinguish high-risk fluctuations (e.g., harsh acceleration/deceleration) from normal operational variations and to provide an objective criterion that minimizes subjectivity. A value of 1 is assigned when the absolute value of the acceleration meets or exceeds this threshold; otherwise, a value of 0 is assigned. The calculation is formalized in Equation (6).
R 5 t = 1 ,     a t     1.5   m / s 2   0 ,     a t   <   1.5   m / s 2
where a(t) denotes the longitudinal acceleration of the vehicle at frame t.
(3) 
Car-following risk threshold metric R6(t)
Under car-following conditions, maintaining a safe longitudinal distance is critical for characterizing rear-end collision risk. In defining the risk threshold for this behavior, we directly adopted the minimum safe distance specified in the “Regulations on the Implementation of the Road Traffic Safety Law of the People’s Republic of China”: 100 m when the vehicle speed exceeds 100 km/h, and 50 m when the speed is below 100 km/h. This ensures that the metric aligns with national regulatory standards and reflects legally recognized safety margins. Based on this, the car-following risk indicator R6(t) was formulated as shown in Equation (7) to quantify the risk level arising from insufficient headway during car-following.
R 6 t = 1 ,     V t     100   k m / h   a n d   D t   <   100   m   o r   V t   <   100   k m / h   a n d   D t   <   50   m 0 ,     V t     100   k m / h   a n d   D t     100   m   o r     V t   <   100   k m / h   a n d   D t     50   m
where D(t) represents the distance to the preceding vehicle at frame t, and V(t) denotes the vehicle speed at frame t.

3.3. Risk Measurement Model Development

In general, interdependencies may exist among risk indicators, such as the coupling effects between different driving behavior metrics. The CRITIC method is an objective weighting analysis technique grounded in the comparative strength and conflict between indicators, making it particularly suitable for multi-attribute decision-making problems involving correlated criteria [24]. Therefore, to mitigate the random bias inherent in traditional subjective weighting approaches, this study employed the CRITIC method to determine the weights of risk indicators and construct a risk quantification model based on a comprehensive scoring framework. The specific procedure is as follows.
(1)
Data acquisition
Consider a dataset comprising m entities to be evaluated and n evaluation indicators, forming an initial data matrix X.
X = x 11 x 1 n x m 1 x mn
(2)
Data normalization
Data normalization is performed to eliminate scale differences among different indicators, thereby ensuring comparability across the dataset. Depending on the nature of each indicator, the following methods are applied accordingly. For positive indicators (where larger values are more desirable) and negative indicators (where smaller values are more desirable), the normalization is conducted as follows.
x ij = x ij min x j max x j min x j
x ij = max x j x ij max x j min x j
(3)
Calculation of information load
The information load is quantified through two dimensions: variability and conflict.
(a)
Variability (represented by standard deviation)
S j = i = 1 m x ij x j ¯ 2 n 1
where x j ¯ denotes the average value of each indicator data.
(b)
Conflict (based on inter-indicator correlation)
Construct the correlation coefficient matrix R between the indicators, where the correlation coefficients of any two indicators j and k are as follows.
R = j , k = 1 n x ij x j ¯ x ik x k ¯ j = 1 n x ij x j ¯ 2 k = 1 n x ik x k ¯ 2
The conflict measure for the j th indicator is then defined as follows.
A j = i = 1 n 1 r ij
where rij represents the correlation coefficient between the i and j indicators.
(c)
Comprehensive quantification of information content
C j = S j A j
A larger value for this measure indicates that the corresponding indicator carries richer information.
(4)
Weight calculation
The weight for each indicator is obtained through normalization processing.
W j = C j j = 1 n C j #
The comprehensive score S(t) for each time frame is then calculated based on this weight.
S t = j = 1 6 W J R J t
Thus, a risk measurement model for heavy-duty truck driving behavior is established, enabling the quantitative assessment of risk levels.

3.4. Clustering Procedure

Upon obtaining continuous comprehensive risk scores, it is necessary to classify driving behaviors into different risk levels. As an unsupervised learning method, cluster analysis can group driving behavior samples into distinct categories based on their intrinsic similarities, thereby identifying typical driving patterns with different risk levels (such as “low-risk and stable”, “medium-risk and volatile”, “high-risk and aggressive”, etc.). The clustering is performed on the one-dimensional comprehensive risk score S(t), rather than on the original six-dimensional feature space (R1–R6). The score S(t) integrates the multi-dimensional indicators via the CRITIC weighting method, thereby reducing dimensionality and avoiding the complexities associated with clustering in high-dimensional space. This pattern recognition capability helps to move beyond judging risk at a single point in time and instead captures the driver’s typical risk state as a whole, providing a basis for implementing differentiated safety management strategies.
This study employed the K-means++ algorithm for clustering rather than the standard K-means algorithm, aiming to address the latter’s sensitivity to initial centroid selection and its tendency to converge to local optima. By improving the initial centroid selection, K-means++ ensures that the centroids are as dispersed as possible in the data space, thereby enhancing the stability and accuracy of the clustering results. This makes it more suitable for the potentially complex distribution characteristics of driving behavior data. The specific process is as follows:
(a)
Data preprocessing: The comprehensive risk score series is standardized using Z-score normalization to eliminate scale effects.
(b)
Determine the number of clusters k: The elbow method is applied by examining the inflection point in the within-cluster sum of squared errors (SSEs) across different k values to identify the optimal number of clusters.
(c)
Perform K-means++ clustering: Centroids are initialized according to the algorithm’s procedure, followed by an iterative “assignment-update” process until the centroids stabilize. After clustering, each cluster represents a risk pattern, which can be labeled as a distinct risk level, thereby achieving a classified assessment of driving behavior risk.

3.5. Real-Time Warning Procedure

While cluster analysis provides an assessment of historical or current risk states, a genuine “real-time warning” requires the ability to predict short-term future risk. To achieve this goal, this study proposes a time-series prediction and warning mechanism that integrates the Mode Method and the Last Value Method. The real-time nature of this method is reflected in its use of a sliding window for online prediction, meaning that it relies only on recent historical data to quickly forecast the risk category for the next moment. The Mode Method predicts the next risk category based on the frequency of risk categories appearing within the sliding window. Its mathematical model is as follows:
y ^ t + 1 = arg max c C ( Frequency ( c )   in   y t w + 1 , , y t )
where y ^ t + 1 is the predicted risk category at time t + 1, w is the sliding window size (set to 40 frames in this study), and C is the set of all risk categories. This method tends to predict the most frequent category within the window, reflecting the persistence of behavioral patterns.
The Last Value Method, on the other hand, assumes that the risk state has inertia and directly uses the category of the last frame within the window as the prediction for the next frame:
y ^ t + 1 = y t
The real-time warning process is as follows:
(a)
Initialization and Data Stream: After system initialization, a sliding window with a length of 40 frames is maintained for the real-time input data stream, storing the risk category labels (provided by the aforementioned clustering results) for the most recent 40 time frames.
(b)
Parallel Prediction: When a new frame of data arrives, both the Mode Method and the Last Value Method are applied simultaneously based on the category sequence within the current window to predict the risk category for the next frame.
(c)
Warning Trigger: If the output of either prediction method (or a combined prediction result according to predefined rules) is a “high-risk” category, the system immediately triggers a warning signal to alert the driver or monitoring platform.
(d)
Window Update: The newly arrived actual data and its category label are added to the window, and the oldest frame of data is removed, keeping the window size constant to enable rolling prediction.
This method is computationally efficient, satisfying real-time processing requirements. It fuses two fundamental prediction strategies, effectively balancing the persistence of behavioral patterns with the possibility of abrupt state changes. This synthesis enhances the overall robustness of the warning system.

4. Results and Analysis

4.1. Results of Risk Measurement and Clustering

4.1.1. Risk Measurement Result

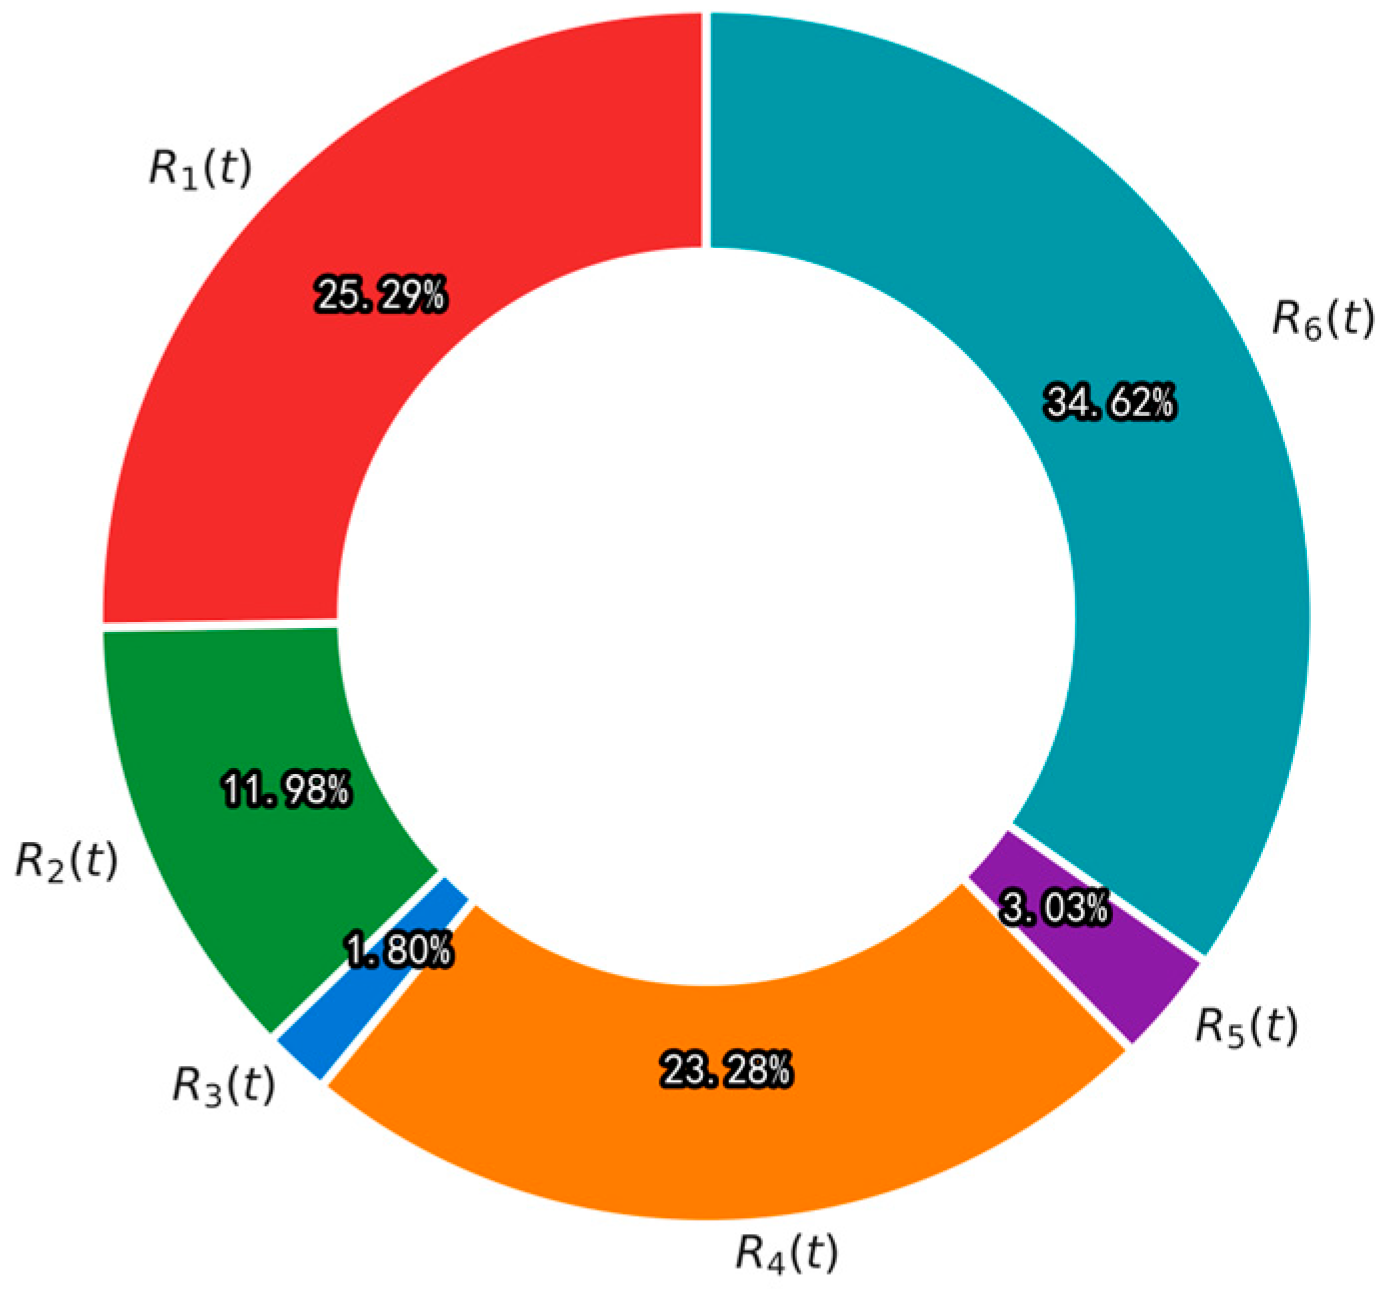
The CRITIC method avoids subjective bias by quantifying the variability (standard deviation) and conflict (based on correlations between indicators) of the indicators, ensuring that the weights reflect the true information content of the indicators. Specifically, the weight calculation follows these steps: first, standardize the original data (Equations (9) or (10)) to eliminate dimensional influences; then calculate the variability Sj (Equation (11)) and the conflict Aj (Equation (13)) for each indicator, where the conflict is derived based on the correlation coefficient matrix (Equation (12)); finally, obtain the weights Wj (Equation (15)) through the normalization of the information amount Cj = Sj × Aj (Equation (14)). A higher weight value indicates that the indicator carries richer information in the risk evaluation, has stronger independence, and contributes more significantly to the comprehensive score S(t) (Equation (16)). The weight values of each risk measurement indicator are shown in Figure 3.
Analysis of the weight allocation results shows that:
R6(t) (Illegal Following) had the highest weight (34.62%), indicating that this indicator plays the most critical role in risk clustering. Its high weight can be attributed to two reasons: on the one hand, illegal following behavior exhibits high variability in the measured data (i.e., high standard deviation Sj), manifesting as instability in driving behavior; on the other hand, this indicator has high conflict with other indicators (e.g., driving stability), meaning that it provides unique, irreplaceable risk information, which highly aligns with the high risk associated with car-following behavior in real traffic scenarios (such as rear-end collisions).
R1(t) (Unstable Driving) had the second highest weight (25.29%), also reflecting a high information amount, likely related to significant variability in the behavioral data and low correlation with other indicators. Combined with the principle of the CRITIC method, the high weight of this indicator suggests that driving instability is a core dimension of risk measurement, independent of other indicators.
The weights of R4(t), R2(t), and R5(t) were 23.28%, 11.98%, and 3.82% respectively, reflecting a gradient difference in information amount among the indicators. For example, the relatively high weight of R4(t) might be due to its strong conflict (low correlation with other indicators), while the low weight of R5(t) suggests that its variability or independence is insufficient.
R3(t) had the smallest weight (only 1.79%), indicating that this indicator carries limited information in the dataset, possibly due to small value variations or high correlation with other indicators, resulting in its weak contribution to the risk evaluation.
Overall, the weight results highlight driving stability (R1(t)) and car-following behavior (R6(t)) as core risk factors, which is highly consistent with the high risks associated with such behaviors in actual traffic scenarios. This weight distribution provides a reliable quantitative basis for further constructing clustering models (such as high-risk driving behavior identification), ensuring the accuracy and interpretability of the risk quantification model S(t). Based on this, the model can be effectively applied to actual driving risk warning systems, prioritizing attention to high-weight indicators to optimize resource allocation.

4.1.2. Clustering Analysis

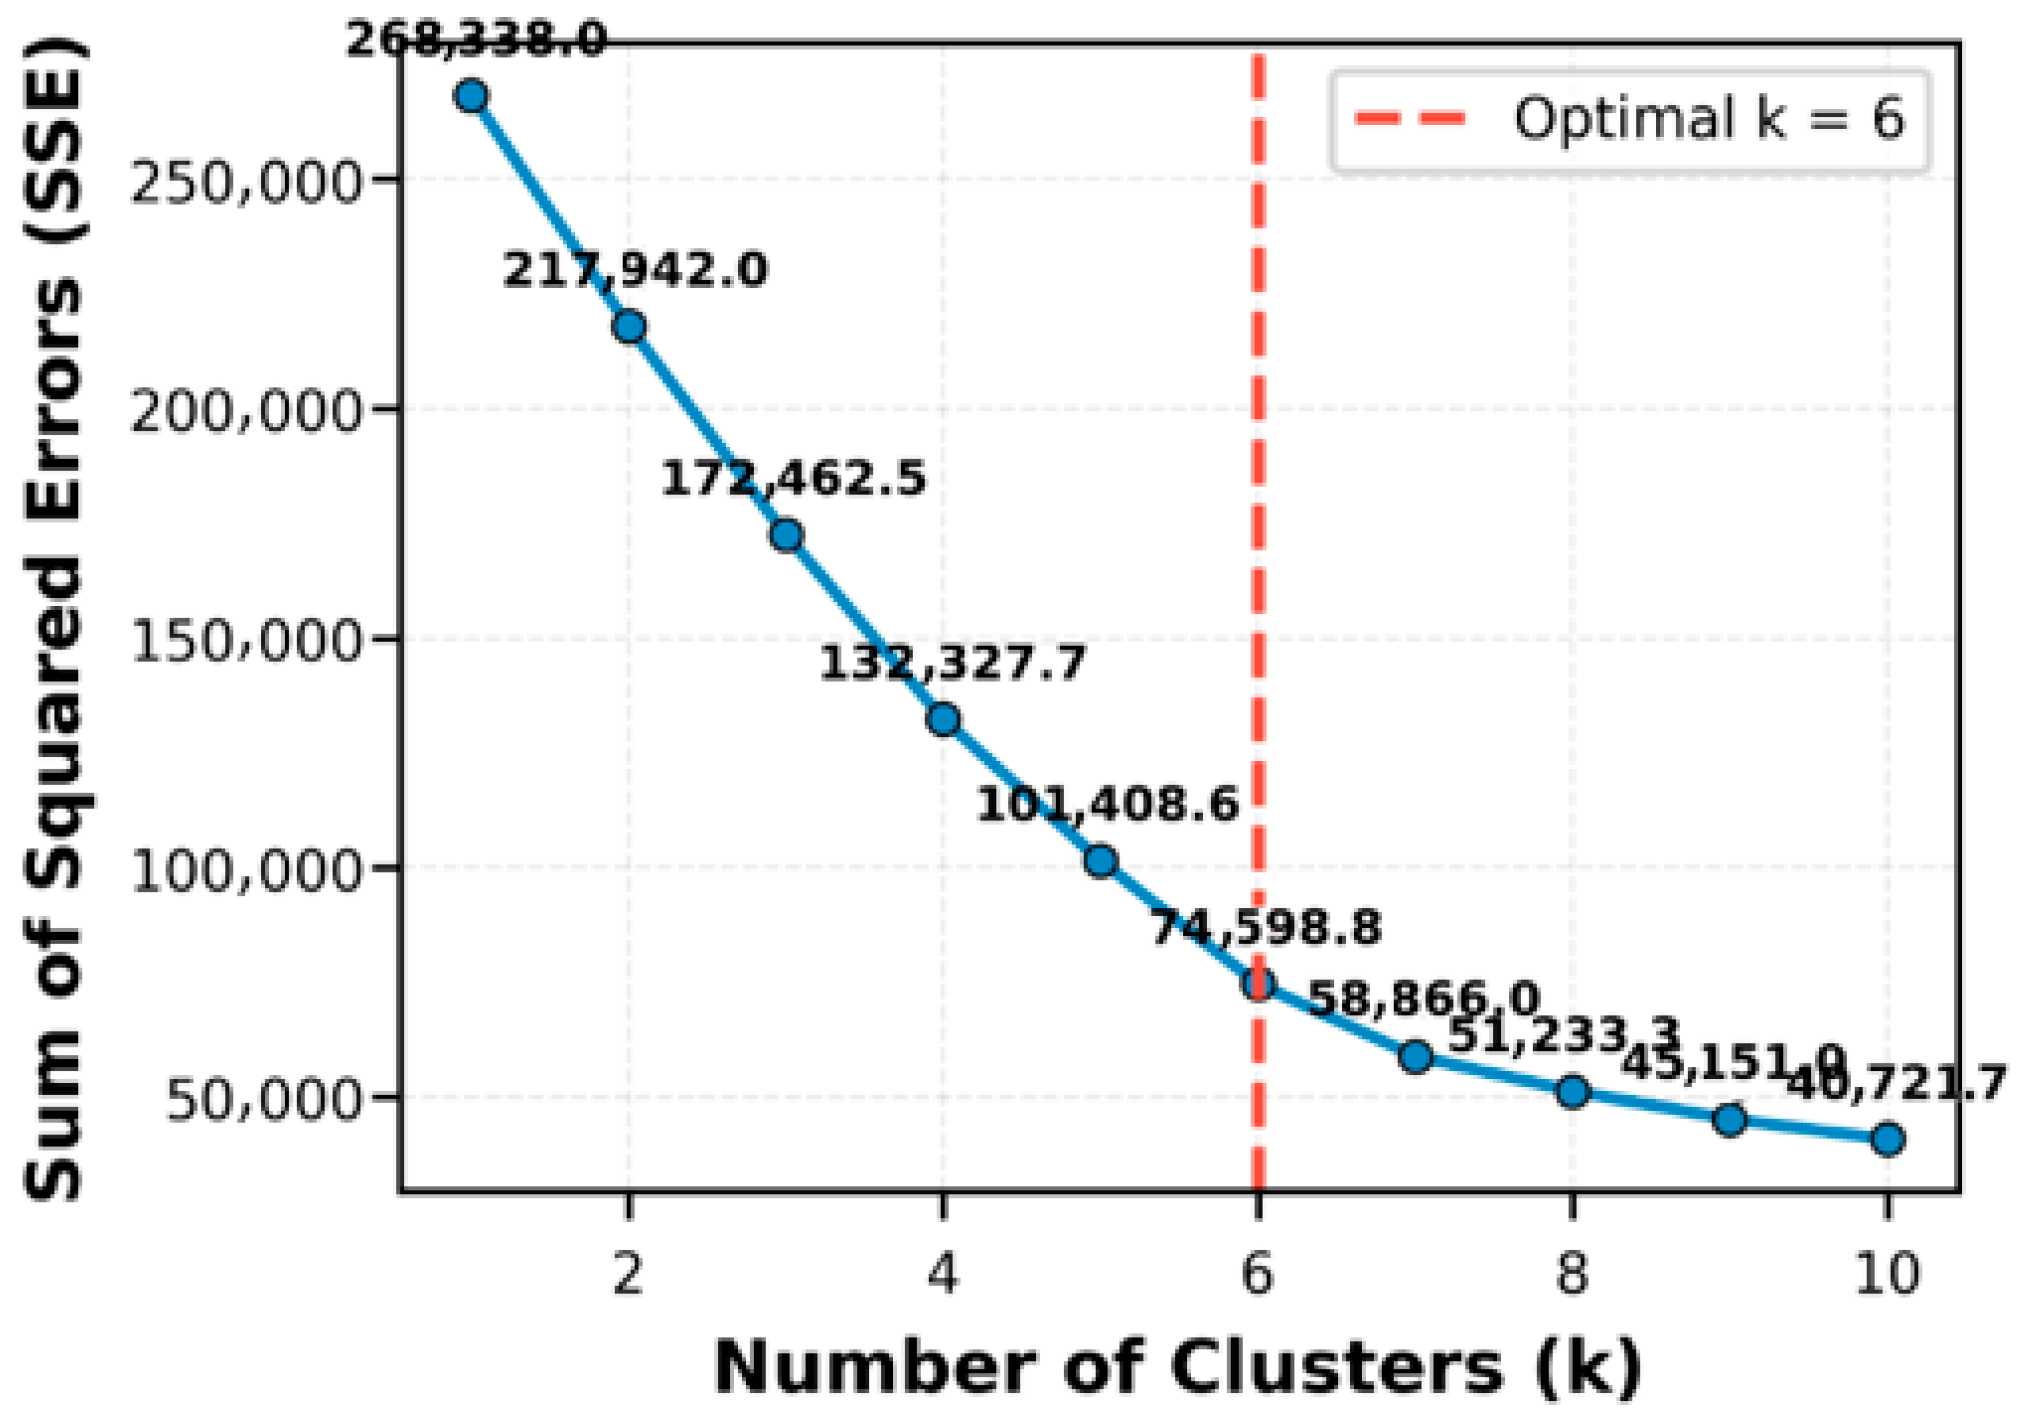
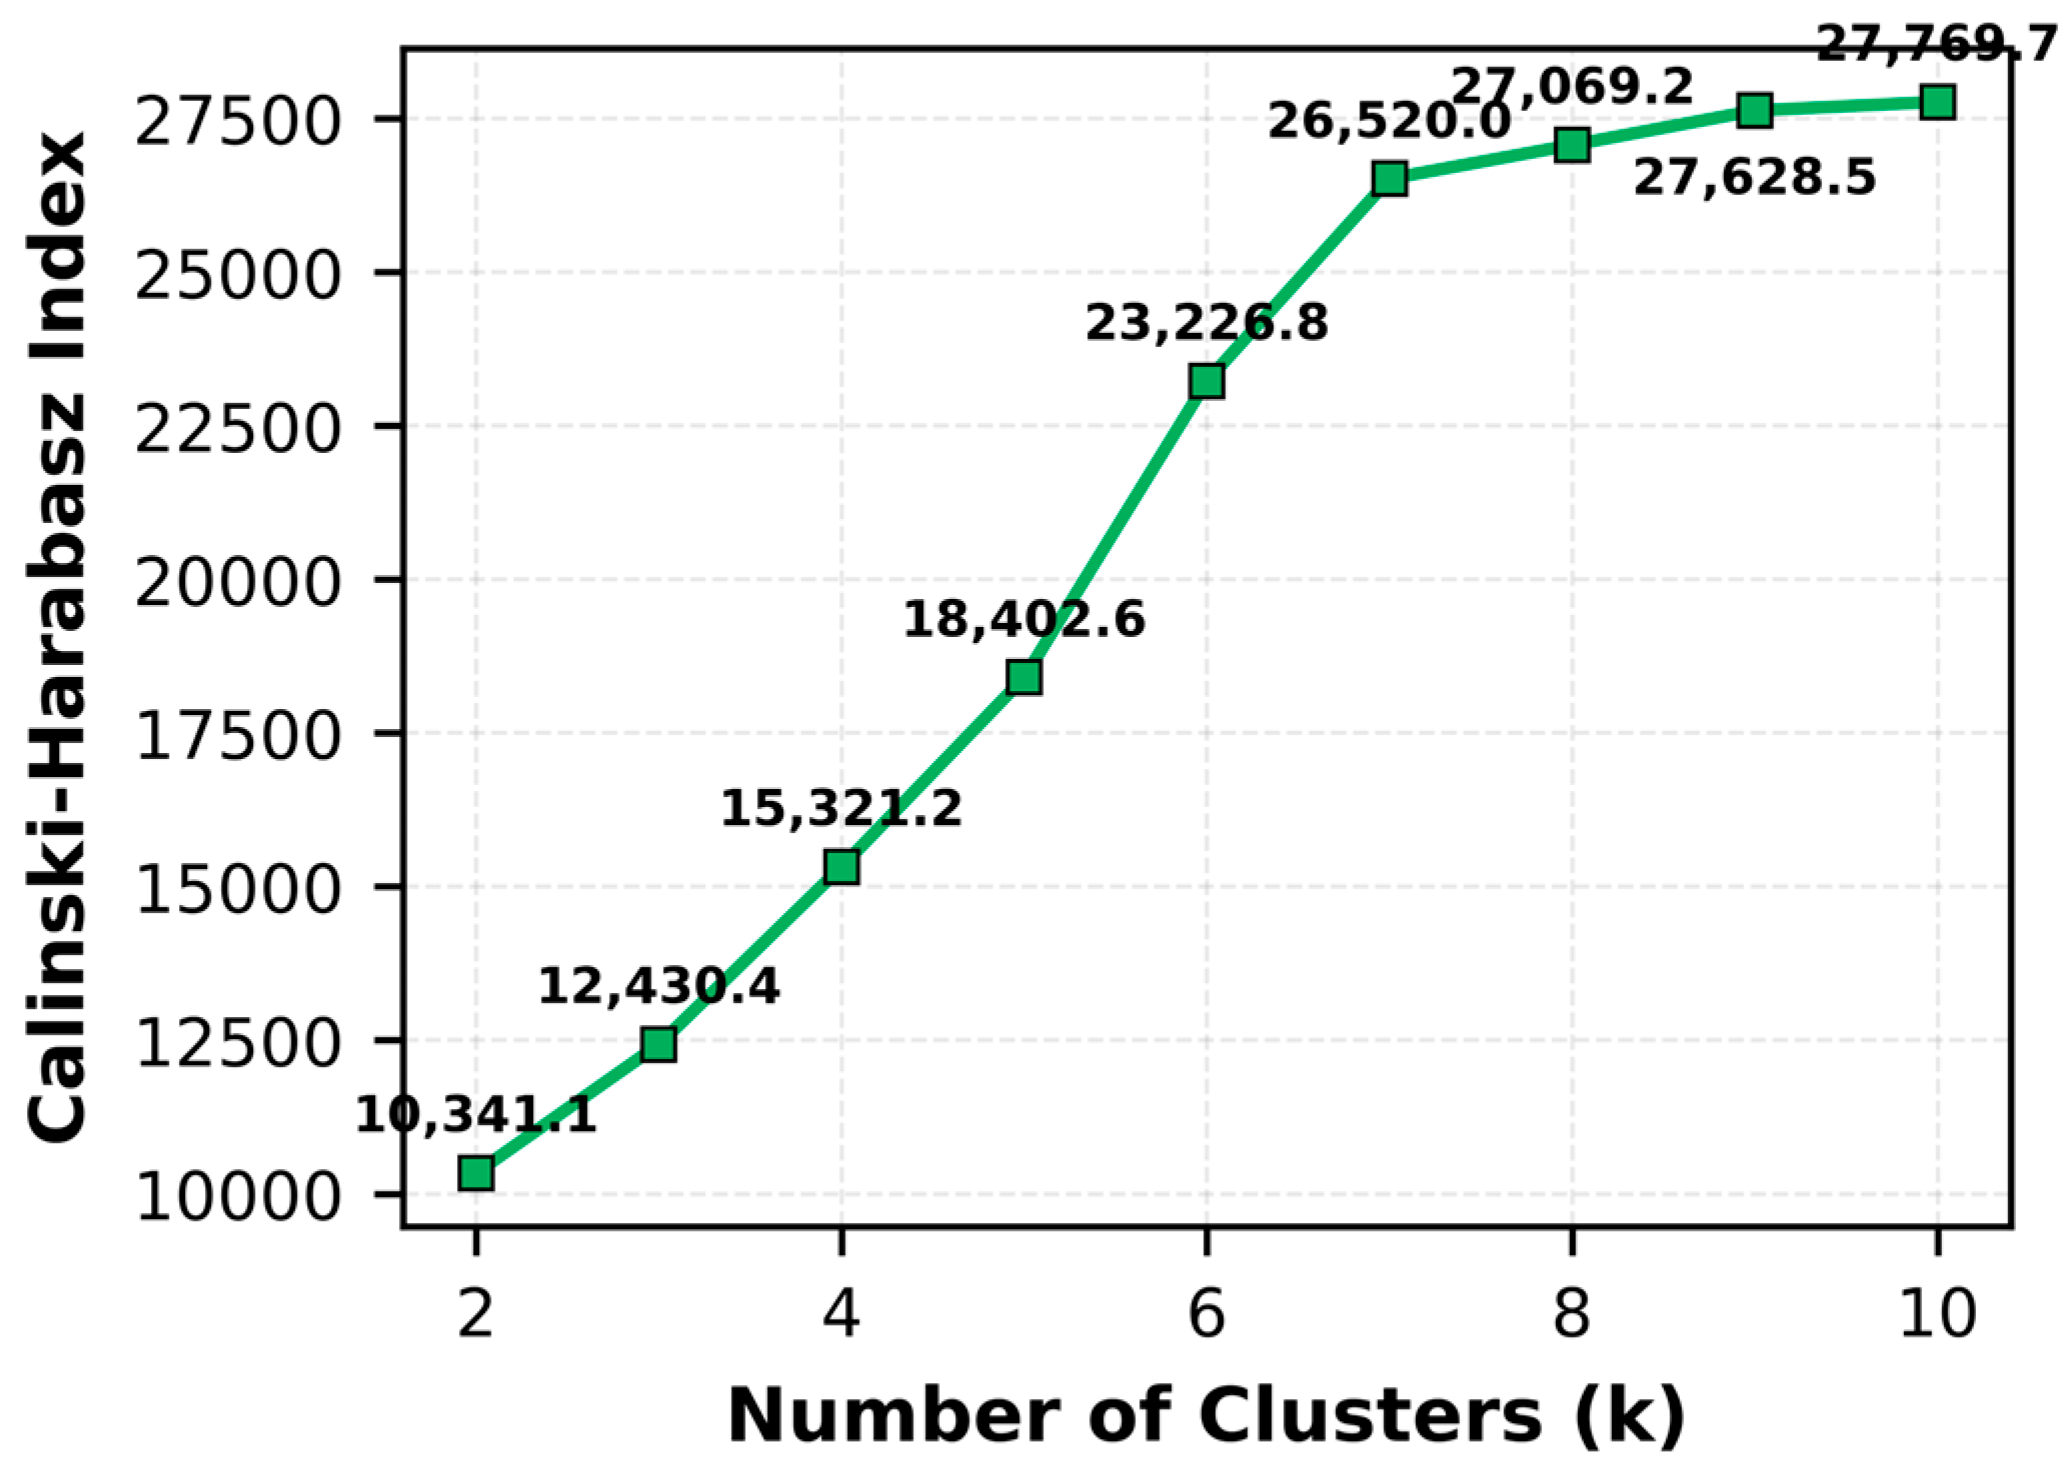
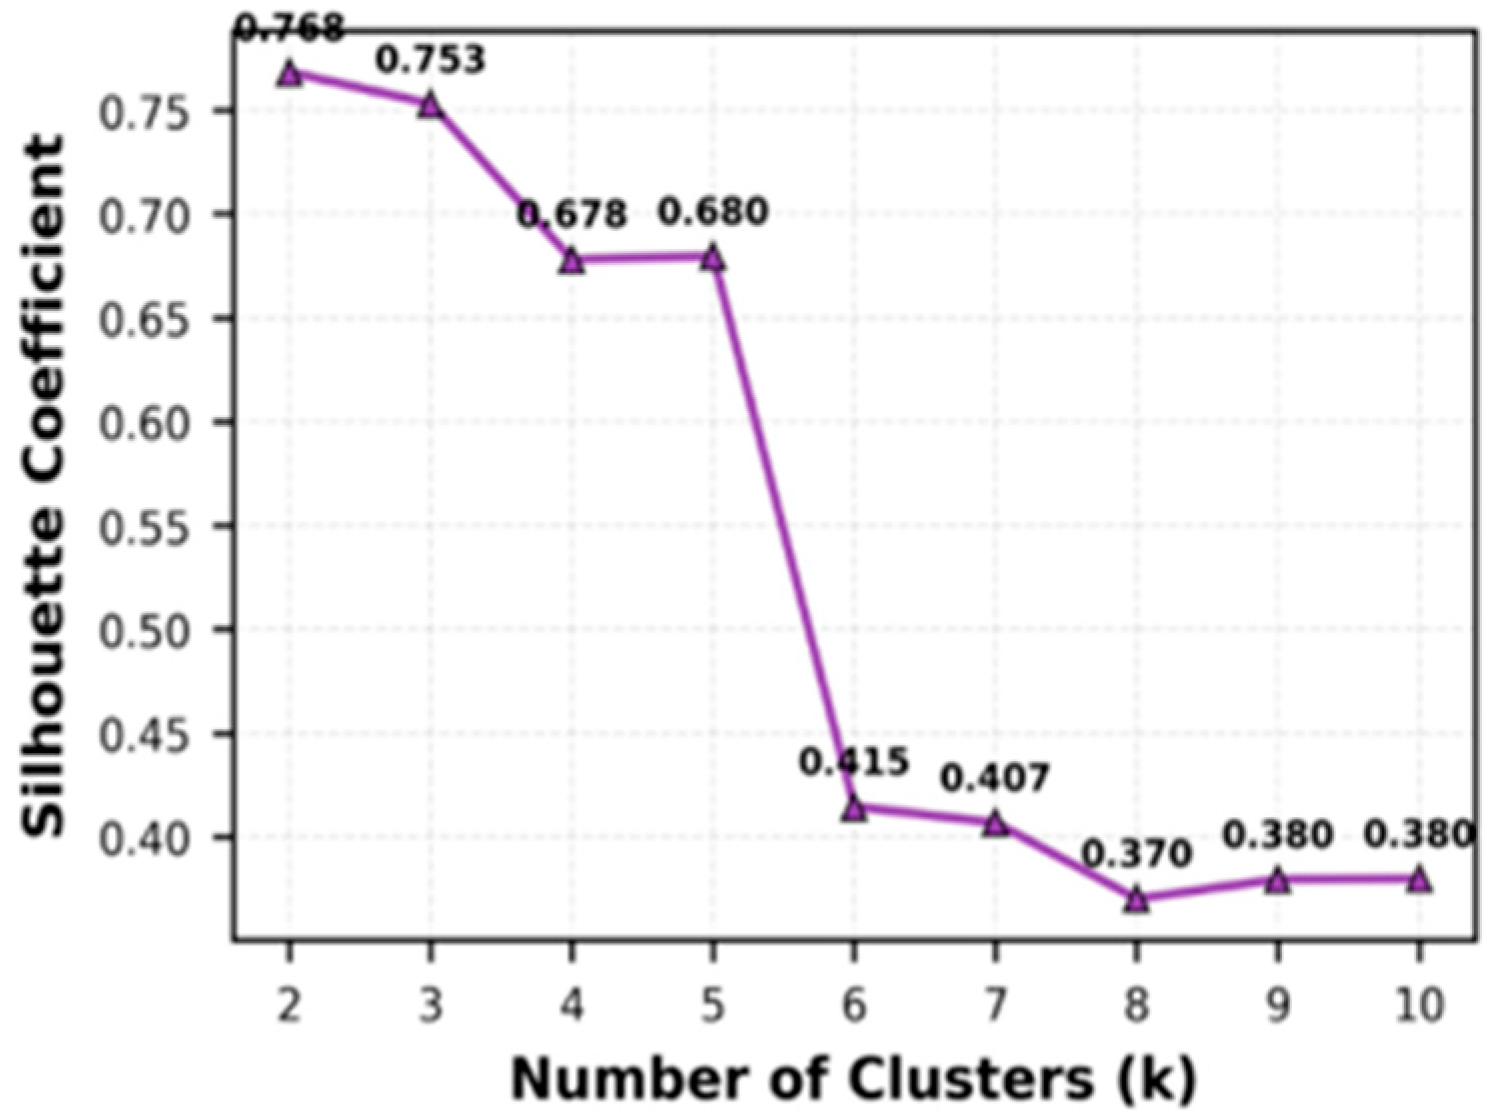
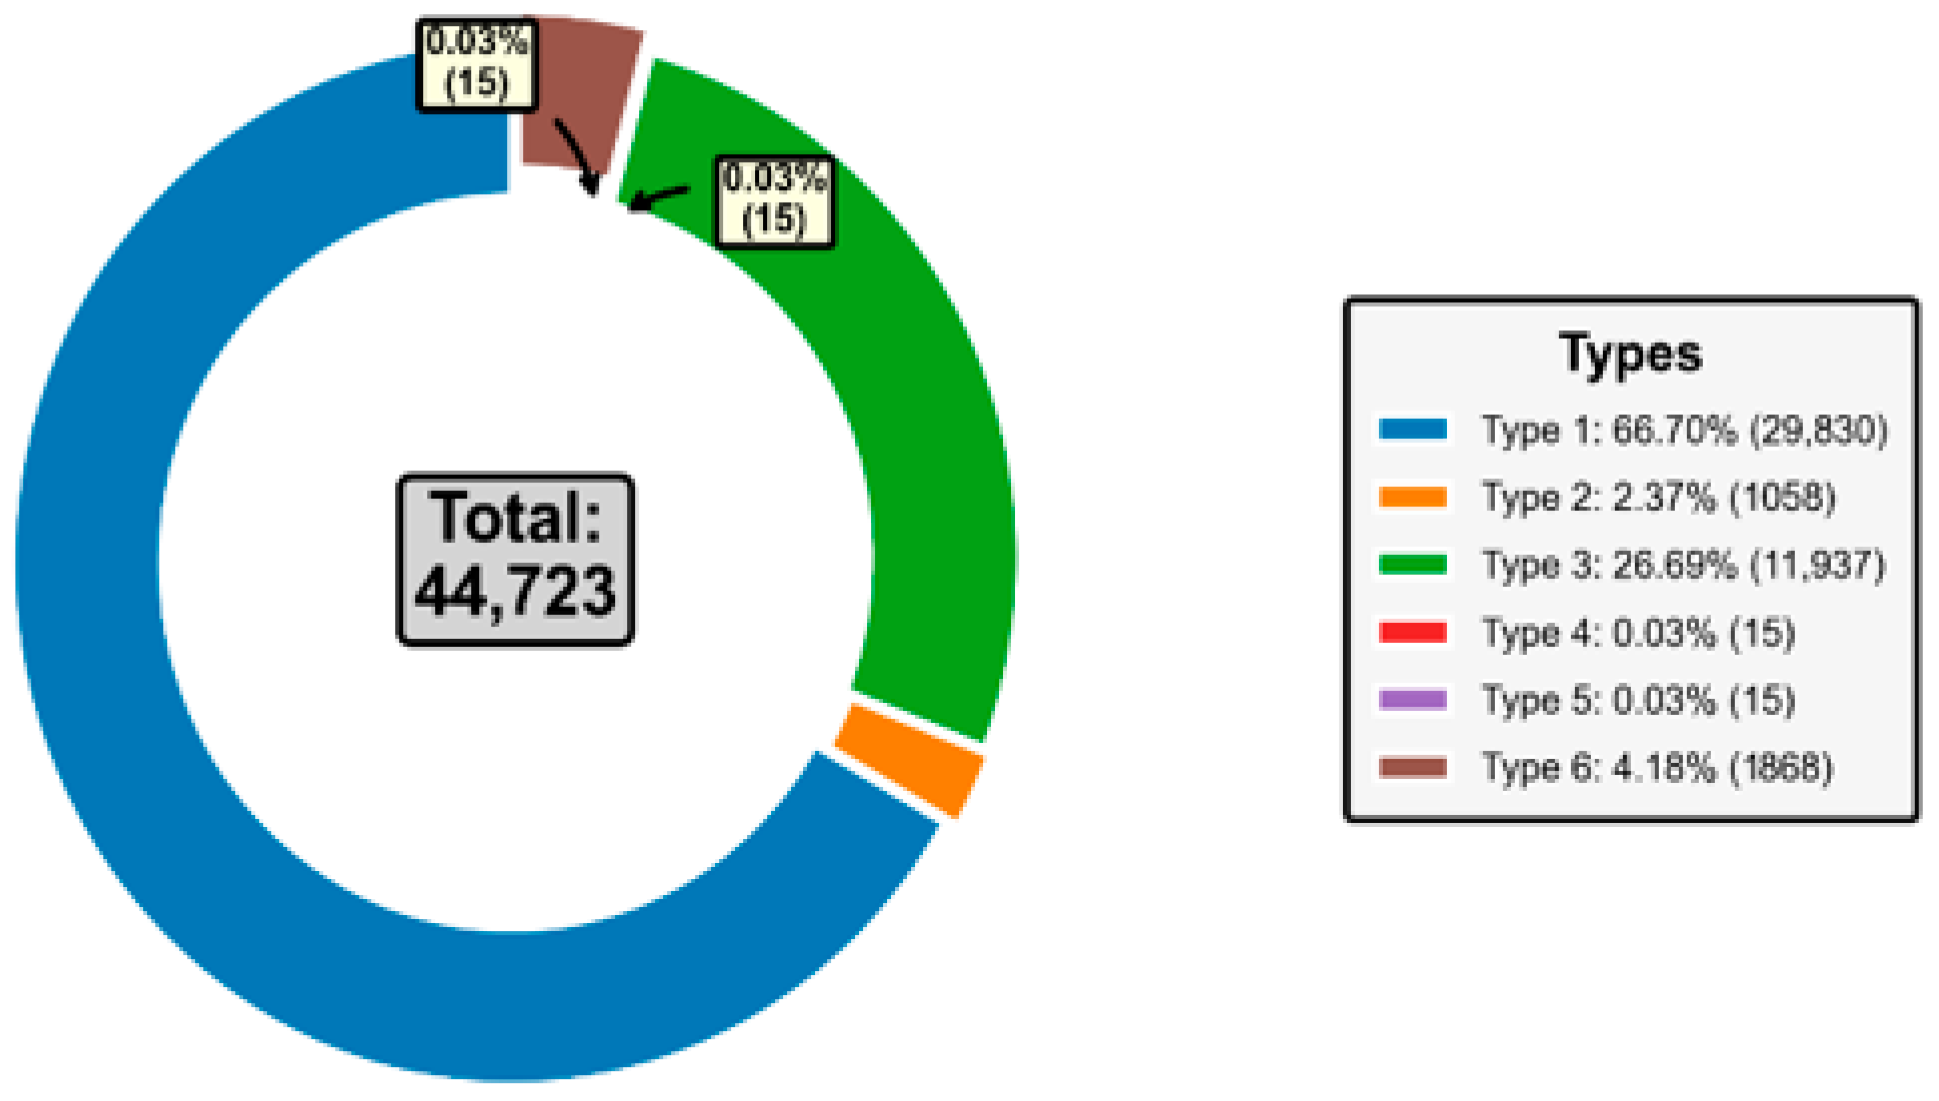
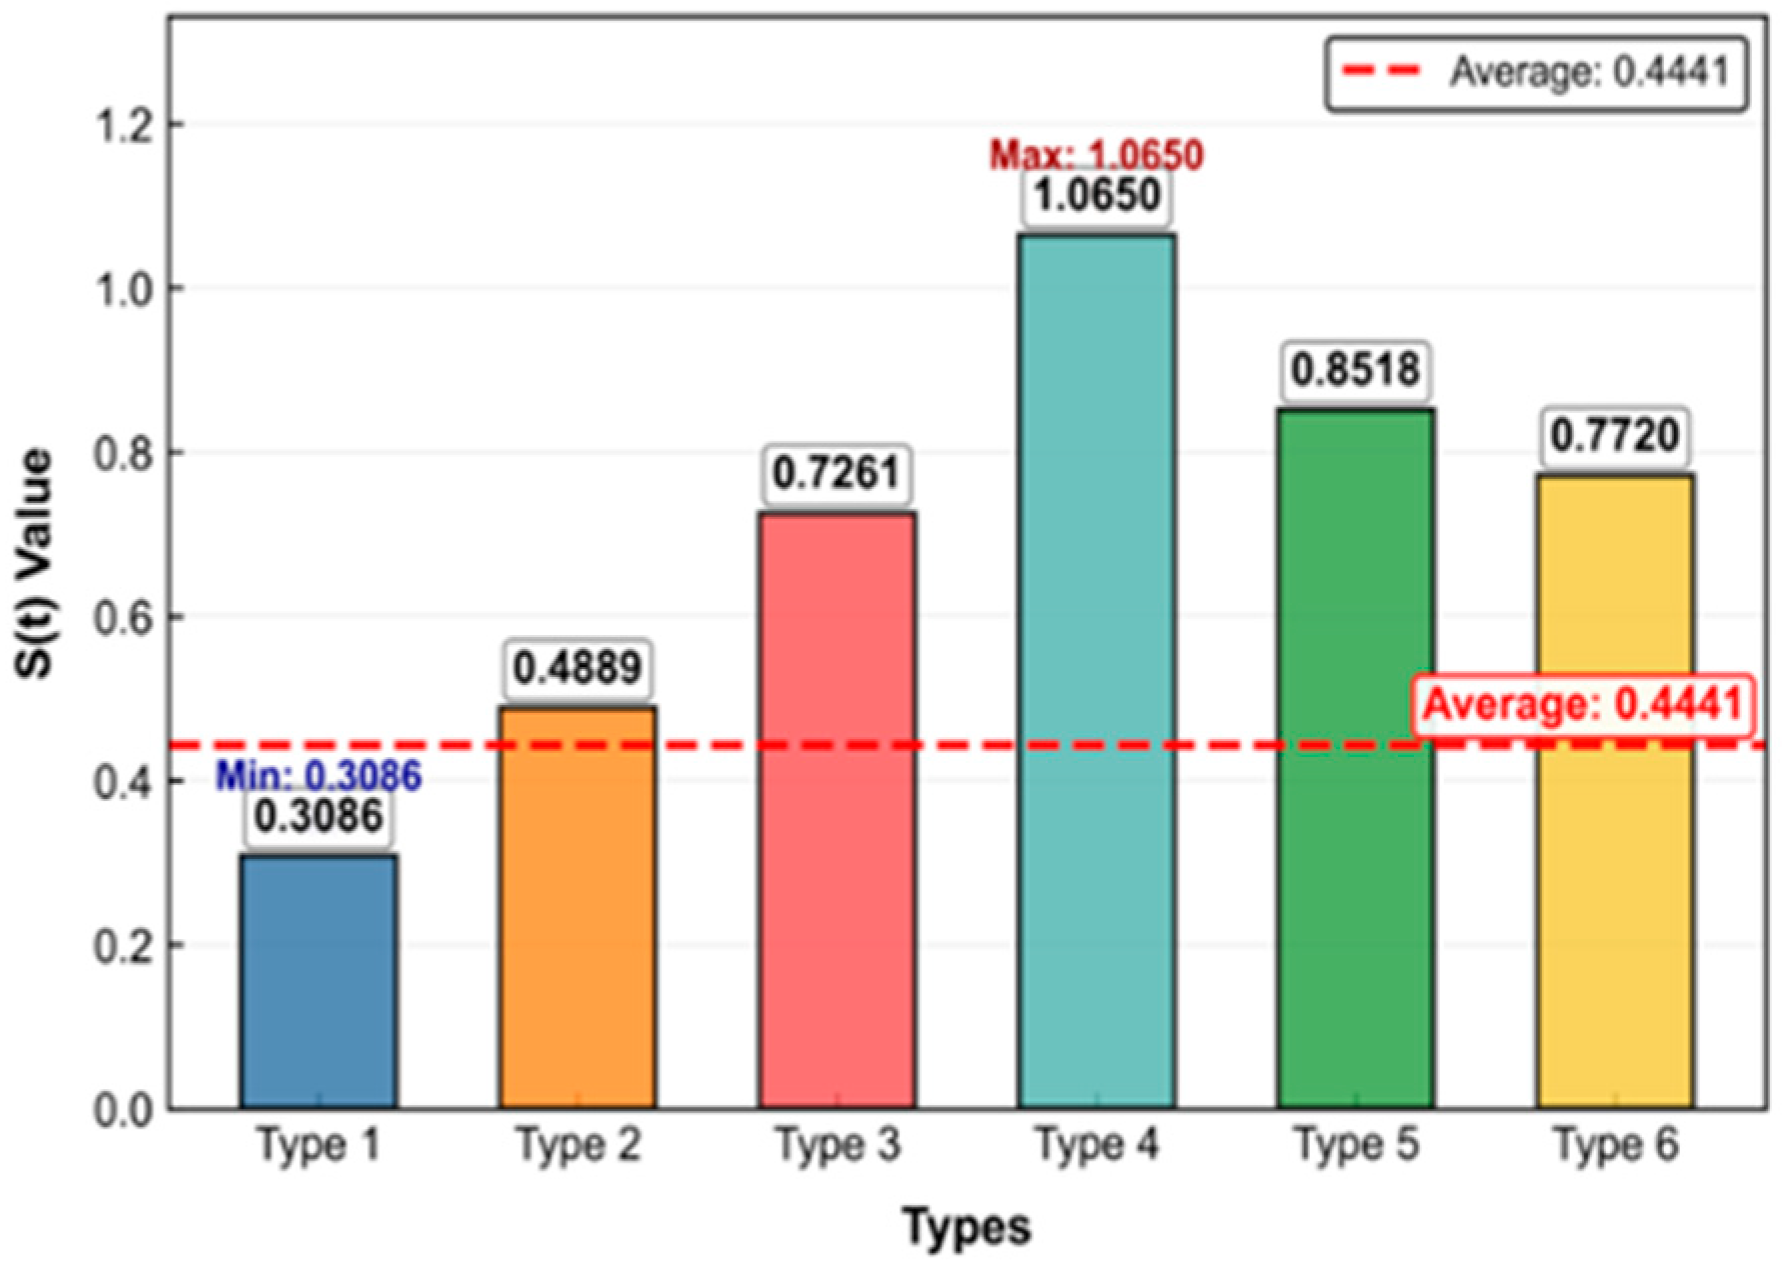
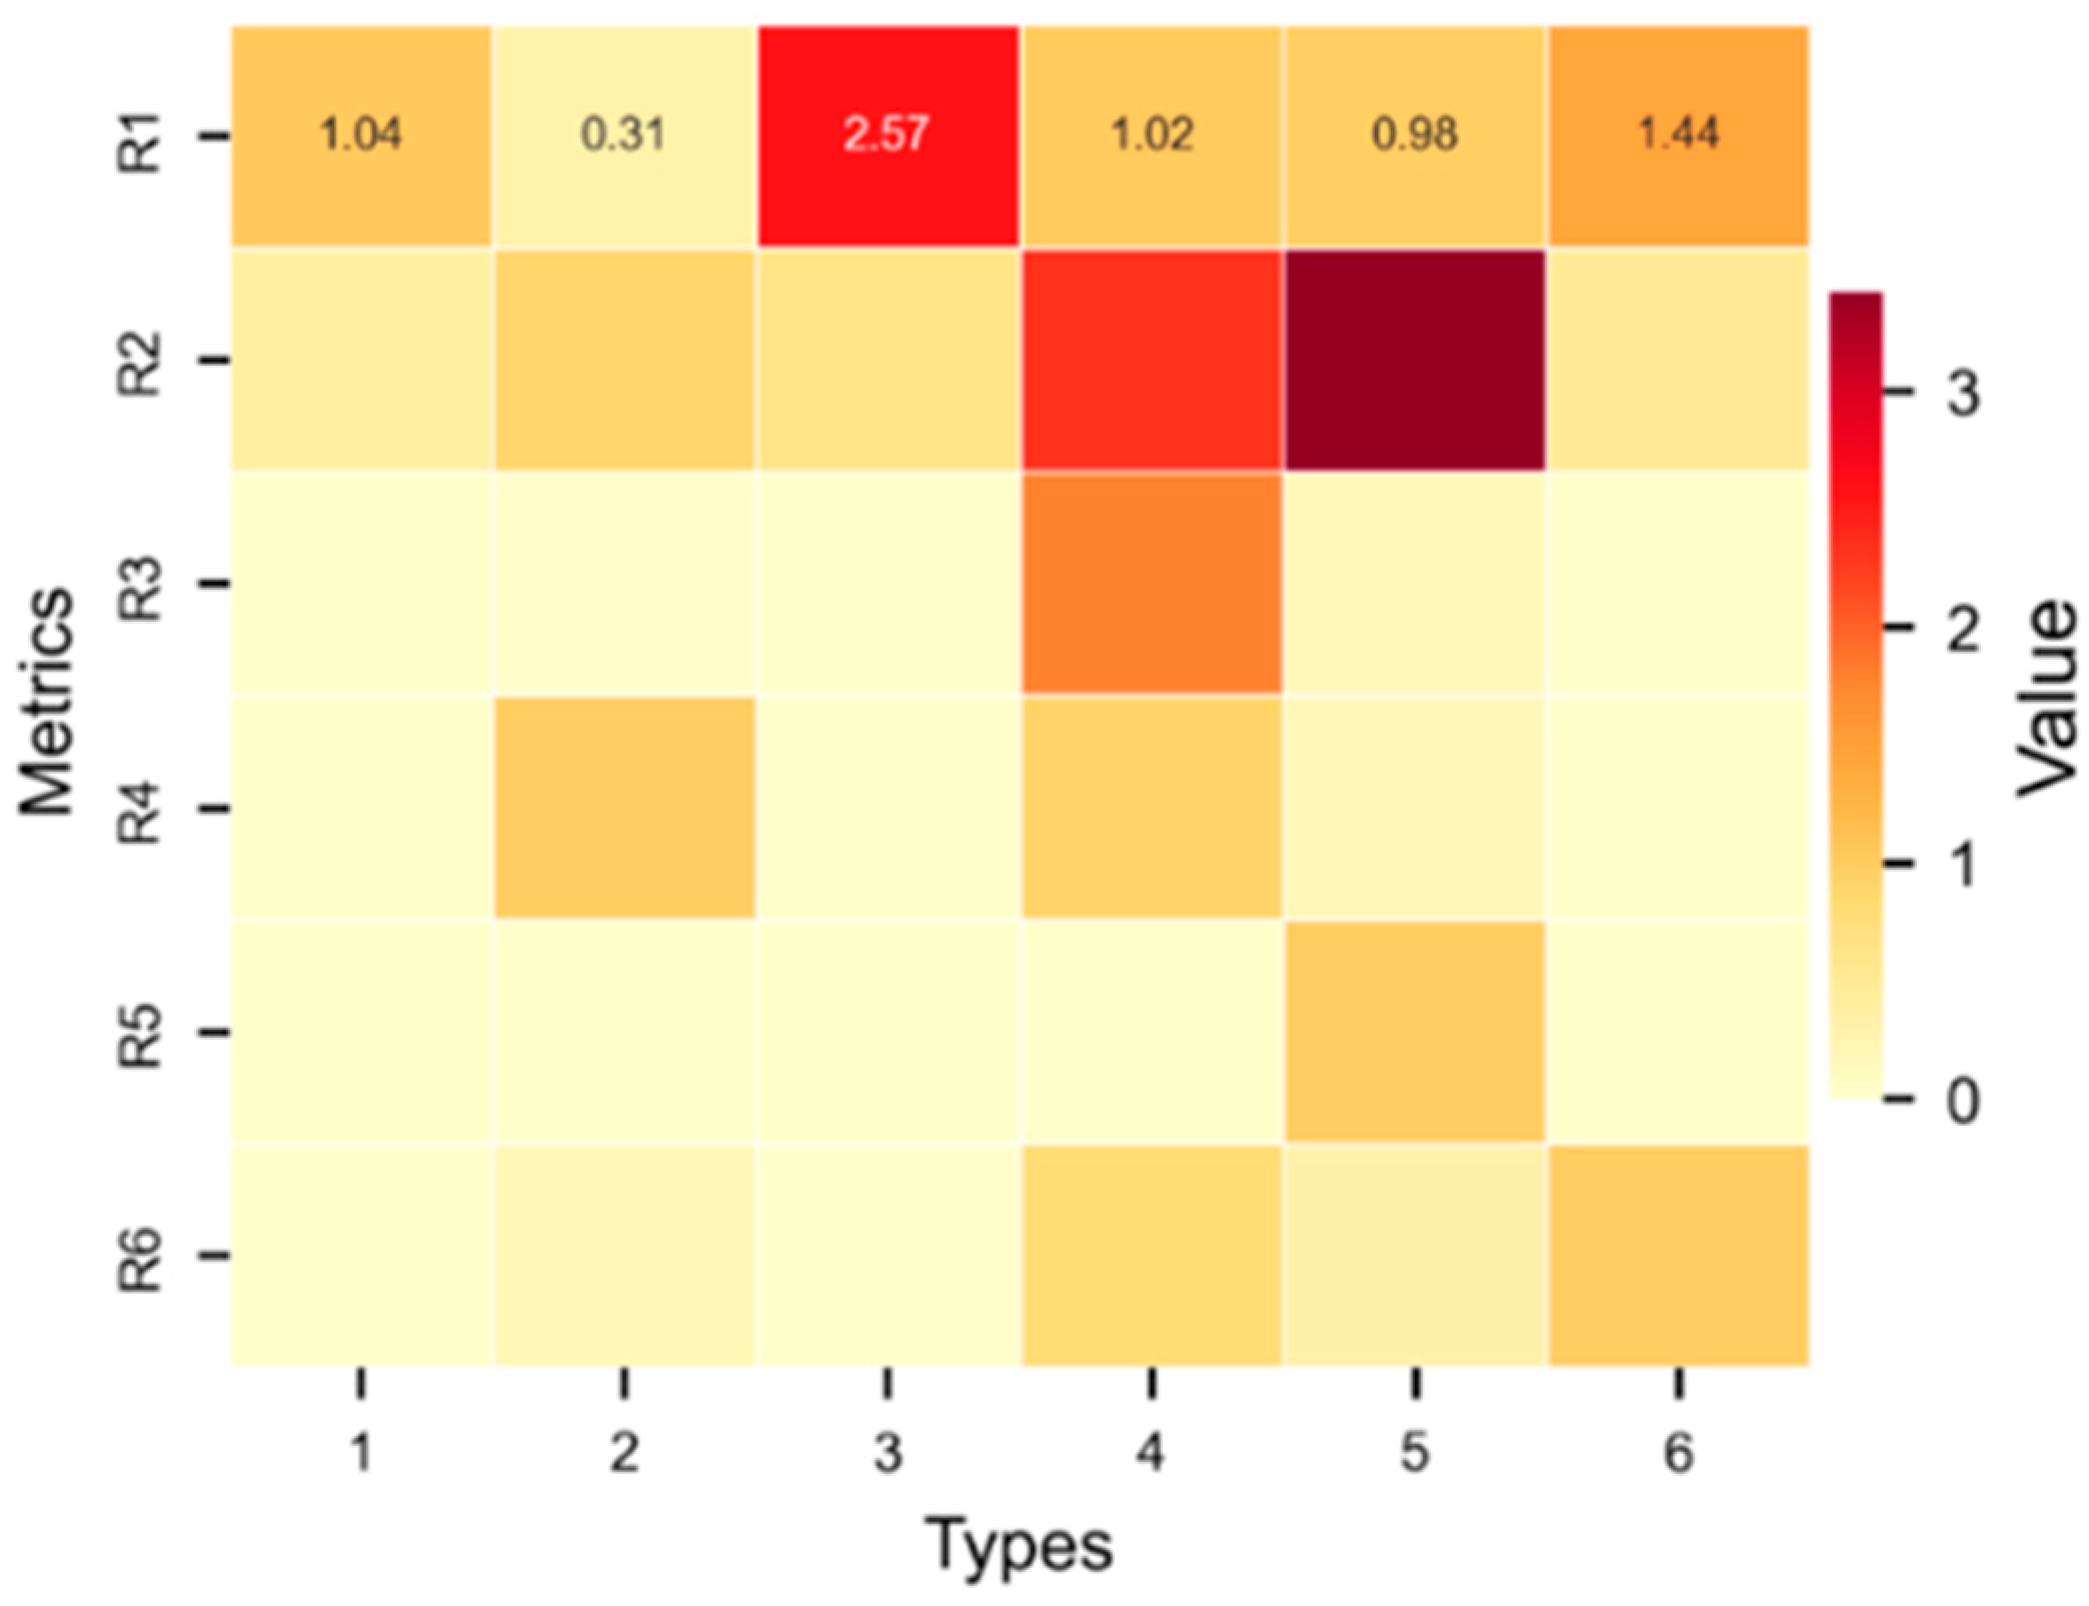
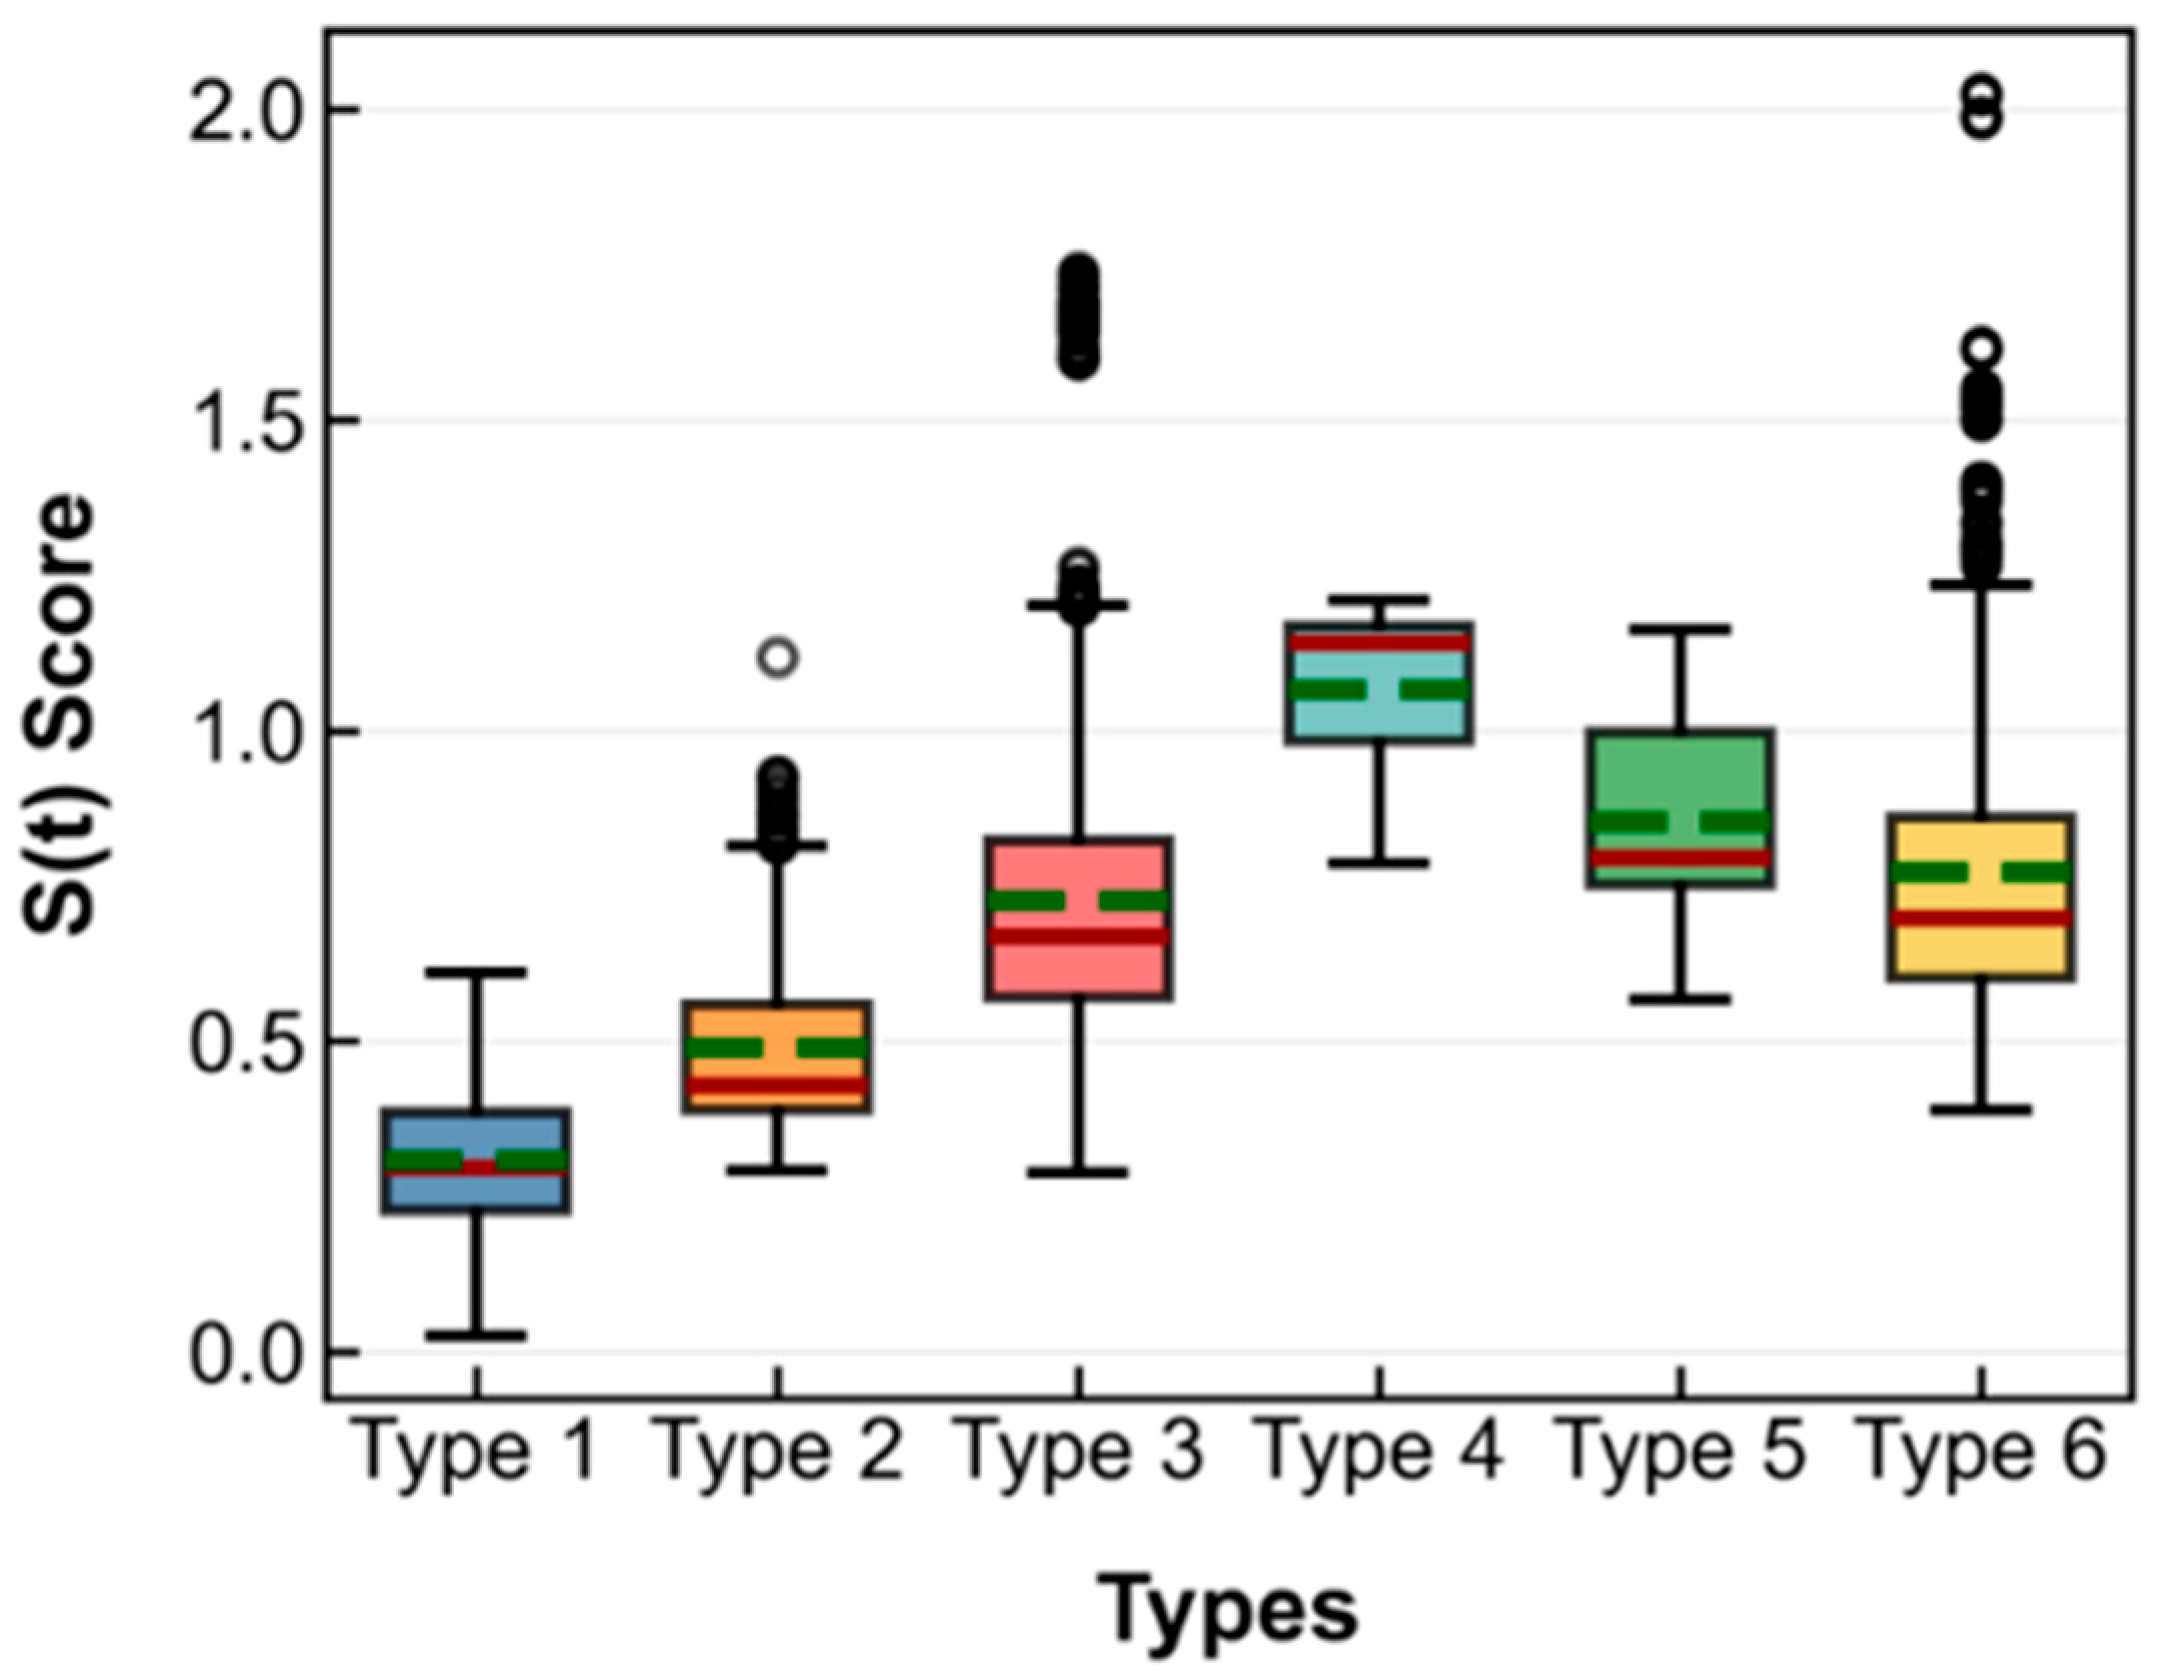
Figure 4, Figure 5 and Figure 6 illustrate the variation patterns of the sum of squared errors (SSEs), Calinski–Harabasz (CH) Index, and silhouette coefficient, respectively, as the number of clusters k increases from 2 to 10. Figure 4 shows that when k is less than or equal to 6, the SSE decreases significantly as k increases, indicating continuous optimization of the clustering effect. However, when k is greater than 6, the rate of decrease in SSE slows noticeably (elbow criterion), suggesting that further increasing the number of clusters provides limited improvement to the model and may lead to overfitting. Figure 5 shows that the CH Index increases with the number of clusters, reaching a local peak at k is equal to 6, which indicates optimal intra-cluster compactness and inter-cluster separation. When k is greater than 6, the growth of the index slows, further validating k is equal to 6 as a reasonable choice. Figure 6 shows that the silhouette coefficient at k is equal to 6 is 0.672, which is relatively high (greater than 0.5), indicating good cohesion and distinctiveness in the clustering results. When k is greater than 6, the coefficient drops rapidly to 0.38, reflecting structural looseness due to over-clustering. Considering these three metrics collectively, k is equal to 6 ensures clustering effectiveness while avoiding overfitting, making it the optimal number of clusters. Based on this, the counts and proportions of each category are shown in Figure 7, while the heatmaps of the comprehensive scores and mean values of each indicator, along with the box plot distribution of the comprehensive scores, are presented in Figure 8, Figure 9 and Figure 10, respectively.
Based on the analysis results from Figure 7, Figure 8, Figure 9 and Figure 10, and considering the actual meanings of each indicator, the six types of driving behaviors were defined and their risk levels were classified as follows:
(a)
Type 1 (low-risk behavior, proportion: 66.70%): This type had the lowest comprehensive score of 0.3086. The mean values of all quantitative indicators (R1~R3) were below the overall average, and the threshold indicators (R4~R6) were almost never triggered. The box plot showed a concentrated distribution with no outliers, indicating stable driving behavior with controllable risk, consistent with the definition of “low risk”.
(b)
Type 2 (medium-risk lane-pressing behavior, proportion: 2.37%): This type consistently triggered the lateral displacement threshold R4(t), indicating a tendency to persistently drive on or over lane markings, which poses risks to vehicles in adjacent lanes. The box plot contains outliers, suggesting that some behaviors may involve additional risks (such as sudden acceleration/deceleration) and should be closely monitored in warning systems.
(c)
Type 3 (medium-risk weaving behavior, proportion: 26.69%): The coefficient of variation for lateral displacement R1(t) was the highest among all types at 2.5684, reflecting frequent trajectory oscillations. Although no thresholds were triggered, the high dispersion in the box plot (multiple outliers) indicates unstable behavior that may cause surrounding vehicles to take evasive action.
(d)
Type 4 (high-risk behavior, proportion: 0.03%): This type had the highest comprehensive score of 1.0650, and its dynamic collision risk index R3(t) was also the highest at 1.7878. The other three indicators were also at elevated levels, indicating a combination of multiple risks such as lateral displacement, sudden acceleration/deceleration, and tailgating. Although this behavior is extremely rare, it carries a very high accident probability and requires real-time intervention.
(e)
Type 5 (medium-risk sudden acceleration/deceleration behavior, proportion: 0.03%): This type had the highest longitudinal acceleration fluctuation index R2(t) at 3.4196 and consistently triggered the longitudinal acceleration threshold R5(t), indicating abrupt acceleration/deceleration that may lead to rear-end collisions. Similar to Types 2 and 3, the box plot showed outliers, suggesting potential compound risks.
(f)
Type 6 (medium-risk tailgating behavior, proportion: 4.18%): This type consistently triggered the following risk threshold R6(t), indicating tailgating behavior that poses risks to the leading vehicle in the same lane. Outliers in the box plot suggest that some behaviors may be accompanied by sudden acceleration or trajectory deviation, requiring contextual analysis to determine the root cause of the risk.
For extremely rare classes, such as Type 4 (high-risk behavior) and Type 5 (medium-risk sudden acceleration/deceleration behavior), the absolute counts were 15 frames each, based on the total of 44,723 valid trajectory frames. Due to the small sample sizes (less than 0.1% of the total), conclusions drawn from these classes should be interpreted with caution. The limited number of instances may lead to statistical instability, reduced reliability in clustering results, and constraints on generalizability to broader scenarios. Future studies should aim to collect more data to validate these rare risk patterns.
Overall, low-risk behaviors constitute nearly 70% of the total, while medium- and high-risk behaviors are distributed across scenarios such as lane drifting, weaving, and sudden acceleration/deceleration. This distribution aligns with the real-world traffic pattern of “majority compliant, minority anomalous”. The presence of outliers in the box plots for Types 2, 3, and 6 suggests that individual driving events may involve multiple overlapping risks, highlighting the value of incorporating multi-dimensional indicator correlation analysis in warning models. Furthermore, the strong indicator performance observed for high-risk types (e.g., Type 4) is consistent with the high weights assigned to R6(t) and R1(t) by the CRITIC method, thereby corroborating the model’s reliability.

4.2. Performance Evaluation of the Warning Method

4.2.1. Overall Accuracy Comparison

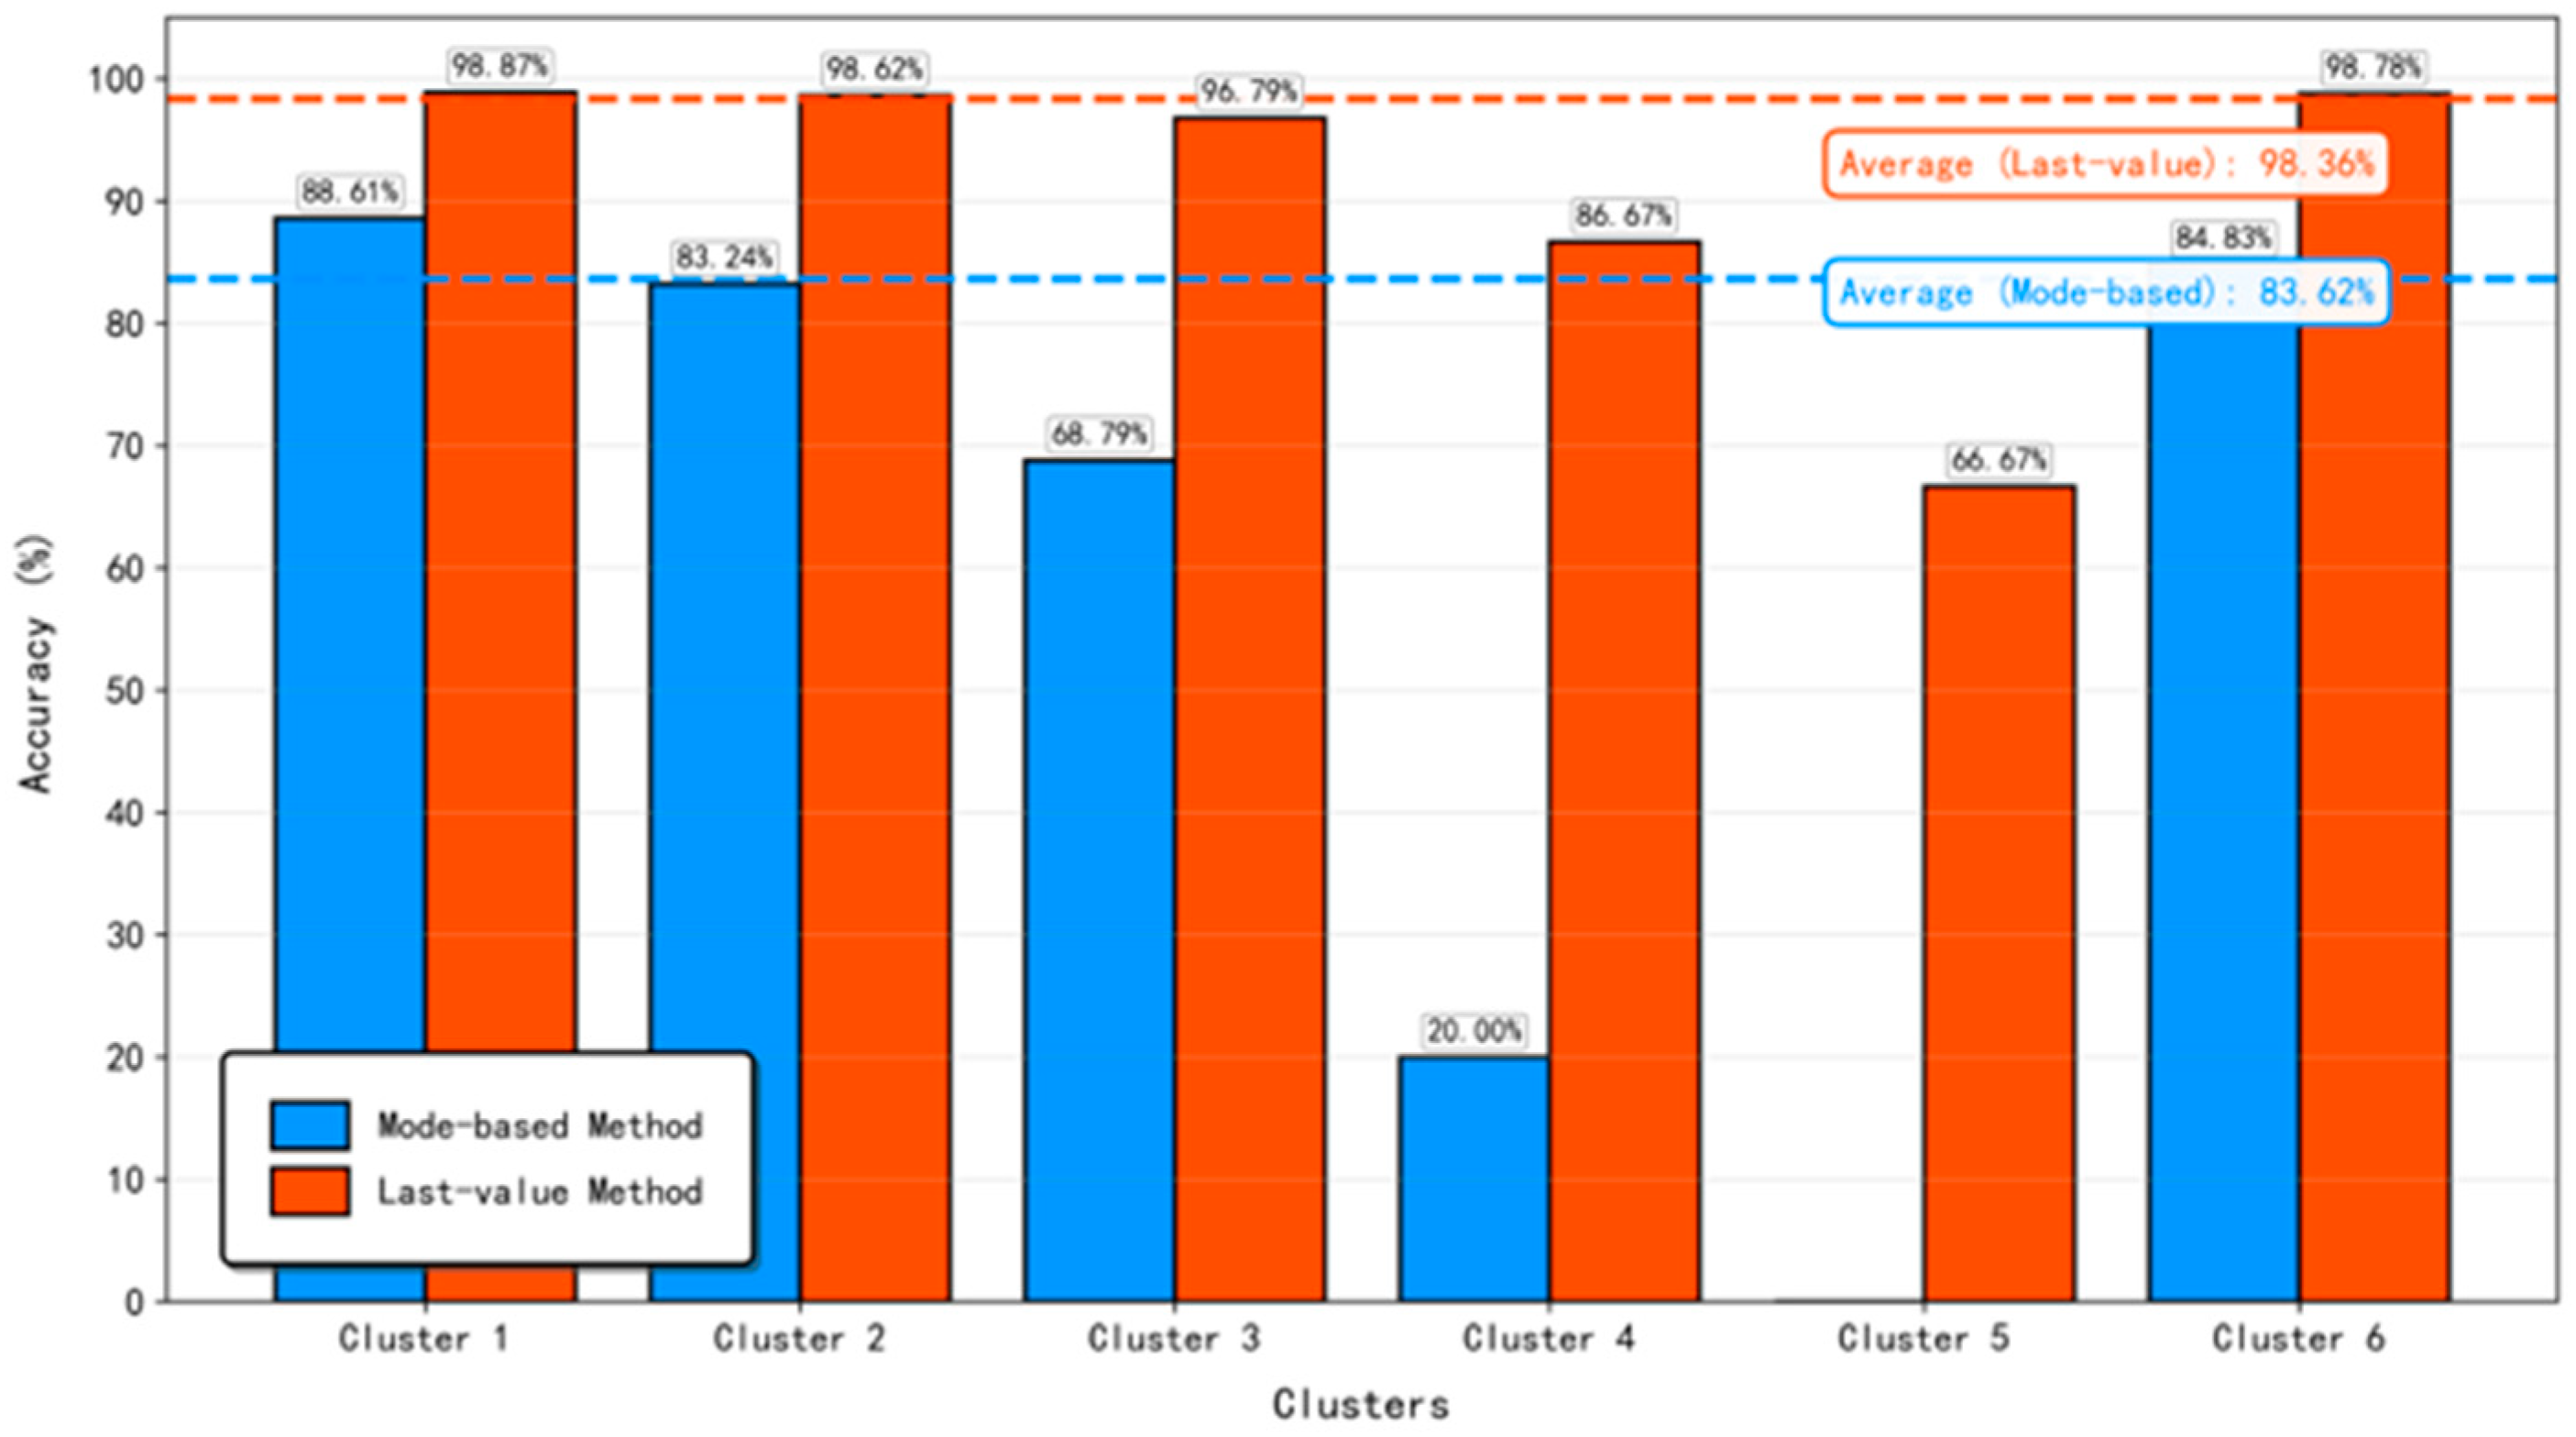
Figure 11 presents the per-type prediction accuracy of the mode method and the final-value method. Among the 40,058 prediction samples (starting from the 81st frame of each vehicle trajectory), the mode method achieved 33,495 correct predictions, corresponding to an overall accuracy of 83.62%; the final-value method achieved 39,403 correct predictions, with an overall accuracy of 98.36%. However, as noted in the review comments, overall accuracy at high frame rates can be inflated due to temporal persistence of risk states and does not fully reflect operational performance, especially under severe class imbalance. Therefore, we supplemented the evaluation with the following class-balanced and operation-oriented metrics.

4.2.2. Class-Balanced and High-Risk Event Performance

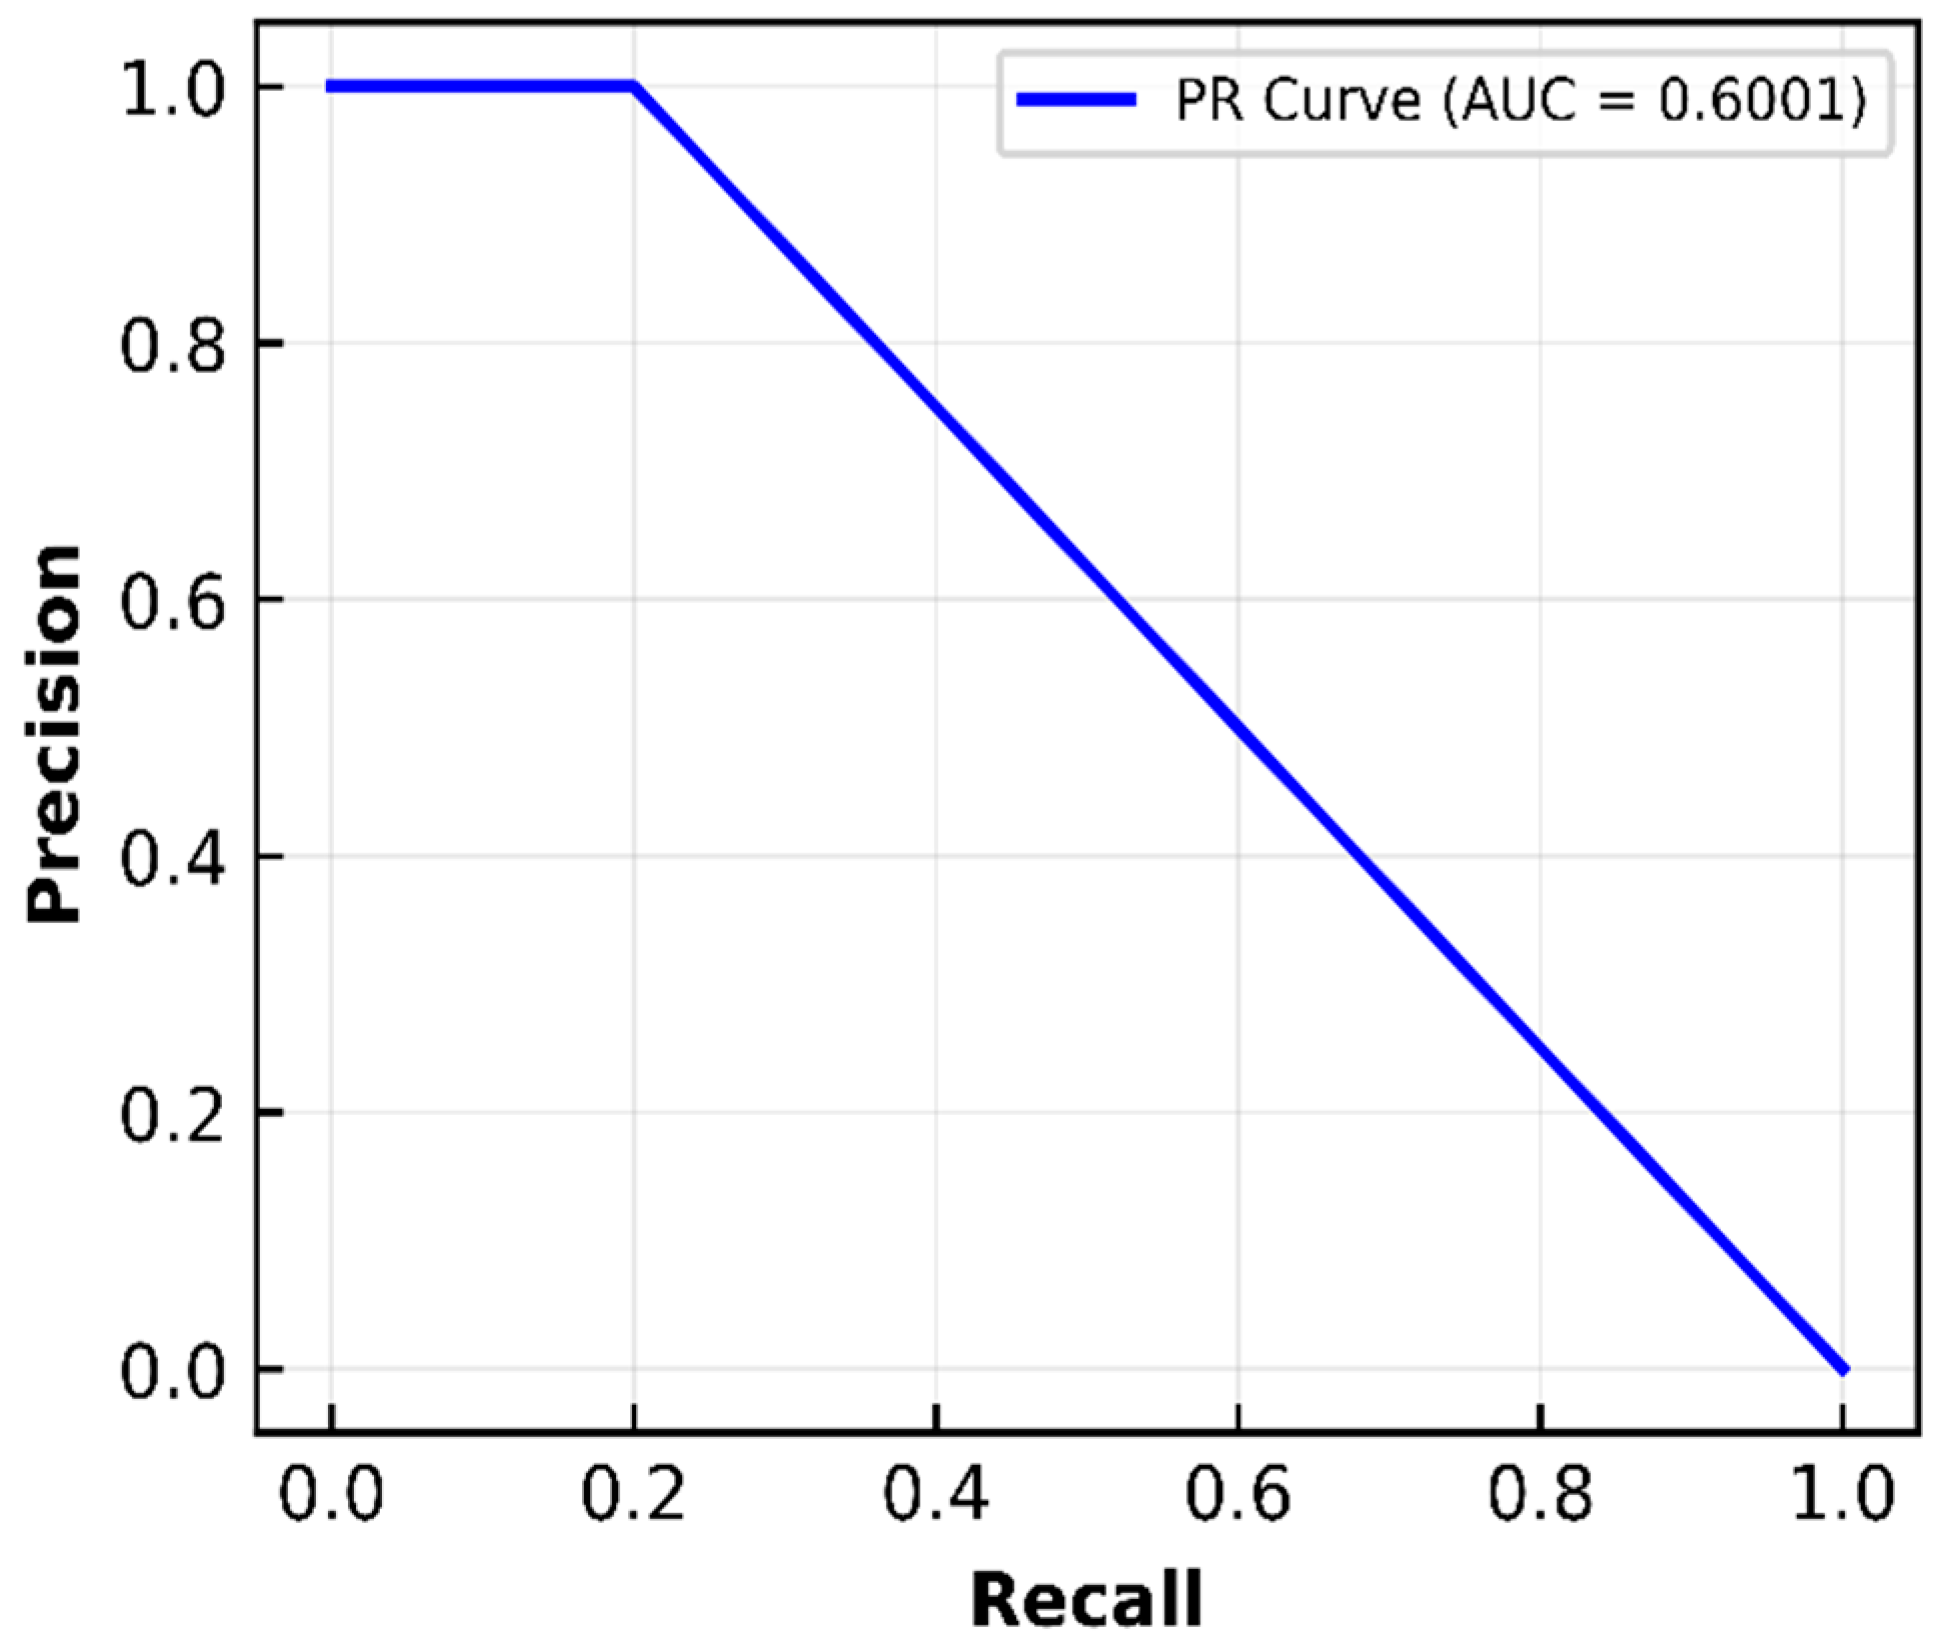
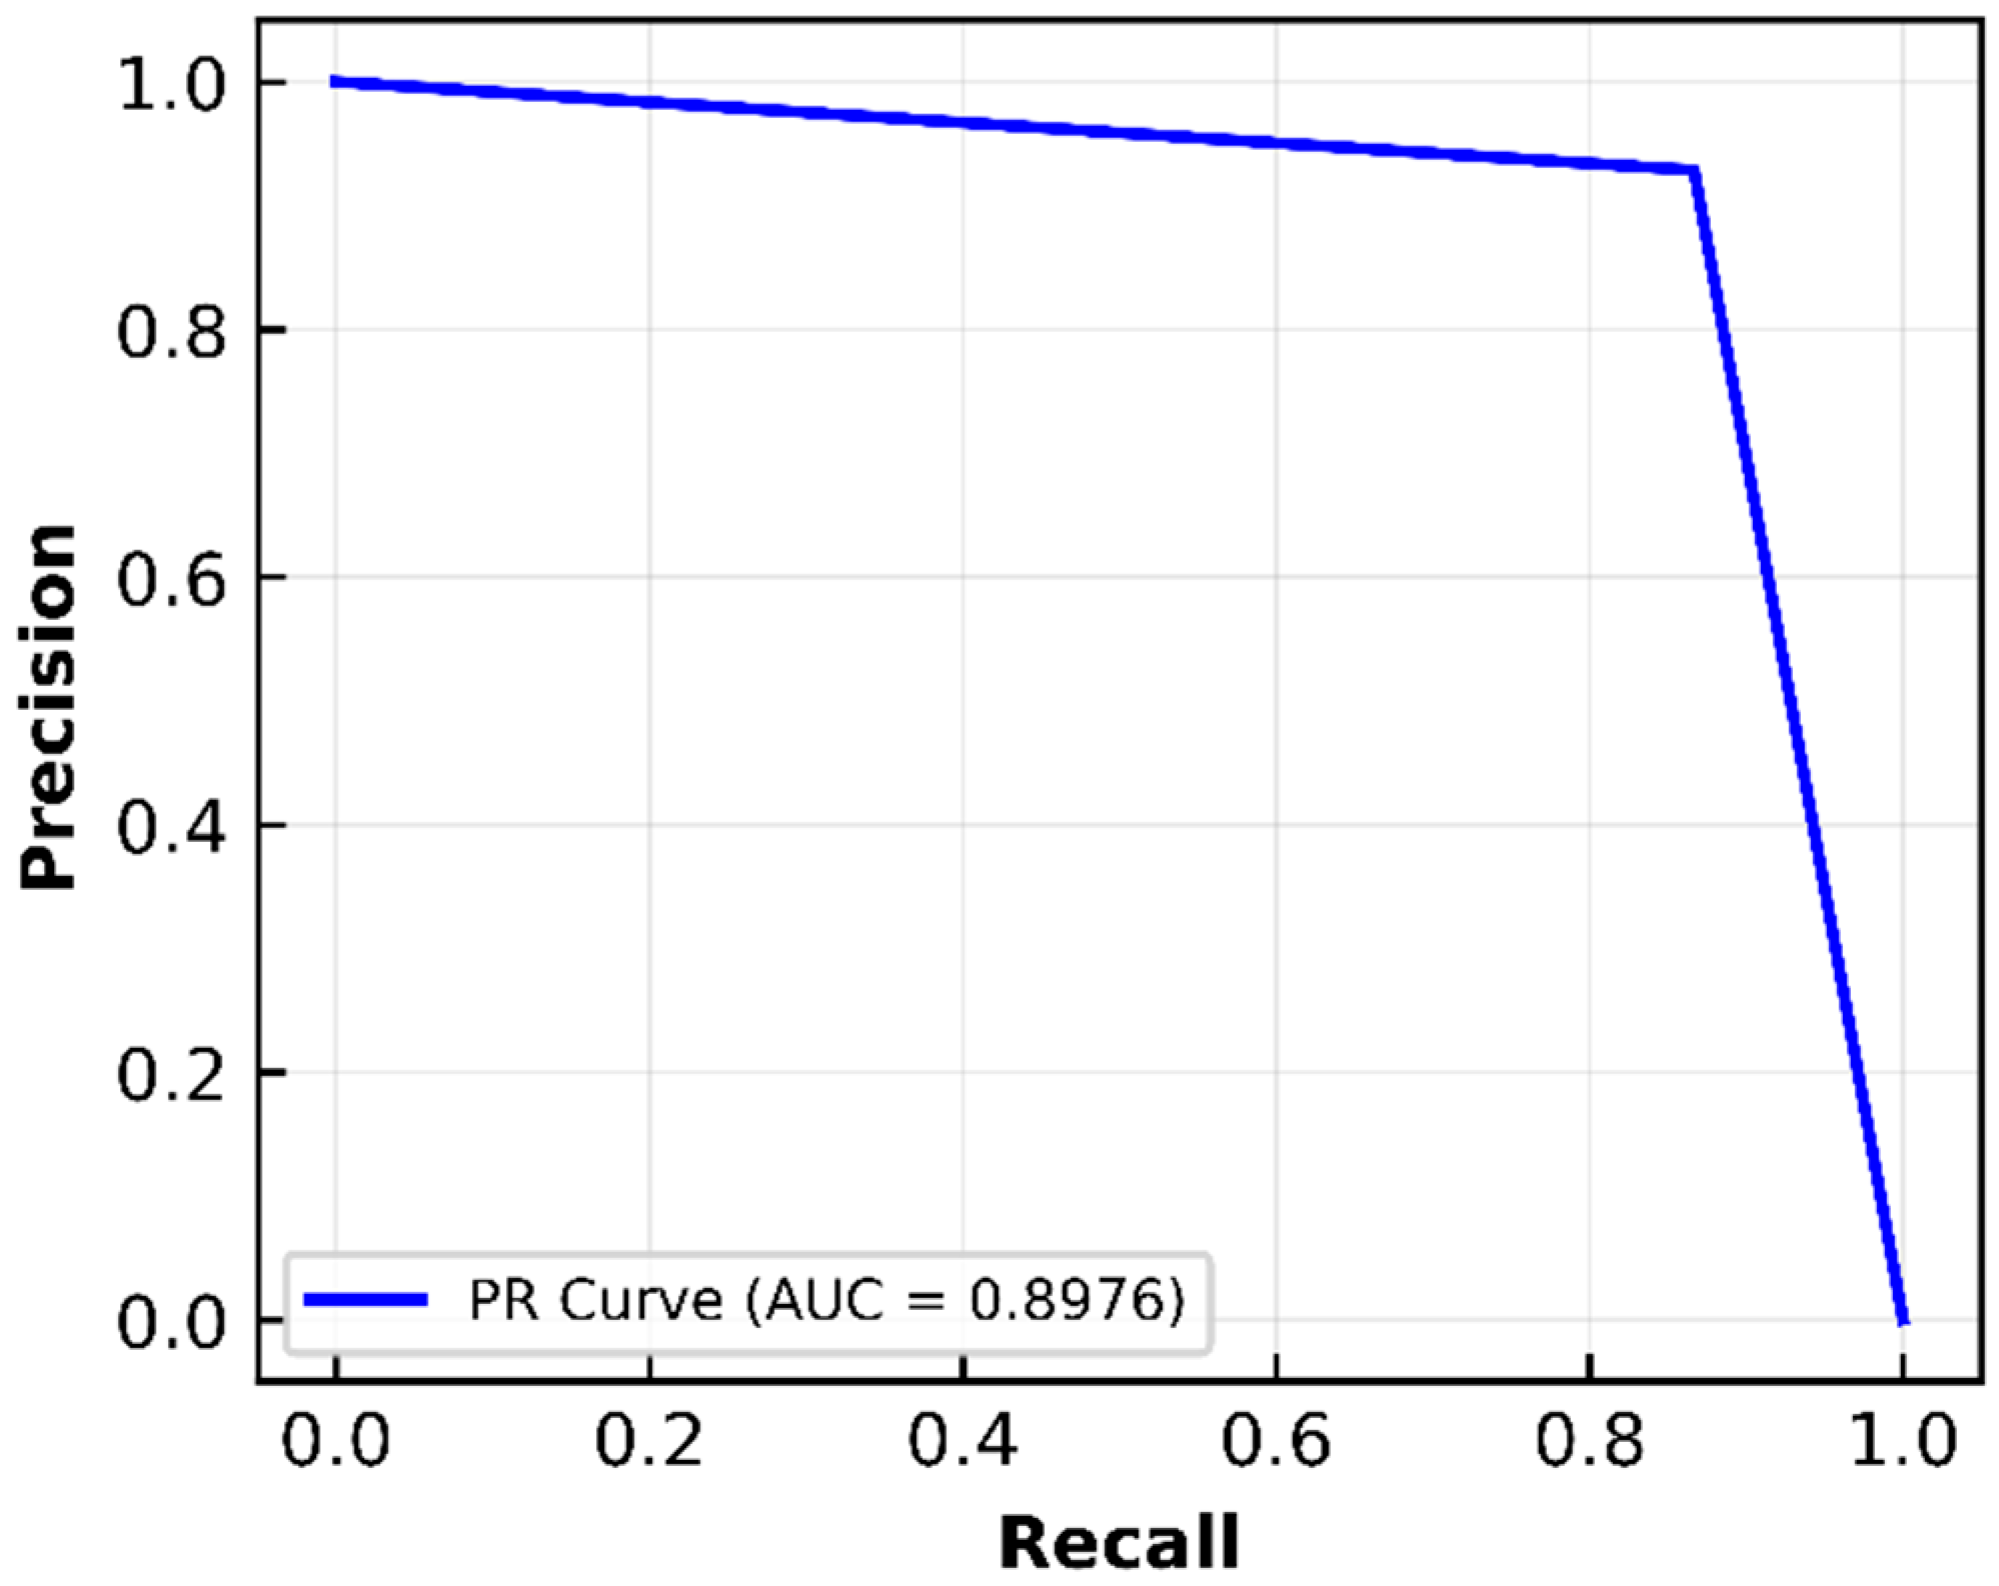
As summarized in Table 2, the final-value method consistently outperformed the mode method in both precision and recall across most behavior types. A focused analysis on high-risk events (Type 4) further revealed that the final-value method achieved a better balance between precision (92.86%) and recall (86.67%), yielding an F1-score of 89.66%. In contrast, while the mode method attained 100% precision (no false positives), its recall was only 20%, resulting in a low F1-score of 33.33%. This trade-off is clearly illustrated in the Precision–Recall (PR) curves: the mode method (Figure 12) achieved an AUC of 0.6001, indicating limited ability to detect critical high-risk events; the final-value method (Figure 13) raised the AUC to 0.8976, confirming its robustness in identifying rare but safety-critical events.

4.2.3. Performance Analysis of Early Warning Methods Based on Confusion Matrix

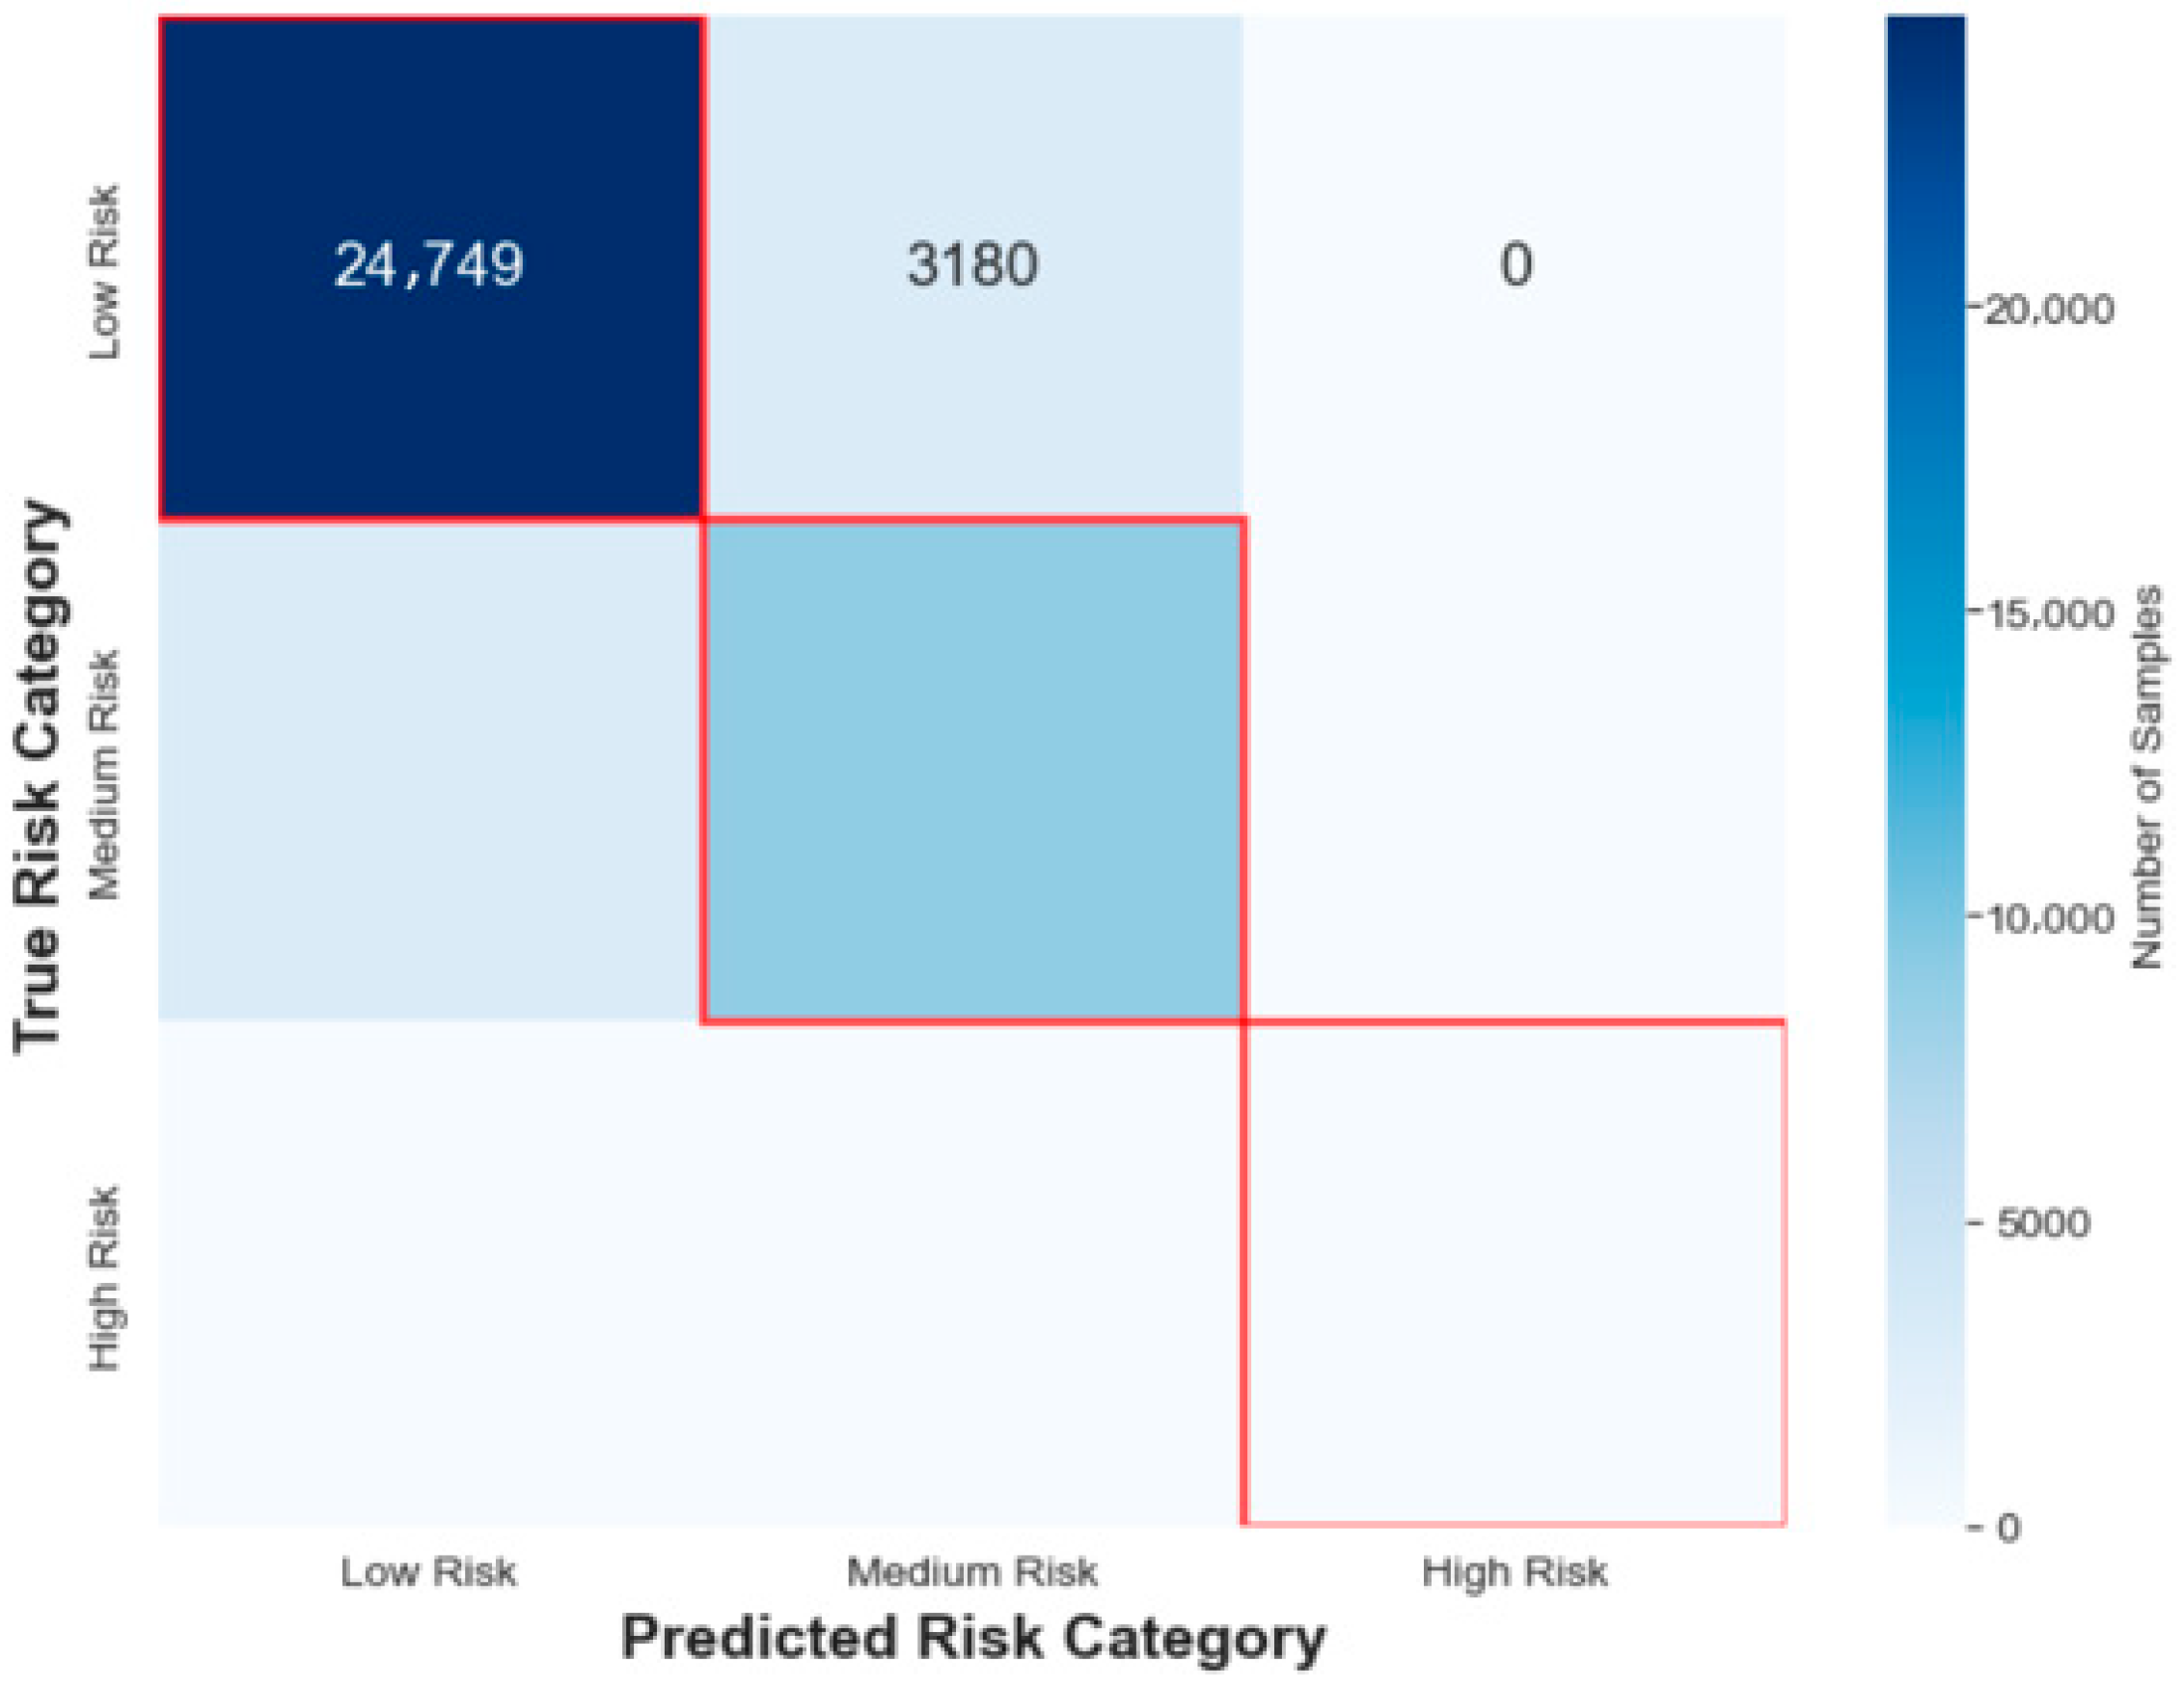
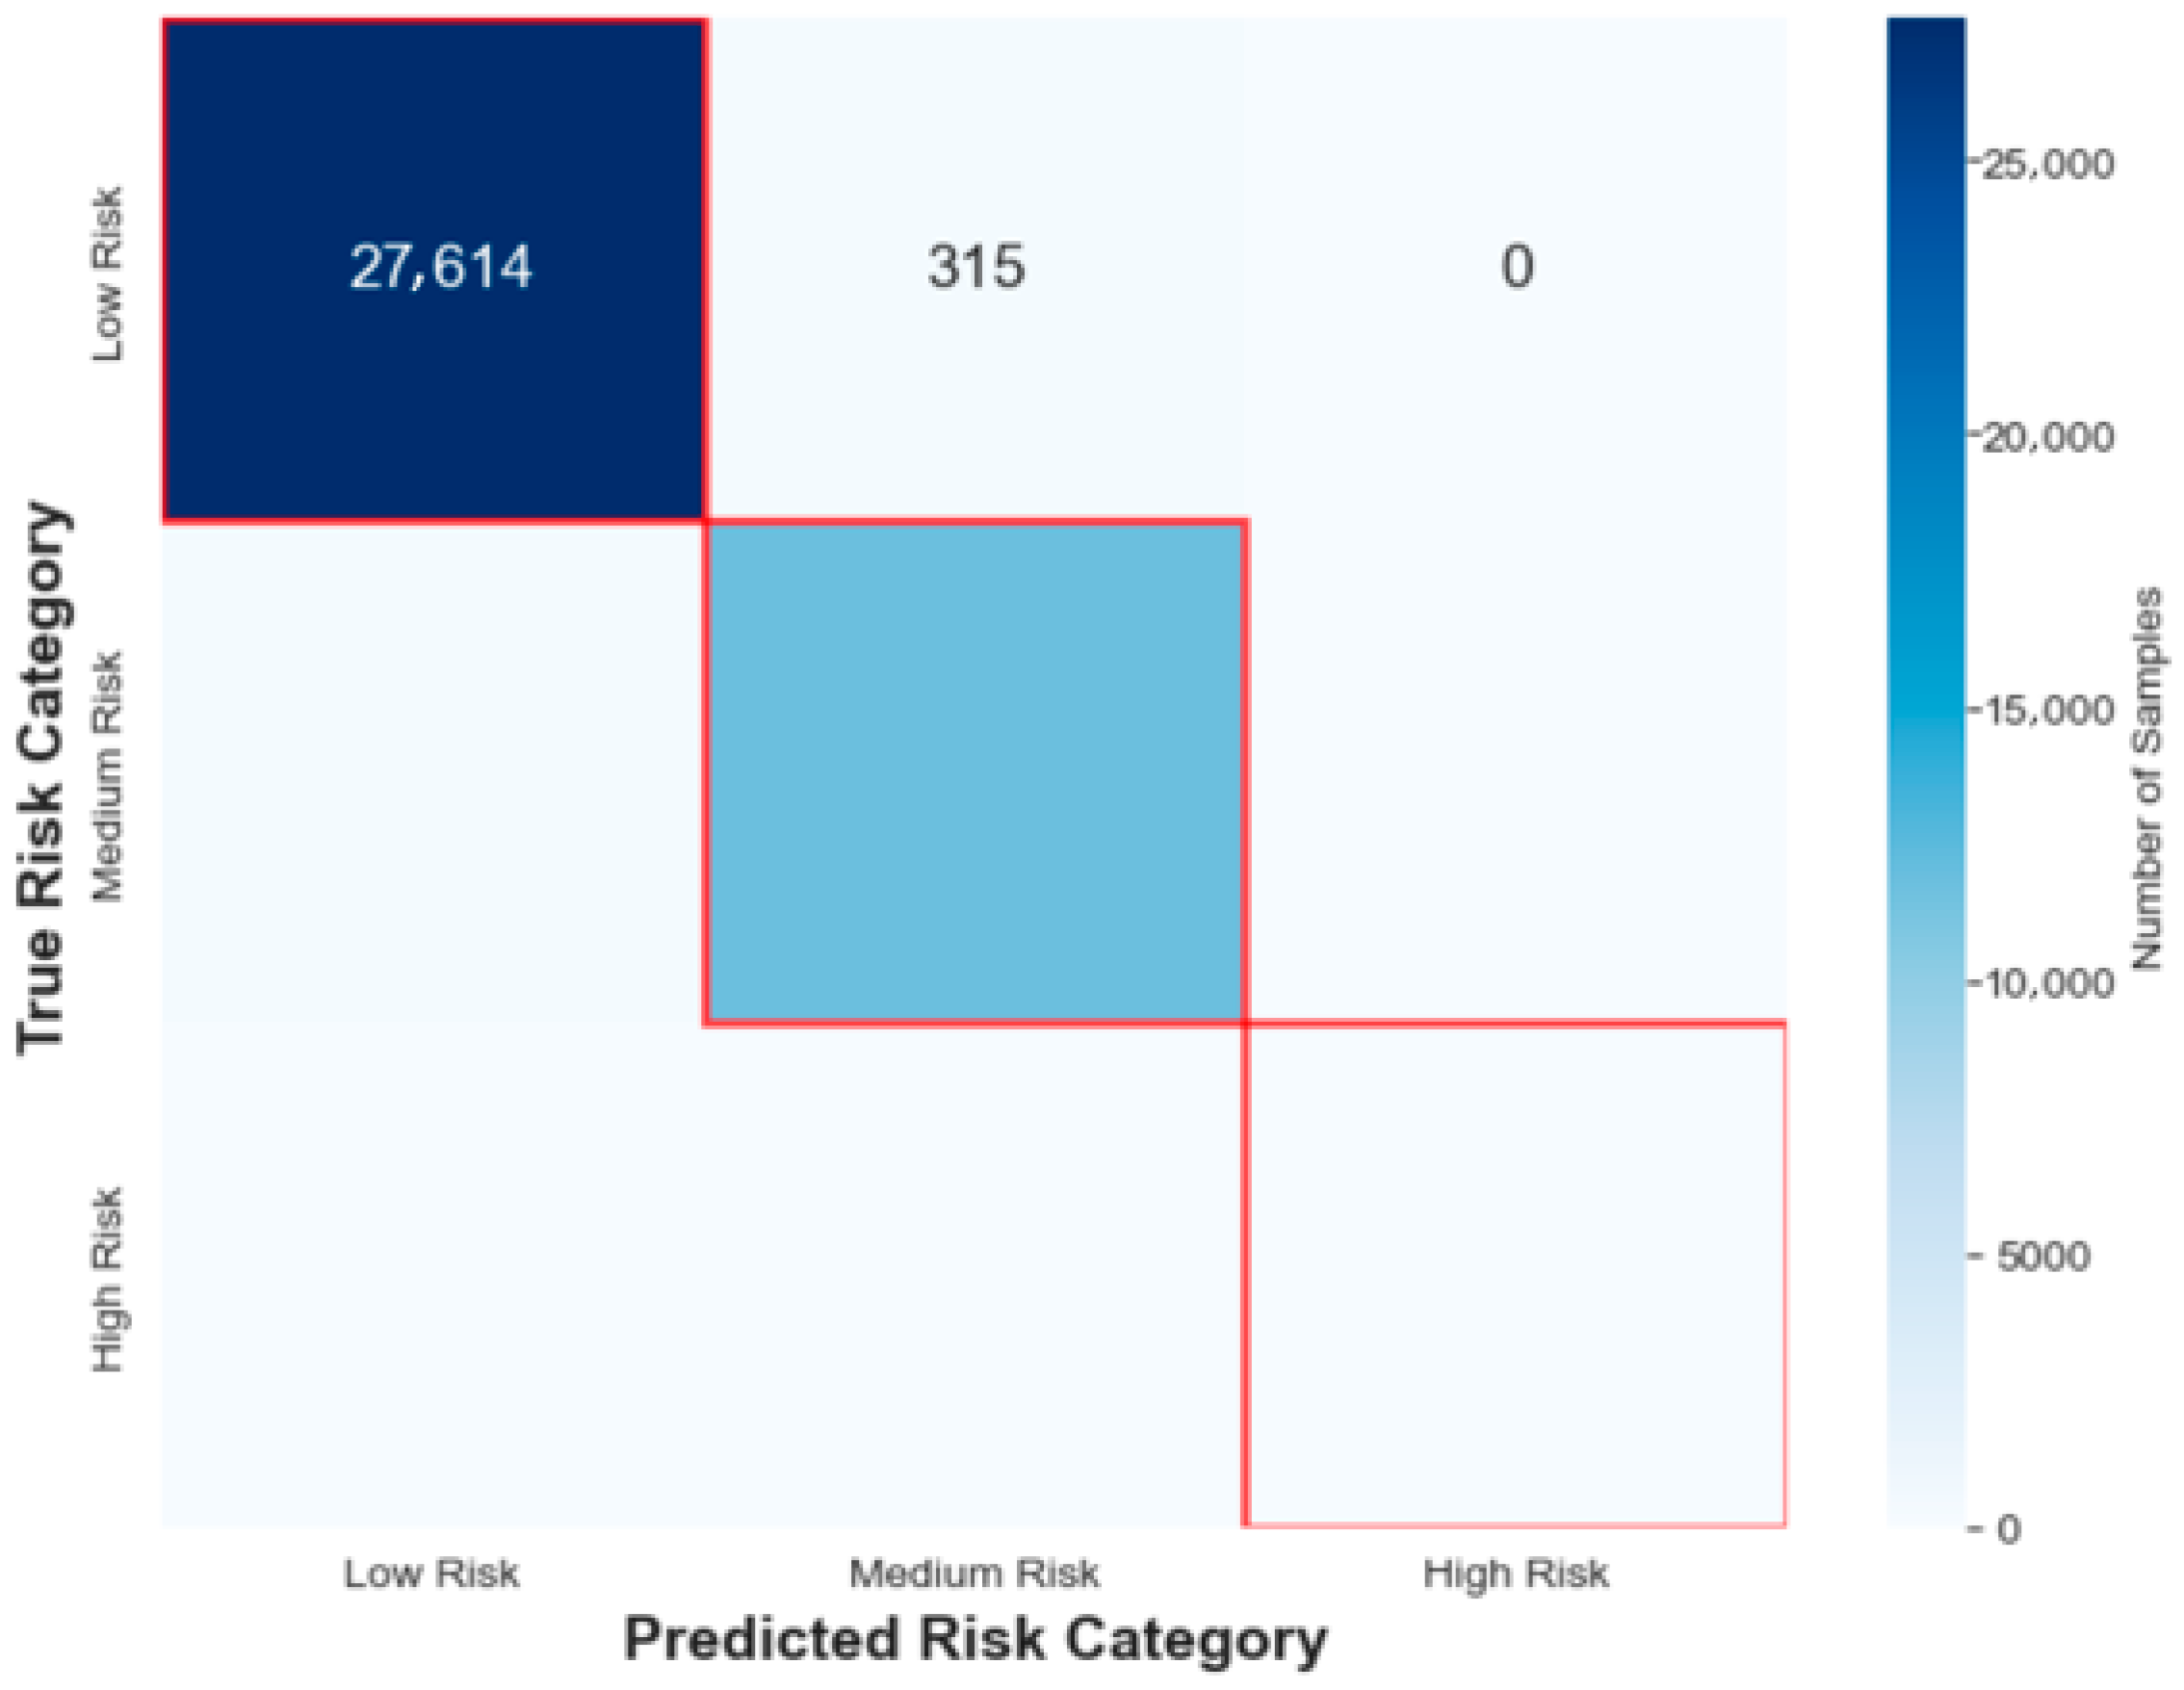
By comparing and analyzing the risk classification error patterns of the mode method and the final-value method through the aggregation confusion matrix (Figure 14 and Figure 15), the key differences can be intuitively revealed: the mode method has serious underreporting in the identification of high-risk events, with 12 true high-risk cases being misjudged as low-risk (only 3 were correctly identified), while the final-value method completely avoids such errors (no high-risk cases were misjudged as low-risk), with only 2 high-risk cases being misjudged as medium risk (13 were correctly identified). This indicates that the final-value method has higher reliability in detecting rare and high-risk events, and its errors are more concentrated in the medium and high-risk boundaries rather than serious missed reports, which is more in line with the accuracy requirements of real-time safety warning.

4.3. Detailed Case Analysis

To further address the operational value of warnings, we evaluated two time sensitive metrics on high risk segments: (1) Average response delay: the time delay from the occurrence of a risk to the system identifying and issuing an alert, and (2) Warning consistency: the proportion of high risk duration during which the system continuously issues alerts. Quantitative results (Table 3) demonstrated a significant performance difference between the two methods. The mode method exhibited a substantial delay of 5.48 s with low consistency (20%), indicating delayed and intermittent warnings. In contrast, the final-value method achieved a markedly shorter delay (0.04 s) and high consistency (86.7%), enabling near-instantaneous and sustained alerts throughout most of the risk duration. This stark contrast underscores the superiority of the final-value method in providing timely and reliable warnings, which is critical for practical applications requiring rapid intervention. The minimal delay and high coverage of the final-value method reduce the likelihood of missed detections during transient high-risk events, thereby enhancing operational safety.
Both metrics were substantially higher for the final-value method, confirming its practical utility in providing timely and stable warnings. The proposed real-time warning framework can be integrated into vehicle Telematics Box (T Box) terminals or fleet safety monitoring platforms. When a high risk state (e.g., Type 4) is predicted, the system can issue immediate alerts to the driver via the human–machine interface (e.g., dashboard display or voice prompts). Simultaneously, warning information can be transmitted in real-time via 4G/5G networks to a transport enterprise’s safety center, enabling remote monitoring and intervention. Future engineering implementation will involve further adaptation to specific vehicle hardware and communication protocols.
Detailed analysis of the prediction results for each type:
(1)
Type 1 (low-risk behavior): the final-value method achieved an accuracy of 98.87%, substantially outperforming the mode method (88.61%). This difference can be attributed to the stable nature of Type-1 behavior. By utilizing the most recent state, the final-value method reliably captures the current low-risk profile. In contrast, the mode method depends on historical data patterns, which may introduce latency-related errors.
(2)
Type 2 (medium-risk lane departure) and Type 6 (medium-risk following too closely): the final-value method achieved accuracy rates exceeding 98% in both cases, whereas the mode method attained only approximately 83% to 85%. These results indicate that the final-value method demonstrates markedly higher sensitivity to short-term, medium-risk behavioral changes and exhibits superior adaptability.
(3)
Type 3 (medium-risk weaving driving): the final-value method achieved an accuracy of 96.79%, significantly outperforming the mode method (68.79%). This substantial gap indicates that weaving behavior is inherently dynamic and transient. The final-value method effectively captures such real-time trajectory variations, whereas the mode method, relying on a longer historical window, tends to smooth out critical risk features. This often results in delayed detection and increased misjudgment.
(4)
Type 4 (high-risk behavior) and Type 5 (medium-risk rapid acceleration/deceleration): for Type 4, the accuracy of the mode method was extremely low (20.00%) compared to a relatively high accuracy of 86.67% for the final-value method. In Type 5, the mode method failed entirely (0.00% accuracy), whereas the final-value method achieved 66.67%. This stark contrast likely stems from the very small sample sizes of both types (each representing only 0.03% of the total). Relying on historical patterns derived from larger datasets, the mode method struggles to generalize effectively to such rare behaviors. While the final-value method was less affected by sample scarcity, its accuracy in these two cases remained the lowest among all behavior types. This further highlights the inherent challenge in predicting rare, high-risk events.
In summary, the final-value method demonstrates distinct advantages. Its accuracy meets or exceeds that of the mode method across all six behavior types, achieving an average improvement of approximately 15 percentage points. The method responds more promptly to short-term risk behaviors, rendering it more suitable for real-time early-warning applications. In contrast, the mode method relies more heavily on historical data patterns, exhibits poorer adaptability to volatile or infrequent behaviors, and tends to respond with a lag, making it more susceptible to erroneous judgments.

5. Discussion

Building upon the experimental results and methodological validation presented in Section 4.2 and Section 4.3, this section provides a synthesized interpretation of the key findings, contextualizes them within the existing body of research, examines the reliability of the model—particularly for rare events—and candidly addresses the limitations of the current study. This discussion aims to elucidate the “why” behind the observed patterns and the “so what” of the proposed framework.

5.1. Risk Clustering Results Analysis

The derived six-category risk taxonomy revealed a distribution where low-risk behaviors (Type 1) constitute the majority (66.70%), while medium- and high-risk behaviors are dispersed across specific patterns such as weaving, tailgating, and sudden acceleration/deceleration. This aligns strongly with the real-world traffic paradigm of “majority compliant, minority anomalous”. The predominance of low-risk driving is consistent with findings from large-scale trajectory data analyses, which suggest that most drivers operate within stable safety margins under normal highway conditions [12]. The identification of distinct medium-risk clusters (Types 2, 3, 5, 6) underscores that risk is not monolithic but manifests in specific, measurable behavioral syndromes—such as lateral instability (weaving) and inadequate headway (tailgating)—which have been independently linked to increased collision probability in prior driving style research [10]. The extreme rarity yet critical nature of the high-risk cluster (Type 4, 0.03%), characterized by the co-occurrence of multiple risk indicators, echoes studies on risk aggregation in commercial vehicle fleets, where severe incidents often arise from a convergence of factors rather than a single aberration [9]. This multi-dimensional clustering outcome validates the core premise of our framework: a comprehensive risk score, integrating diverse indicators, is necessary to capture the nuanced spectrum of real-world driving behavior.

5.2. Model Performance and Comparative Analysis

The superior performance of the final-value warning method over the mode-based method, especially for medium- and high-risk events, carries significant implications. The mode method’s high precision but critically low recall (20%) for high-risk events exemplifies a failure case where a model optimized for avoiding false alarms becomes virtually blind to true dangers—an unacceptable trade-off in safety-critical applications. In contrast, the final-value method’s balanced high performance (Precision: 92.86%, Recall: 86.67%) demonstrates the advantage of leveraging immediate temporal context for dynamic risk assessment. The aggregation confusion matrix analysis further supports this conclusion, showing that the final-value method completely avoids the serious error of high-risk events being misjudged as low-risk (zero false negatives), while the pattern rule has 12 such errors, highlighting its reliability gap in rare event detection. This aligns with and extends the direction of real-time warning research that emphasizes responsiveness to transient risk states [25]. The CRITIC weight distribution, which assigned the highest importance to car-following risk (R6) and driving instability (R1), is not merely a statistical outcome but provides a data-driven confirmation of domain knowledge: these two dimensions are paramount in heavy truck safety. The strong correspondence between these high-weight indicators and the characterization of the high-risk cluster (Type 4) internally validates the coherence of our measurement model.

5.3. Implications of Rare High-Risk Event Detection

The effective identification of the extremely rare Type 4 behaviors, despite a sample size of only 15, is a notable strength but warrants careful consideration. The model’s high sensitivity to these events is promising for proactive safety intervention. However, the small sample size inherently limits the statistical power for generalizing about this cluster’s properties and underscores the challenge of modeling “black swan” events in transportation. The robustness of the clustering for this group, as suggested by its clear separation in the feature space (Figure 8 and Figure 9) and its coherent multi-indicator profile, is encouraging. However, the ultimate test of reliability for such rare-class detection lies in external validation across diverse datasets and scenarios, which remains a vital task for future work.

5.4. Limitations and Future Research

This study has several limitations that define its scope and indicate necessary future work. First, the reliance on trajectory data from a single straight highway segment limits the generalizability of the findings to similar structured environments. The model’s performance in complex scenarios (e.g., curves, interchanges, adverse weather) requires future validation. Extending the model to such diverse road and environmental conditions is a primary research direction. Second, while key parameters were carefully justified, a comprehensive sensitivity analysis was not conducted. Future work should include systematic tests (e.g., varying acceleration thresholds from 1.0 to 2.0 m/s2 and window lengths from 30 to 50 frames) to evaluate parameter robustness across different conditions. Third, the linear weighting (CRITIC) and K-means++ clustering ensure transparency and efficiency, but may not capture complex, non-linear interactions. Exploring advanced machine learning methods (e.g., LSTM, Random Forests) represents a valuable direction to potentially improve warning accuracy. Finally, the model currently uses instantaneous trajectory data. Future research should integrate multi-source data (e.g., vehicle load, driver logs) to incorporate long-term risk factors like fatigue, thereby enhancing assessment capability. Practical deployment challenges also warrant further investigation.
In summary, addressing these limitations through focused future work is essential to advance the framework from a proof-of-concept to a widely adaptable solution.

6. Conclusions

This study proposes a real-time early warning method for multi-dimensional driving risk in heavy trucks. Drawing on CQSkyEyeX trajectory data, the method integrates the CRITIC objective weighting technique with the K-means++ clustering algorithm. By constructing a comprehensive indicator system covering driving stability and car-following risk, a comprehensive risk score for driving behavior was obtained through linear weighting, and six driving behavior patterns were identified using clustering. Experimental results demonstrate that the proposed method could effectively distinguish driving behaviors at different risk levels, with low-risk behaviors accounting for 66.70%, medium-risk behaviors for 33.27%, and high-risk behaviors for only 0.03%. In terms of real-time warning, the final-value method achieved a warning accuracy of 98.36%, significantly outperforming the mode method (83.62%), verifying the effectiveness and practicality of the method in risk identification and dynamic early warning.
On a practical level, the risk classification system and management strategy developed in this study provide a quantitative basis and technical support for the differentiated supervision of heavy trucks. The warning outcomes can be delivered to drivers in real-time via in-vehicle human–machine interfaces (e.g., visual alerts or auditory signals) and simultaneously fed back to fleet management platforms. Based on the classified risk levels, targeted interventions can be implemented: for high-risk drivers, real-time warnings and intensive training interventions are enforced; for medium-risk drivers, corrective measures and dynamic tracking management are applied; and for low-risk groups, routine monitoring and positive incentives are maintained. This integrated workflow forms a closed-loop safety management mechanism of “identification–warning–intervention–optimization”, thereby enhancing both regulatory efficiency and the precision of safety management.
In summary, this study establishes a framework for the dynamic quantification and tiered early warning of driving behavior risks in heavy-duty trucks. The proposed methodology offers a practical technical pathway and actionable decision-making support for traffic safety regulators. These contributions hold meaningful theoretical implications and substantial practical relevance for advancing safety standards in road freight transportation.

Author Contributions

Q.L.: Conceptualization, Data curation, Methodology, Writing—original draft, Writing—review & editing. X.L.: Data curation, Investigation, Validation, Writing—original draft, Supervision. Z.Z.: Formal analysis, Project administration, Resources, Funding acquisition. H.G.: Investigation, Project administration, Software, Validation. X.G.: Conceptualization, Formal analysis, Supervision, Software. X.C.: Methodology, Resources, Writing—review & editing. All authors have read and agreed to the published version of the manuscript.

Funding

This research was supported by the National Social Science Fund of China (Grant No. 25BGL225).

Data Availability Statement

Data will be made available on request.

Acknowledgments

The authors would like to thank the National Natural Science Foundation of China (Grant No.52472347), Open Fund of State Key Laboratory of Maritime Technology and Safety.

Conflicts of Interest

Author Zhengjie Zang is employed by the Guangzhou City Renewal Group Co., Ltd.

References

  1. Zhang, X. Research of Truck Driver Safety Assessment and Risk Cause. Master’s Thesis, North China University of Technology, Beijing, China, 2024. [Google Scholar]
  2. Yu, Z.; Cai, K. Perceived risks toward in-vehicle infotainment data services on intelligent connected vehicles. Systems 2022, 10, 162. [Google Scholar] [CrossRef]
  3. Li, H.; Wang, W.; Yao, Y.; Zhao, X.; Zhang, X. A review of truck driver persona construction for safety management. Accid. Anal. Prev. 2024, 206, 107694. [Google Scholar] [CrossRef]
  4. Hua, J.; Li, B.; Wang, L.; Lu, G. How left-turning vehicles deal with conflicts at intersections: Driving behavior model based on relative motion risk quantification. Phys. A Stat. Mech. Its Appl. 2025, 661, 130393. [Google Scholar] [CrossRef]
  5. Wen, J.; Zhan, X.; Wu, C.; Xiao, X.; Lyu, N. Risky driving behavior propagation: A novel stochastic SIR model and two-stage risk quantification method. Phys. A Stat. Mech. Its Appl. 2023, 629, 129192. [Google Scholar] [CrossRef]
  6. Xiong, J.; Chen, Z. Truck driving assessment for Chinese logistics and transportation companies based on a safety climate test system. Systems 2024, 12, 177. [Google Scholar] [CrossRef]
  7. Li, Y.; Pu, Z.; Liu, P.; Qian, T.; Hu, Q.; Zhang, J.; Wang, Y. Efficient predictive control strategy for mitigating the overlap of EV charging demand and residential load based on distributed renewable energy. Renew. Energy 2025, 240, 122154. [Google Scholar] [CrossRef]
  8. Chen, X.; Wu, S.; Shi, C.; Huang, Y.; Yang, Y.; Ke, R.; Zhao, J. Sensing data supported traffic flow prediction via denoising schemes and ANN: A comparison. IEEE Sens. J. 2020, 20, 14317–14328. [Google Scholar] [CrossRef]
  9. Wang, Z.; Li, H.; Wang, Q. An approach to truck driving risk identification: A machine learning method based on optuna optimization. IEEE Access 2025, 13, 42723–42732. [Google Scholar] [CrossRef]
  10. Kovaceva, J.; Isaksson-Hellman, I.; Murgovski, N. Identification of aggressive driving from naturalistic data in car-following situations. J. Saf. Res. 2020, 73, 225–234. [Google Scholar] [CrossRef]
  11. Hyun, K.K.; Jeong, K.; Tok, A.; Ritchie, S.G. Assessing crash risk considering vehicle interactions with trucks using point detector data. Accid. Anal. Prev. 2019, 130, 75–83. [Google Scholar] [CrossRef]
  12. Chen, S.; Cheng, K.; Yang, J.; Zang, X.; Luo, Q.; Li, J. Driving behavior risk measurement and cluster analysis driven by vehicle trajectory data. Appl. Sci. 2023, 13, 5675. [Google Scholar] [CrossRef]
  13. Zhang, C.; Ma, Y.; Khattak, A.; Chen, S.; Xing, G.; Zhang, J. Driving style identification and its association with risky driving behaviors among truck drivers based on GPS, load condition, and in-vehicle monitoring data. J. Transp. Saf. Secur. 2024, 16, 507–541. [Google Scholar] [CrossRef]
  14. Hou, X.; Zhang, R.; Yang, M.; Cheng, S. Modeling the lane-changing behavior of non-motorized vehicles on road segments via social force model. Phys. A Stat. Mech. Its Appl. 2024, 633, 129415. [Google Scholar] [CrossRef]
  15. Cheng, R.; Lou, H.; Wei, Q. Analysis of the impact for mixed traffic flow based on the time-varying model predictive control. Systems 2025, 13, 481. [Google Scholar] [CrossRef]
  16. Song, J.; Xu, S.; Feng, C.; Peng, L. An improved rapidly-exploring approach to off-road path planning by leveraging dynamic velocity constraints and trajectory smoothing. IET Intell. Transp. Syst. 2026, 20, e70148. [Google Scholar] [CrossRef]
  17. Li, Y.; Cai, J.; Wang, X.; Ouyang, S. Driving style characteristics based lane-changing intention recognition research for truck drivers near highway ramps. Traffic Inj. Prev. 2025, 2025, 2507671. [Google Scholar] [CrossRef] [PubMed]
  18. Zhu, Y.; Ma, Y.; Chen, S.; Khattak, A.J.; Pang, Q. Identifying potentially risky intersections for heavy-duty truck drivers based on individual driving styles. Appl. Sci. 2022, 12, 4678. [Google Scholar] [CrossRef]
  19. de Zepeda, M.; Meng, F.; Su, J.; Zeng, X.-J.; Wang, Q. Dynamic clustering analysis for driving styles identification. Eng. Appl. Artif. Intell. 2021, 97, 104096. [Google Scholar] [CrossRef]
  20. Chen, Y.; Wang, K.; Lu, J. Feature selection for driving style and skill clustering using naturalistic driving data and driving behavior questionnaire. Anal. Prev. 2023, 185, 107022. [Google Scholar] [CrossRef]
  21. Li, B.; Liu, Y.; Zhao, J.; Xu, X.; Dong, P.; Chen, S.; Wu, X.; Liu, X.; Qi, H. Representing-behavior-based online driving style recognition and its road verification. Eng. Appl. Artif. Intell. 2025, 156, 111241. [Google Scholar] [CrossRef]
  22. Wu, X.; Yan, L.; Li, H. Forward collision warning system using multi-modal trajectory prediction of the intelligent vehicle. Proc. Inst. Mech. Eng. Part D J. Automob. Eng. 2024, 238, 358–373. [Google Scholar] [CrossRef]
  23. Ding, N.; Gao, H.; Zhang, H.; Huang, Y.; Wu, C. Characterizing driver fingerprinting of new energy vehicles in risky scenarios: A naturalistic driving study. Green Energy Intell. Transp. 2025, 4, 100320. [Google Scholar] [CrossRef]
  24. Peng, L.; Huang, J.; Zhou, T.; Xu, S. V2V-enabled cooperative adaptive cruise control strategy for improving driving safety and travel efficiency of semi-automated vehicle fleet. IET Intell. Transp. Syst. 2023, 17, 2190–2204. [Google Scholar] [CrossRef]
  25. Shao, Y.; Shi, X.; Zhang, Y.; Xu, Y.; Chen, W.; Ye, Z. Adaptive forward collision warning system for hazmat truck drivers: Considering differential driving behavior and risk levels. Accid. Anal. Prev. 2023, 191, 107221. [Google Scholar] [CrossRef] [PubMed]
  26. Zhang, X.; Wang, X.; Bao, Y.; Zhu, X. Safety assessment of trucks based on GPS and in-vehicle monitoring data. Accid. Anal. Prev. 2022, 168, 106619. [Google Scholar] [CrossRef] [PubMed]
  27. Xie, J.; Xia, Y.; Qian, Z.; Liu, B.; Qin, Y. Lane-change risk warning in interweaving area considering information from intelligent connected near-neighboring vehicles. J. Traffic Transp. Eng. 2023, 23, 287–300. [Google Scholar]
  28. Liang, B.; Zhu, S.; Long, H.; Niu, J.A.; Qin, C.; Li, H. Driving risk assessment in exit areas of highway tunnels based on driving behavior characteristics: Methods and case studies. Tunn. Undergr. Space Technol. 2025, 157, 106354. [Google Scholar] [CrossRef]
  29. Irshayyid, A.; Chen, J.; Xiong, G. A review on reinforcement learning-based highway autonomous vehicle control. Green Energy Intell. Transp. 2024, 3, 100156. [Google Scholar] [CrossRef]
  30. Li, Q.; Cheng, R.; Ge, H. Short-term vehicle speed prediction based on BiLSTM-GRU model considering driver heterogeneity. Phys. A Stat. Mech. Its Appl. 2023, 610, 128410. [Google Scholar] [CrossRef]
  31. Pan, C.; Dai, Z.; Zhang, Y.; Zhang, H.; Fan, M.; Xu, J. An approach for accurately extracting vehicle trajectory from aerial videos based on computer vision. Measurement 2025, 242, 116212. [Google Scholar] [CrossRef]
  32. Zhang, H.; Tan, X.; Fan, M.; Pan, C.; Zheng, Z.; Luo, S.; Xu, J. Accurate detection and tracking of small-scale vehicles in high-altitude unmanned aerial vehicle bird-view imagery. J. Adv. Transp. 2023, 2023, 5384844. [Google Scholar] [CrossRef]
  33. Tang, J.; Hu, J.; Hao, W.; Chen, X.; Qi, Y. Markov Chains based route travel time estimation considering link spatio-temporal correlation. Phys. A Stat. Mech. Its Appl. 2020, 545, 123759. [Google Scholar] [CrossRef]
Figure 1. Aerial photos of some sections of the Chongqing-Chengdu expressway.
Systems 14 00204 g001
Figure 2. Risk measurement index system for driving behavior.
Systems 14 00204 g002
Figure 3. Weight value of each risk measurement index.
Systems 14 00204 g003
Figure 4. Relationship between the number of clusters and SSE.
Systems 14 00204 g004
Figure 5. Relationship between the number of clusters and CH index.
Systems 14 00204 g005
Figure 6. Relationship between the number of clusters and contour coefficient.
Systems 14 00204 g006
Figure 7. The quantity and proportion of each type.
Systems 14 00204 g007
Figure 8. Comprehensive scores of various types.
Systems 14 00204 g008
Figure 9. Heatmap of average values across all categories and indicators.
Systems 14 00204 g009
Figure 10. Distribution diagram of each type of comprehensive scoring box.
Systems 14 00204 g010
Figure 11. Accuracy rates of the prediction results by mode method and final-value method.
Systems 14 00204 g011
Figure 12. The PR curve of the mode method.
Systems 14 00204 g012
Figure 13. The PR curve of the final-value method.
Systems 14 00204 g013
Figure 14. The aggregation confusion matrix of the mode method.
Systems 14 00204 g014
Figure 15. The aggregation confusion matrix of the final-value method.
Systems 14 00204 g015
Table 1. Main parameter description.
ParameterUnitDescription
Frame-The frame in which the vehicle appears
ID-Unique identifier
(assigned in ascending order based on entry time into the video)
Class-Vehicle type (0—Passenger car; 1—Mini/Light truck;
2—Two-axle truck; 3—Heavy-duty truck)
YmLateral coordinate of the vehicle’s center
(indicating lateral displacement)
WidthmWidth of the vehicle in meters (m)
Velocity, Accelerationkm/h, m/s2Instantaneous speed in km/h and acceleration in m/s2
Dist. to left markingmDistance from the vehicle’s trajectory point to the left lane marking
Dist. to right markingmDistance from the vehicle’s trajectory point to the right lane marking
Following dist.mDistance between the subject vehicle and the preceding vehicle
TTCsTime to collision with the preceding vehicle
Table 2. Performance comparison of the two warning methods.
Risk TypeMetricMode Method (%)Final-Value Method (%)
Type 1Precision89.099.0
Recall89.099.0
Type 2Precision84.099.0
Recall83.099.0
Type 3Precision69.097.0
Recall69.097.0
Type 4Precision100.092.9
Recall20.086.7
Type 5Precision0.0100.0
Recall0.066.7
Type 6Precision83.099.0
Recall85.099.0
Table 3. Comparison of warning response performance for high risk behavior (Type 4).
Warning MethodAverage Response Delay (s)Warning Consistency (%)
Mode method5.4820.0
Final-value method0.0486.7
Disclaimer/Publisher’s Note: The statements, opinions and data contained in all publications are solely those of the individual author(s) and contributor(s) and not of MDPI and/or the editor(s). MDPI and/or the editor(s) disclaim responsibility for any injury to people or property resulting from any ideas, methods, instructions or products referred to in the content.