1. Introduction
In recent decades, the effective management of public funding dedicated to research and development (R&D) has become a critical issue in developed countries. However, the increasing complexity of administrative procedures and compliance obligations has raised concerns about the additional management burden they impose on project managers and the organisations they represent [
1,
2]. Recent studies on flexible subsidy schemes indicate that greater adaptability in fund management could alleviate these burdens and facilitate innovation while responding to evolving needs [
3]. Other research has highlighted how excessive bureaucracy hampers innovation and discourages participation by businesses and research centres in public funding calls [
4,
5,
6]. Comparative analyses have therefore emphasised the need to streamline fund management without compromising control [
1,
7]. In this context, Spain serves as a valuable case study, as its General Subsidies Law (LGS) exemplifies both the strengths and challenges of a rigid regulatory control system [
8,
9]. Understanding how Spanish R&D project managers perceive and navigate this regulatory environment may offer transferable lessons for other countries facing similar tensions between control and flexibility in public research funding.
Publicly funded R&D projects are implemented within a public R&D project management system in which regulatory frameworks, funding instruments, organisational structures, and managerial practices interact in a closely interconnected manner. In this context, regulatory requirements influence not only compliance-related procedures but also the way projects are planned, monitored, and adapted during their execution, affecting organisational routines and project-level practices [
8]. From a systems perspective, the interaction between regulatory rules and project management practices can be understood as generating feedback effects that shape the system’s capacity to accommodate uncertainty and manage change throughout the project lifecycle [
10].
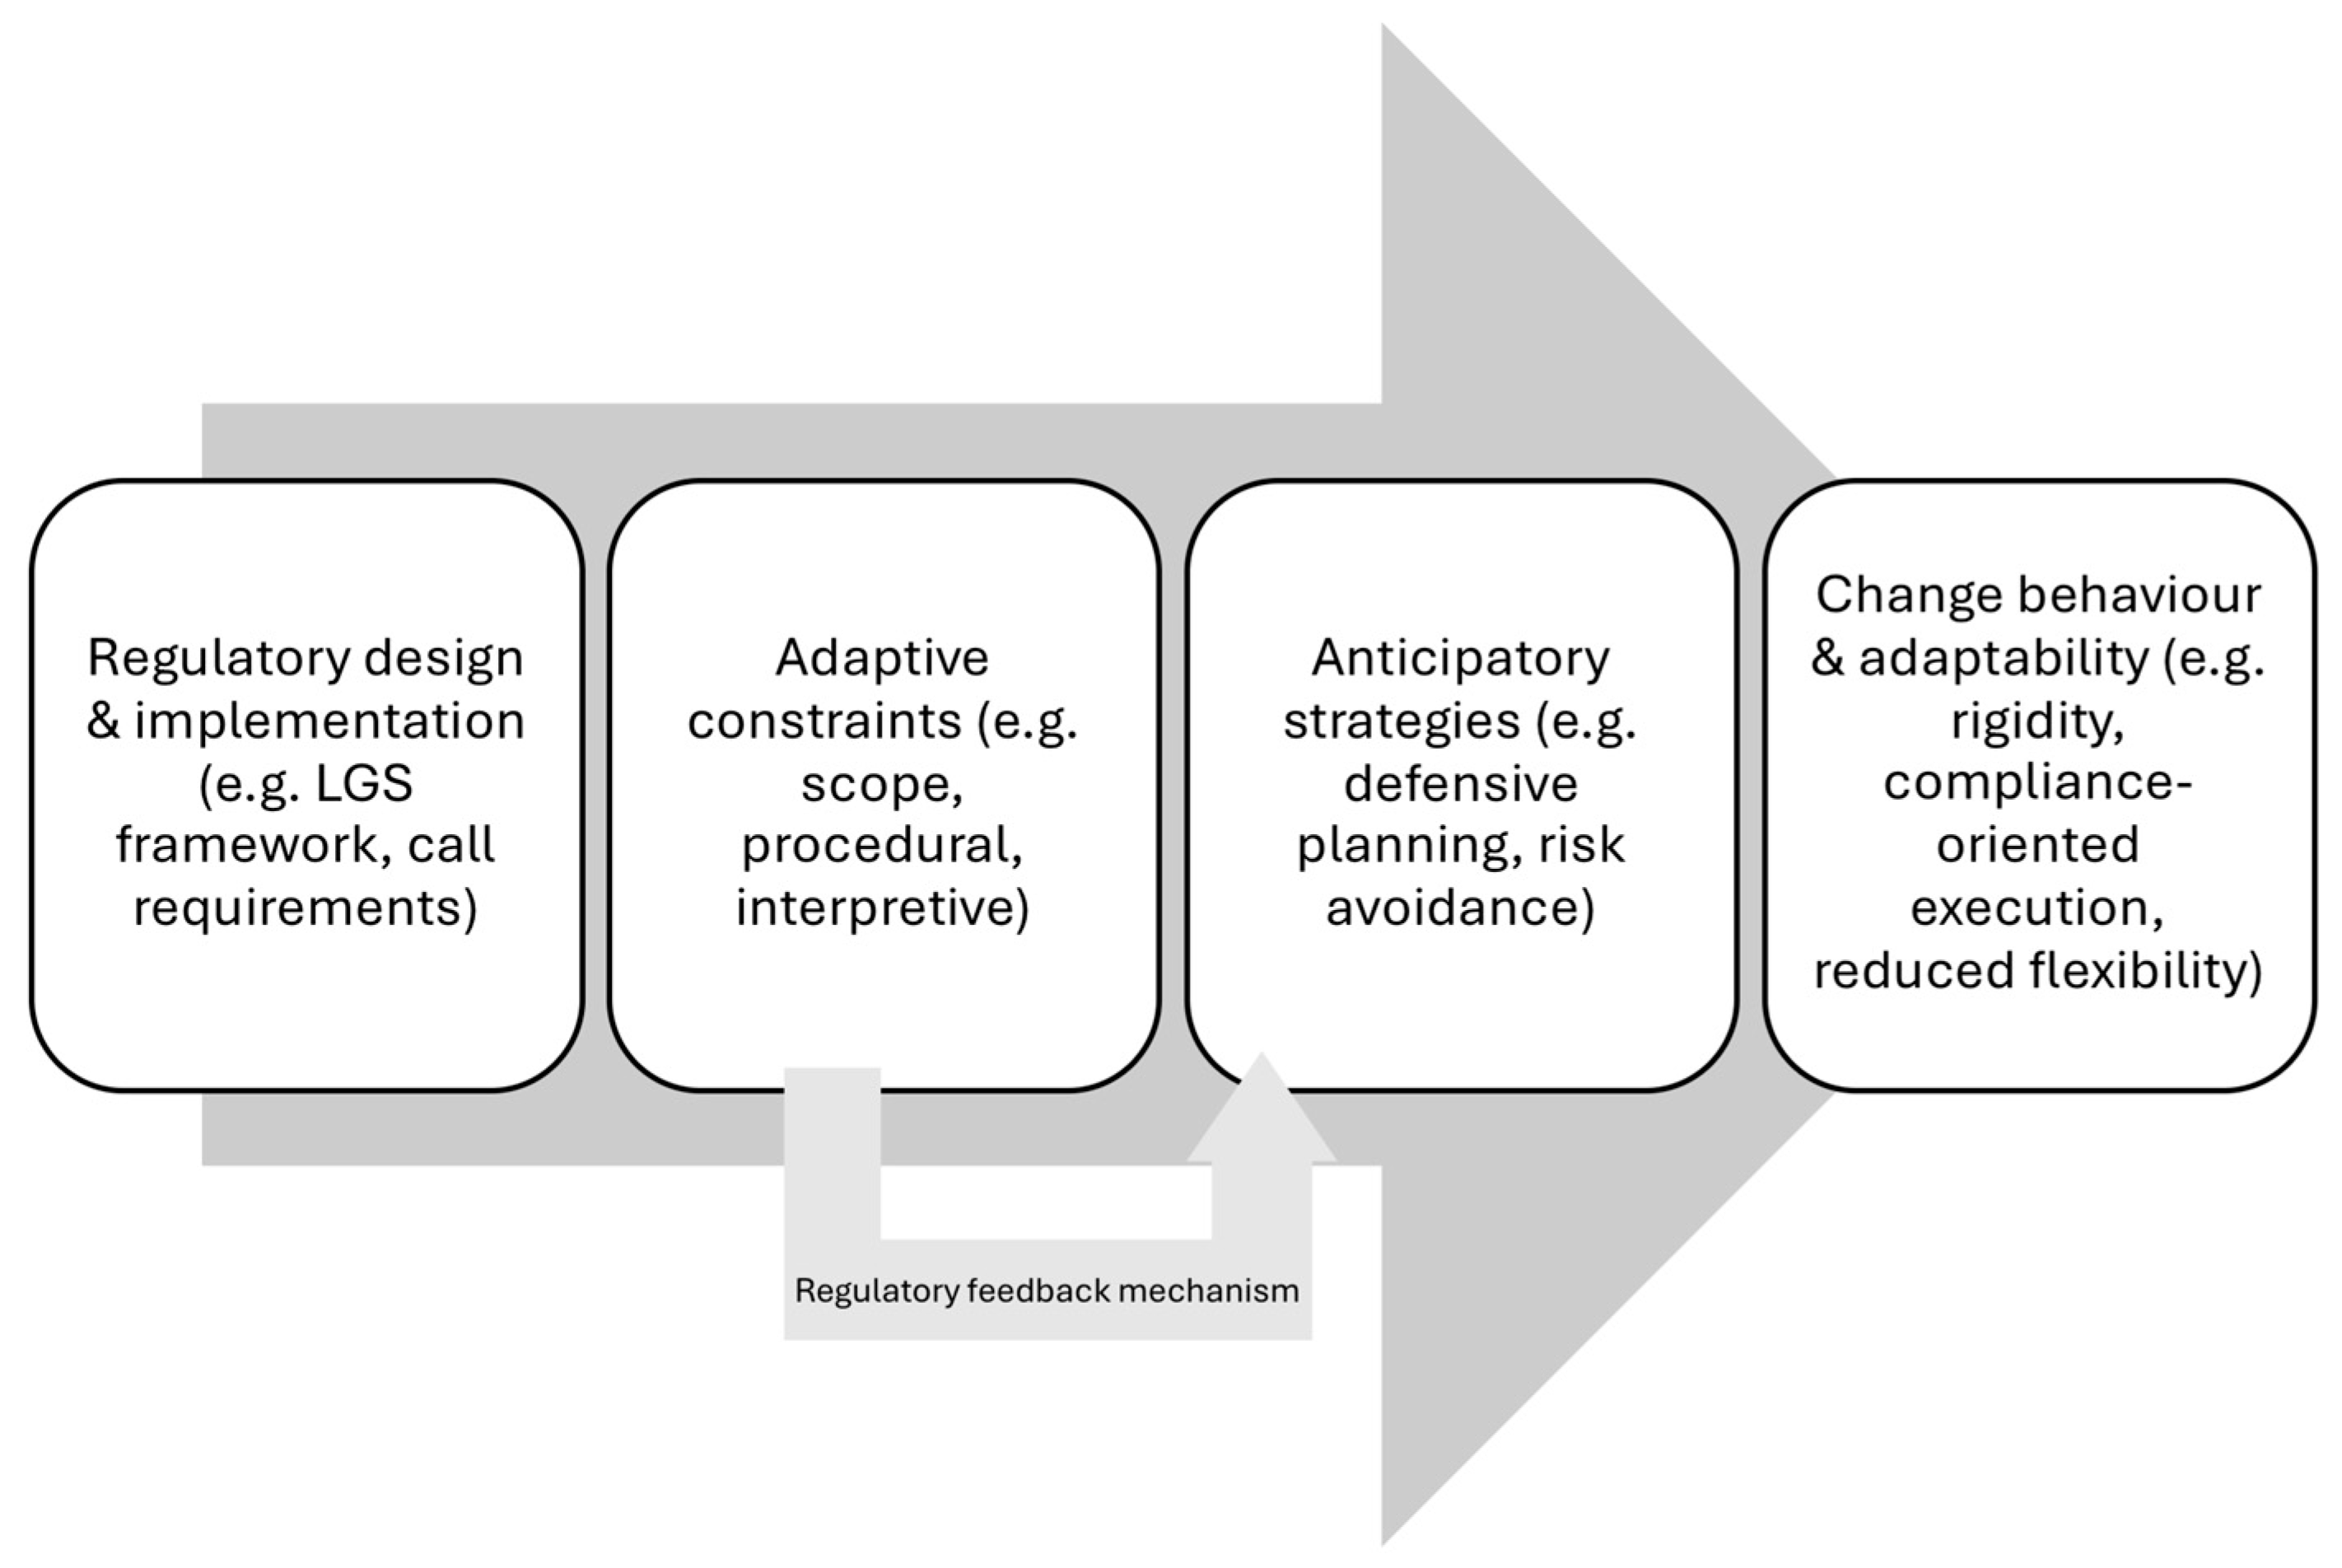
In this paper, the term regulatory feedback (hereafter used interchangeably with “feedback effects”) is used to denote the mechanism by which prior regulatory experiences, such as perceived acceptance criteria for modifications, administrative response times, and variability in interpretation across managing bodies, shape subsequent project managers’ behaviour. Operationally, regulatory feedback is evidenced when anticipated regulatory consequences influence project design choices and/or execution-stage change-management strategies.
In this study, publicly funded R&D project management is defined as a socio-technical system in which regulatory rules, administrative procedures, organisational routines, and managerial decision-making co-evolve during the lifecycle of funded projects. The system comprises regulatory and programme-level artefacts like the General Subsidies Law and the programme-specific “bases reguladoras”, public managing entities that interpret and enforce these rules through concrete administrative procedures, and beneficiary organisations and their project managers, who translate regulatory requirements into project plans, reporting practices, and change-management strategies. Under this perspective, “flexibility” is not a purely managerial attribute; rather, it is an emergent property of the interactions between technical uncertainty in R&D work and the institutionalised control mechanisms governing publicly funded project execution.
In the context of the present research, the term regulatory feedback is used to refer to the mechanism through which prior regulatory experiences of professionals shape subsequent managerial behaviour in later projects. In practice, regulatory feedback is expressed through learning and anticipation: project managers internalise the expected consequences of requesting changes and adjust their behaviour accordingly. This includes designing more conservative work plans, avoiding technically desirable modifications during execution, and prioritising compliance with the initially approved plan even when adaptive adjustments could improve efficiency or technical outcomes. In this sense, regulatory feedback links regulatory design and implementation with project-level adaptation decisions over time.
The concept of adaptive constraints is introduced and defined as system-level constraints that reduce or condition the capacity of project managers to implement justified changes during project execution. In the context of publicly funded R&D projects, we distinguish three analytically useful types. First, scope-related constraints arise when proposed changes are interpreted as altering the “purpose and conditions” under which the grant was awarded, or as potentially affecting evaluation scores and eligibility conditions. Second, procedural constraints arise from the administrative process itself, such as the need for express authorisation, rigid deadlines for submitting modification requests, and delays in institutional response times, which can misalign administrative timelines with operational timelines in R&D work. Third, interpretive constraints arise when similar changes in projects are subject to heterogeneous interpretations and criteria across managing bodies, increasing uncertainty and discouraging adaptive decision-making.
This framing leads to three hypotheses that guide the empirical analysis. They specify how different types of regulatory constraints are expected to shape perceived flexibility in change management and, through anticipatory behaviour, to generate regulatory feedback in publicly funded R&D projects:
Scope-related modifications will be perceived as the least flexible (and among the most restrictive) because they are more likely to be interpreted as altering the “purpose and conditions” under which the grant was awarded, thereby discouraging scope revisions even in technically dynamic contexts.
Procedural requirements, particularly prior authorisation, rigid windows for submitting modification requests, and delays in institutional response times, will be perceived as imposing high transaction costs, leading managers to report difficulties in implementing changes and to adopt compliance-oriented strategies that privilege the initially approved plan over adaptive adjustment during execution.
Interpretive fragmentation across managing bodies will increase perceived regulatory uncertainty and reinforce conservative strategies during project design, strengthening the regulatory feedback mechanism through anticipation. Accordingly, the contribution of this paper is not only descriptive because it combines expert evidence with multicriteria prioritisation, providing an empirically grounded framework that connects the types of adaptive constraints experienced in publicly funded R&D projects with regulatory feedback pathways that shape project design choices and change-management practices.
Technology centres play a crucial role in the R&D and innovation ecosystem in Spain [
11]. These entities, which are privately owned and legally established under Royal Decree 2093/2008 [
12], operate within a strict regulatory framework that sets out the requirements for their official registration. These include legal conditions such as the obligation to be non-profit and to have the statutory objective of improving business competitiveness through research, development, and innovation activities. Additionally, they are required to meet a series of performance indicators that ensure predominantly competitive funding and an orientation towards R&D and innovation projects, supporting knowledge transfer to industry.
Currently, in Spain, there are 69 technology centres that meet these requirements and are registered in the National Register of Technology Centres and Centres Supporting Technological Innovation, managed by the Ministry of Science and Innovation [
13]. In addition, the Spanish Federation of Technology Centres (FEDIT) brings together the main registered centres. It should be noted that technology centres, among the various private entities, have the highest level of involvement in developing publicly funded R&D projects in Spain. According to data collected by FEDIT [
14], approximately 46.5% of their income comes from competitive public calls, reflecting their practical expertise in the area of R&D projects financed through public funding programmes. Moreover, considering that a significant portion of their contracted work with companies is also carried out within projects where those companies act as beneficiaries of public funding, it is evident that professionals managing projects within these centres possess in-depth theoretical and practical knowledge of the application of the General Subsidies Law (LGS).
This institutional configuration reflects regulatory principles and control mechanisms that are consistent with the European Union framework for state aid to R&D and therefore provides an appropriate empirical setting for analysing regulatory effects on publicly funded R&D project management.
In this context, some authors [
15] have studied the management challenges in R&D projects related to the application of public regulations and policies. In such projects, complex scenarios arise when attempting to balance, on the one hand, the inherently changing nature of R&D projects and, on the other, the rigidities and fixed limits set by regulatory frameworks [
8]. As an example, it is worth noting that project management methodologies generally rely on the so-called Iron Triangle or Project Management Triangle [
16], which is defined by three vertices representing the project’s scope, the resources required for its development, and the project’s timeline. On the other hand, the regulations governing R&D funding prioritise control and oversight criteria over efficiency, thus favouring what is planned and approved over change management [
17].
The General Subsidies Law (LGS) establishes a legal framework that aims to ensure the proper application of public funds, but it also introduces a series of limitations that can impact the agility and innovation of R&D projects. Recent work, such as that by Klepac et al. [
3], highlights that flexible grant schemes, although lacking a universally accepted definition, allow for greater adaptation to the beneficiaries’ needs, increasing autonomy and coordination capacity. The conclusions drawn from Coca et al.’s [
18] research are particularly revealing in this regard, emphasising the importance of a holistic approach to R&D project management that can accommodate complexity without stifling innovation. Similarly, in another study [
19], they point out that the regulations currently applied in Spain are rigid, making it difficult to alter the scope, budget, or timeline of projects once they have started. According to these authors, this rigidity is a significant barrier, as effective R&D project management requires the ability to adapt to uncertainty and unforeseen changes. In addition, a key implementation challenge is that, in crucial aspects of the project, such as communication and dissemination obligations, the specific application and interpretation of the LGS vary depending on the managing body, leading to a lack of consistency, fragmentation, and uncertainty for project managers [
20].
It is also important to highlight that, in the present context, the role of public funding is crucial for addressing so-called “market failures” [
21], that is, for compensating deficiencies in activities where the private sector and society are not willing to maintain the necessary levels of investment to achieve the desired degree of development in a specific area [
22], such as in high-risk sectors like renewable energy [
23]. Thus, in the field of innovation, and particularly in research and development (R&D), there are clear examples of activities where the associated risk and uncertainty lead to private investment being lower than desired [
24]. In this context, public funding can serve as a driver for investment in R&D [
25]. Also, Mazzucato [
26] argues in her book The Entrepreneurial State that states, in their entrepreneurial role (understood as a role of leadership and traction), deploy grants and other mechanisms, such as public procurement, to stimulate private sector activity in this area.
Therefore, public funding, in all its forms, from grants to loans on favourable terms, is closely linked to research and development (R&D) projects [
27] because public funding is a tool widely used by governments to encourage investment in R&D and innovation by both public and private organisations [
15,
28]. Moreover, recent studies have shown that increasing public funding for R&D can be crucial for economic recovery after crises, as observed in Finland during the COVID-19 pandemic, where the increase in public funds for R&D significantly contributed to regional GDP growth [
29]. Various authors have studied the positive effect on the competitiveness of companies receiving these public funds [
30,
31], as well as the impact of funding on the generation and dissemination of scientific knowledge [
32], which in turn positively impacts society by enabling technological advancement [
25,
33] and, ultimately, correcting the market failure associated with the high risk of R&D [
34]. However, this positive effect can be lost or even reversed if public funding is not well designed or implemented [
5]. Poor implementation can result in the opposite effect, slowing down private investment levels, with companies adjusting their investment efforts according to the “crowding-in” effect of grants [
35].
Within the context of R&D funding management in Spain, this study draws on the perspectives of R&D project management professionals working in technology centres to examine how the General Subsidies Law (LGS) is experienced in practice and which elements of the regulatory and administrative regime are perceived as most constraining for managing changes during project execution. Technology centres were selected because they routinely manage publicly funded R&D projects under the LGS across different calls and managing bodies, and therefore provide informed evidence based on repeated, first-hand exposure to the implementation of this regulatory framework.
The purpose of this study is to examine how the LGS shapes change management in publicly funded R&D projects, and how these regulatory constraints translate into behavioural adjustments by project managers over the project lifecycle. Specifically, the study pursues three objectives: to characterise the constraints experienced in managing changes in those projects regulated by the LGS, to estimate the relative salience of these constraints as perceived by experienced project managers, and to interpret how repeated exposure to these constraints generates regulatory feedback in the form of anticipatory and compliance-oriented strategies in both project design and execution. This purpose is implemented through an empirical design combining semi-structured expert interviews with a complementary Analytic Hierarchy Process component that translates expert judgements into a structured prioritisation of constraint types.
This article is structured as follows. After this Introduction, the Methodology section introduces the reader to the foundations of the semi-structured interview, the type of interview used in this study, and the methodology of hierarchical analysis and describes the components of the questionnaire employed in the research. The Results section then presents the key findings from the interviews with project managers; further discussion is provided in the Discussion section. The article concludes with a section summarising the conclusions, which also includes suggestions for future research.
2. Methodology
This section outlines the foundations of the methodology employed in this study, which includes the adaptation and use of widely applied and traditional techniques, such as semi-structured interviews with experts and the Analytic Hierarchy Process (AHP). This methodological approach allows the analysis of how regulatory constraints are perceived and prioritised by project managers operating within a publicly funded R&D project management system.
2.1. Semi-Structured Interview
The methodology chosen for this research is the semi-structured interview, a qualitative approach that is considered particularly suitable for analysing the complexity associated with managing R&D projects from the perspective of Spanish technology centres. According to Kohli [
36], qualitative research is particularly valuable when responses cannot be predefined, thus enabling a richer and less restrictive exploration of participants’ experiences.
The decision to use semi-structured interviews as the technique for this study is based on their ability to balance a predefined structure with the flexibility needed to adapt the conversation to the interviewee’s contributions. These interviews, as Flick [
37] suggests, are particularly useful in contexts such as this research, where it is necessary to adapt to the natural flow of conversation with experts.
The expert interview model was chosen for this research because it allows the collection of informed judgments on how regulatory rules interact with project management practices, generating constraints and feedback effects within the system. This type of interview is characterised by not treating the interviewees as individual cases but as representatives of accumulated expert knowledge within a specific domain. According to Meuser and Nagel [
38], this technique is particularly appropriate when interviewees occupy key positions within complex organisational structures and possess relevant strategic information. Furthermore, Bogner et al. [
39] emphasise that this approach provides access to tacit knowledge, often undocumented, but which has a decisive impact on decision-making and organisational processes.
The interview protocol was designed to capture the socio-technical nature of change management under a regulatory regime, as framed in
Section 1. Specifically, the questions elicit evidence on scope-related, procedural, and interpretive adaptive constraints, and regulatory feedback mechanisms expressed through learning and anticipation across projects. The Likert-scale items assess perceived rigidity and difficulty of different types of changes (scope, time, resources, and administrative process) and the perceived sources of uncertainty, while the open-ended items capture concrete experiences of requesting (or avoiding) modifications, perceived variability across managing bodies, and the managerial strategies adopted to cope with regulatory constraints.
In addition, the Analytic Hierarchy Process (AHP) is used as a complementary component to translate expert judgments into a prioritisation of adaptive constraints. In the context of this study, AHP does not aim to identify a “best” programme or a single optimal solution; rather, it provides a structured way to estimate the relative salience of different constraint types as perceived by experienced project managers. This aligns with the analytical framework by allowing us to empirically identify which constraints are most central in shaping adaptive capacity and, therefore, most likely to drive the regulatory feedback pathways discussed in the paper.
2.2. Analytic Hierarchy Process
The AHP, developed by Thomas L. Saaty [
40], is a multicriteria decision-making methodology that enables the structured analysis of complex problems involving multiple interrelated factors. It allows for the prioritisation of alternatives, considering both quantitative and qualitative criteria. The method is based on decomposing a complex decision problem into a hierarchical structure that includes an objective, criteria, sub-criteria, and alternatives, using pairwise comparisons [
41]. In this way, AHP captures the subjective judgments influencing decision-makers and translates them into numerical values that reflect the relative importance of each element. In the context of this study, AHP is used to structure and prioritise regulatory constraints affecting change management in publicly funded R&D projects, based on the informed judgments of experienced project managers. An in-depth mathematical review of the foundations of AHP is presented in
Appendix A.
The application of AHP to the problem studied in this research does not necessarily require quantitative information about the level of satisfaction that the different alternatives provide in relation to the established criteria [
42]. Instead, the method relies on evaluative judgments made by the decision-maker, who comparatively assesses the intensity of the relationship between each alternative and each criterion. In any case, the comparison is made through a pairwise evaluation process, thus allowing the establishment of relative priorities from these qualitative assessments [
43].
In the AHP, the Consistency Ratio (CR) is defined as a measure of the internal coherence of a respondent’s pairwise judgments [
44]. It does not assess whether the preferences are correct in any external sense; rather, it evaluates whether the set of comparisons is logically compatible with the transitivity assumptions underpinning ratio-scale priorities. When judgments are highly consistent, the implied preference structure is stable, and the derived priorities tend to be less sensitive to small perturbations in individual comparisons. In general, it can be said that higher CR values indicate a certain degree of contradictions in the answers that may reduce the stability and interpretability of the resulting weights [
45].
Despite what it is said in the paragraph above, and according to previous studies, surveys with high CR values may still preserve meaningful ordinal information depending on the study purpose [
44,
46]. In applied settings like the one presented here, inconsistency can arise for several reasons that are not necessarily attributable to random answering. Pairwise elicitation imposes cognitive load, especially as the number of criteria increases, and respondents may vary their internal reference frame across comparison. Also, in the case of the present research, project managers are unfamiliar with AHP.
The CR is computed by normalising an observed inconsistency measure against the expected inconsistency of random matrices of the same order, providing a standardised indication of whether the judgement structure is more coherent than would be expected by chance [
47]. Accordingly, CR should be interpreted as a quality indicator that informs how AHP results are used and reported. In strict decision-making applications, high CR values typically motivate judgement revision or re-elicitation. In descriptive or exploratory research, like the one performed in the present paper, the use of CR is considered as a transparency and robustness ratio rather than a hard exclusion rule. This approach allows researchers to acknowledge and manage inconsistency while preserving the informational value of expert input and minimising the risk of selection bias from discarding respondents with high CR value [
45,
47,
48].
As shown in the Results section, this criterion is also followed here, and the results corresponding to all surveys were retained regardless of their relative consistency value. This decision is justified for several reasons. First, the strict interpretation of the 10% limit may be excessively restrictive in real-world contexts where the diversity of criteria and the qualitative richness of expert judgments are valued. Second, as pointed out by several authors in previous work [
49,
50], a certain degree of inconsistency does not necessarily invalidate the overall validity of the model, provided that the judgments reflect a clear and consistent trend in the prioritisation of alternatives. In fact, in complex environments with multiple interrelated criteria, some inconsistency can be considered a natural manifestation of the complexity of the decision-making process, rather than a methodological flaw.
Additionally, it was decided not to exclude matrices with high CR values to avoid introducing selection bias that could compromise the representativeness of the participant group. Eliminating data from certain respondents simply because of marginal inconsistencies would reduce the diversity of perspectives, which in the context of this research would be counterproductive for the comprehensive analysis of preferences. However, in order to maintain methodological transparency and interpretative robustness, the consistency level of each matrix has been explicitly documented, and those cases where the CR exceeds the recommended value have been identified.
From the point of view of the authors, it must be remarked that AHP is used as a complementary component to translate expert judgements into a structured prioritisation of adaptive constraints rather than to select a single best alternative. Specifically, the use of AHP is appropriate here because of the following:
Multi-dimensional constraint structure: the phenomenon under study involves several interrelated dimensions that must be compared jointly rather than in isolation.
Expert-based, largely qualitative evidence: respondents’ knowledge is experiential and judgement-based; AHP produces a ratio-scale priorities.
Alignment with the conceptual framework: the two-level hierarchy designed mirrors the adapted Iron Triangle logic (level 1) and its operational sub-constraints (level 2), supporting an interpretable decomposition.
Need for relative weights: beyond ordering constraints, the study requires the estimation of how much more restrictive one dimension is than another to support the regulatory feedback interpretation.
Transparency and quality control: AHP makes the comparison process visible and allows the reporting of consistency diagnostics to document judgement reliability.
Interpretation: AHP results are interpreted alongside semi-structured interview evidence and the direct prioritisation exercise, strengthening convergence and interpretability within the mixed-method design.
It should be noted that the Results section provides a detailed description of how the method was implemented for the case of this research study. This application adapts the method, which is typically aimed at identifying the best alternative from a set of options to achieve a desired objective, to prioritise and weigh the factors influencing the work of R&D project managers.
2.3. The Interview and Questionnaire Used
The interview protocol and its corresponding questionnaire were designed with questions aimed at identifying specific challenges related to LGS, as well as understanding the perception of specific limitations in managing changes during the execution of projects subject to this Law. The design of the questionnaire reflects the interdependence between regulatory requirements and project management dimensions, particularly in relation to managing change under conditions of uncertainty.
The interviews that were conducted lasted between one and two hours. Special care was taken to maintain the confidentiality and privacy of the participants, ensuring the anonymisation of responses and the aggregated handling of data.
To maximise the value of the interviews with the selected professionals, they were structured in two parts: one where information was gathered using a questionnaire with a series of questions based on a Likert scale, and another in which the questionnaire was focused on how to determine the order of importance of certain factors, in order to later apply the decision support method known as the Analytic Hierarchy Process (AHP).
2.3.1. The Interview Questionnaire
The interview questionnaire was designed using an approach that allowed for the collection of the interviewees’ experiences, focusing on grants awarded by the General State Administration (AGE), based on the prior analysis of limitations in managing such projects, as carried out by Coca et al. [
19]. For this, a questionnaire consisting of 55 questions was developed, which is included in
Appendix B. The questionnaire is divided into eight sections, constituting three distinct thematic blocks, described below:
The first thematic block includes the initial 20 questions, whose answers are either descriptive (open-ended text) or categorizable and are structured around three sections: information about the technology centre, the interviewee’s role and experience, and project management within the technology centre. This block of questions enabled the profiling of the interviewees.
The second thematic block includes 30 questions, ranging from number 21 to number 50. These questions are answered using a 5-level Likert scale (strongly disagree; disagree; neither agree nor disagree; agree; strongly agree). The questions are organised into four groups: perceptions about the flexibility of R&D funding programmes in response to necessary changes in projects, the management of uncertainty in R&D projects, comparison with other funding frameworks, and the impact on the design and execution of projects.
The third thematic block consists of five open-ended questions aimed at collecting specific experiences, identifying more or less flexible managing bodies, and proposing improvements for optimising the management of public funding in R&D projects.
In addition to providing descriptive evidence, the open-ended responses (Questions 51 to 55) were analysed with a two-stage approach. First, responses were grouped through thematic categorisation, as reported in
Section 3.2. Second, an interpretive synthesis was conducted to identify recurrent institutional logics and governance dynamics that underpin the themes. In this context, the term “institutional logics” refers to the recurring rationales through which interviewees assess what is considered appropriate and legitimate in the management of publicly funded R&D projects. The governance dynamics considered in this synthesis focus on how the interaction between managing bodies and beneficiaries is structured in practice, particularly regarding interpretive discretion, the predictability of criteria, response times, and the perceived implications of ex post reviews and liability.
Coding was conducted at the level of meaning units (sentence/paragraph). To minimise interpretive drift, the initial codebook was anchored to the seven Level-2 AHP dimensions (SC, WC, TC, BC, CA, DCR, DRC) and extended only when recurrent governance mechanisms emerged inductively; disagreements were resolved through discussion among authors.
2.3.2. The Questionnaire for Prioritising the Influence of Factors
The second part of the questionnaire, contained in
Appendix C (
Table A1), was structured based on the AHP method (Analytic Hierarchy Process), a multicriteria decision-making methodology designed for complex problems that require the use of multiple hierarchically organised criteria. This method allows for the decomposition of a complex problem into a hierarchy of criteria and sub-criteria, which are compared with each other one by one (1:1).
In this case, the questionnaire was designed based on the adapted Iron Triangle [
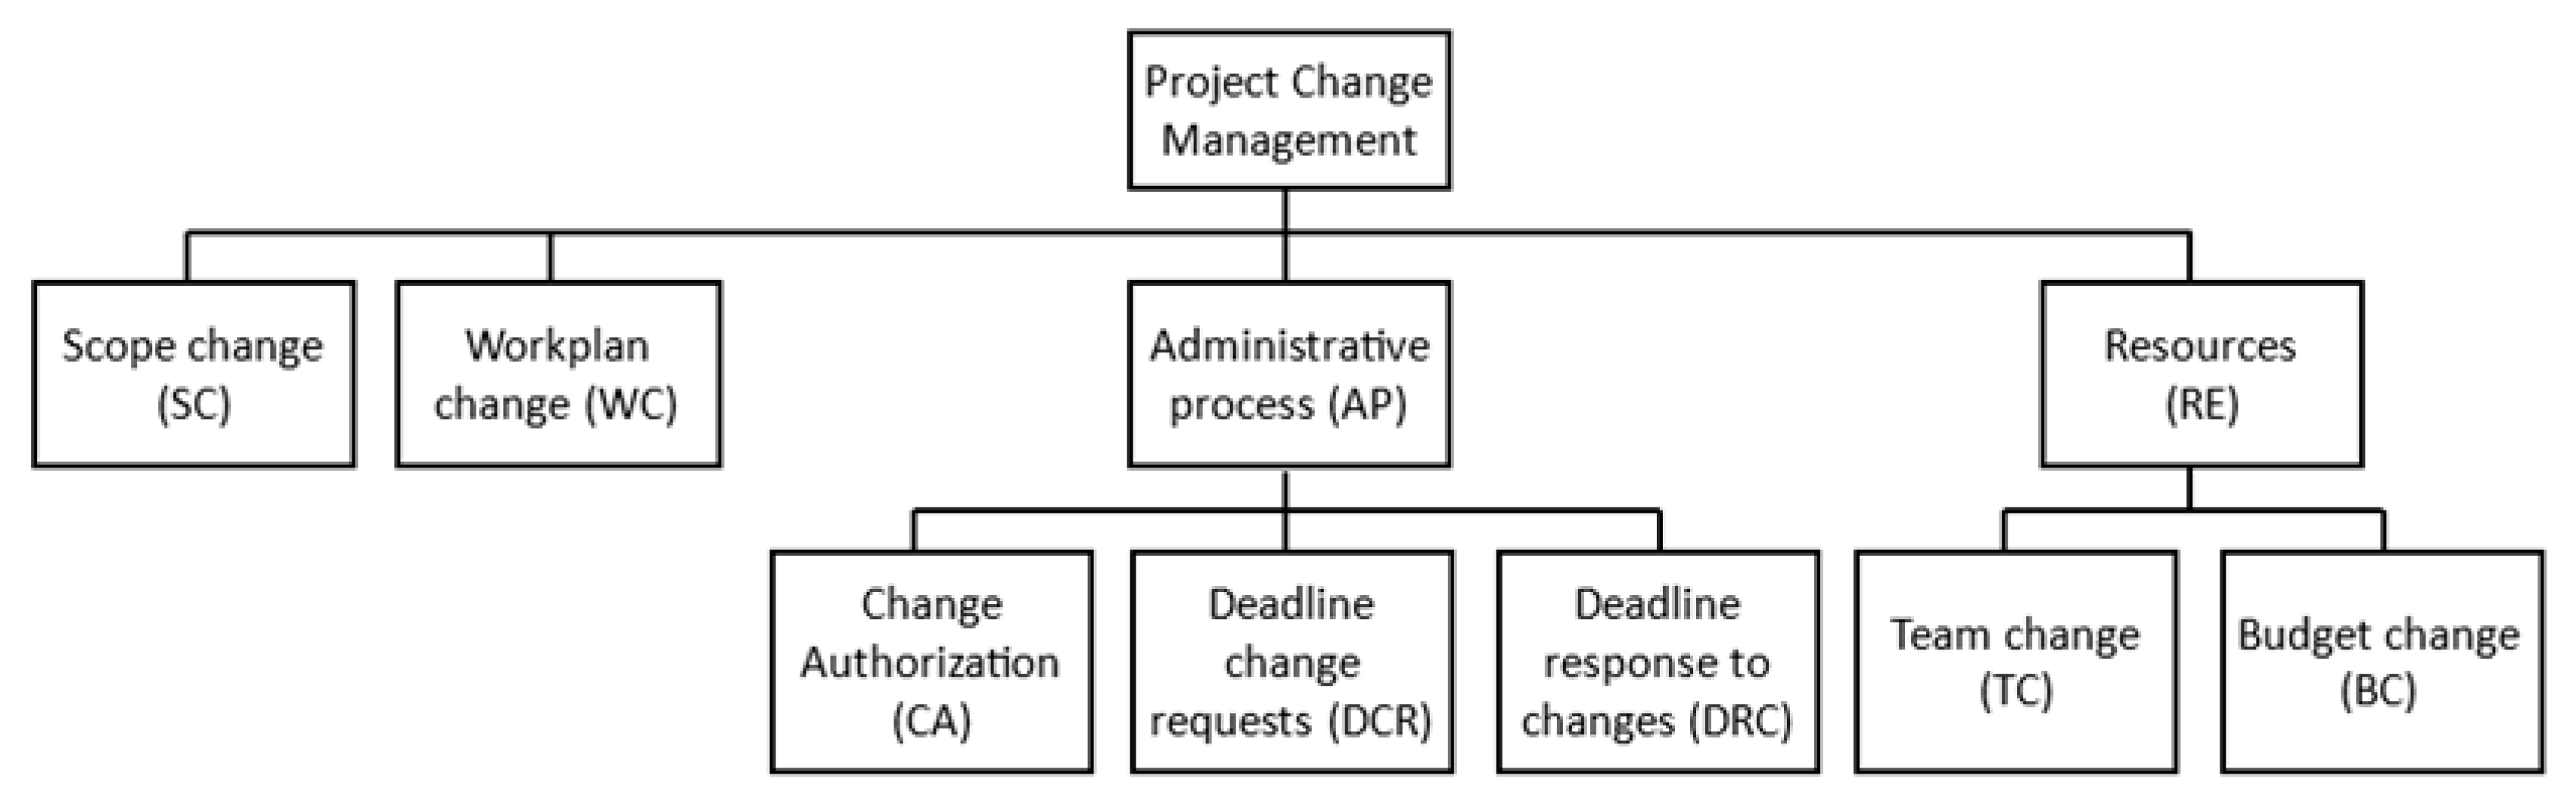
19], which identifies how key factors (criteria) limit change management in R&D projects subject to LGS. At the first level, these factors are scope, time, resources, and the administrative process. These are then expanded in a second level, where the “resources” factor is divided into two subcriteria (team and budget), and the “administrative process” is divided into three subcriteria (change authorisation, timeframes for change requests, and response times from the administration to such requests).
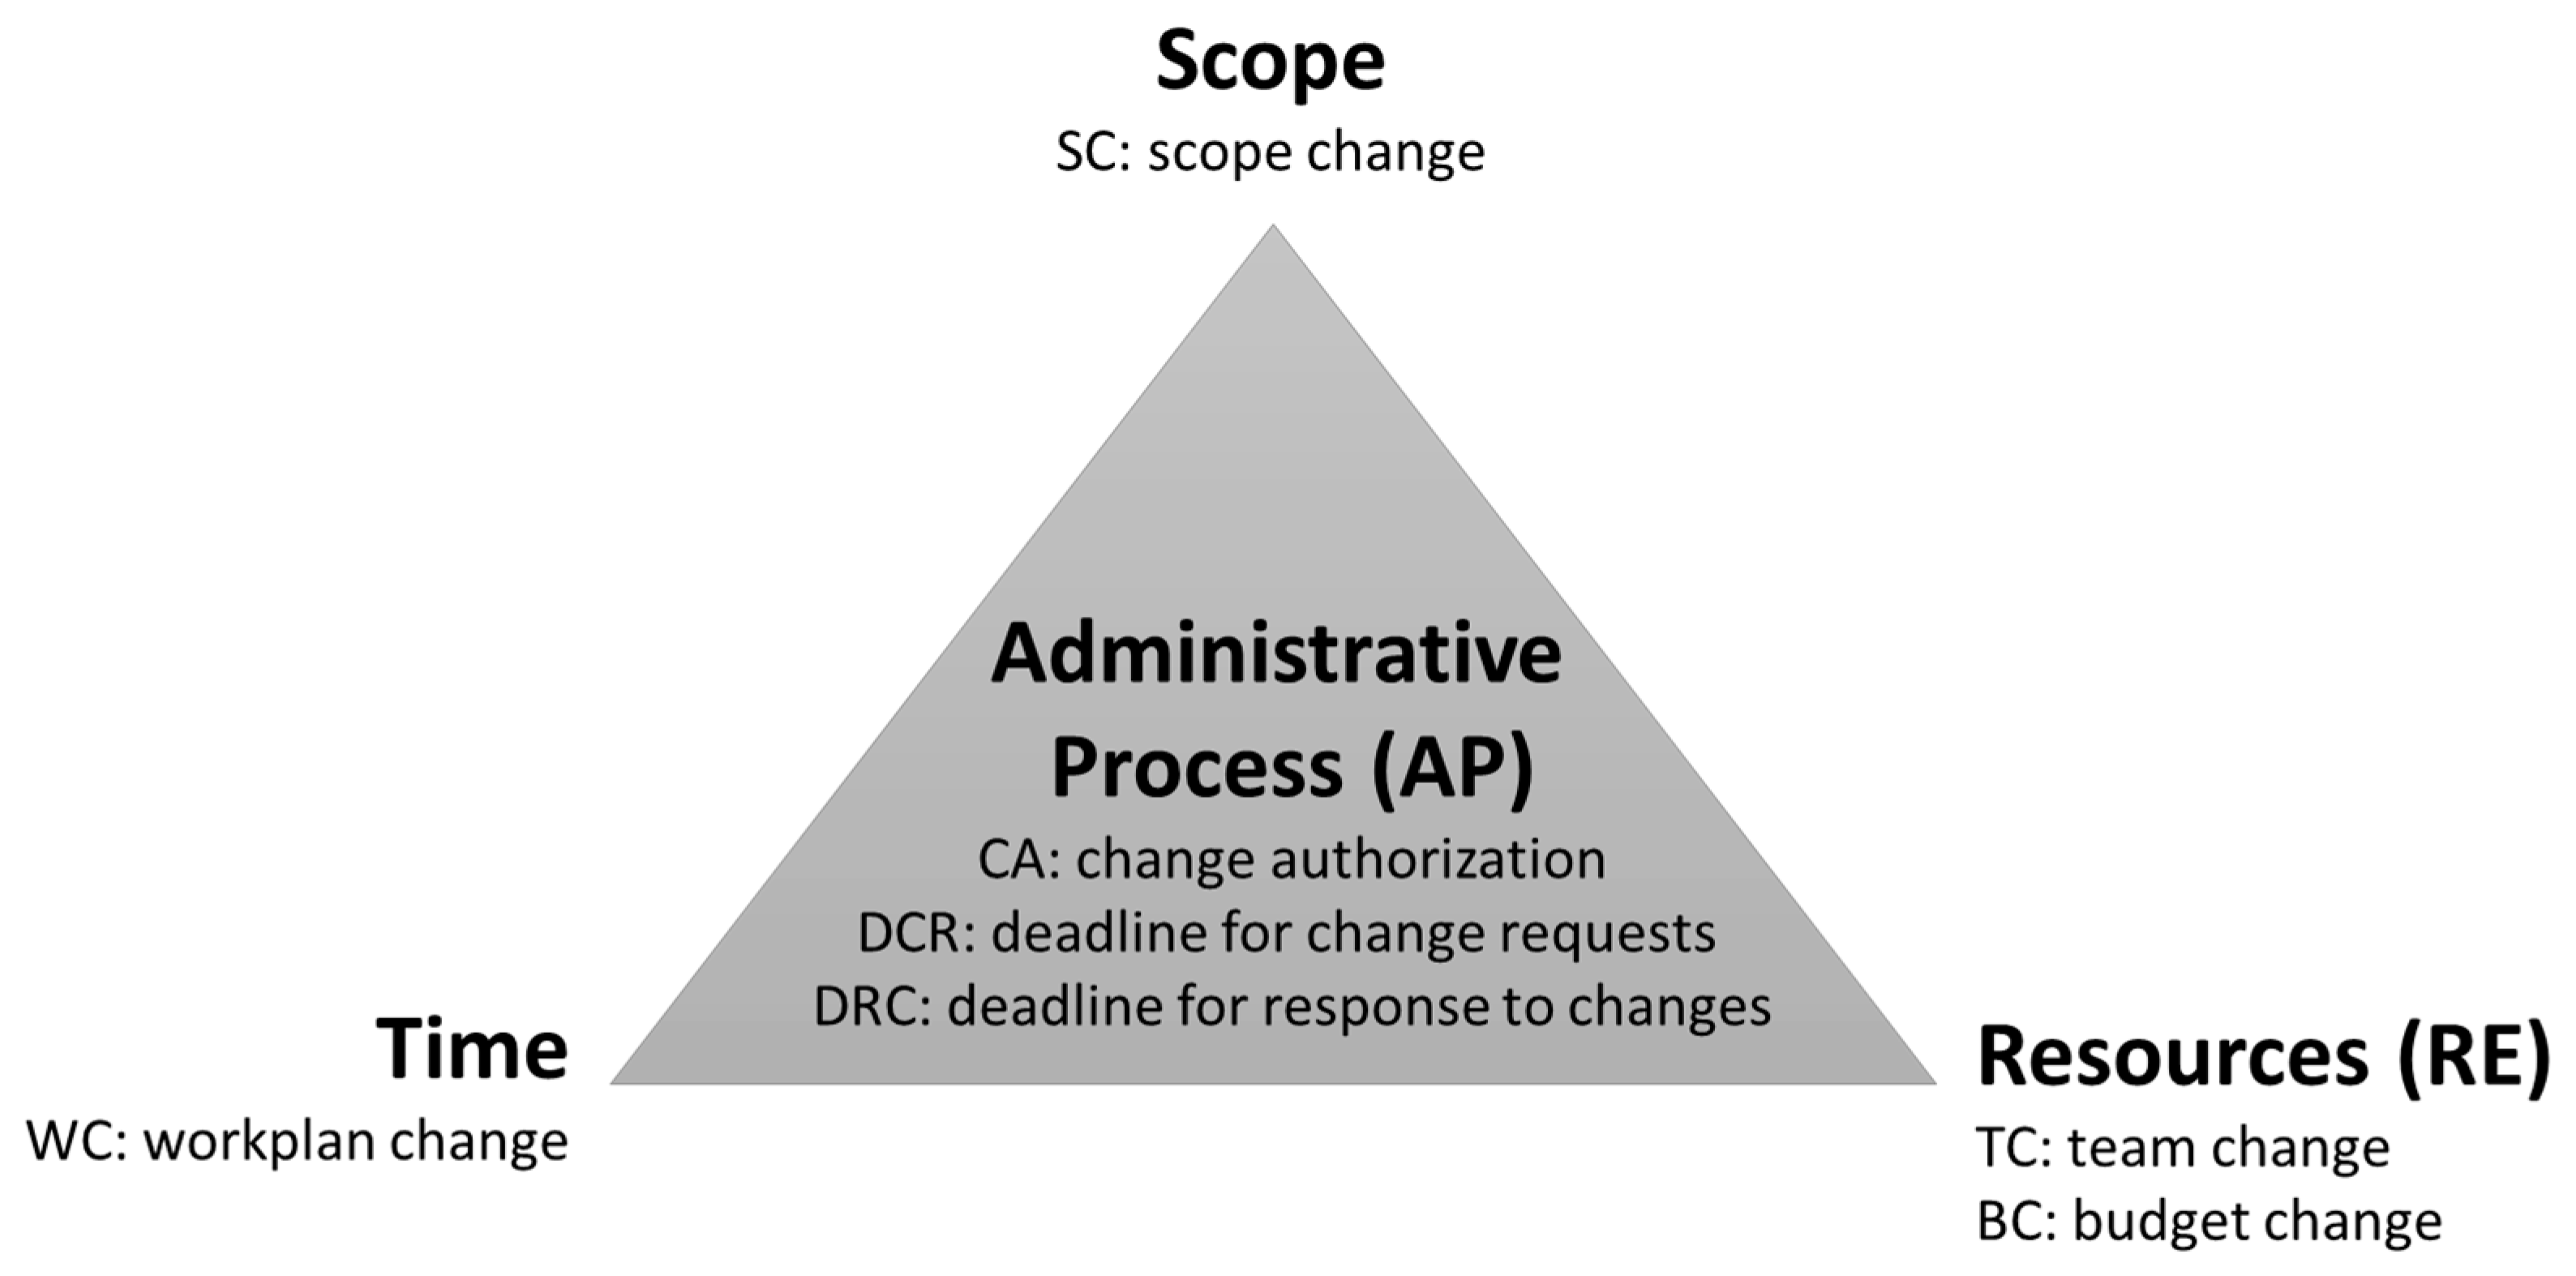
According to the aforementioned levels, the questionnaire is divided into two blocks. The first block addresses the direct comparison between the four main factors of the Iron Triangle (scope, time, resources, and administrative process) in order to identify which of these, based on the managers’ experience, presents the greatest rigidity in managing changes in the projects under study. The second block delves into the pairwise comparison of the second level, with the subcriteria of scope, time, team, budget, change authorisation, timeframes for change requests, and response times for such requests. A representation of the adapted Iron Triangle is shown in
Figure 1.
In this study, as represented in
Figure 1, the time-related dimension is conceptualised as a single construct capturing the rigidity associated with schedule/workplan modifications during execution. Accordingly, at Level 1 of the AHP, we label this construct “timeline” (WC) to remain aligned with the adapted Iron Triangle, whereas at Level 2, we refer to the same underlying dimension as “workplan change” (WC), emphasising its execution-stage meaning. Thus, timeline and workplan change are not distinct constructs but two labels for the same, used at different levels of abstraction within the hierarchy.
Considering that most of the interviewees were unfamiliar with the AHP methodology, special attention was given to both visual and explanatory aspects during the interviews.
Appendix C presents the questionnaire as used in these interviews. The explanation of the questionnaire was approached using the example of a balance, with its equilibrium point in the centre (value 1), and tilting to the left or right depending on whether the interviewee considers one factor more relevant than the other, in terms of rigidity, in the relative comparison between the factors.
Additionally, the data collection using the aforementioned questionnaire was complemented through an exercise where the interviewees directly prioritised the seven factors analysed at the second level of the AHP method. To do this,
Table 1 was used, which lists the seven factors and asks the interviewee to prioritise them, considering that value 1 corresponds to the factor presenting the greatest rigidity in change management, and value 7 corresponds to the factor considered the most flexible.
2.4. Sample of Interviewees
The selected sample is intended to capture a wide range of experiences within the publicly funded R&D project management system in Spain. Invitations to participate in the semi-structured interviews were sent to 69 R&D project managers, each belonging to a different technology centre registered in the Technology Centres Registry managed by the Ministry of Science, Innovation, and Universities. This means that, initially, project managers from all technology centres in Spain registered in the state registry of technology centres and centres for technological innovation support, managed by the Ministry of Science and Innovation, were contacted. Of these, 38 accepted the invitation and were interviewed, forming a representative sample of 55% of the total registered centres. As shown in
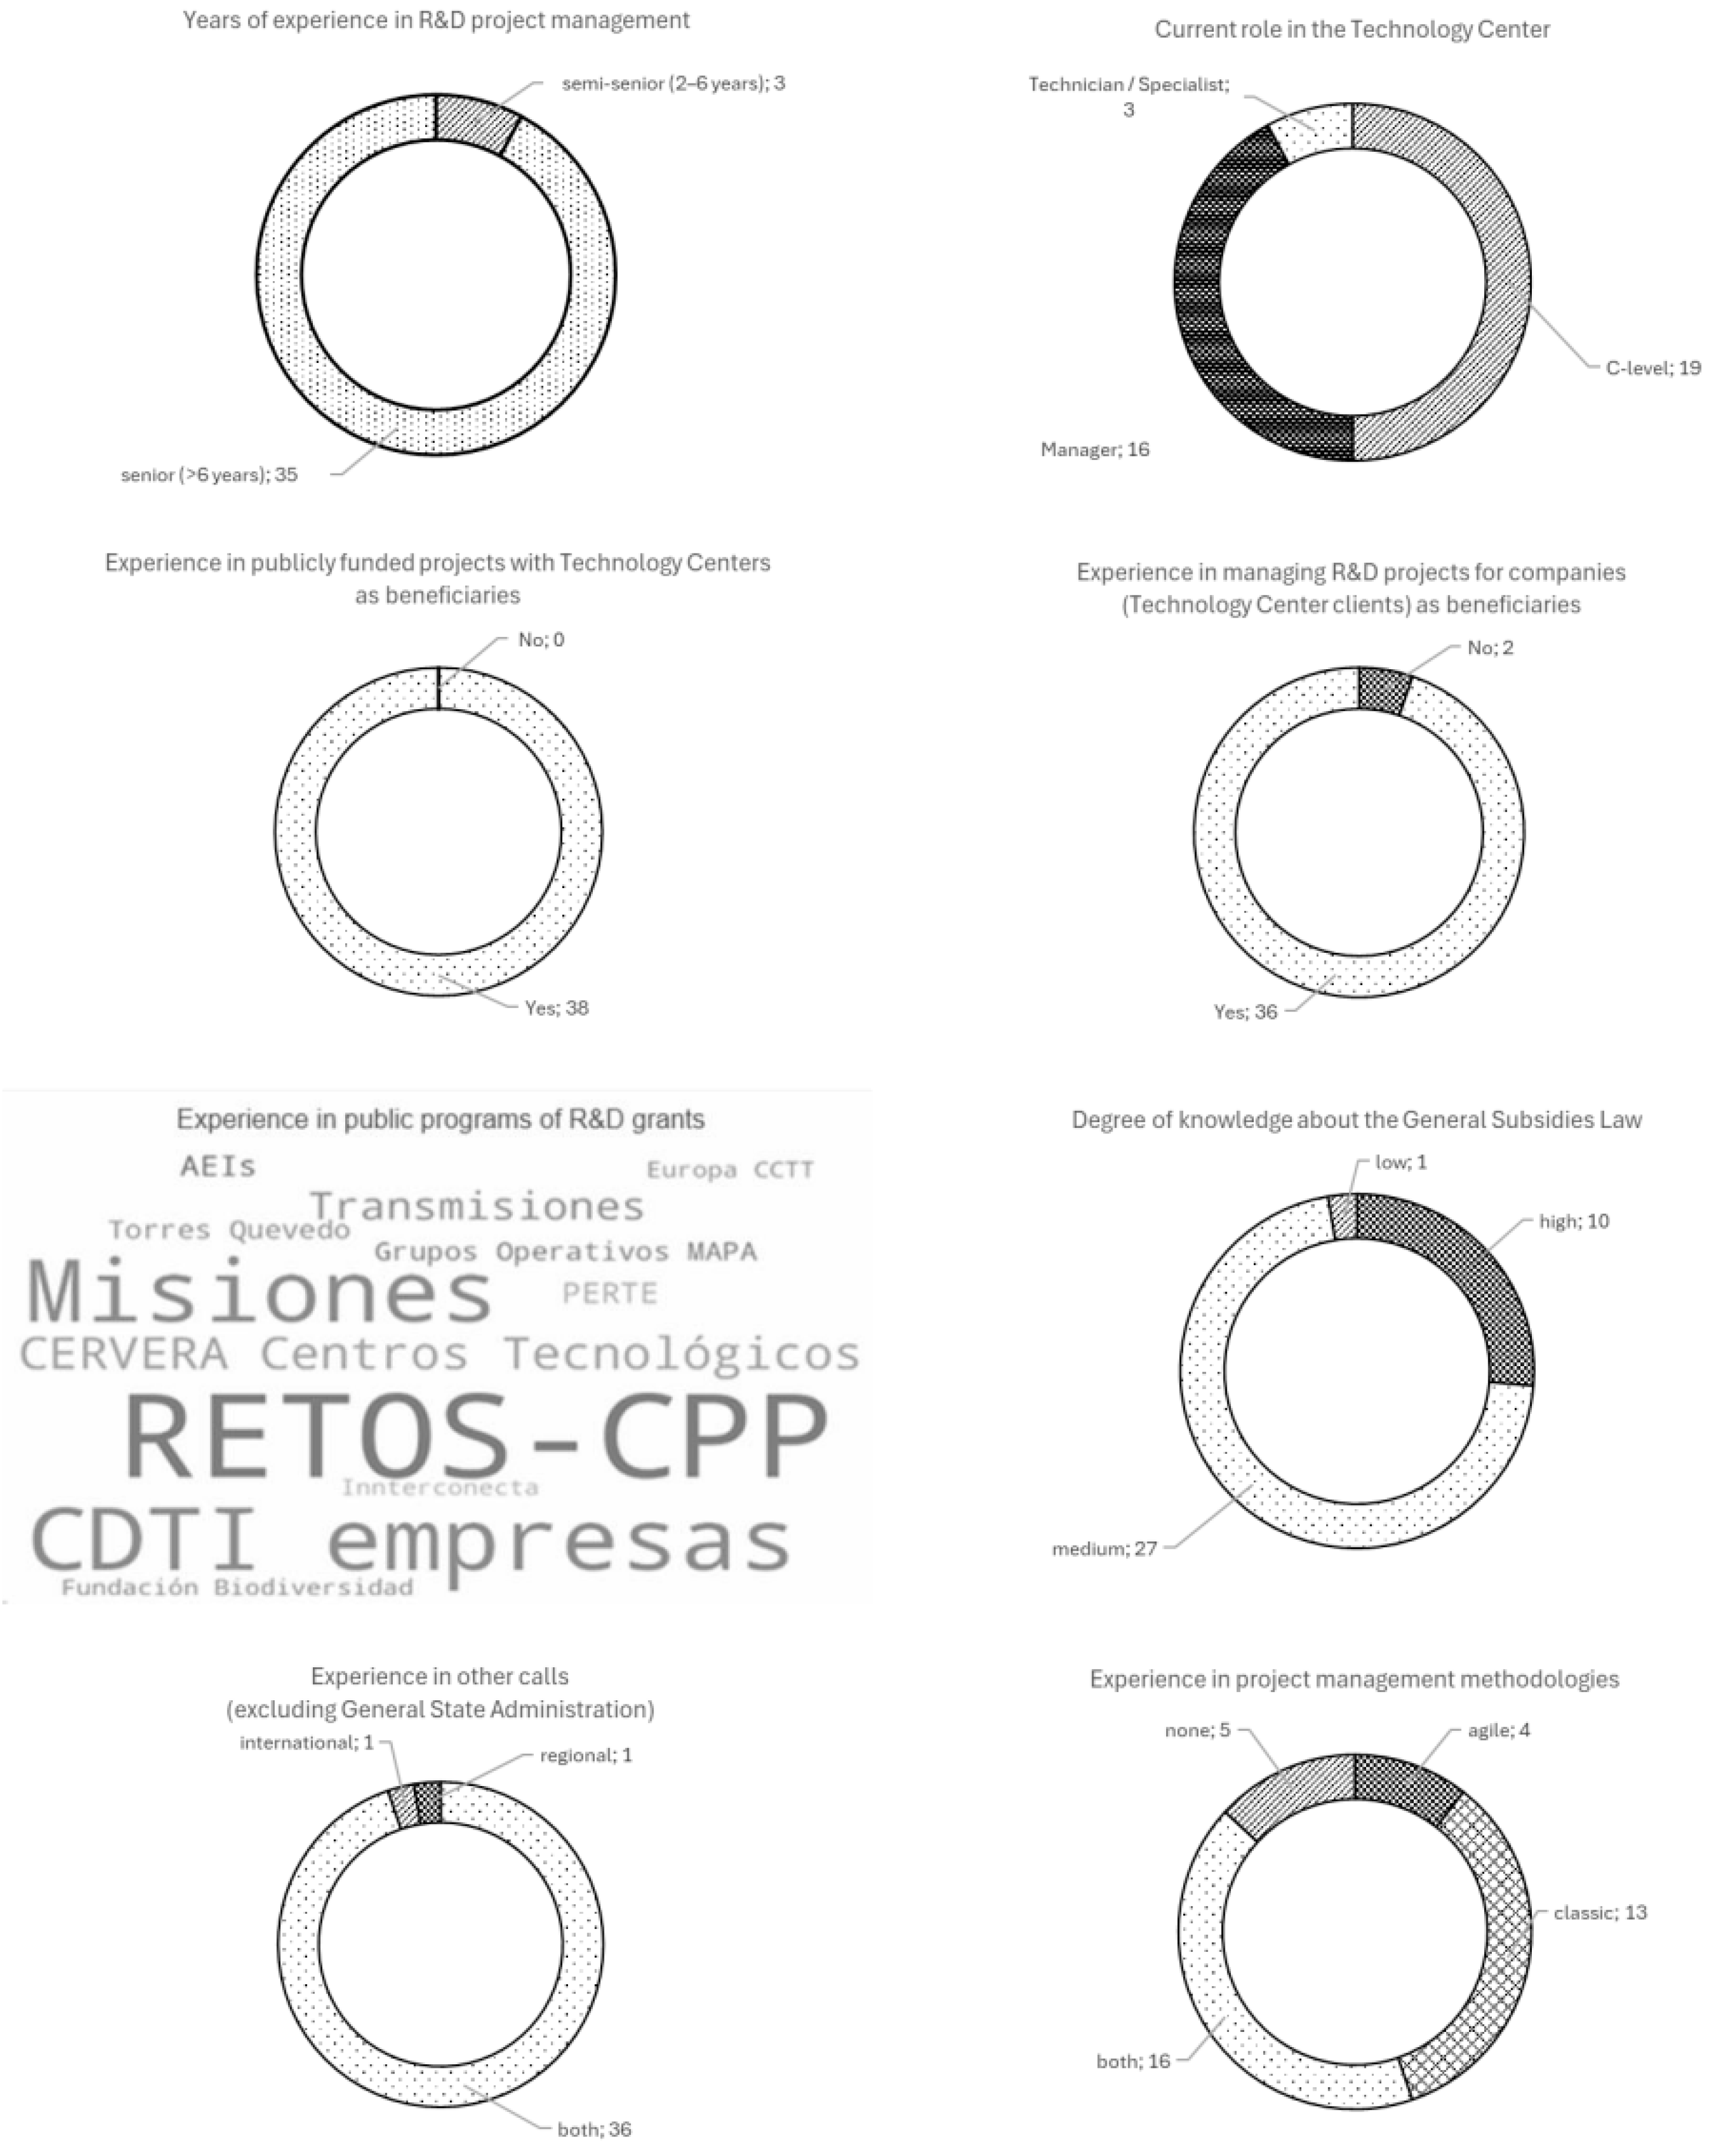
Figure A1 (
Appendix D), the typical profile of these 38 experts is characterised by the following:
Being senior professionals with more than 6 years of experience in managing R&D projects funded by public funding programmes. Only 3 of them (7.9%) had less than 6 years of experience.
Holding responsibilities in their respective centres, either as middle managers (42.1%) or as senior executives (50%), reflecting their experience and professional background, and indicating the importance of such roles within technology centres.
All of them having experience in managing projects in which the technology centre is the direct beneficiary, with 94.7% also having experience in projects where the beneficiaries are the client companies of the centre, with the centre participating as a subcontractor.
A majority (71.1%) consider themselves to have an average level of knowledge of LGS, while 23.6% consider their knowledge of the law to be high.
Having worked both in funding programmes administered by the General State Administration and in programmes managed by regional administrations and international bodies such as the European Commission.
Having experience with programmes managed by both the State Research Agency (AEI) and the Centre for the Development of Technological Innovation (CDTI), both agencies under the Ministry of Science and Innovation.
Thus, it can be stated that there is a high level of homogeneity in the profile of the interviewees, largely aligning with the typical profile described above.
Regarding the geographical location by Autonomous Communities of the centres to which the interviewees belong, the Valencian Community accounts for the highest number of interviewees, with 6 (15.8%), followed by the Basque Country, Murcia, and Galicia, each with 5 interviewees (13.2% of the total). In Castilla y León, 4 specialists were interviewed, which represents 10.5% of the sample. Andalusia, Catalonia, and the Community of Madrid have 2 interviewees each, each accounting for 5.3%. Finally, Aragon, Asturias, Cantabria, Castilla-La Mancha, Extremadura, La Rioja, and Navarra each have one interviewee, corresponding to 2.6% of the total in each case. This distribution reflects a diverse participation that covers almost the entire country, providing sufficient diversity to eliminate any geographical location bias.
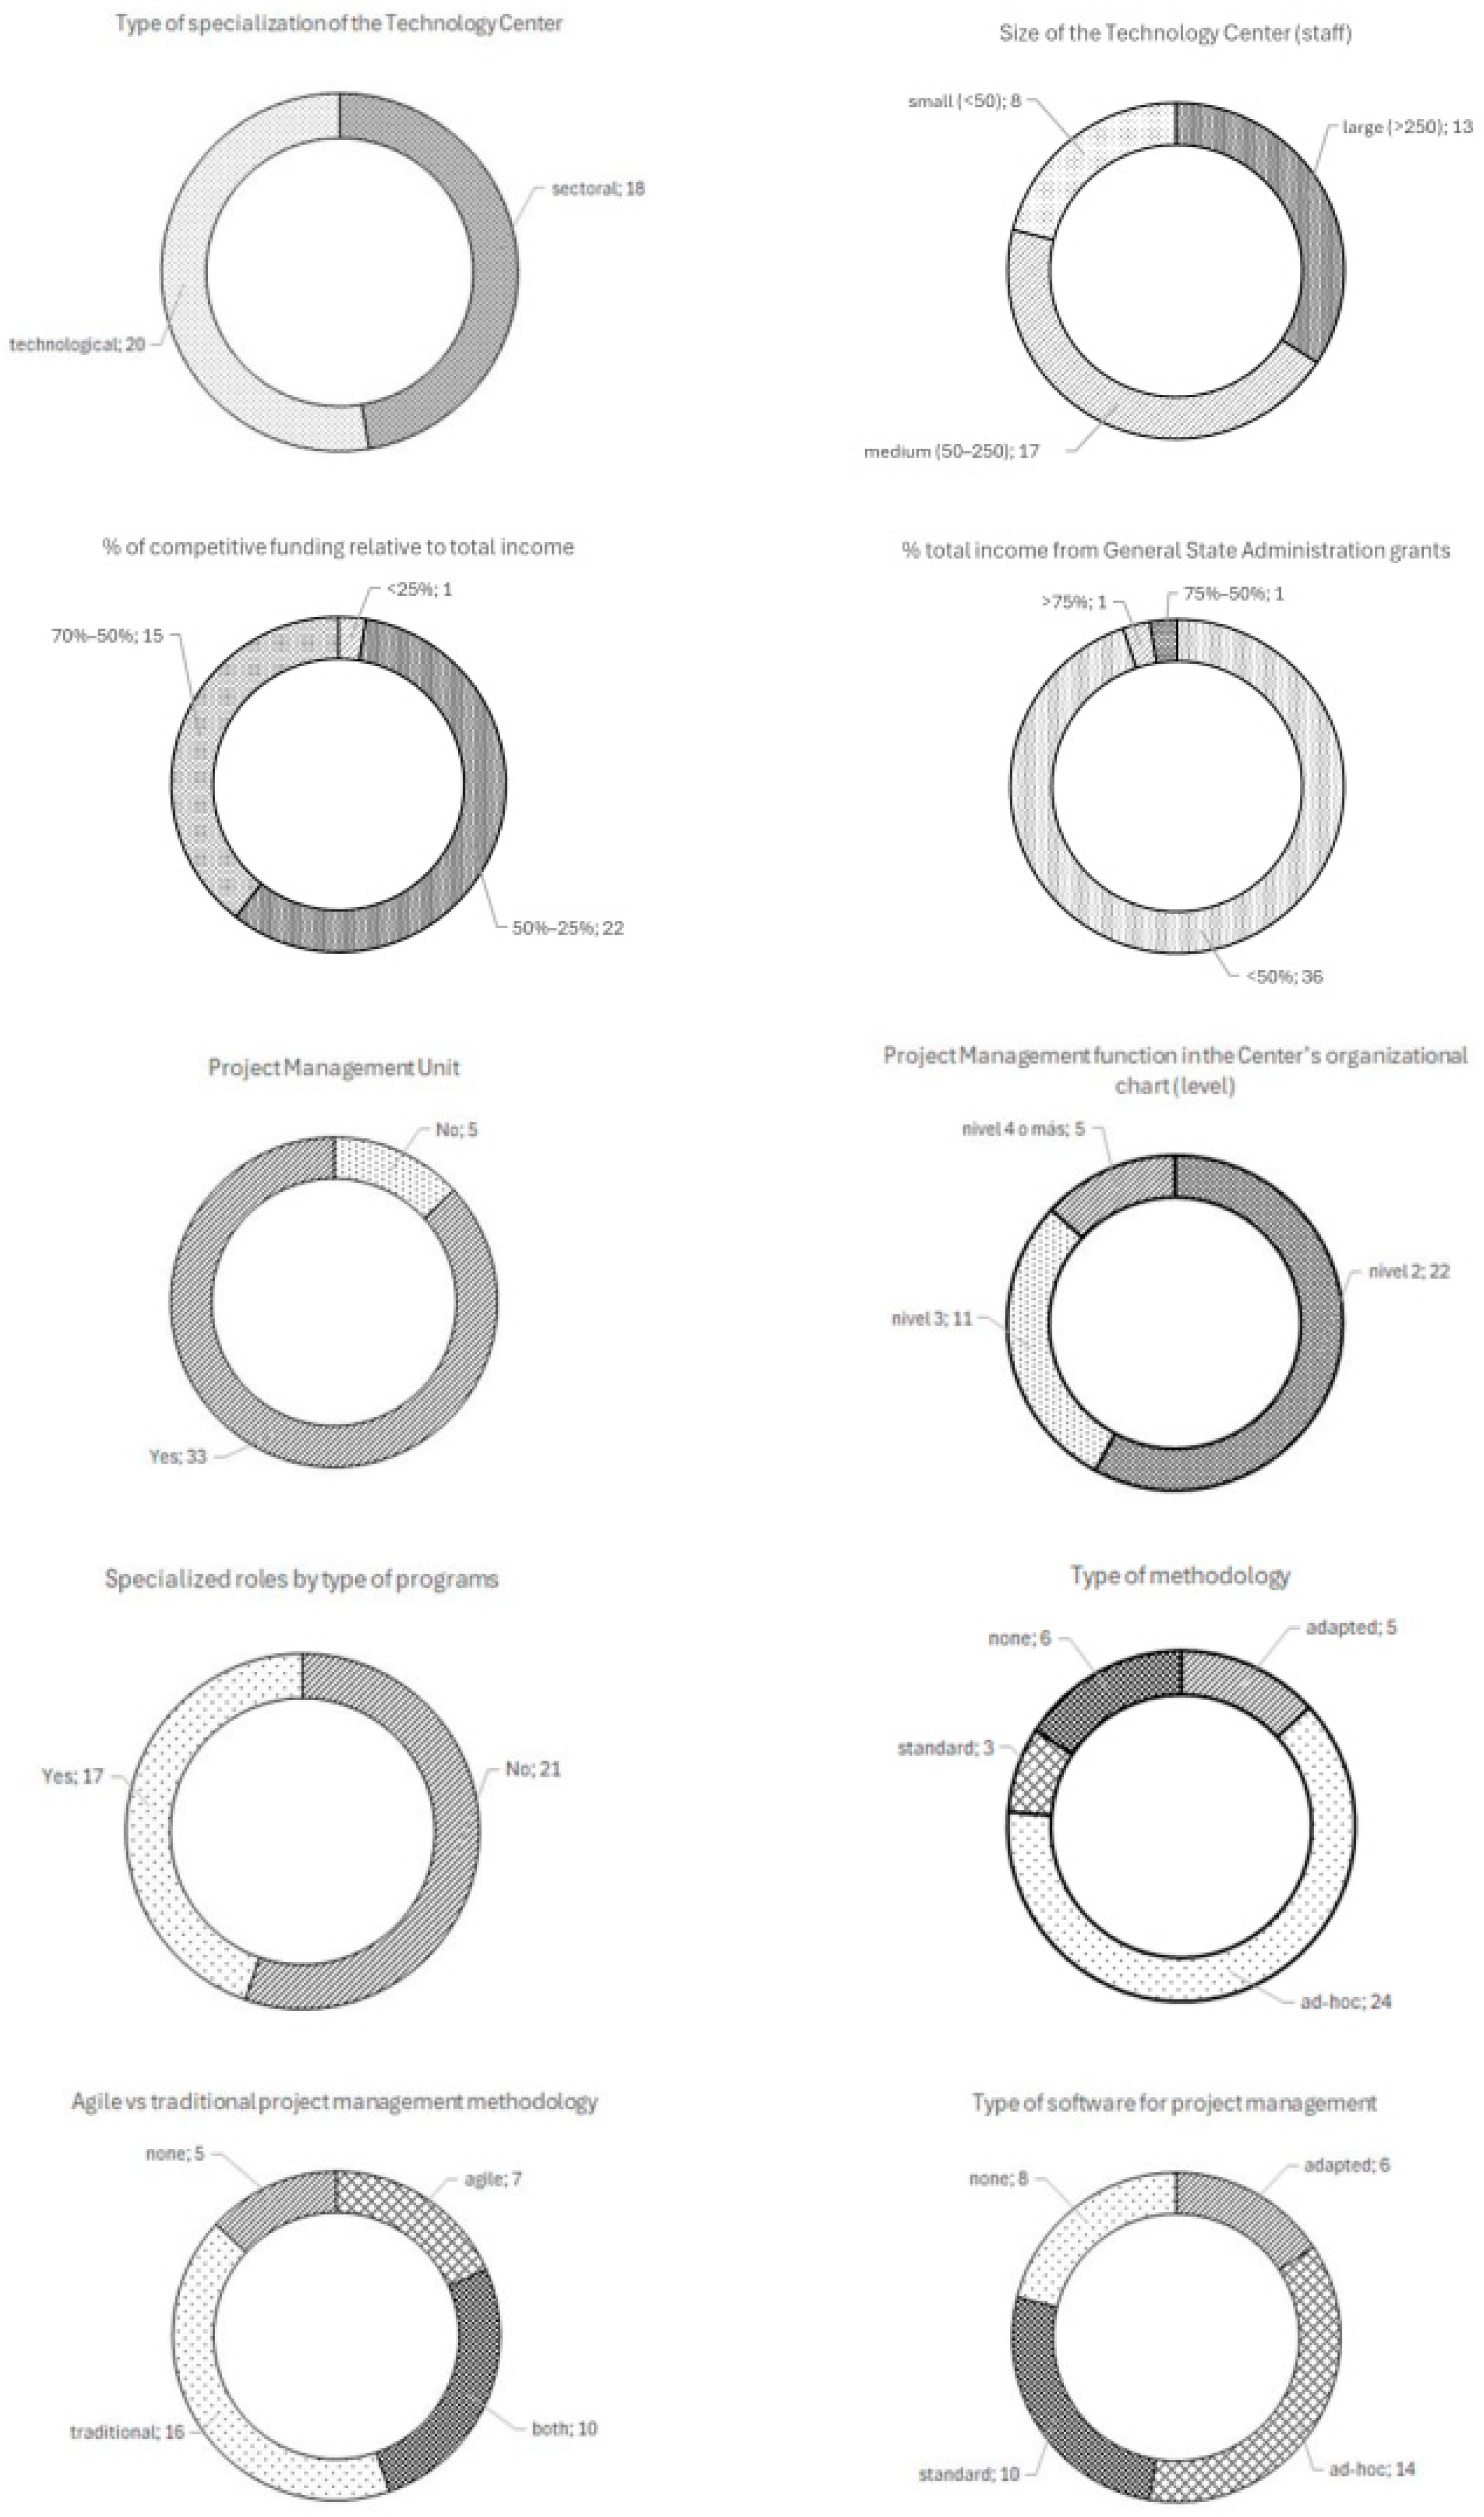
On the other hand, as shown in
Figure A2 (
Appendix D), the sample of interviewees is not only representative of the group of technology centres, with 55% of the total professionals invited, but also, a balanced sample was achieved between professionals working in technological specialisation centres (52.6%) and sector-specific centres (47.4%). Rather than using a fine-grained industry taxonomy, we adopted this higher-level segmentation between technology-specialised centres and sector-specialised centres, which captures meaningful differences in the nature of R&D activities (more transversal vs. more applied). This distinction is relevant because it may influence how managers perceive regulatory constraints in publicly funded R&D projects.
Regarding the size of the technology centres, 21% of the interviewees work in small centres with fewer than 50 employees, 44.7% in medium-sized centres with between 50 and 250 employees, and 34.3% in large centres with more than 250 employees.
Moreover, as previously noted, the presence of competitive funding plays a significant role in the activities of these centres, with a diversity of work areas, including regional, national, and international scopes, which further strengthens the value of the interviewees’ expertise, as they have work experience in areas other than the funding managed by the General State Administration, the focus of this study.
More specifically, 57.9% of the interviewees work in centres where the percentage of competitive funding as a proportion of total income is between 25% and 50%, while 39.5% work in centres where such funding represents between 50% and 70% of their income. Only one works in a centre where competitive funding accounts for less than 25% of the total. Regarding the percentage of income from the General State Administration, 94.7% of the interviewees work in centres where it accounts for less than 50%, while only one centre receives between 50% and 75% of its income from such funding, and another receives over 75%.
Furthermore, the centres where the interviewed managers work generally have specific and specialised units or departments for project management (86.8% of cases), with varying relevance in the organisational structures of the respective centres (level 2 in 57.9% of cases, level 3 in 28.9%, and level 4 or higher in 13.2% of cases). Regarding the existence of roles specialised by programme type, 44.7% of centres have such roles. There is also a variety of responses regarding the methodologies and tools (software) used to manage the projects. While 15.8% of the interviewees reported not using any methodology, 63.1% use ad hoc methodologies, 13.2% use adapted methodologies, and 7.9% use standard methodologies. Regarding the use of agile and traditional methodologies, 13.2% do not use any of these methodologies, while 42.1% use traditional methodologies, 18.4% use agile methodologies, and 26.3% use both. Lastly, regarding the type of software for project management, 21.1% of the interviewees stated that they do not use any specific software, while 36.8% use ad hoc software, 26.3% use standard software, and 15.8% use adapted software.
2.5. Mixed-Method Integration Protocol
Qualitative and quantitative evidences were integrated using a sequential, theory-informed triangulation procedure.
Step 1 (coding): open-ended answers (Q51–Q55) and interview notes were coded using a hybrid scheme: deductive codes aligned with the adapted Iron Triangle/AHP dimensions (SC, WC, Resources → TC/BC, Administrative process → CA/DCR/DRC), plus inductive in-vivo codes capturing recurrent governance mechanisms (e.g., ex post reviews, interpretive variability, liability).
Step 2 (themes): first-cycle codes were iteratively grouped into higher-order themes describing how constraints are experienced like, for example, scope boundary, response-time misalignment or interpretive fragmentation and how they affect behaviour.
Step 3 (mapping): themes were mapped back to the corresponding constraint dimension to enable like-for-like comparison with the quantitative instruments.
Step 4 (triangulation): for each dimension, the following issues were compared: thematic prevalence and illustrative quotes, Likert distributions for the matching items, and AHP weights plus the direct prioritisation exercise.
Step 5 (inference): convergence or divergence across sources was used to support system-level interpretations of dominant adaptive constraints and regulatory feedback pathways.
Additionally, to enhance transparency in the integration of qualitative and quantitative evidence, the study includes worked examples that illustrate the analytical process in practice. These examples, presented in
Appendix E, show how verbatim interview excerpts were first coded according to the seven parameters of the modified Iron Triangle that structure the conceptual framework of this study, and how these qualitative insights were then triangulated with the different quantitative techniques applied, including Likert-scale analysis, AHP, and direct prioritisation. The purpose of these worked examples is to make explicit how individual qualitative observations contribute to the synthesis of results across methods.
3. Results
To ensure coherence with the conceptual framing introduced in
Section 1, the results are reported and synthesised in terms of adaptive constraints affecting change management (scope-related, procedural, and interpretive), and evidence consistent with regulatory feedback, particularly anticipatory behaviours in the project design phase and compliance-oriented strategies during execution. The descriptive (Likert-scale) findings and the multicriteria prioritisation results are therefore interpreted as complementary evidence for the relative rigidity of system components and the pathways through which regulatory constraints shape managerial decisions.
In addition, across the analyses reported below, no clear and consistent differences were identified between technology-specialised and sector-specialised centres.
3.1. Likert-Scale-Based Questions
Table 2 presents the frequency results of responses obtained from the 38 interviewed managers to the 30 Likert-scale-based questions (Sections 4 to 7 of the questionnaire—
Appendix B). Meanwhile,
Table A2 (
Appendix F) shows the basic statistical values (mean, median, mode, and standard deviation) of these responses.
The analysis of the basic statistical results (
Table A2) for the 30 Likert-scale questions reveals a clear trend in the responses of the interviewed managers towards agreement with the statements made. The average response is 3.81, which indicates a tendency towards responses in the “Agree” to “Neutral” range. Similarly, the median of 3.92 and the mode with a predominant value of 4 confirm the respondents’ inclination towards the “Agree” position.
Regarding the dispersion of the responses, the average standard deviation is 1.00, indicating moderate variation in the responses. In fact, there are no extreme deviations, as the question with the lowest dispersion has a standard deviation of 0.63, while the highest standard deviation is 1.36.
From the analysis of response frequencies (
Table 2), both clear trends and some divergences are identified in the way the different respondents interpret and experience the application of the regulation. For example, it can be observed that, in Question 45 (“European Commission funded projects offer greater flexibility in change management”), 71.1% of the respondents strongly agree with the statement. On the other hand, in Question 46 (“Projects funded by Autonomous Communities, also subject to LGS, offer greater flexibility in change management”), 59% of responses lean towards disagreement, and 31.6% towards agreement, reflecting different realities experienced by the managers depending on the Autonomous Community in which their respective centres are located.
Moreover,
Table 3 outlines the level of consensus reached by the interviewed managers, based on the distribution of frequencies across the various responses, and according to the following criteria:
Very High Consensus: More than 90% of the responses are located in contiguous categories towards agreement or disagreement. For example, in Question 45, 92.1% of the interviewees expressed a position in the values “Agree” (21.1%) or “Strongly agree” (71.1%).
High Consensus: More than two-thirds (66.7%) of the responses are located in contiguous categories towards agreement or disagreement. For example, in Question 3, 68.4% of the interviewees expressed a position in the values “Agree” (42.1%) or “Strongly agree” (26.3%).
Moderate Consensus: At least half (50%) of the responses are located in contiguous categories towards agreement or disagreement. For example, in Question 46, 50.0% of the interviewees expressed their position in “Strongly disagree” (26.3%) or “Disagree” (23.7%).
No Consensus: More than a quarter of the responses are “Neutral” and other cases. For example, in Question 26, 28.9% of the responses are concentrated in “Neutral” (neither agree nor disagree). Although this category, together with the responses classified as “Agree”, adds up to 63.2%, it is not considered moderate consensus, but rather no clear consensus (no consensus).
Similarly,
Table 3 also indicates the level of consensus achieved, i.e., the direction towards which the consensus value trends towards, with the value presenting the highest number of responses being considered the “consensus value”. In the case where the “Neutral” category (neither agree nor disagree) exceeds 25%, the “consensus value” will be labelled as “No consensus—Neutral”.
Grouping responses based on the identified type of consensus, the following results were obtained:
First, it is worth noting that five questions achieved a very high consensus, indicating that at least 90% of the respondents leaned either towards agreement (“Strongly agree” and “Agree”) or disagreement (“Strongly disagree” and “Disagree”). These questions are 1, 2, 42, 45, and 48.
Next, thirteen other questions were classified as having a high consensus, meaning that at least two-thirds (≥66.7%) of the respondents leaned towards either the extreme of agreement (“Strongly agree” or “Agree”) or disagreement (“Strongly disagree” or “Disagree”). These questions were 23, 24, 25, 28, 29, 31, 33, 36, 37, 40, 41, 43, and 49.
Similarly, seven other questions were classified as having moderate consensus, indicating that at least half (≥50.0%) of the respondents leaned towards either the extreme of agreement (“Strongly agree” or “Agree”) or disagreement (“Strongly disagree” or “Disagree”). These questions were 32, 34, 35, 39, 44, 46, and 50.
Finally, five questions were classified in the “No Consensus” category due to more than 25% of responses being concentrated in the “Neutral” category (neither agree nor disagree). These questions were 26, 27, 30, 38, and 47.
3.2. Open-Ended Questions
Questions 51 to 55 of the survey were designed to allow the 38 interviewed project managers to respond freely, without being constrained by the Likert scale used in the previous sets of questions. The following provides a detailed account of the responses given by the interviewees to each of these questions.
3.2.1. Question 51: Could You Provide an Assessment of How the Law Impacts the Complexity and Flexibility in the Management of R&D Projects?
Four key themes emerged from the responses of the interviewees, which are outlined below:
Structural Inadequacy of the LGS for the Nature of R&D: Fourteen interviewees believe that the LGS (General Subsidies Law) is not designed to address the specific characteristics of R&D projects, which are marked by high uncertainty and the need for adaptability. They argue that the legislation is overly rigid, preventing swift adjustments to objectives or budgets, and fails to accommodate the natural evolution of such projects. Moreover, they warn that this situation discourages participation, particularly from businesses. Some responses compare Spanish regulations with those of the European Union, concluding that the Spanish regulatory framework is more complex and restrictive.
Administrative Burden, Deadlines, and Operational Rigidity: Fourteen interviewees highlight the significant indirect costs associated with administrative management. They also mention the rigidity introduced not only by the LGS but also by the so-called “Late Payment Law” (Law 3/2004, of 29 December), as well as the long administrative resolution periods. All of these factors hinder project execution, complicate planning, and create an excessive bureaucratic burden relative to the technical value of the projects.
Ambiguity and Restrictive Application of the Law: Seven interviewees identified issues with the interpretation and practical application of the LGS. Some noted that the Law itself is not necessarily restrictive, but the calls for proposals interpret it too rigidly, imposing controls and criteria that are not always required. This creates legal uncertainty, differing criteria across similar funding programmes depending on the managing body, and an unpredictable environment for project management.
Need to Adapt the Law to R&D: Four interviewees acknowledged that the LGS provides transparency and control but pointed out that it needs specific adaptation to be effectively applied in the R&D field. While the rigour of the law is appreciated, they emphasised the need for greater flexibility in areas such as budget changes, redefining the objectives, deadlines, and roles of participants, in order to maintain the effectiveness of projects.
3.2.2. Question 52: In Your Experience, Which Managing Entity Is the Most Flexible?
The responses indicate that the CDTI (Centre for the Development of Industrial Technology) is by far the most highly rated managing entity for its flexibility, with 22 out of the 38 interviewees expressing this view. The project managers highlighted its close relationship with stakeholders, its ability to adapt during the execution phase, and its management approach, which focuses on facilitating the successful progress of projects during their implementation. The remaining responses were more varied and less frequent, mentioning entities such as the AEI (Spanish Agency for Innovation) or the Ministries of Agriculture and Industry, but these responses were limited to specific cases or projects. For example, flexibility was noted in certain phases, such as calls for proposals, execution, and specific circumstances, but no clear pattern emerged.
3.2.3. Question 53: In Your Experience, Which Managing Entity Demonstrates the Least Flexibility?
The Spanish State Research Agency (AEI) stands out clearly as the managing entity with the least flexibility, being mentioned by 11 of the 38 interviewees. This is followed by the Biodiversity Foundation with five mentions; the Ministry of Agriculture, Fisheries, and Food (MAPA) with four mentions; and Red.es with three mentions. These entities are perceived as particularly rigid, either due to the difficulty of making changes during project execution, the associated administrative burden, or their limited capacity to adapt to the needs of the beneficiaries. Other responses were more minor and scattered, with references to entities such as the Ministry of Science, Ministry of Industry, Ministry of Health, and CDTI. Additionally, some interviewees stated that all entities exhibit a similar level of rigidity.
3.2.4. Question 54: Based on Your Experience, What Improvements Would You Suggest to Optimise the Management of Publicly Funded R&D Projects?
Five key themes emerged from the responses of the managers, which are described below:
Operational Flexibility and a Regulatory Framework Adapted to R&D: This group includes the majority of the responses (24 interviewees), focusing on the need for a more flexible management framework that aligns with the uncertain and evolving nature of R&D projects. Respondents called for more reasonable timelines, the possibility to make changes to the technical scope and budget, and a less restrictive interpretation of the General Subsidies Law (LGS). Many interviewees suggested adopting reference models like Horizon Europe, which offer more results-oriented frameworks, greater autonomy for beneficiaries, and mechanisms such as lump sum payments. The importance of reducing legal uncertainty was also emphasised, with clear and stable rules being established from the outset of the project to avoid retroactive revisions.
Administrative Simplification and Consistency between Bodies: Fourteen interviewees agreed that excessive bureaucracy is one of the main bottlenecks in project management. They suggested reducing the required documentation and adopting simpler processing platforms, inspired by those used in European programmes. Additionally, they highlighted the need to harmonise criteria between managing entities, as significant differences currently exist in how the requirements of the LGS are interpreted and applied, creating insecurity.
Improvement in Timelines and Planning of Calls for Proposals: Eight interviewees stressed that the timelines of the managing bodies are a critical factor that directly impacts the viability of projects. They urged for improvements in the submission, resolution, and execution deadlines of calls for proposals, and recommended publishing predictable annual calendars to help teams plan more effectively. Special criticism was directed at the lack of response within the committed timelines by the administration, as well as the uncertainty generated by delayed or changed calls for proposals without prior notice.
Strengthening Technical Follow-up and Support for Beneficiaries: Five interviewees proposed strengthening technical support throughout the lifecycle of the project. They suggested giving more prominence to technical monitoring (not just administrative), for example, by introducing roles similar to the Project Officers in European programmes, who act as the Commission’s main interface with the consortium, monitor progress against the Grant Agreement and the project work plan, review deliverables and periodic reports, and support the management of changes (e.g., amendments) when justified. In addition, they help ensure compliance with contractual obligations and facilitate the resolution of technical and procedural queries, often coordinating reviews or requesting clarifications when needed. There was also a demand for a clear and accessible point of contact to resolve queries and validate decisions, rather than relying on impersonal channels such as call centres.
Specific Technical and Financial Adjustments: Three managers suggested very specific improvements related to technical or financial aspects, such as allowing private audits without the need for additional administrative procedures, relaxing the requirement to present three quotes in procurement, or improving conditions regarding indirect costs and accepted rates. Although these suggestions were specific, they reflect recurring obstacles in the execution and justification of projects, particularly when formal requirements take precedence over technical or economic logic.
3.2.5. Question 55: Is There Any Aspect or Experience Related to the Management of R&D Projects Under the General Subsidies Law That You Would Like to Share and That Has Not Been Addressed in the Previous Questions?
The responses to this final open-ended question reveal both a reaffirmation of issues previously discussed and the introduction of new insights.
First, seven managers emphasised the legal uncertainty and regulatory ambiguity surrounding the management of R&D projects under the LGS. They referred to administrative reviews carried out years after the completion of projects, the ambiguity in interpreting regulations such as the Late Payment Law, and the application of joint liability, all of which create an environment of mistrust and preventive overburden. Criticisms regarding excessive administrative and bureaucratic burden were also repeated, with six interviewees calling for a genuine simplification of the system. Similarly, five managers reiterated the lack of alignment between the system and the specific characteristics of R&D, such as its complexity, exploratory nature, and inherent risk, which ultimately discourages participation, particularly from the business sector.
Beyond these recurring issues, several new suggestions were raised. Three interviewees highlighted the lack of coherence between the technical and economic evaluations of projects, which can lead to contradictions or unjustified revisions. Four managers pointed out specific difficulties faced by technology centres, such as the mandatory use of marginal costs in certain calls for proposals, the lack of structural funding, or the treatment of these centres as companies within the consortia, without considering their unique institutional characteristics. One manager called for greater technical professionalism within public administration to better manage subsidies and align them with the real dynamics of innovation. Additionally, two interviewees questioned the current design of financial instruments, particularly the growing use of loans instead of grants. One also mentioned the lack of thorough checks on the solvency of consortium partners, which could compromise project execution. Finally, one response highlighted the lack of coordination between national and regional administrations, where requirements differ significantly, creating territorial inequalities.
3.2.6. Synthesis of the Open-Ended Responses
Although the open-ended responses have been presented through thematic categories, they can also be introduced regarding the underlying institutional logics used by respondents to interpret the effects of the LGS on project management. Across Questions 51 to 55, two broad rationales can be identified. On the one hand, many responses reflect a control- and compliance-oriented logic, where legitimacy is associated with strict adherence to the initially approved plan, documentary completeness, and procedural certainty, particularly in the context of audits and ex post administrative reviews. On the other hand, several responses, especially those comparing national schemes with European programmes, reflect a facilitation- and results-oriented logic, where legitimacy is associated with technical judgement, adaptability to uncertainty, and timely support to ensure project progress.
This tension is closely related to the governance dynamics highlighted by the interviewees. A recurring element is the perception of legal uncertainty and ambiguity in the practical application of rules, which is reinforced by differences in criteria across managing bodies and by the possibility of administrative reviews taking place long after project completion. In this context, respondents describe a situation in which managing bodies have substantial interpretive discretion regarding what changes are considered acceptable, while beneficiaries bear the operational burden of delays and the potential consequences of non-compliance, including those linked to joint liability. These conditions contribute to an environment in which decision-making is oriented towards preventing future objections rather than optimising adaptation during execution.
Taken together, the qualitative evidence suggests two behavioural outcomes that are consistent with the patterns observed in the quantitative results. First, interviewees describe the incorporation of regulatory considerations early in the lifecycle, shaping proposals and planning choices in order to reduce exposure to uncertainty and to the administrative costs of requesting modifications. Second, during execution, interviewees describe a preference for conservative change-management strategies, where technically justified adjustments may be postponed or avoided due to response times, procedural constraints, and uncertainty regarding acceptance criteria.
Additionally, exploratory comparisons across technology-specialised and sector-specialised centres did not reveal systematic differences in the themes and behavioural patterns reported by managers.
Finally, the responses also suggest that these dynamics are not homogeneous. When respondents identify certain managing entities as more flexible, they often refer to a closer and more continuous interaction with stakeholders, greater predictability in criteria, and a management approach oriented towards facilitating project implementation. Conversely, entities perceived as less flexible are associated with more rigid or less predictable procedures and criteria. This supports the interpretation that, beyond the legal framework itself, the way in which governance is enacted in practice is a key factor shaping perceived rigidity and the overall capacity for adaptation.
3.3. Importance Ranking of Variables According to the Analytic Hierarchy Process
The following presents the results from the Analytic Hierarchy Process (AHP) applied to the prioritisation questions found in
Appendix C. This analysis was carried out in two levels, following the structure shown in
Figure 2.
In this case, the AHP was adapted to fit the specific objectives of the research, which involves a partial deviation from the traditional application of this methodology. Specifically, the final level of the AHP, corresponding to alternatives, was omitted. The purpose of this analysis is not to select the best option from a set of alternatives, but rather to rank and weight the factors that influence the management of R&D projects subject to the General Subsidies Law (LGS).
To achieve this, the first step involves determining the relative importance of the first-level variables, namely “scope” (SC), “timeline” (WC), “administrative process”, and “resources”, for each of the survey participants. Once the relative importance of the first-level variables is determined, it is possible to create the corresponding decision matrix for each participant. This matrix shows the pairwise relative importance of all the first-level variables under study. Due to space constraints, only the aggregated results for each participant are shown in this section; thus, these matrices are not included here.
As a second step, as shown in
Figure 2, the first-level variable “administrative process” is decomposed into three second-level variables: “prior approval of changes” (CA), “change request submission deadline” (DCR), and “response time to requested changes” (DRC). Therefore, a process equivalent to the one performed for the first-level variables is conducted to analyse the relative importance of each of these three second-level variables. Similarly, for the first-level variable “resources”, it is related to two second-level variables: “team changes” (TC) and “budget changes” (BC).
Following the AHP logic, the 38 interviews forming part of this study were processed. The tables below present the results for both the first level (
Table 4) and the second level (
Table 5 and
Table 6).
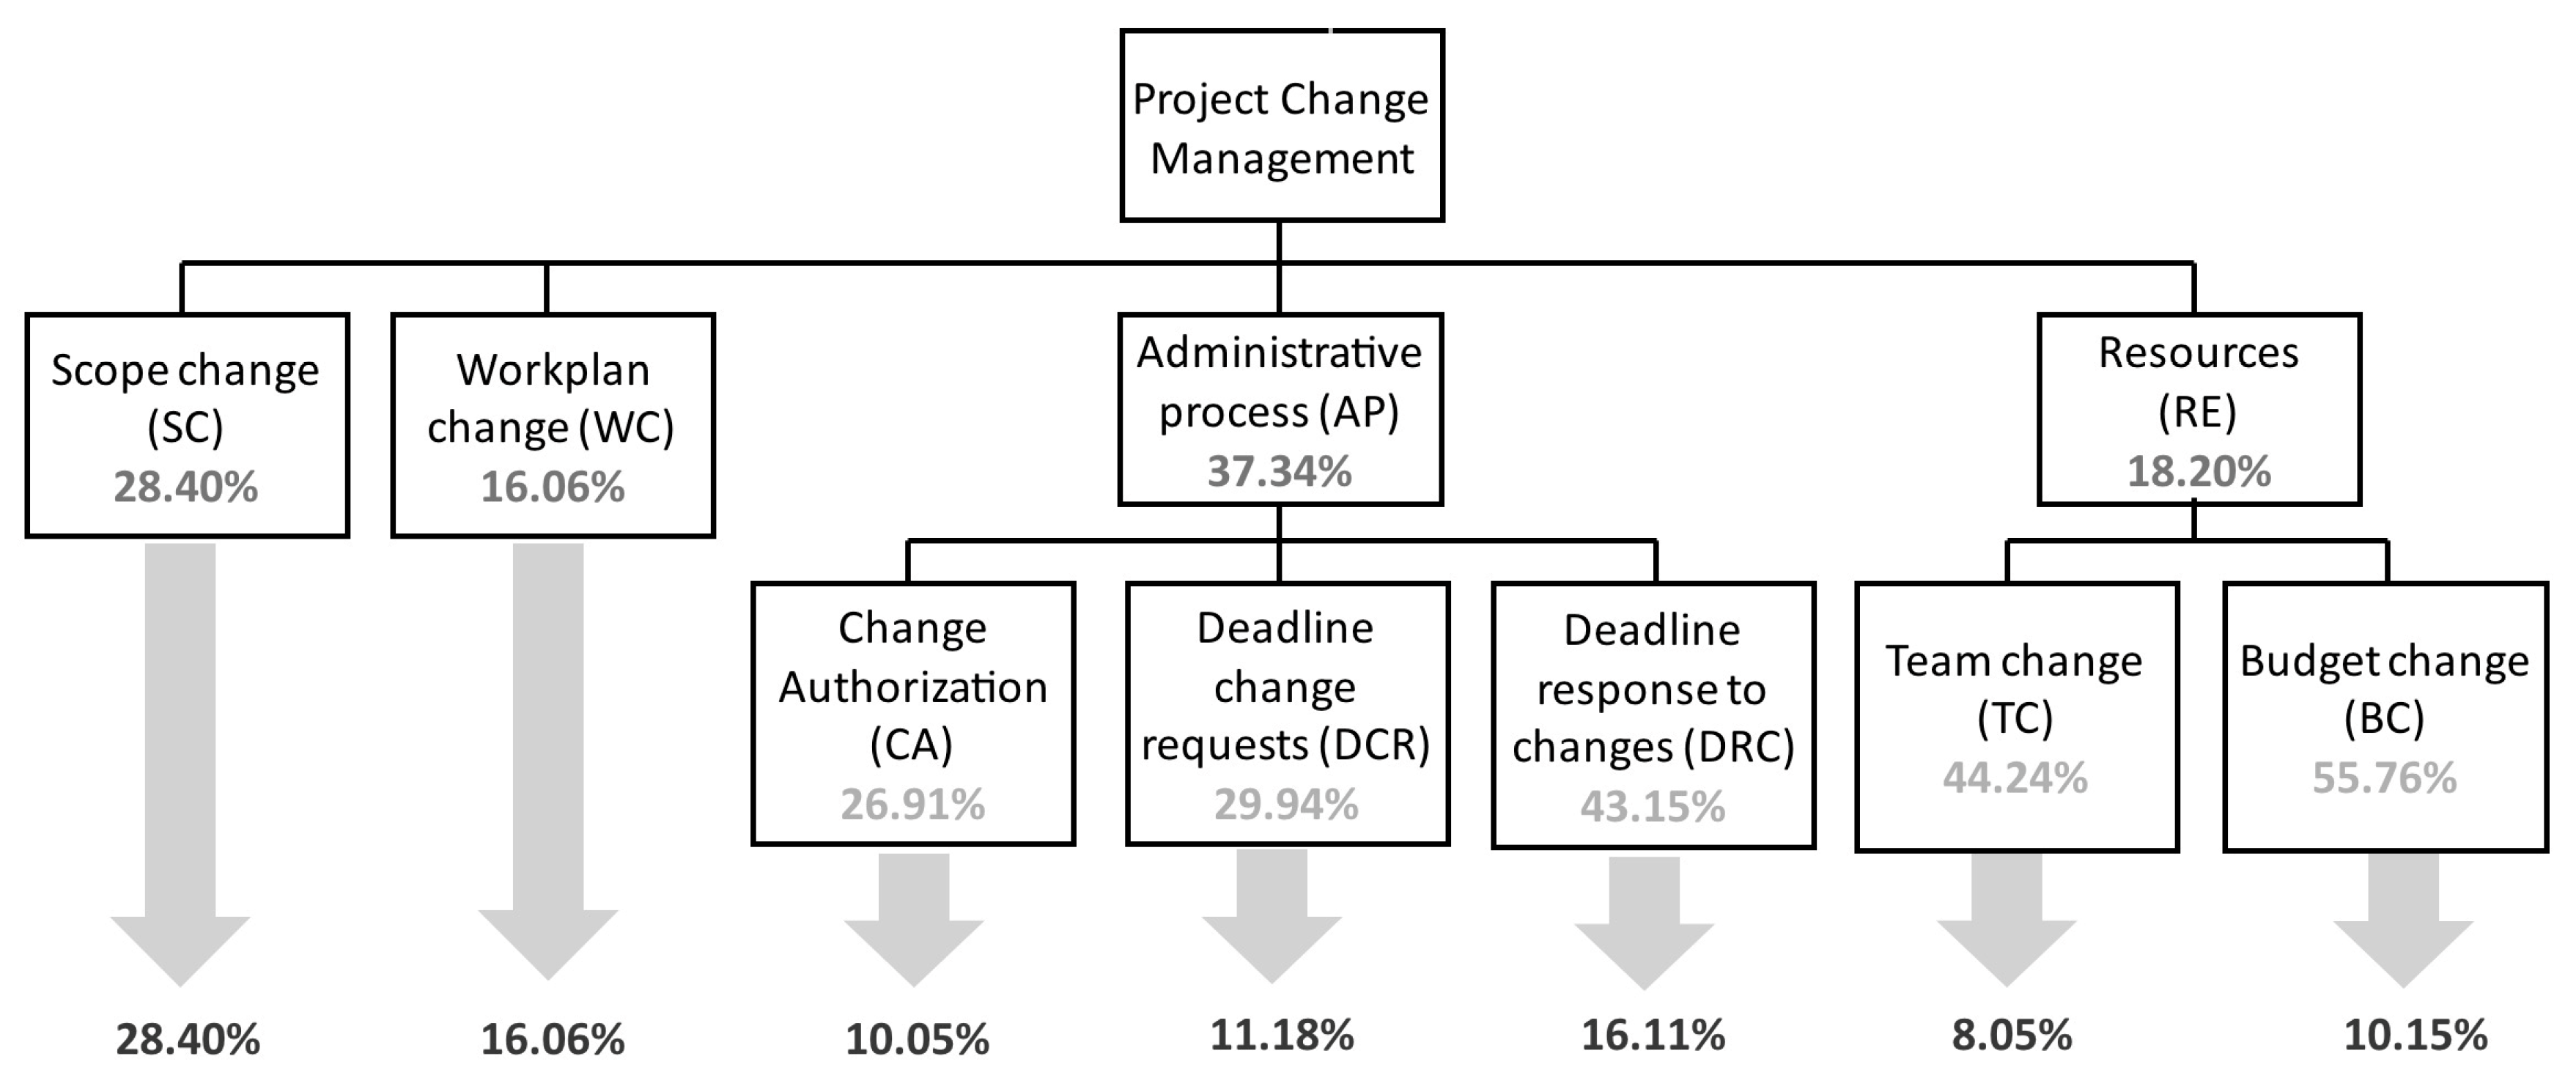
Table 4 displays the percentages of importance assigned to each of the evaluated variables across the 38 interviews, as well as the average values, highlighting that the administrative process associated with managing changes is perceived by the interviewees as the main limitation, with an average relative importance of 37.34%. This is followed by changes in the scope of the project (28.40%). Resources (18.20%) and timeline (16.06%), with similar percentages, are also considered relevant.
Similarly,
Table 5 presents the second-level breakdown of the “administrative process” factor, both for individual interviews and as an average across them. The “response time to change requests” (43.15%) stands out as the most critical aspect. This indicates that interviewees perceive the greatest rigidity in the time it takes for the managing body to respond to the requested changes by the beneficiaries. The other two factors, the “deadline for submitting change requests” (29.94%) and “prior approval of changes” (26.91%), have similar but slightly lower weights.
Table 6 presents the second-level breakdown for the “Resources” factor. Interviewees show a slight tendency to perceive budget changes (55.76%) as more rigid than changes in the project team (44.24%), although the perceived importance of both factors is relatively balanced.
To assess whether high individual inconsistency could drive the aggregated priorities, we recomputed Level 1 weights under increasingly strict CR filters and under a consistency-weighted aggregation. The ranking of dimensions remained stable across all specifications. Using the full sample (n = 38), the mean priorities were Administrative process (37.34%), Scope (28.40%), Resources (18.20%), and Timeline (16.06%). Restricting to CR ≤ 0.15 (n = 16) yielded Administrative process (37.98%), Scope (31.81%), Resources (15.36%), and Timeline (14.84%). Restricting to CR ≤ 0.20 (n = 22) yielded Administrative process (36.67%), Scope (32.08%), Resources (15.98%), and Timeline (15.26%). Excluding the most inconsistent respondent (CR = 166.6%) did not alter the ranking. These findings indicate that the substantive conclusions are robust and not an artefact of including high-CR responses.
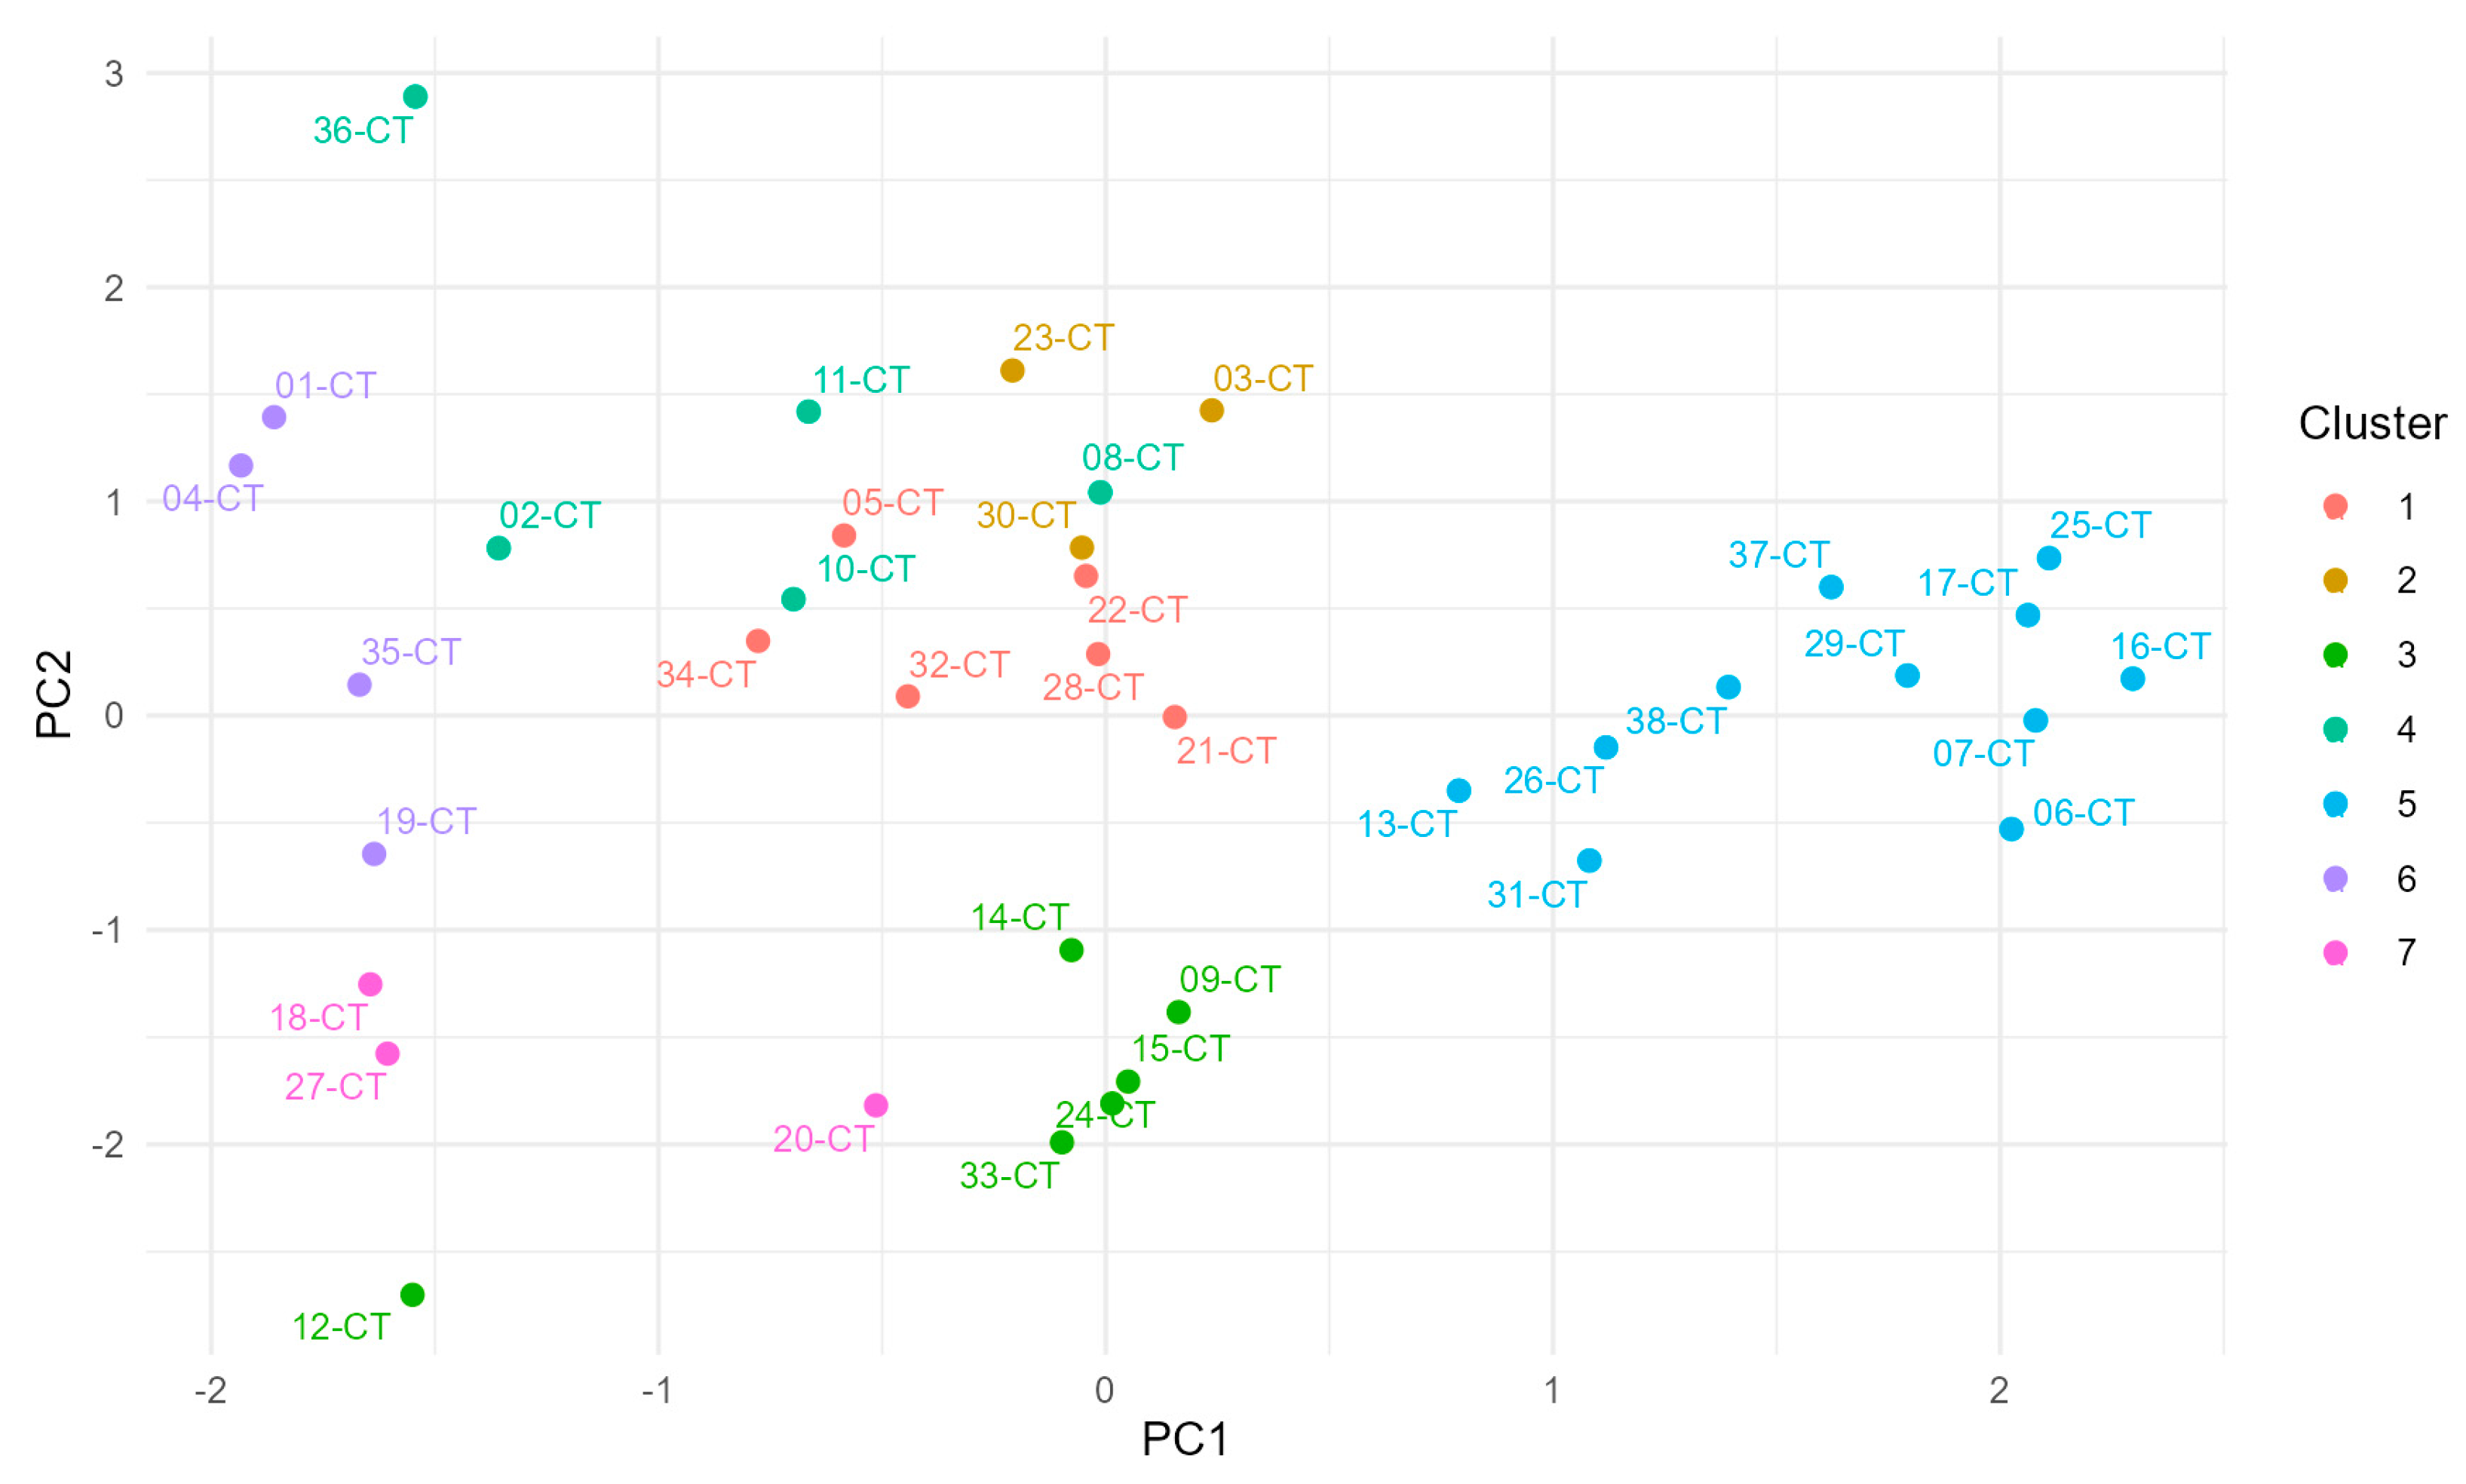
Following the AHP results, an additional unsupervised segmentation of respondents’ individual priority vectors was conducted to assess latent heterogeneity in the relative importance assigned to the seven change-management dimensions. This complementary analysis yields a set of cluster-specific priority archetypes that complement the interpretation of the global AHP weights by revealing distinct respondent profiles. The full clustering methodology, the cluster-mean profiles, and a detailed characterisation of each cluster are reported in
Appendix G.
Finally,
Figure 3 displays the weight values of the various factors, at both the first and second levels, using the averages from the 38 interviews conducted. Analysing the seven parameters that characterise the adapted Iron Triangle of Lamers, it is evident that the “scope changes” factor (28.40%) is considered the most inflexible in terms of project change management, followed by the “response time of the managing body to requested changes” (16.11%) and “changes in project planning” (16.06%).
To complement the information obtained through the AHP, the frequencies of the responses are shown in
Table 7, corresponding to the flexibility perception exercise using the battery of questions outlined earlier in
Table 1. Based on the results, it can be stated that the interviewees consider the “difficulty in redefining the project scope during execution” to be the least flexible factor among all those analysed. Similarly, although at a considerable distance, the next least flexible factor is the “difficulty in implementing changes due to administrative response times to change requests”.
Based on the individual results from the 38 interviews with managers, the four main statistical measures for descriptive analysis have been calculated: these are the mean, median, mode, and standard deviation. As shown in
Table 8, the factor with the highest rigidity is the project scope (mean 2,8 and mode 1, with 47,3% of responses). The interviewees also clearly perceive that changes in the project team are the most flexible (mean of 5.1 and mode of 7, with 39.4% of responses).
As stated earlier in the Methodology section, and in order to clarify how qualitative and quantitative evidence were integrated,
Appendix E presents two worked examples focusing on scope change and deadline for response to changes. These examples illustrate, step by step, how verbatim interview excerpts were coded according to the seven parameters of the modified Iron Triangle shown in
Figure 1, and subsequently triangulated with Likert-scale results, AHP weights, and direct prioritisation outcomes. The worked examples demonstrate how individual project experiences underpin the aggregate patterns reported in this section and support the identification of dominant constraints affecting adaptive capacity in publicly funded R&D projects.
4. Discussion
This section interprets the empirical findings through the socio-technical and regulatory feedback lens introduced in
Section 1. Rather than treating perceived limitations as isolated administrative frictions, they are discussed as adaptive constraints embedded in a publicly funded R&D project management system, and how these constraints generate regulatory feedback pathways that shape managerial behaviour over time is examined. In doing so, we connect the prioritisation of constraints (AHP) and the perceived rigidity/difficulty patterns (Likert-scale evidence) to system mechanisms that condition adaptive capacity during project execution and influence anticipatory choices in subsequent project designs.
Although perceptions of regulatory constraints may plausibly vary across different R&D domains, we explored potential heterogeneity by technology centre orientation (technology-specialised vs. sector-specialised). The evidence did not indicate clear and consistent differences associated with this distinction, suggesting that the mechanisms discussed below reflect broader features of the publicly funded R&D project management system under the LGS rather than the specific R&D orientation of the centres.
The open-ended evidence complements these findings by providing an interpretive explanation of the mechanisms through which regulatory constraints translate into conservative change-management strategies. In particular, the responses suggest that the perceived rigidity of the system is reinforced by a tension between two recurrent institutional logics. A control- and compliance-oriented logic places emphasis on procedural certainty and ex post verification, which tends to favour maintaining the initially approved plan. In contrast, a facilitation- and results-oriented logic emphasises technical follow-up and adaptability to uncertainty, with the objective of supporting project progress during execution.
These logics are reflected in concrete governance dynamics described by the interviewees, such as differences in criteria across managing bodies, limited predictability in the acceptance of modifications, and the perceived implications of ex post reviews and liability. Under these conditions, project managers may rationally prioritise preventive strategies, incorporating regulatory considerations early in project design and limiting scope or other changes during execution in order to reduce exposure to uncertainty and administrative costs. Conversely, when respondents describe more flexible entities, their accounts typically refer to clearer points of contact, more continuous interaction, and greater predictability of criteria, which can reduce uncertainty and facilitate justified adaptations while maintaining the necessary level of control.
The LGS (General Subsidies Law), in its capacity as a general regulation, applies to all types of grants granted by Spanish administrations and, consequently, to R&D projects funded by public programmes. However, it does not establish specific measures for this type of programme [
9]. The unique characteristics of R&D projects create friction with the oversight and control nature of the law, which translates into significant limitations in managing these projects when they are publicly funded [
8,
51]. Specifically, the aforementioned unique features are primarily linked to the risk and uncertainty inherent in R&D and are reflected in the fact that the final results of a project can differ from the initially expected ones [
52,
53].
Project management, defined by the well-known Iron Triangle [
16], presents a scenario where changes during its execution can occur in terms of its scope, the resources used in its development, or the time required for its completion [
54]. The combination of these three variables impacts the quality of the project’s execution [
55]. These dimensions should not be understood as independent constraints, but as interrelated components of a project management system, where increased rigidity in one dimension can amplify limitations in the others during project execution. The LGS allows for modifications to the conditions of grant approval, which are analogous to the three vertices of the mentioned Triangle [
8]. However, this flexibility has an important limitation, as defined in Article 86 of its Implementing Regulation: such modification requests can only be considered when they do not alter the purpose and conditions under which the aid was approved [
9].
This nuance presents challenges, particularly when changes could modify the score received by the project during its evaluation, based on the evaluation criteria outlined in the regulatory framework of the funding programmes [
19]. Specifically, changes in scope pose more significant challenges in this respect than other changes in resources and execution time, as they are directly linked to the purpose and conditions of grant approval [
54].
Beyond the immediate constraints on scope modifications, the results suggest a dynamic mechanism consistent with regulatory feedback. A very high proportion of respondents report anticipating regulatory restrictions during the design phase of projects, and they also perceive that regulation affects not only execution but also the initial design and ambition of R&D projects. This pattern is consistent with a learning-and-anticipation pathway in which prior experiences with modification requests, particularly those related to scope, which are more likely to be interpreted as altering the “purpose and conditions” of approval, shape future project planning choices.
From a socio-technical perspective, this feedback operates through the interaction between regulatory issues, administrative procedures, and organisational routines that emerge as beneficiaries adapt to these constraints. Over time, managers may prefer designing projects with more conservative, less exploratory work plans, minimising the likelihood of scope revisions. During execution, the same mechanism can foster compliance-oriented strategies in which the initially approved plan is privileged over adaptive technical adjustments, even when those adjustments could improve efficiency or outcomes. In this way, the regulation shapes behaviour not only by constraining what can be changed, but also by shaping what managers consider “worth attempting” to change.
Notably, this mechanism also helps to explain why procedural constraints like response times and authorisation requirements are perceived as highly consequential: delays and uncertainty in administrative decision-making increase the transaction costs and perceived risk of requesting modifications, reinforcing the feedback pathway. Similarly, interpretive fragmentation across managing bodies amplifies uncertainty and makes expectations less predictable, which further strengthens anticipatory conservatism and reduces adaptive capacity at the system level.
Thus, considering that the regulatory framework, known as the “bases reguladoras”, is the document that defines the specific changes allowed in each funding programme, these documents provide reasonably flexible frameworks for processing changes in resources and execution deadlines, but not for changes in scope.
However, it is essential to note that flexibility has two dimensions. On one hand, flexibility refers to which specific aspects can be modified (teams, execution deadlines, projected expenses, etc.), and on the other hand, it refers to whether prior authorisation is required for changes. In such cases, depending on response times or the dates set in the regulations for requesting modifications, decision-making in the project can be conditioned or simply not aligned with the administrative timelines versus the operational timelines of the project’s execution.
The results obtained clearly indicate that R&D project managers face significant restrictions in managing changes due to the LGS. The general perception is that the regulation imposes rigidities that affect the capacity for adaptation and flexibility in the execution of these projects. The impact of the LGS on project management is widely recognised by the respondents, According to the results obtained, the most important constraints are those that both limit what can be changed and also increase the transaction costs and uncertainty of attempting to change it. The convergence between the survey patterns, the qualitative accounts, and the multicriteria prioritisation suggests that perceived rigidity is not a set of isolated administrative frictions, but an emergent property of the publicly funded R&D project management system. Importantly, constraints are interdependent: increased rigidity in one dimension tends to amplify limitations in others, reducing the overall degrees of freedom available to manage uncertainty during execution.
Another key aspect identified is the ability of managers to anticipate regulatory restrictions and their impact on the design and execution of projects. Regulatory considerations are incorporated early in the project lifecycle and shape managerial decision-making beyond formal compliance requirements. From an analytical perspective, this anticipatory behaviour can be interpreted as reflecting regulatory feedback effects, whereby previous experiences with change management constraints influence current project design choices and managerial strategies.
On the other hand, comparison with other funding models also highlights significant differences in regulatory flexibility. It is considered that projects funded by the European Commission offer greater flexibility in managing changes, underlining the widespread perception that national regulations impose stricter restrictions compared to the European regulatory framework. This comparison reinforces the interpretation that perceived rigidity is not inherent to public funding itself, but to the specific configuration of regulatory control mechanisms governing project implementation.
A high consensus was identified regarding the perception that scope and the administrative process are the most restrictive aspects of change management.
Moreover, differences in the application of the LGS across different managing bodies also create uncertainty in change management. These results show the lack of unified criteria in interpreting and applying the LGS, adding further complexity and uncertainty to change management in R&D projects. Beyond formal rules, perceived rigidity is reinforced by interpretive fragmentation across managing bodies. When similar modification requests are evaluated with heterogeneous criteria, predictability decreases and uncertainty increases. The qualitative evidence suggests that this fragmentation is intertwined with governance dynamics such as exposure to ex post reviews, perceived liability, and varying levels of guidance and interaction.
Accepting changes introduces a high level of uncertainty. These features matter because they create timeline misalignment between administrative decision cycles and operational R&D cycles. In practice, managers face a trade-off between implementing a technically justified change without certainty of eligibility or maintaining the approved plan despite new real conditions. This misalignment encourages conservative strategies that privilege compliance with the initial plan over adaptive optimisation during execution.
Also, there is moderate consensus that flexibility applied by a managing body in one project dimension may be associated with greater flexibility in other areas, reflecting the respondents’ perception that flexibility in change management is evaluated at the organisational level, recognising the interdependence between the different factors represented in the Iron Triangle.
There is a significant agreement in identifying changes in the project team as the element with the highest degree of perceived flexibility. In the hierarchical analysis, this variable received the lowest percentage weight, implying a perception of low relevance in terms of structural rigidity. Similarly, the descriptive analysis reinforces this interpretation, showing that this dimension received the highest scores in terms of flexibility, with a mean of 5.1 and a mode of 7. This dual evidence suggests that respondents consider changes in the team composition to be relatively easy to implement.
Finally, it is worth noting the case of the response time of the managing body to change requests, which emerges as a sensitive factor within the administrative component of the management process. This perception is also reflected in the descriptive analysis, placing it among the least flexible factors from the participants’ perspective. The consistency between both approaches suggests that delays in institutional response times constitute a perceived barrier of relevance in adaptation and change management processes within the project.
Thus, the findings from both methods allow us to conclude that, despite the diversity of analytical approaches employed, there is a strong correlation in the perception of the most and least flexible elements of the project, which provides greater internal validity to the research results.
The results obtained suggest that perceived rigidity mainly comes from how change requests are handled and tight scope boundaries. In the AHP, the administrative process is the top constraint, followed by scope. Within the administrative process, response time is the biggest issue. This matches the flexibility ranking, where scope is least flexible and response time comes next.
To connect recommendations more clearly to the evidence, they were grouped into two time horizons: short-term process fixes that can usually be done within current rules, and long-term institutional method design that would require broader changes. For each recommendation, the key evidences and how it is expected to help by making change requests easier and less risky were stated.
The short-term process fixes are as follows:
Set response-time targets and track requests openly: response time has the highest weight within the administrative process and ranks among the least flexible items. It reduces waiting risk and makes teams more willing to submit justified changes earlier.
Name one accountable contact person for change requests: more flexible bodies are described as having clear contact points and ongoing interaction. It reduces confusion and makes decisions more predictable.
Publish simple, standard guidance on acceptable changes: managers report uneven criteria and scope as the most rigid area. It improves predictability and helps distinguish low-risk adjustments from changes likely to be rejected.
Align calendars and make submission windows predictable: managers report deadline pressure and poor alignment between project needs and administrative timing. It reduces the risk of freezing workplans too early to avoid later problems.
In the long-term institutional process requries the following improvements:
Harmonization of change-acceptance criteria across managing bodies: managers report inconsistent criteria and call for harmonisation. It will reduce the dependence on calls and will improve risk-avoidance.
Development of an R&D-focused approach to managing changes in public projects. The study points to a lack of tailored methods for R&D under public funding. It would help to standardize how uncertainty, scope evolution, and deliverable updates are documented and reviewed.
Redesign instruments toward clearer, more results-focused control where suitable: the managers interwied describe EU programmes as more predictable and results-oriented. This approach keeps accountability while allowing needed adaptation in uncertain R&D work.
To synthesise these dynamics,
Figure 4 illustrates the causal pathway identified in this study. The framework clarifies how the specific regulatory design and its implementation generate distinct types of adaptive constraints like scope, procedural, and interpretive. These constraints do not merely limit action in the present, but also trigger a mechanism of regulatory feedback whereby project managers adopt anticipatory strategies such as defensive planning or risk avoidance. Therefore, these strategies condition the final change behaviour and the overall adaptability of the project, often leading to compliance-oriented rigidity rather than technical optimisation.
5. Conclusions
This study highlights how regulatory arrangements shape change management practices within publicly funded R&D project management systems. Conceptually, the study contributes an empirically grounded account of how adaptive constraints (scope-related, procedural, and interpretive) generate regulatory feedback pathways that shape managerial decision-making across project lifecycles. This framing clarifies why perceived rigidity is not merely an administrative burden but also a system mechanism that can reduce adaptive capacity and influence project ambition in publicly funded innovation environments. The coexistence of different rules and criteria governing project modifications, depending on the type of funding call, generates a perception of regulatory uncertainty among project managers. This uncertainty tends to foster conservative management approaches, in which beneficiaries prioritise compliance with the initially approved project plan over adaptive adjustments during execution, potentially limiting continuous improvement and the exploration of alternative technical solutions. Importantly, no clear and consistent differences were observed between technology-specialised and sector-specialised centres.
Based on these findings, the practical implications can be summarised in two horizons. First, a set of short-term process fixes like response-time governance, clearer points of contact, standardised admissibility guidance, and simplified amendment packages targets the administrative-process bottlenecks that dominate managers’ perceived rigidity. Second, long-term institutional and methodological design options like Project Officer–type, cross-body harmonisation of criteria, and R&D-specific change-management methodologies address structural sources of interpretive fragmentation and scope-boundary uncertainty. These recommendations are derived from the empirical patterns reported in the Results and synthesised in the Discussion.
The results of this study suggest that this problem related to change management, both due to the limitations on the changes that can be managed upfront and the different criteria applied by the managing bodies of grants for projects of similar nature, is specific to projects funded through grants regulated by the LGS (General Subsidies Law), and does not occur in other grants outside this regulatory framework. For example, such situations do not arise in grants awarded by the European Commission and, more specifically, in R&D grants under the Framework Programmes for R&D (most recently, Horizon 2020, which was in effect until 2020, and currently Horizon Europe). In these types of European grants, control mechanisms are equally rigorous, but there is close and continuous monitoring of the project throughout its execution by a Project Officer from the European Commission, in constant communication with the project coordinator, which facilitates the management of any changes. A similar situation occurs with R&D projects funded by CDTI, with its own budget, which is not affected by the General Subsidies Law. Here, the role of the so-called Technical Follow-up Officer facilitates the project’s progress monitoring, not only performing a fiscal control function but also providing guidance and helping manage necessary modifications as needs arise. From a system-level perspective, these observations point to the relevance of governance mechanisms that facilitate continuous interaction between funding bodies and project managers throughout the project lifecycle.
Several interviewees suggested that introducing a role similar to that of a Project Officer could potentially improve responsiveness to required changes in the initial project plan. This perception is aligned with the authors’ view, based on their own professional experience. However, the extent to which such a figure would enhance change-management flexibility under national regulatory frameworks (e.g., Spain’s LGS) remains an avenue for future research.
Another promising direction for future research is a comparative analysis between Spain’s General Subsidies Law (LGS) and public R&D grant regulations in other European countries. Focusing on countries with broadly comparable administrative complexity and policy traditions (e.g., Germany, France, or Italy) would help assess how alternative regulatory designs reconcile public expenditure control with the agility and adaptability required in scientific and technological environments.
Although insecurity affects all three vertices of the Iron Triangle (scope, resources, and timeline), it is especially pronounced regarding the request for modifications in aspects related to scope, such as objectives, deliverables, expected results, or task breakdowns. This leads to the definition of a project scope and work plan in the proposal phase, seeking a balance between specifying what will be done (an evaluable aspect) and allowing enough freedom to adjust the project at a technical level if necessary.
On the other hand, this same sense of insecurity leads, in the case of projects in execution, to an opportunity cost in terms of the possibility of achieving greater efficiency in their development, and in the case of projects still in the design phase, to a loss of ambition or disruption in the projects. These limitations not only affect the beneficiary but also the broader society, as they involve public funds applied to R&D activities, which are recognised as drivers of economic development and the wellbeing of nations.
In this regard, common rules and practices could be established for all managing bodies to apply to projects of the same type, specifically R&D projects. There are successful previous experiences in harmonising criteria in project management [
24]. One such example was the structure of information required in project proposals, which today follows a fairly uniform structure for all R&D projects, adapting to the framework set by the European Commission from Horizon 2020 (2014–2020), consisting of three phases: Excellence, Impact, and Implementation. Outside the R&D field, the public administration has also reached consensus on criteria for specific project cases, such as in the particular treatment of software projects in relation to the Public Sector Contracts Law (LCSP) [
56], or the simplification of administrative procedures recently promoted by the government to eliminate barriers in the management and execution of the Next Generation EU funds, through Law 36/2020, which approves urgent measures for the modernisation of public administration and for the implementation of the Recovery, Transformation, and Resilience Plan. In the authors’ opinion, while any change in administration is difficult and time-consuming, based on the results obtained in this study, it makes complete sense to propose, as a future line of research, further exploration into the influence of the regulatory constraints that apply to R&D projects funded through public aid programmes. Although this line of inquiry has attracted the interest of several authors, it has not been sufficiently studied. Additionally, this study also found that there are currently no specific project management methodologies for R&D projects carried out within the framework of a public funding programme. This opens up an interesting field of future work concerning methodological proposals to fill this identified gap.
Revisiting the purpose stated in the Introduction, this study set out to examine how constraints given by LGS affect management in publicly funded R&D projects and clarify the regulatory feedback mechanisms through which these constraints influence managerial behaviour across project lifecycles. This purpose was realised through the empirical analysis reported in the manuscript, combining expert interview evidence with a multicriteria prioritisation of constraint types. The study therefore provides both an evidence-based characterisation of where rigidity and uncertainty are most acutely perceived, especially regarding scope and the administrative process and an interpretive account of how these experiences are internalised into anticipatory strategies that can reduce adaptive capacity. The governance implications discussed are presented as actionable recommendations derived from the findings; their institutional implementation falls outside the scope of the present study and is proposed as a direction for future work.