Abstract
The EVM method is an essential project management technique that compares the work done to the planned values (PVs) to identify project variances. However, the inherent uncertainties and possibilities in the project introduce uncertainty in the input data. Despite this importance, the input data for this method is often considered deterministic in most research, and several researchers have modeled it under fuzzy information. In this research, we developed a novel approach using a combined model of fuzzy numbers and grey numbers called interval grey triangular fuzzy (IGTF) numbers. This model is designed to manage the project’s fuzzy grey value, addressing the two pillars of fuzzy and grey uncertainty. The findings of the study indicate that by combining the grey degree of confidence with the triangular fuzzy number (TFN), the results are closer to the real world and more lenient. Finally, based on the estimation of the actual final cost of the project, managers are encouraged to use certainty in lowering costs concerning the value obtained by using the Z-number for the phases of the project. This research provides practical insights and a new model for managing sustainable project uncertainties using fuzzy and grey theories, offering a potential solution to this challenge.
1. Introduction
Based on the project management body of knowledge standard, a project is a temporary effort to produce a unique product, service, or result. The project includes activities that must be carried out according to a specific time, cost, and quality. Exceeding any of the three main factors can lead to an unsuccessful or uneconomical project [1]. Using performance measurement tools and accurately evaluating project performance are among the success factors of the project. Project-oriented organizations always look for appropriate approaches to monitor progress and take corrective actions during all project phases. The EVM system is a tool that project managers can use to investigate this issue. EVM is a method that has been used since the 1960s when the US Department of Defense proposed a standard procedure to measure project performance. EVM is a systematic project management technique used to find variances by comparing the work done and the planned amount. The resulting value management examines the actual progress of a project by reviewing some often simple criteria, such as completed work, costs related to that work, and the total number of hours of use [2]. This system measures and evaluates the overall health of a project and acts as an early warning signal for the timely diagnosis of project problems or the use of project opportunities [2]. Also, the use of EVM for project time management reduced the chance of reaching the full potential of sustainable project management. This issue implies carrying out a project as efficiently as possible and minimizing different kinds of waste. In other words, the benefits of a sustainable EVM approach stretch beyond the project schedule control and include having less waste, reduced delivery costs, better use of resources and their skills, economies of mass production, etc. [3,4]. In addition, there are always uncertainties in the project, which, if not considered, will lead to the project’s failure. Therefore, using uncertainty approaches for more successful project management is inevitable in today’s project management world. There are many methods and tools, such as fuzzy and grey theories, to manage the effect of uncertainty on project performance and the resulting value. In this chapter, we will examine the basic concepts and theories that have been used to consider the uncertainty of projects. Also, the importance of the problem and research questions, as well as the structure of the thesis, will be presented in the rest of this chapter. It is crucial to emphasize the need to consider uncertainty in project management, as this is a pressing issue that can significantly impact the success of a project. The findings of this research provide a new model for managing project uncertainties using fuzzy and grey theories, offering a potential solution to this challenge.
According to studies in recent decades, the most popular term for any project is success. Project management has a critical role in contributing to the sustainable growth of organizations and society [5]. In general, an essential aspect of achieving success is performance measurement. The proverb that depicts the importance of performance measurement is that “unmanageable things are unmeasurable.” Evaluating the performance of a project during its life cycle is a suitable approach to create early warning signals that will trigger corrective actions when the project is at risk [6]. Project managers always seek appropriate tools and techniques for effective project management. Several methods, such as resulting scheduling (ES), Monte Carlo simulation, and earned duration management (EDM), have been proposed in project management texts. However, the most famous skill among them is EVM [7], and this system has been helping project managers achieve this goal for a long time [8].
Due to the unique characteristics of projects, there are always uncertainties surrounding project implementation. Despite the uncertainty of some factors of project activities, they have been considered specific in all the existing techniques of earned value (EV). Considering this uncertainty in the interpretations and calculations of the EVM not only helps in better measurement of the performance and progress of the project but also leads to the expansion of the application of the resulting value techniques in actual and uncertain conditions. Also, considering these uncertainties will lead to more stable economic conditions for organizations and bring projects closer to the real world. Therefore, we should include uncertainty in our results. Many approaches, including fuzzy sets and grey systems, have been used in research to deal with these uncertainties. Therefore, to consider the uncertainty in the factors of EVM, this research combines fuzzy sets and grey theories. Also, a comparison of the results obtained with fuzzy EVM will be presented.
The main objective is to apply the combined method of grey fuzzy resulting value management under sustainable project activities’ progress uncertainty to manage the uncertainty and better measure the projects’ performance.
Sub-goals are listed below:
- Expanding the application of the EV technique in real-world conditions;
- Creating more stable economic conditions for organizations, especially project-oriented organizations;
- Filling the existing research gap in the literature of EVM under conditions of uncertainty.
The organization of this paper is as follows:
In Section 2, a full review of the literature is given, including the research gap table to determine the potential research topics that need more focus. Section 3 provides the details of the research methodology, including the step-by-step procedure for implementing the proposed method in this paper. In Section 4, all results are provided with excellent insight into the comparative analysis of the results obtained and the Z-number. Finally, in Section 5, a deep discussion is given to reveal our novel findings and implications.
2. Literature Review
This section reviews previous studies related to the research topic, summarized in Table 1. Each row in the table represents a study (by author and year). At the same time, each column corresponds to a key concept, such as EVM, cash flow analysis, time–cost trade-offs, multi-criteria decision making, fuzzy/grey systems, and sustainability. Stars (*) indicate the concepts emphasized in each study. The table shows that topics like project cost and time control, uncertainty modelling, and decision making under complexity have received increasing attention, particularly in recent years. While classical models such as EVM and critical path methods are well-studied, newer research trends highlight the integration of fuzzy logic, risk analysis, and optimization techniques. However, areas like supply chain cost management and EDM with sustainability remain less explored, indicating potential gaps for future research.

Table 1.
Studies in a comparative form.
As a result of this literature review and paying attention to Table 1, we realized that the issue of value management, which was first discussed in 2000 in the project management body of knowledge, has been expanded over the years by various researchers, and the concepts and their calculations have been developed. In the following years, to improve the concepts of EVM and to combine the uncertain nature of projects with the components and parameters of EVM, the fuzzy and grey set theories were used to estimate more accurately and closer to the reality of the future state of the project under conditions of uncertainty. The mentioned theories have been applied in several types of research on various issues such as production control, cost–time trade-off issues, cost forecasting, project cash flow forecasting, time and cost performance control in complex projects, decision issues, multi-objectives, project selection, and many other cases. In addition, the combination of these two theories, the grey fuzzy forecasting model, can also benefit from less data volume for forecasting in various subjects, such as stock price forecasting in the stock market and electricity forecasting every month. Uncertainty prediction and other cases have been used. By reviewing the literature on the subject and considering the future research proposals of past studies, we found that the existing research gap in the studies of combining the uncertainty feature of real-life projects with the EVM technique is the combination of these two fuzzy and grey theories. The integration of the abovementioned theory has yet to be investigated and researched in managing the EV.
Based on the comparative Table 1 of prior studies, several research gaps can be listed as given below:
- Scarce Consideration of Sustainability and Uncertainty in Cost and Risk ManagementAlthough some studies address cost forecasting and risk management, there is a lack of comprehensive models that incorporate sustainability concerns and uncertainty in project planning. This issue is particularly relevant in dynamic environments where uncertainty significantly impacts decision making. This gap is evident in all reviewed studies except the study conducted by Moradi et al., 2017 [28] and Zaneldin and Ahmed, 2024.
- Limited Exploration of Heuristic Optimization in Project Portfolio SelectionProject portfolio selection appears in a handful of studies, but heuristic and optimization algorithms are not frequently applied to enhance decision making in this area. This subject suggests an opportunity to develop more efficient computational models for portfolio selection. This gap is evident in all reviewed studies except the study conducted by Amirian & Sahraeian.
- Underdeveloped Applications of EDMWhile EVM is widely studied, EDM remains underrepresented in the literature. The potential of EDM in improving project performance evaluation and forecasting remains an area for further investigation.
- Gap Analysis in Integrating Cash Flow Analysis with Project SchedulingSeveral studies focus on cash flow analysis or project scheduling separately, but few integrate the two. A holistic approach that considers cash flow constraints within project scheduling decisions could provide valuable insights for financial and operational planning. This gap is evident in all reviewed studies except the study conducted by Ali Mirnezami et al., 2020 [34].
- Minimal Use of Fuzzy and Grey System Models in Risk and Cost ForecastingTable 1 suggests that fuzzy logic and grey system models are applied sporadically in project cost forecasting and risk management. A systematic approach integrating these methods could improve predictive accuracy in complex projects. This gap is evident in all the articles reviewed.
- Lack of Research on the Interaction Between Critical Chain and Uncertainty ManagementCritical Chain Project Management (CCPM) is covered in some studies, but its interaction with uncertainty and risk modeling remains relatively unexplored. Developing frameworks that combine these approaches could enhance project resilience. This gap is also evident in all the articles reviewed.
In this paper, we have worked on items number 2 and 6 using advanced modeling.
3. Research Methodology Process
3.1. Statement of the Research Problem
As stated earlier, a lot of projects have unknown situations. For example, the daily drilling required for oil and gas projects is undisclosed. As a result, the progress of the work is also expressed with uncertainty and with the help of linguistic terms (LTs) such as very bad, almost good, etc. There is a challenge regarding these LTs used in the development statement: “What is the confidence level of the assigned linguistic term?” Reliability is an essential issue in this field. This idea led to modeling the inaccuracy in evaluating the progress of activities and the judgment reliability used in progress assessment. Due to the uncertainty in determining these two components (progress and reliability of expert judgment) by an expert in reality, grey and fuzzy theories are combined. In this way, the first component (progress) is defined by a fuzzy number and has a membership function. The second component (reliability) expresses confidence in the progress in grey.
The first part (TFN) and the second part (Interval grey number) of are not dependent. Grey and fuzzy data represent the uncertain data. In order to describe the concept of IGTF number, the following terms are shown as examples that can convey judgments:
- (Sure, very good: real progress)
Since project cost and time forecasting are susceptible to budget and time constraints, IGTF numbers are recommended for cost–time analysis. Also, grey-fuzzy EVM based on IGTF numbers uniquely considers uncertainties and probabilities simultaneously. It uses fuzzy and subjective sets with grey probability and confidence levels, which are more similar to real-world data. It is thus summarized that the reason behind choosing IGTF comes from both the literature review (published papers in this area) and practical situations in project and operations management, which is an extension of the three-case scenario, called most likely, optimistic, and optimistic cases.
In the proposed calculation of Grey Fuzzy EVM, which we call GF-EVM for short, the first component is related to the fuzzy image of LTs, and the second component expresses the confidence degree of the first part. It is expressed with grey LTs. As a result of the above explanations, in describing the uncertainty components of the project, such as the actual progress of the activity, the opinion of the decision-maker and expert is expressed using the relevant LTs. However, the expressions “high” and “probable” used in the first and second parts are LTs and are not directly mentioned as Interval triangular grey fuzzy number components. Therefore, Table 2 and Table 3 can transfer LTs to fuzzy and grey numbers.
Table 2.
Terminology of triangular fuzzy membership function to determine the actual progress.
Table 3.
Grey verbal terms to determine the degree of confidence.
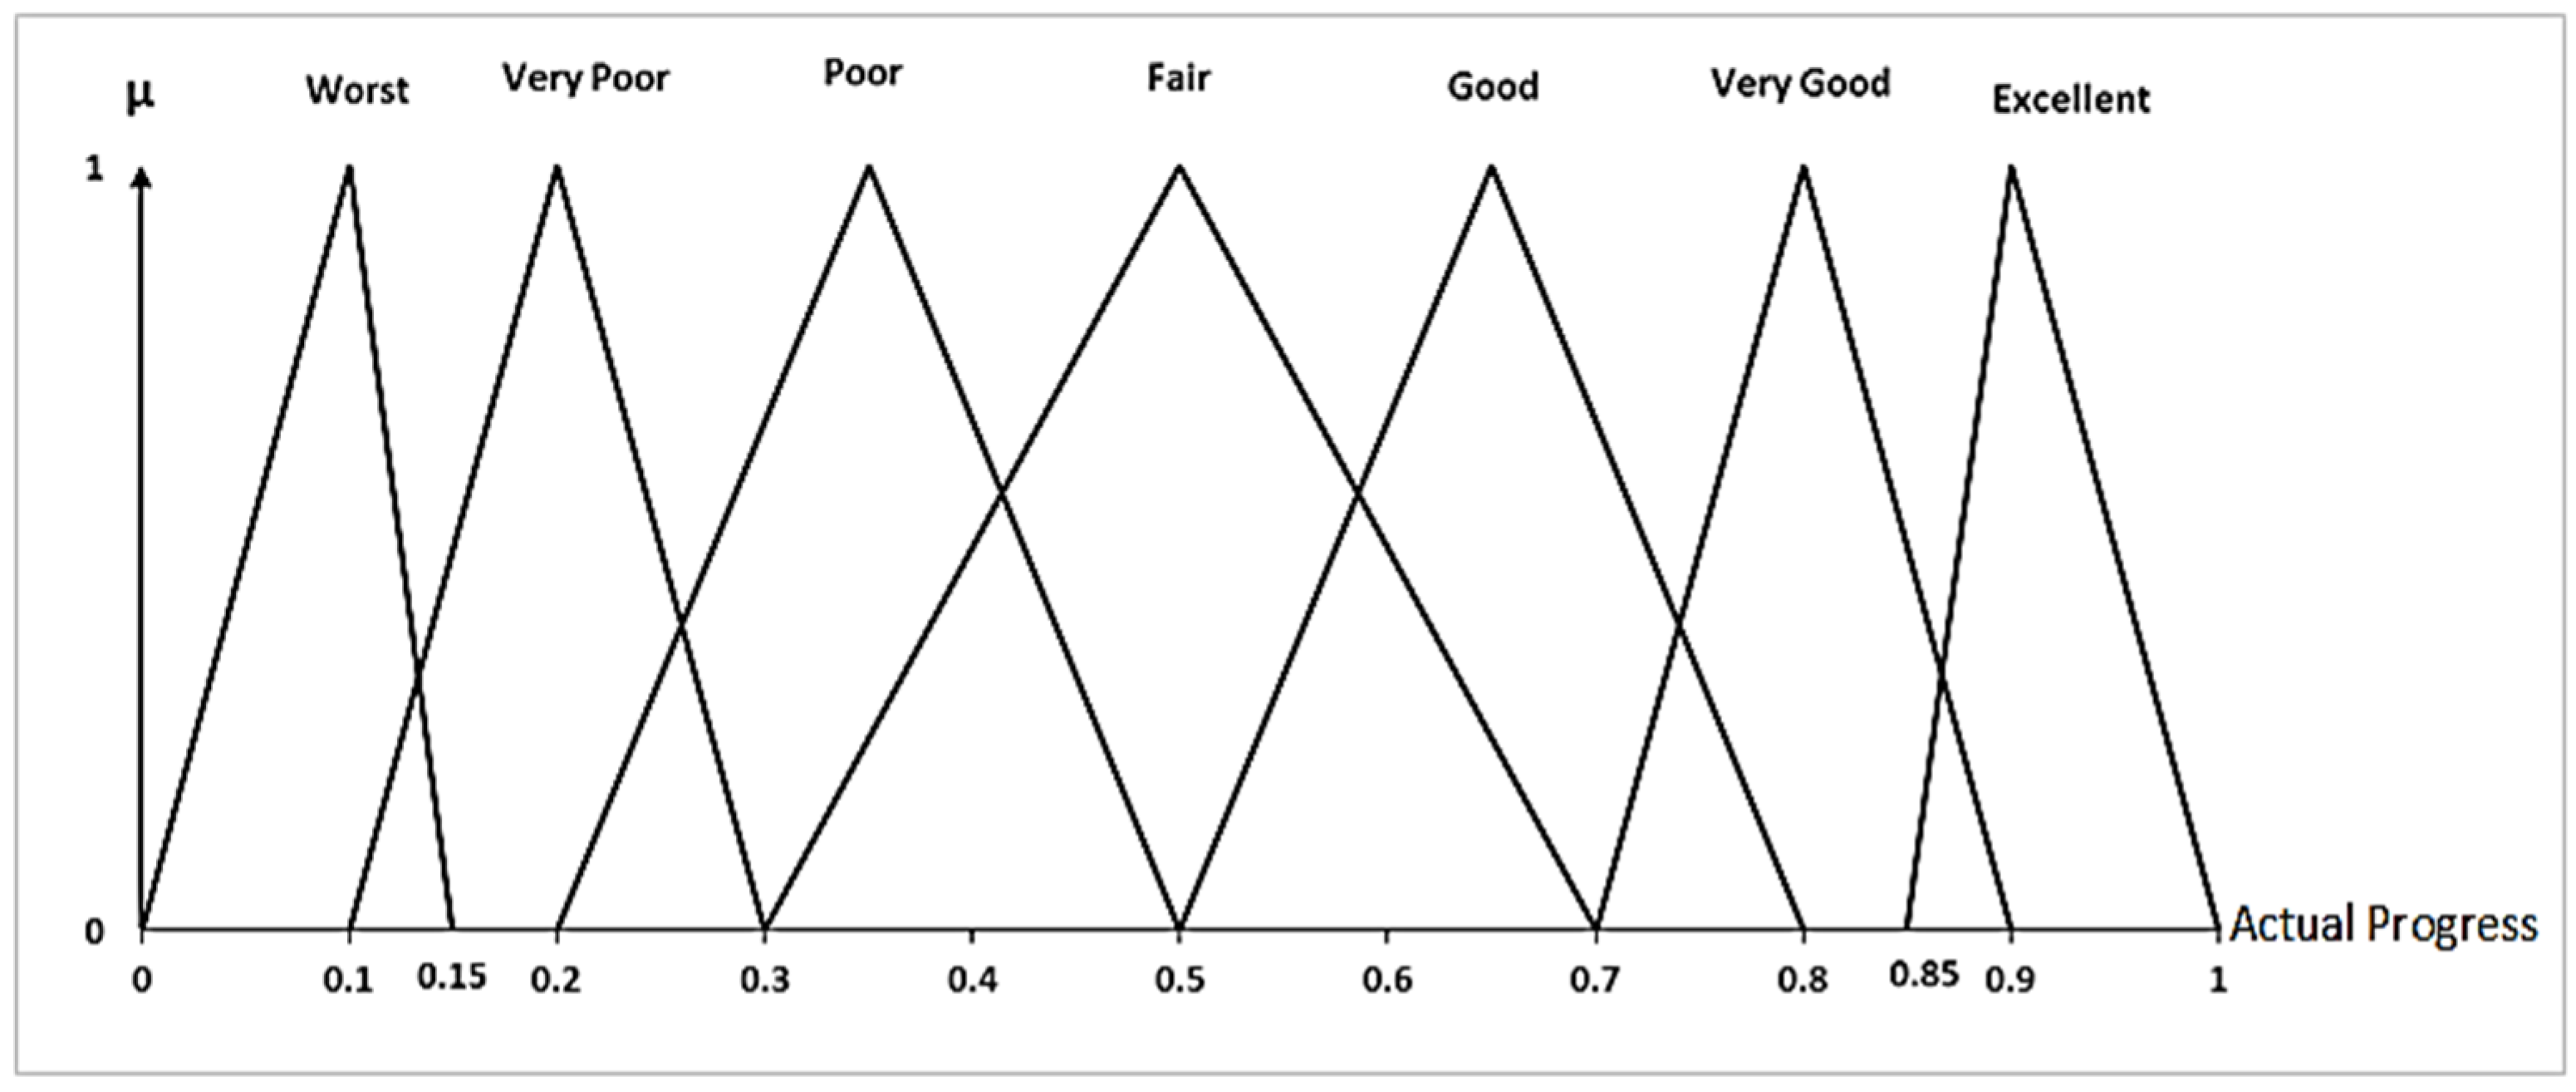
Table 2 presents the linguistic terms (LTs) used to describe actual progress levels, along with their corresponding TFNs. These values enable the conversion of qualitative assessments into quantitative fuzzy inputs for further analysis. Also, Table 3 maps linguistic terms to grey probability intervals to represent different levels of confidence. These intervals are used to quantify uncertainty in expert judgments during project performance evaluation.
The membership function is presented in Figure 1.
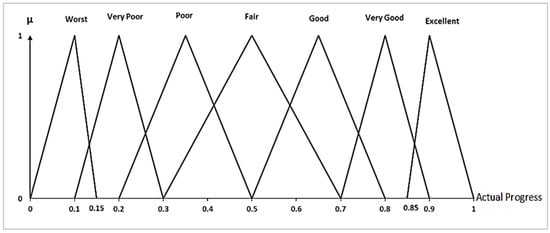
Figure 1.
Fuzzy membership, including TFNs and related verbal terms.
Algebraic operations in IGTF numbers
According to Yin et al.’s definition [44], considering that there are two IGTF numbers, the operators between these two numbers are defined as follows. The algebraic formulas of IGTF numbers will be used to model grey and fuzzy EVM. Below, the relevant standard operations are given:
Features of the grey-fuzzy earned value model:
The progress or duration of project activities is always accompanied by uncertainty, which might be due to various reasons, such as delays in the supply of materials and reworking of activities. Here, we consider the activities’ progress by merging with verbal and mental probabilities as IGTF numbers. It is applied to remodel the EVM indicators. The parameters of the presented model are defined in Table 4. It should be noted that the signs on each parameter mean that the corresponding parameter is modeled using IGTF numbers. For example, it means the total value of the fuzzy triangular grey interval (Table 4).
Table 4.
The parameters of the presented research model.
3.2. Research Assumptions, Limitations, and Hypotheses
The following assumptions and limitations are considered in modeling the value management of the fuzzy grey EVM model:
- As we learned in the drilling project example, in some projects, the value of an operation cannot be measured, so real progress cannot be assigned to it. Therefore, in this study, it is supposed that the project includes uncertainty about the progress of the activities. In this way, the expert cannot express the exact amount of progress of the action and represent the amount of progress with LTs.
- The model assumes that a triangular fuzzy membership function represents the progress of an activity. This function converts the linguistic term ‘Yashraft’ into a numerical value, facilitating its formula use. The choice of the triangular fuzzy function is driven by the need to create a common ground for comparing the fuzzy and grey combination model with the EV model of Z-numbers. Notably, the triangular fuzzy function has been widely used in various research types, including Hendiani’s article [3], to allocate to real progress.
- Another hypothesis is grey uncertainty in the expert’s degree of confidence in commenting on the level of progress. In this way, he expresses his opinion about the activity’s progress with words like sure, most likely, etc.
- Since the expert cannot express a specific percentage or probability of his opinion, uncertainty surrounds the project to a large extent. Grey uncertainty is shown using a grey number in the interval between zero and one so that the expert can determine the degree of confidence in a grey interval.
- Our limitation in this research is that we consider planned value and actual costs deterministically. Indeed, it was possible to assume grey planned value; however, according to the expert’s judgement and the project manager’s opinion, it was decided to consider it as is. Regarding the actual costs, it is worth mentioning that they should have been calculated deterministically according to accounting ledgers, as expenses incurred for every single project can be measured according to the actual data collected at the end of each cut-off date.
Research hypotheses:
- 1-
- Uncertain conditions need a fuzzy, grey system or a combination of the existing models. It is not possible to use deterministic models in uncertain circumstances.
- 2-
- In EVM, the most difficult parameters that need to be analyzed in uncertain conditions are progress and earned value. Those have a significant impact on the project metric and control system.
- 3-
- ETC, EAC, and all forecasting parameters need substantial data collection and analysis using EVM metrics such as SPI, CPI, etc.
3.3. Research Methodology
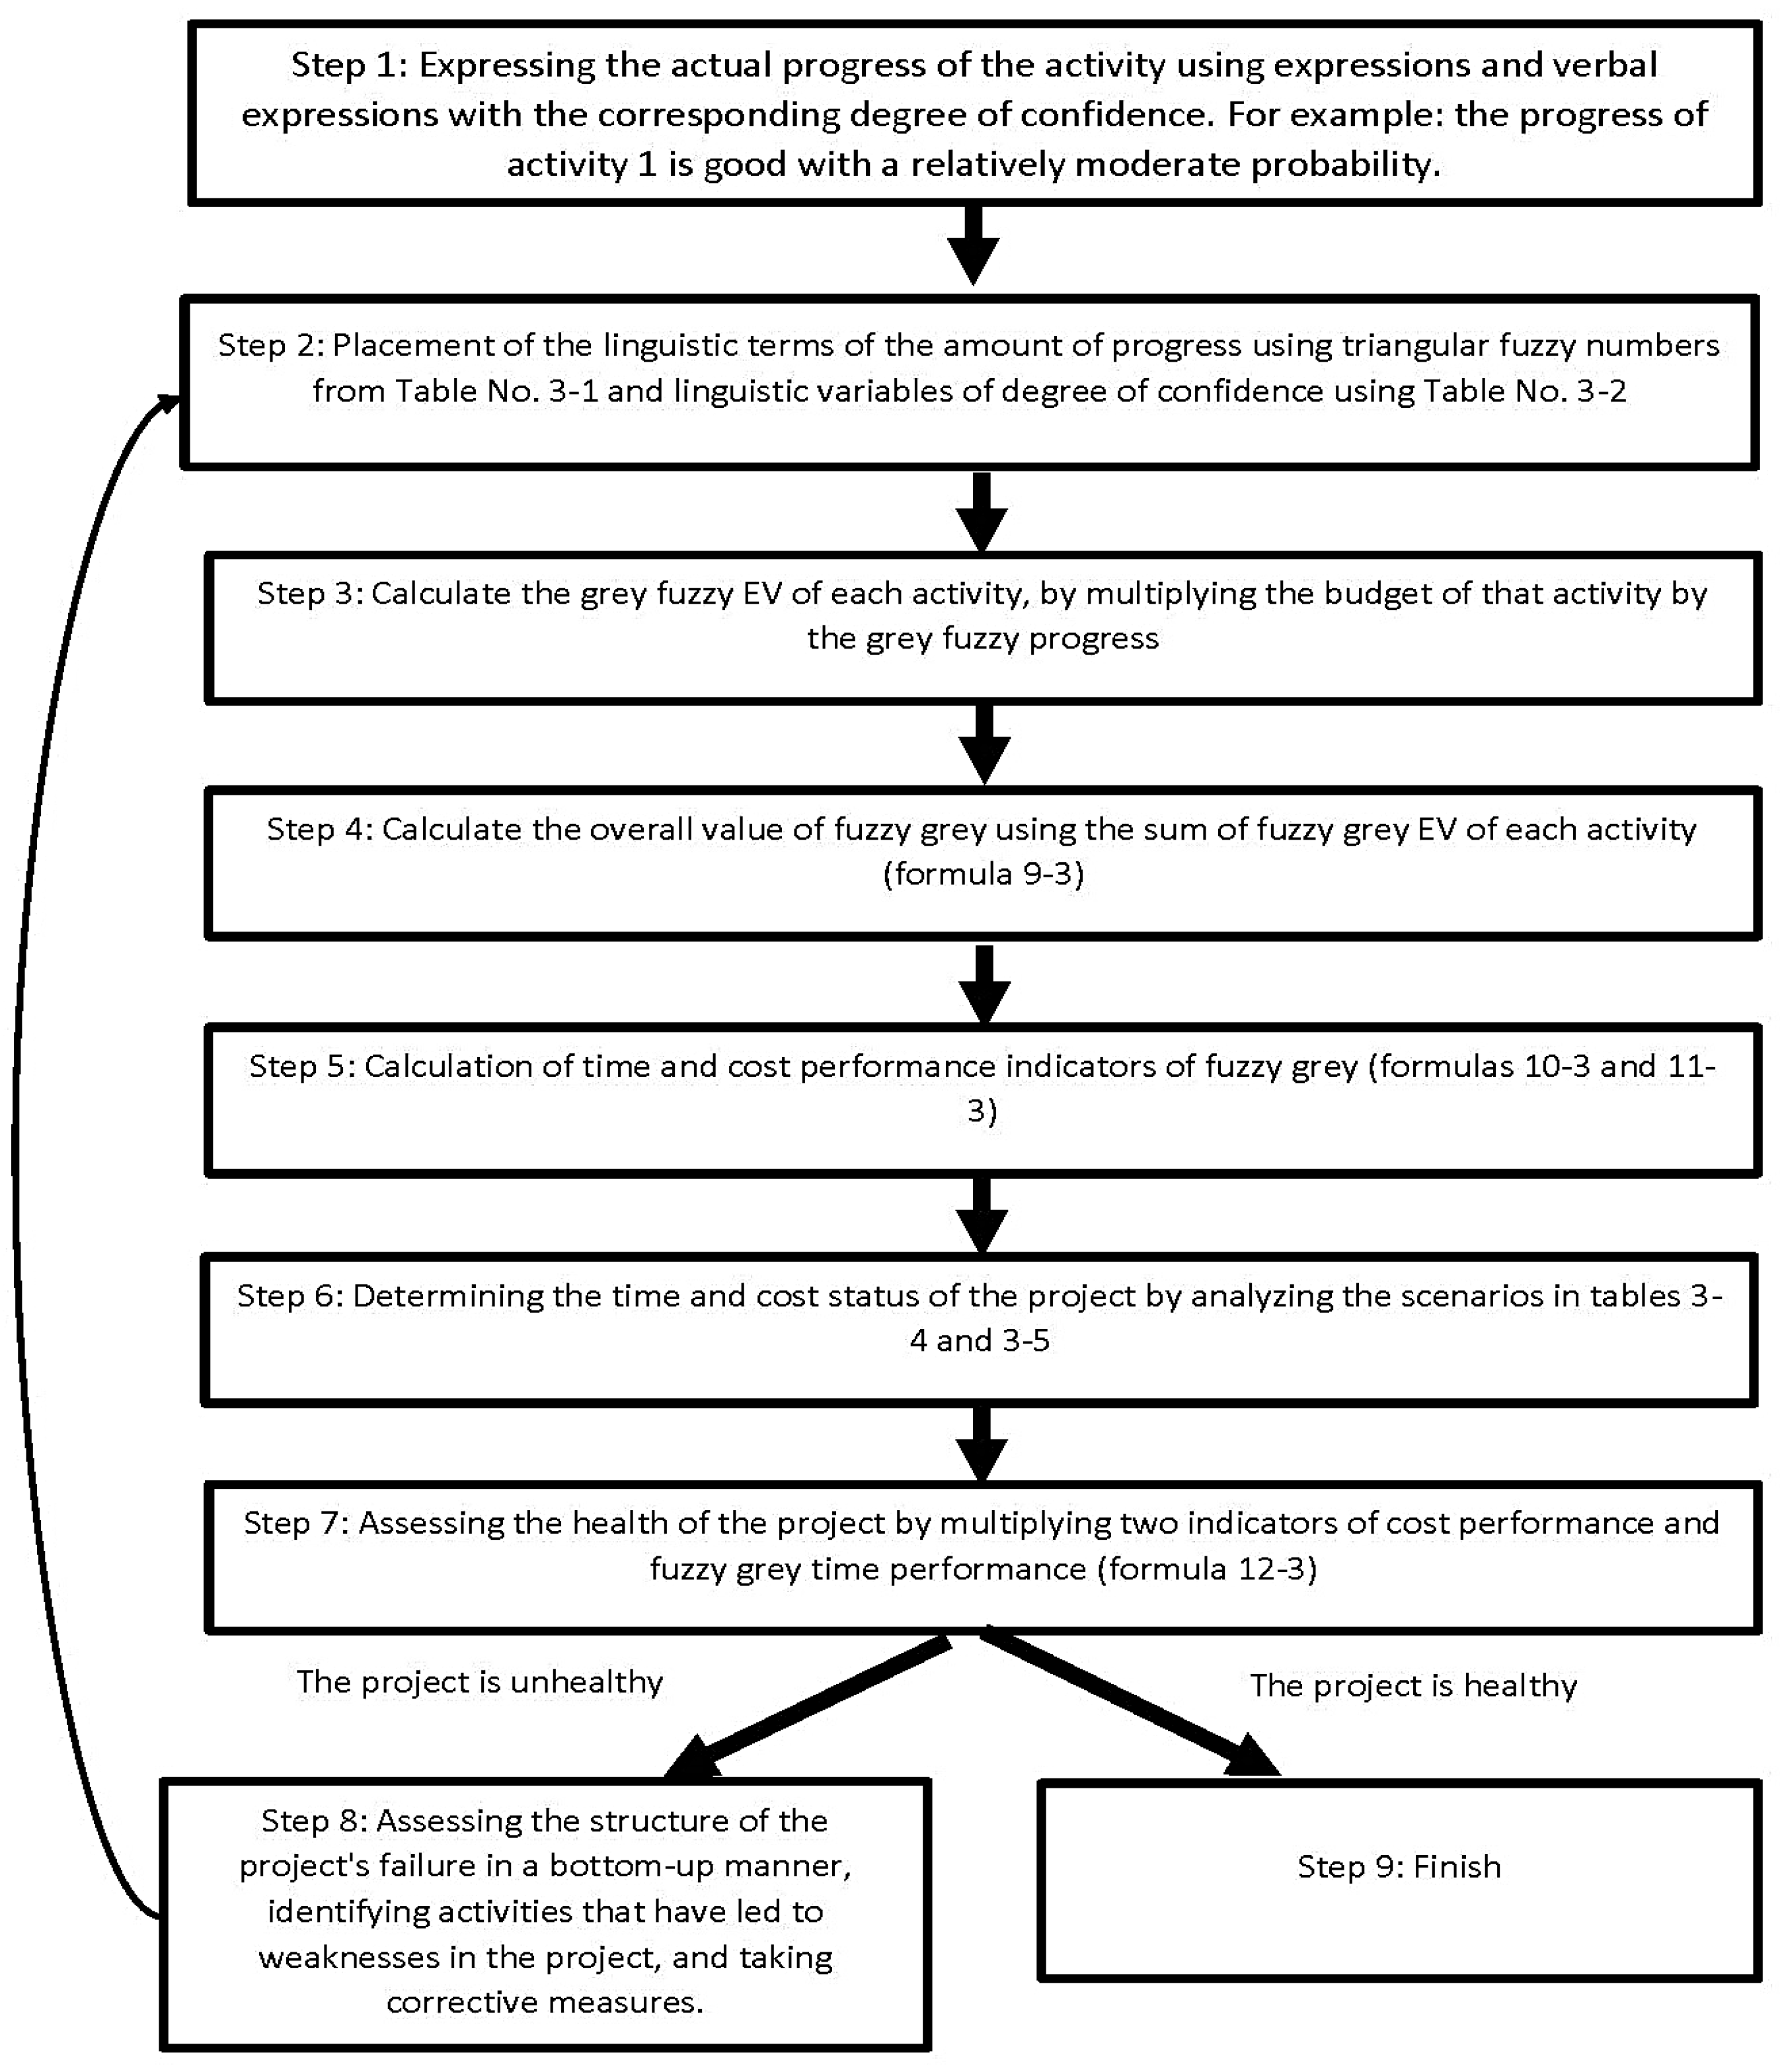
Before starting to model the EV of fuzzy grey model, we will outline the path ahead in the modeling. As can be seen in the flowchart, there are eight steps in the fuzzy grey EVM model, which starts with expressing the progress of the activity and the degree of confidence, and finally evaluates the project’s health and, if there are defects, takes corrective measures. The critical point in the first and second steps is correctly placing verbal values with IGTF numbers introduced by Yin et al. [45] using Table 2 and Table 3. After converting the LTs into IGTF numbers, we will start modeling the management of the earned fuzzy grey value, which we will show in detail with its formulas. At the end, Figure 2 illustrates the structure of the proposed Fuzzy Grey EVM model. It integrates fuzzy logic and grey theory to handle uncertainty and enhance project performance evaluation. In this figure:
Step 1: Describe the progress of each activity using verbal terms and confidence levels.
Step 2: Convert verbal expressions to triangular fuzzy numbers and confidence levels to linguistic variables.
Step 3: Calculate the fuzzy grey EV of each activity by multiplying its budget by the fuzzy grey progress.
Step 4: Sum all activity EVs to obtain the total fuzzy grey EV.
Step 5: Compute fuzzy grey cost and time performance indicators.
Step 6: Determine the project’s time and cost status based on scenario analysis.
Step 7: Evaluate project health by combining the cost and time indicators.
Step 8: Identify root causes and suggest corrective actions.
Step 9: End
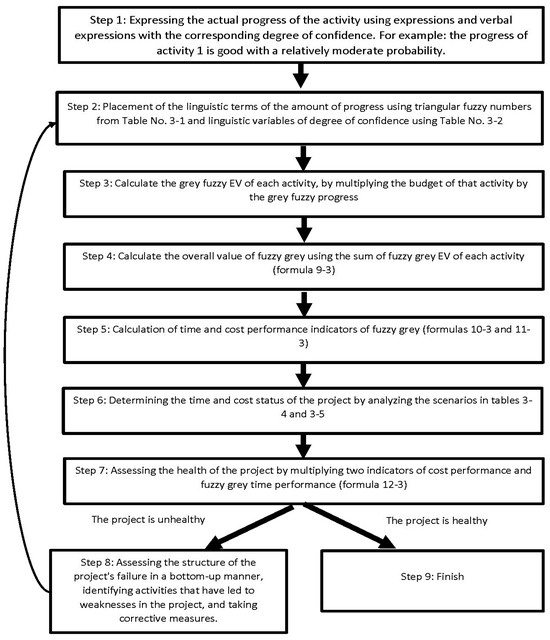
Figure 2.
Fuzzy grey EVM model flowchart.
Figure 2.
Fuzzy grey EVM model flowchart.
The EV of each activity, which is equal to the budget for the work done at a certain point in time, is obtained by multiplying the actual progress in the budget of that activity. In the fuzzy grey resulting value model, an actual progress number is an IGTF number whose progress value and degree of confidence have been converted into an IGTF number. Below, the mathematical formulations for SPI, CPI, and EAC under IGTF are presented, in addition to Equation (8) derived from classical EVM. Here, EV is modeled as an IGTF number (Interval Grey Triangular Fuzzy), allowing the expression of uncertainty in project progress. Also, Equation (9) is from classical EVM. EV is expressed with uncertainty using IGTF, while AC is considered deterministic:
The critical index of the IGTF number is the project’s product and shows its health. This amount is calculated using the following formula. Also, this formula is an integrated indicator of project health. Both SPI and CPI are expressed as IGTF numbers, allowing for uncertainty representation:
Among the various formulas used to obtain the estimate at completion, assuming that the cost performance index is constant throughout the project is equivalent to dividing the budget by the cost performance index. Since in this model, the cost performance index is an IGTF number, EAC is represented by and is equal to:
In Equation (11), the standard EVM forecasting formula is presented. With CPI as an IGTF number, EAC also incorporates uncertainty. Another formula calculates time performance and current cost indicators. More costs should be considered if a project is not performing well in terms of schedule and cost performance. The reason for this increase in costs is the potential increase in time or speed of work to complete the project on time:
This alternative approach to estimating EAC adds actual cost (AC) to the estimate to complete (ETC), both of which are possibly uncertain. The performance index until the completion time is calculated based on the IGTF number using the following formula:
This equation is derived from classical EVM. EV is modeled using IGTF; AC and BAC are crisp values. Also, the estimate until completion is based on the IGTF number, using the estimate at the time of completion based on the IGTF number, and the definite value of the Actual Cost (AC) is obtained:
ETC reflects the remaining cost, calculated from the IGTF-modeled EAC and crisp AC. After calculating the EVM method indicators, several scenarios have been presented for the cost and schedule performance indicators (Table 5 and Table 6). These scenarios help determine the project’s current status, providing a comprehensive view of the project’s performance.
Table 5.
The scenarios of cost performance index evaluation.
Table 6.
The scenarios of schedule performance index evaluation.
The project health status is shown in Table 7. As it is always important to analyze EVM indexes correctly, this paper presents a new terminology for the interpretation of the cost and schedule performances.
Table 7.
Project health status.
4. The Obtained Results
In this section, a real-world numerical example is solved using the proposed approach to clarify the case by GF-EVM and compare it with ZEVM. The results are compared to show the superiority of GF-EVM. The case study in [3] is related to one of the largest equipment manufacturers of manufacturing companies, which is carrying out various projects such as the provision of pipes, armatures, columns, etc. This company has different project teams. This study is related to the construction of distillation towers, which have three phases: engineering, procurement, and construction. Each phase contains several activities. The project is in progress and is planned to be performed in 9 months. The engineering department experts obtained the information on each stage based on data from previous projects. These three phases start simultaneously and continuously. For each phase, the initial values of the PV and the budget at the time of completion are estimated based on the plant capacity, total price, access to resources, and other factors. The PV and AC for the three project phases are shown in Table 8.
Table 8.
The PV and AC for the three project phases.
Table 9 specifies the budget at completion (BAC) time for each unit related to different phases. Each activity’s progress is defined based on Table 1 and Table 2, based on experts’ ideas using fuzzy and grey numbers and relevant language terms. On the left side of Table 8, we can see the conversion of LTs into TFNs and the grey interval for solving by the fuzzy grey model. On the right side of Table 9, we can see the conversion of terms into numbers for solving using Hendiani’s Z model. In the following, to solve the problem, we have used the Z-numbers in the Indian article to compare these two methods. The reader is referred to the article mentioned to learn to solve the problem with the Z-number method.
Table 9.
Budget and LTs assigned to activities.
In Table 10, the activities’ progress rates, estimated by the approaches (IGTF number and Z-number), are multiplied by the corresponding BAC to calculate the resulting value of the first phase activities. The sum is the total amount equal to the project phase’s total value. We explain the solution of row 1 as an example. According to the information on project activities, activity 1 of phase 1 of the project is subject to a cost of USD 13,121. Also, from the point of view of the project expert, the level of progress of this activity has been assessed with a low (L) or very poor (VP) degree of confidence. First of all, using Table 1 and Table 2, we convert the verbal expressions of the project expert into an interval-like grey fuzzy number, which is equal to ((0.1,0.2,0.3), [0.7,0.9]). Now, this fuzzy grey number is used to calculate the resulting fuzzy grey value. The fixed budget for activity one is multiplied by the IGTF number in Equation (15) to calculate the resulting value.
Table 10.
Calculation and of the activities of Phase 1.
In addition, in order to compare the model of this research with the fuzzy EV model using Z-numbers, the last two columns of the table have been used from the model mentioned by Hendiani et al. [3]. In this method, the expert expresses his opinion about the project’s progress with a number, both of which are TFNs. In the model of the EV of the number Z, this number is converted into a TFN using the component for ease of calculation. This component is equal to a TFN.
In Table 11, the activities’ progress rates estimated by the approaches (interval grey triangular phase number and Z-number) have been multiplied in the corresponding BAC to calculate the resulting value of the activities of the second phase. The sum of these gives us the total value (the total value of the result of phase 2).
Table 11.
Calculation and of the activities of Phase 2.
Table 12 calculates the resulting value of the third phase’s activities and the consequent value of the entire third phase.
Table 12.
Calculation and of activities of Phase 3.
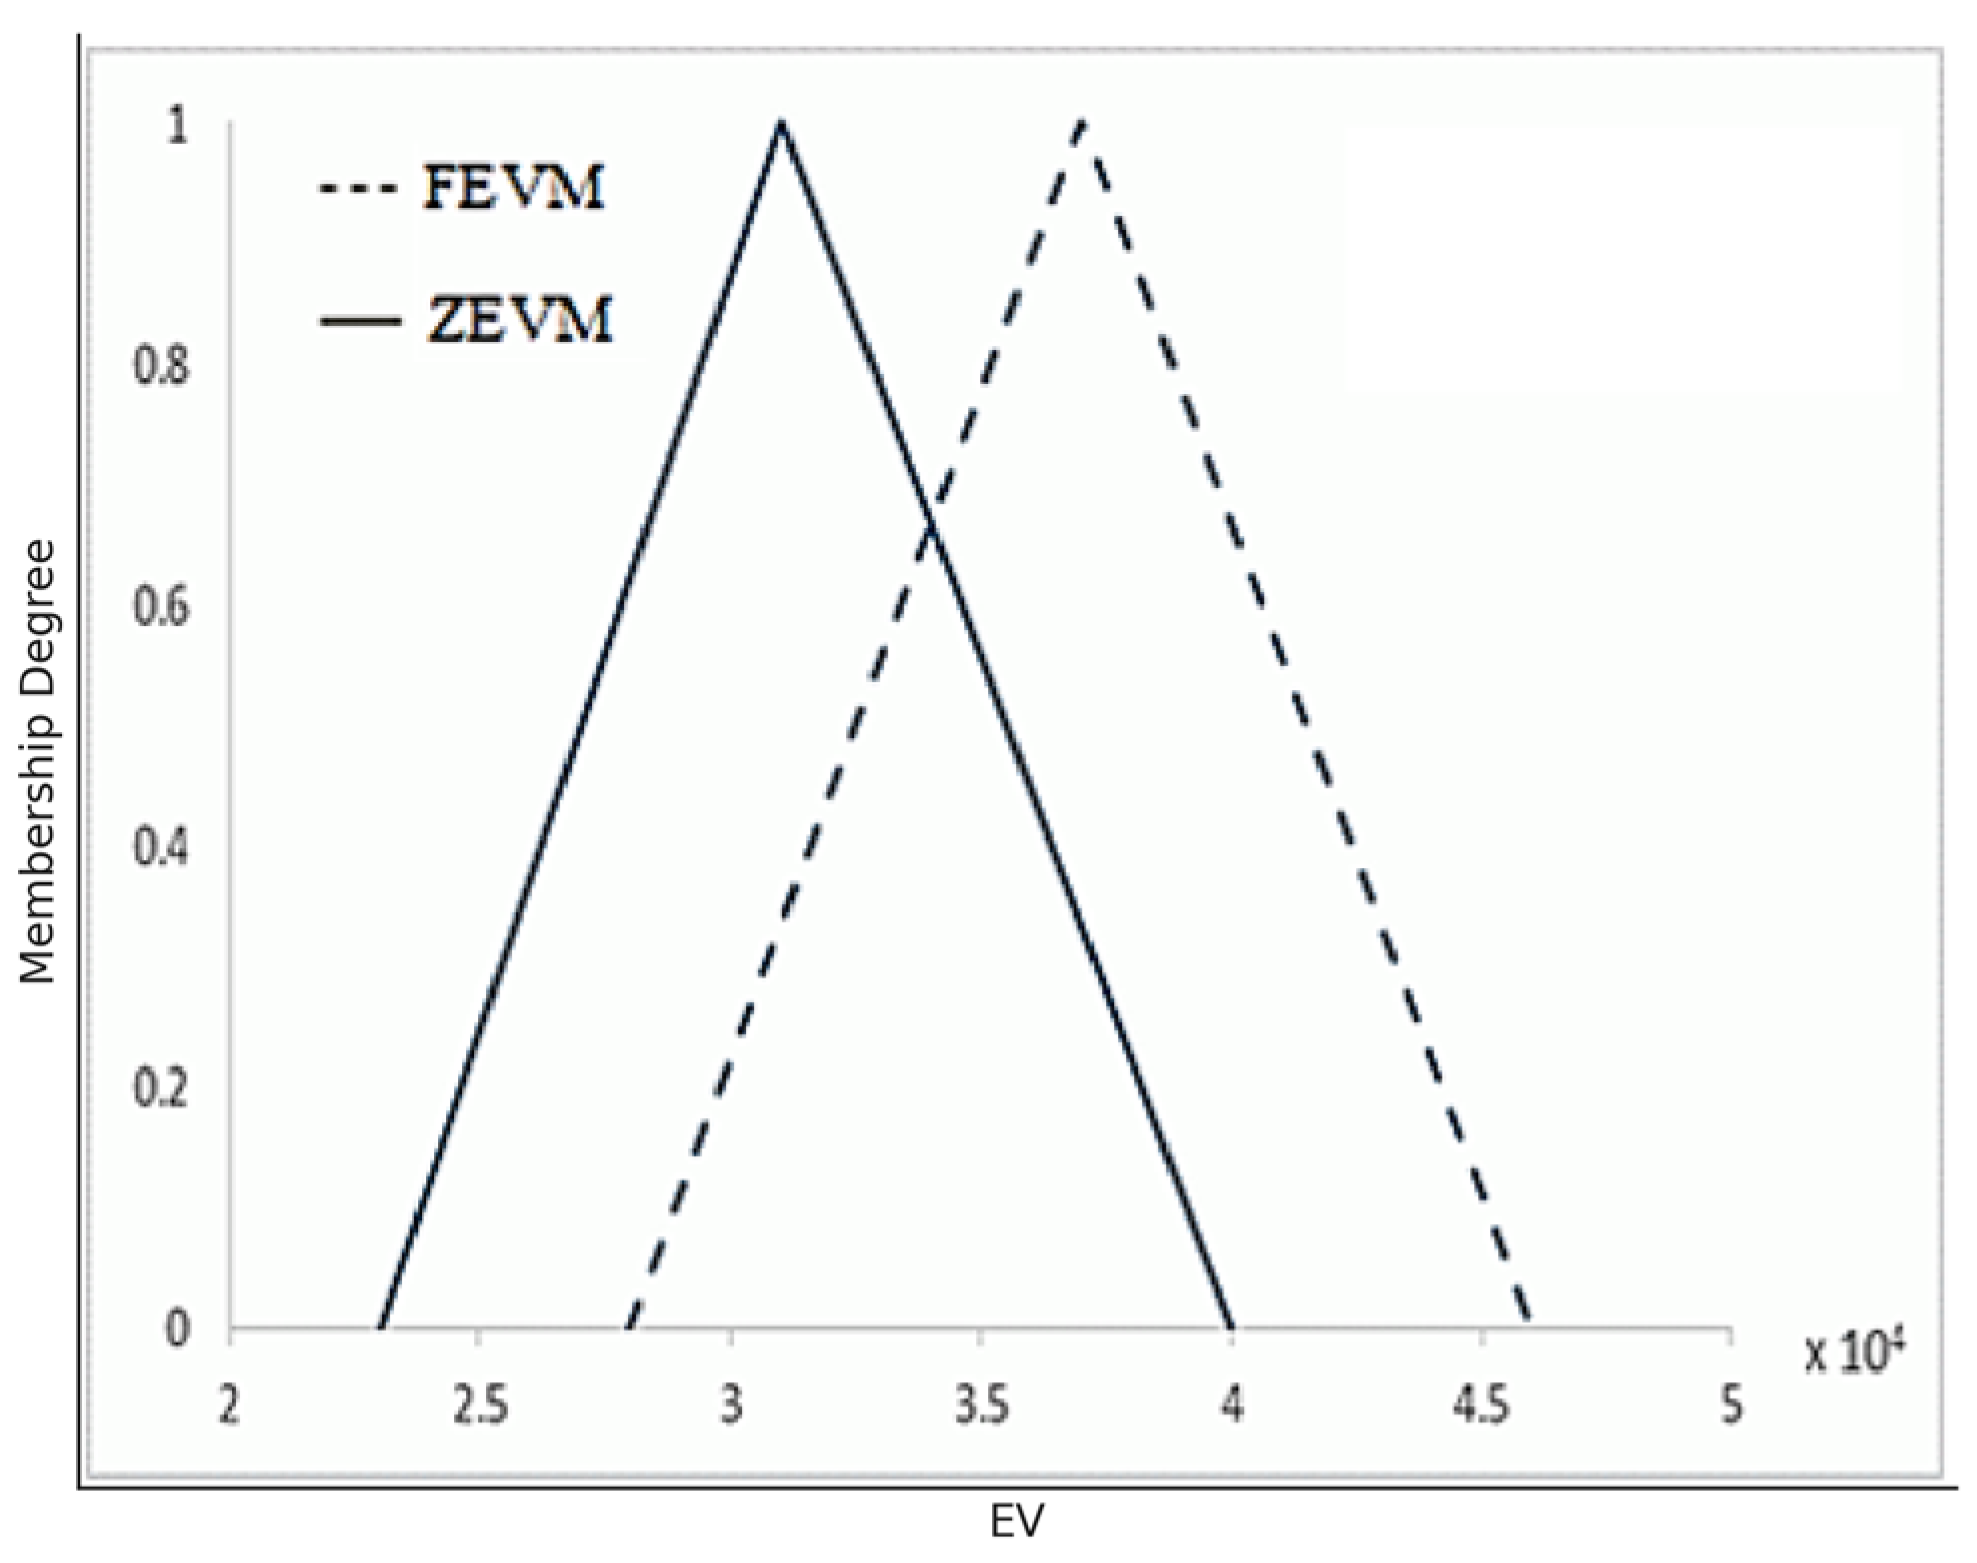
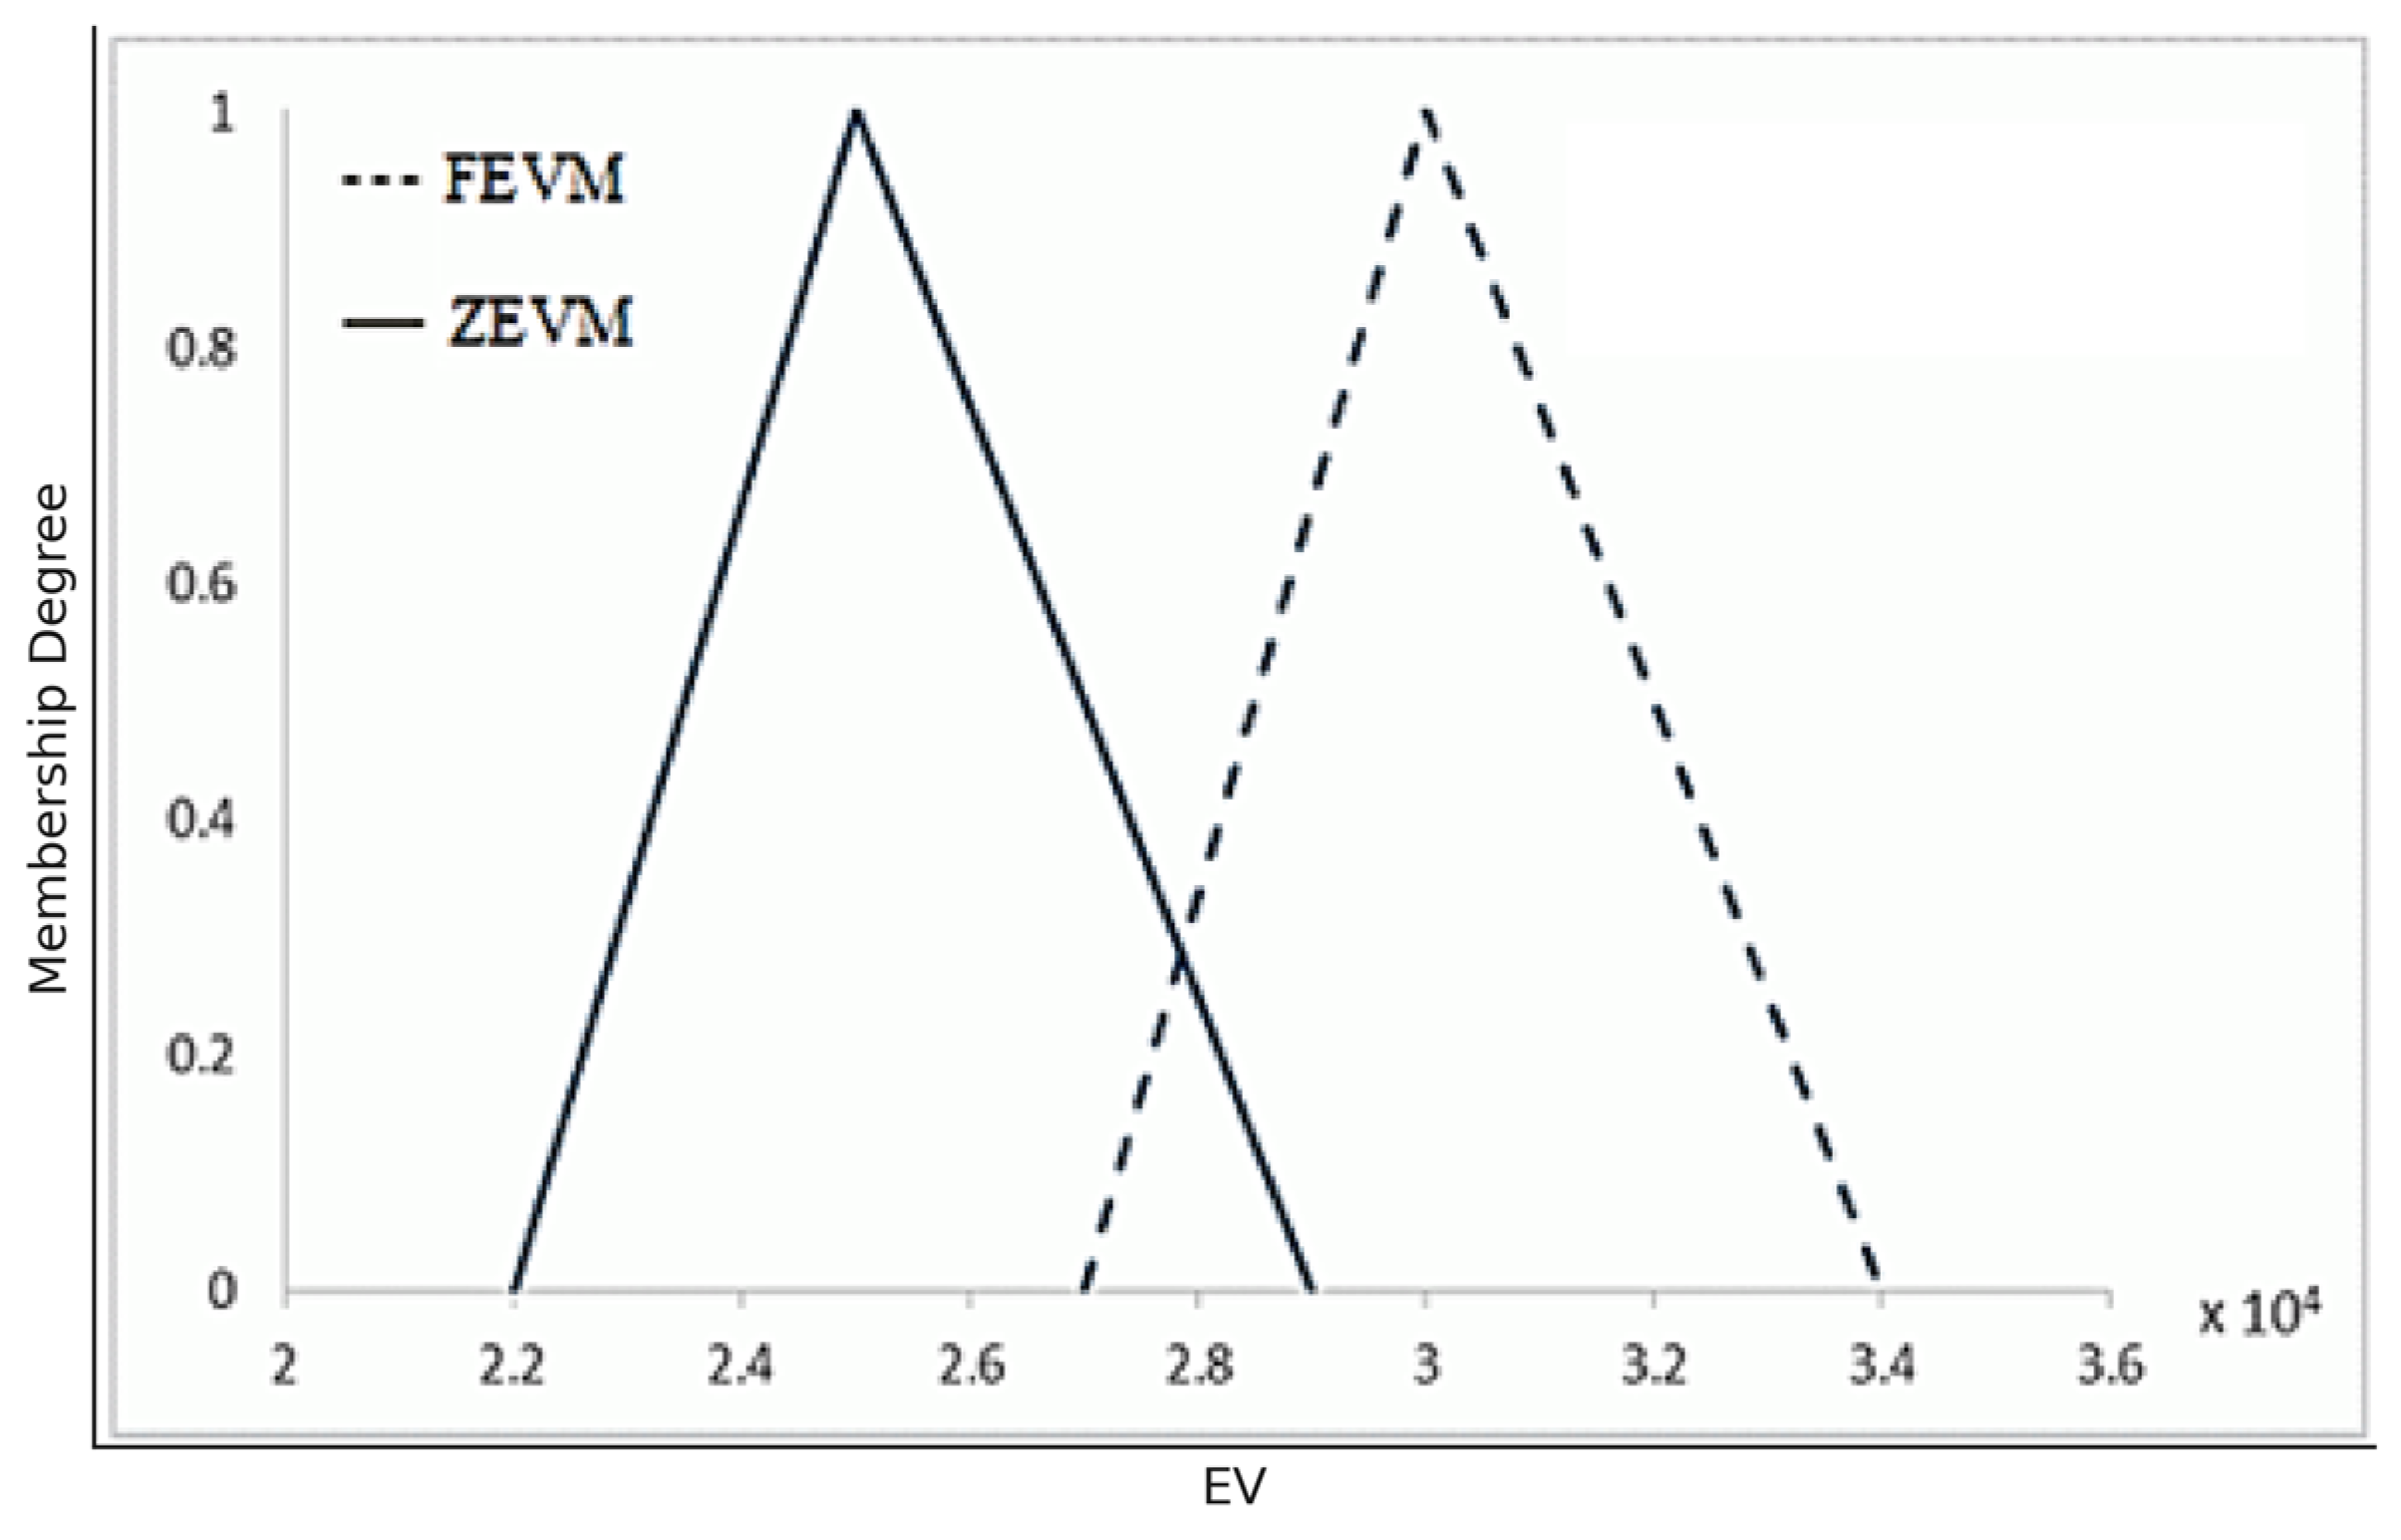
The difference between each EV based on the interval grey triangular phase number and the EV based on the Z-number is shown in the image below. Note that each diagram has two types of lines; the dashed line is the indicator, and the line is the indicator. As you can see, the values of the earned grey fuzzy value are more significant than those of the EV based on Z-numbers.
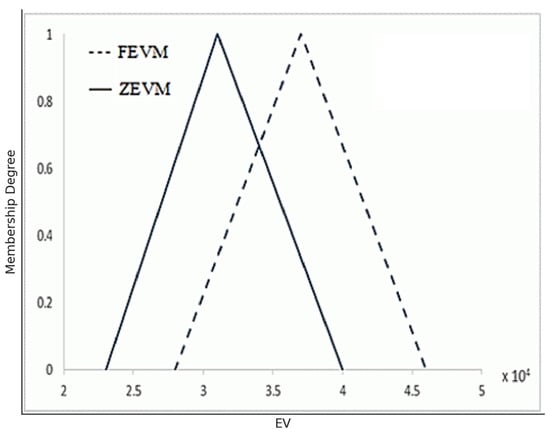
Figure 3.
EV of phase 1.
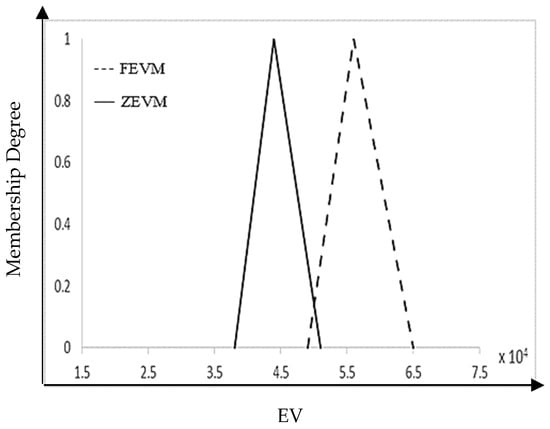
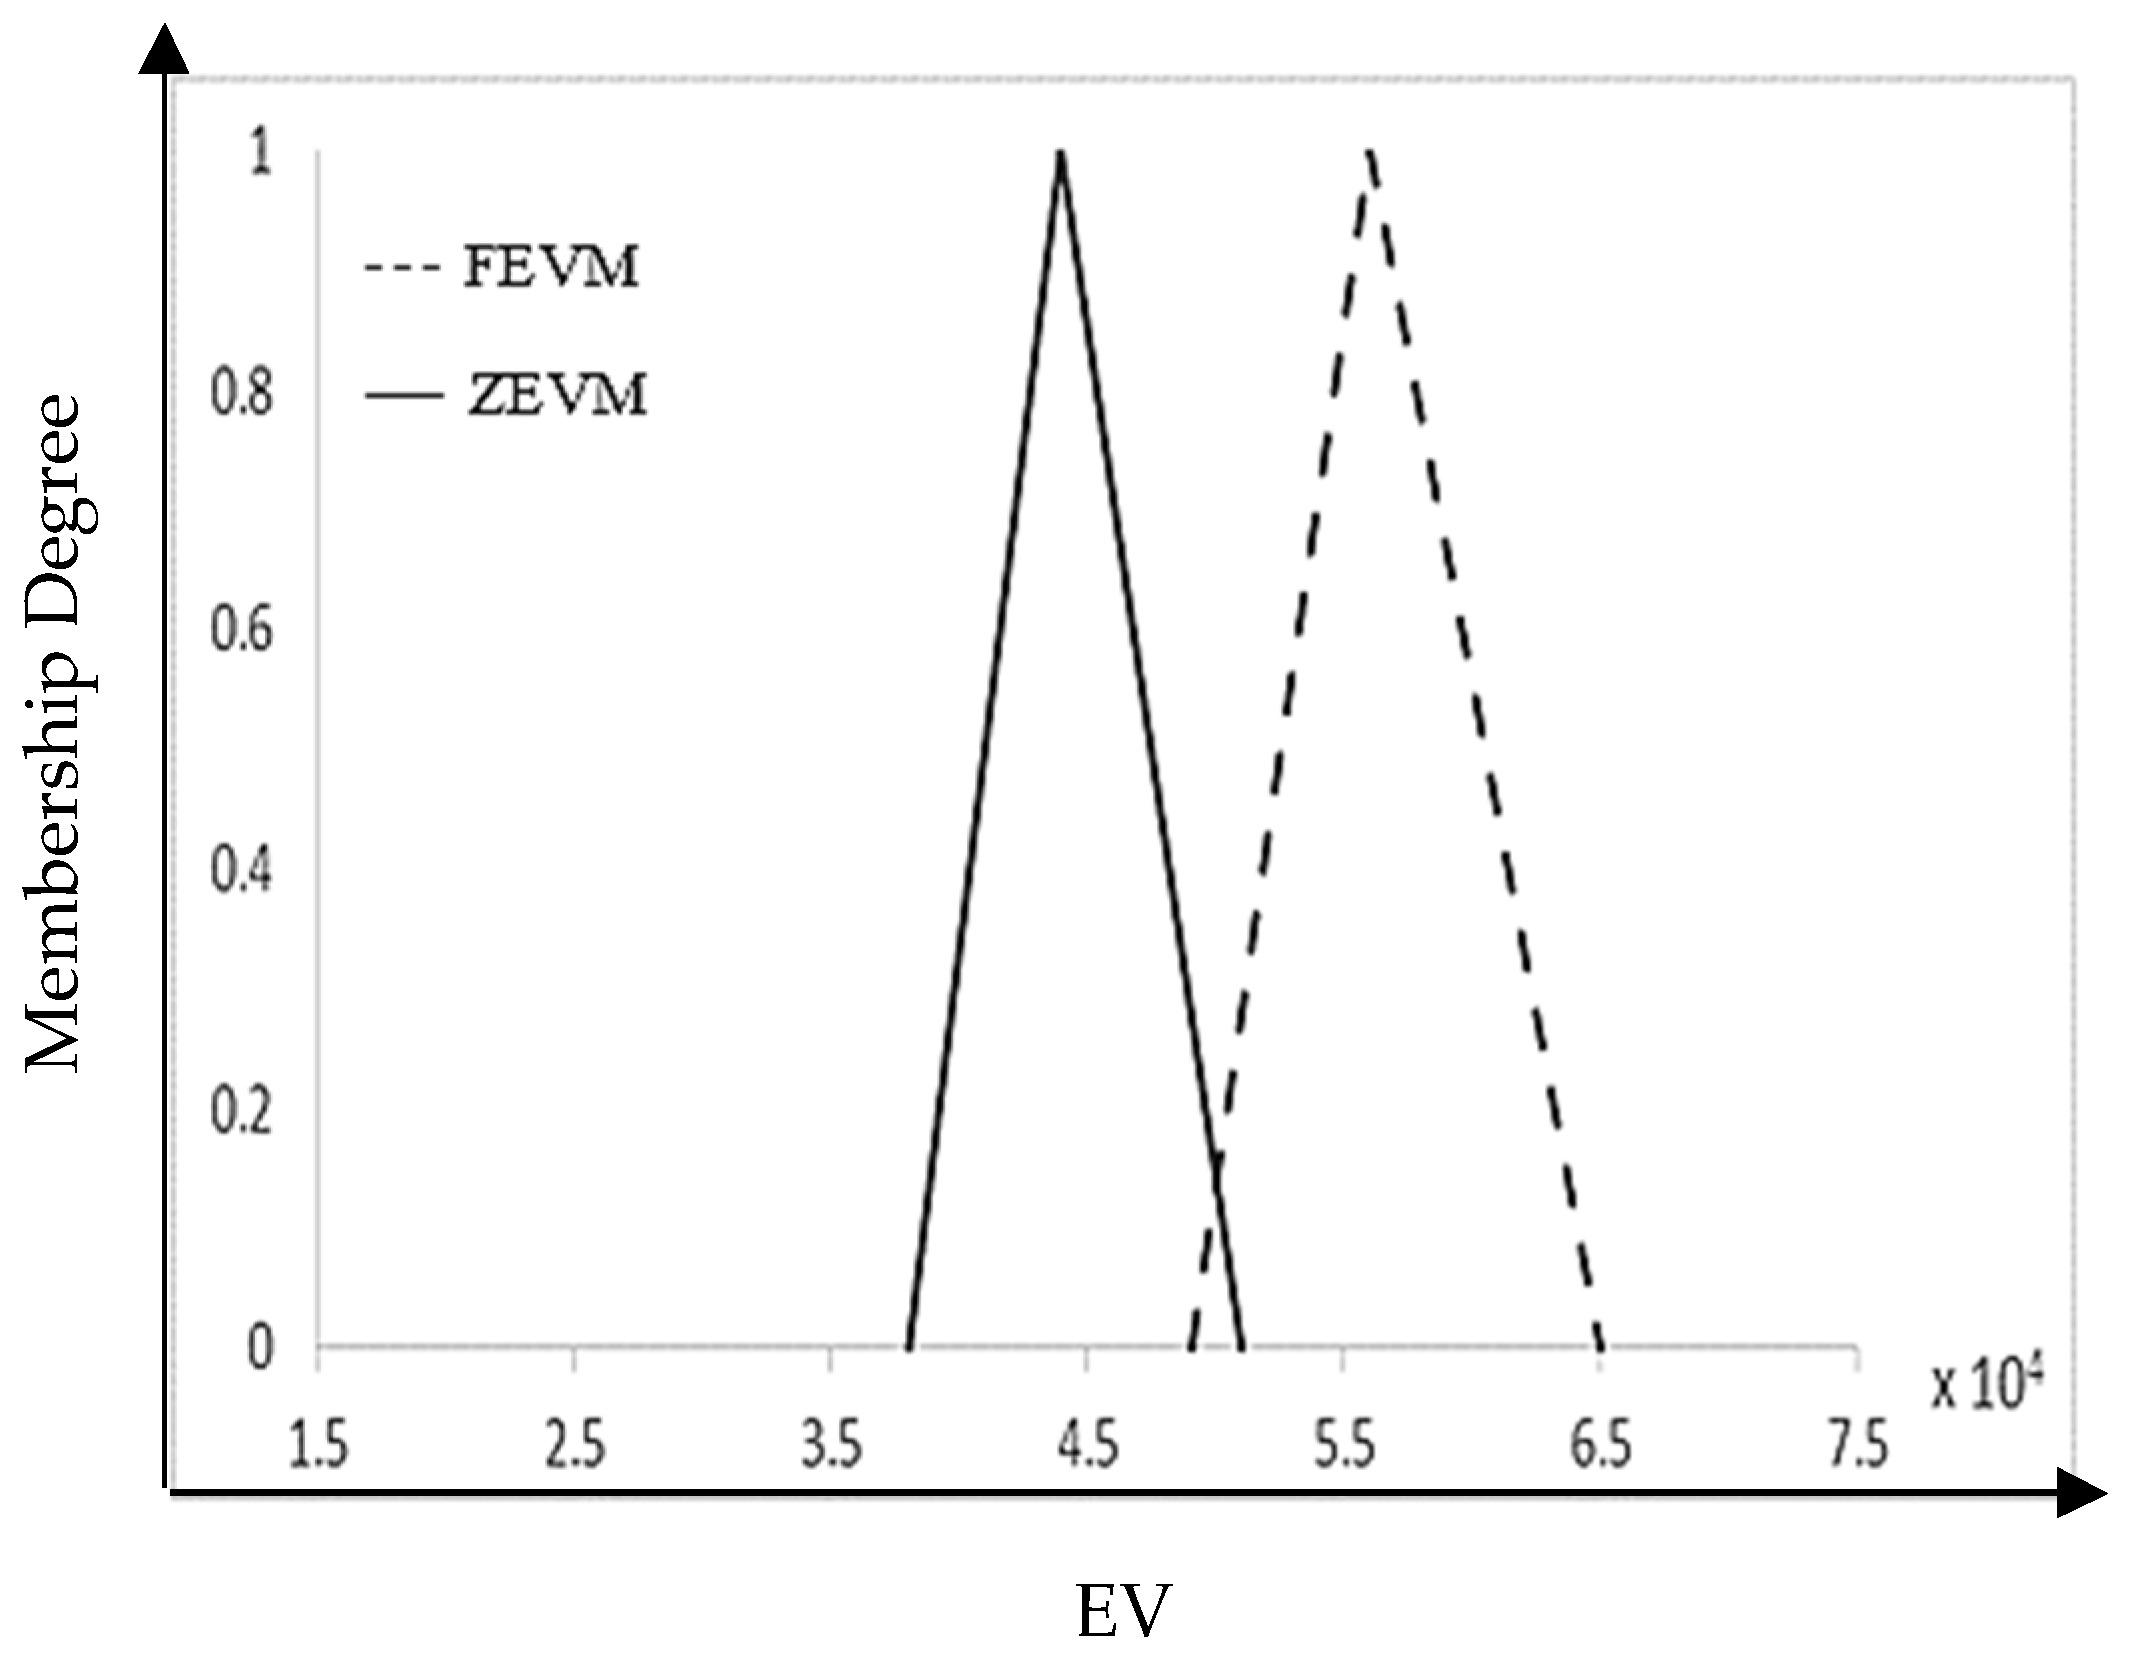
Figure 4.
EV of phase 2.
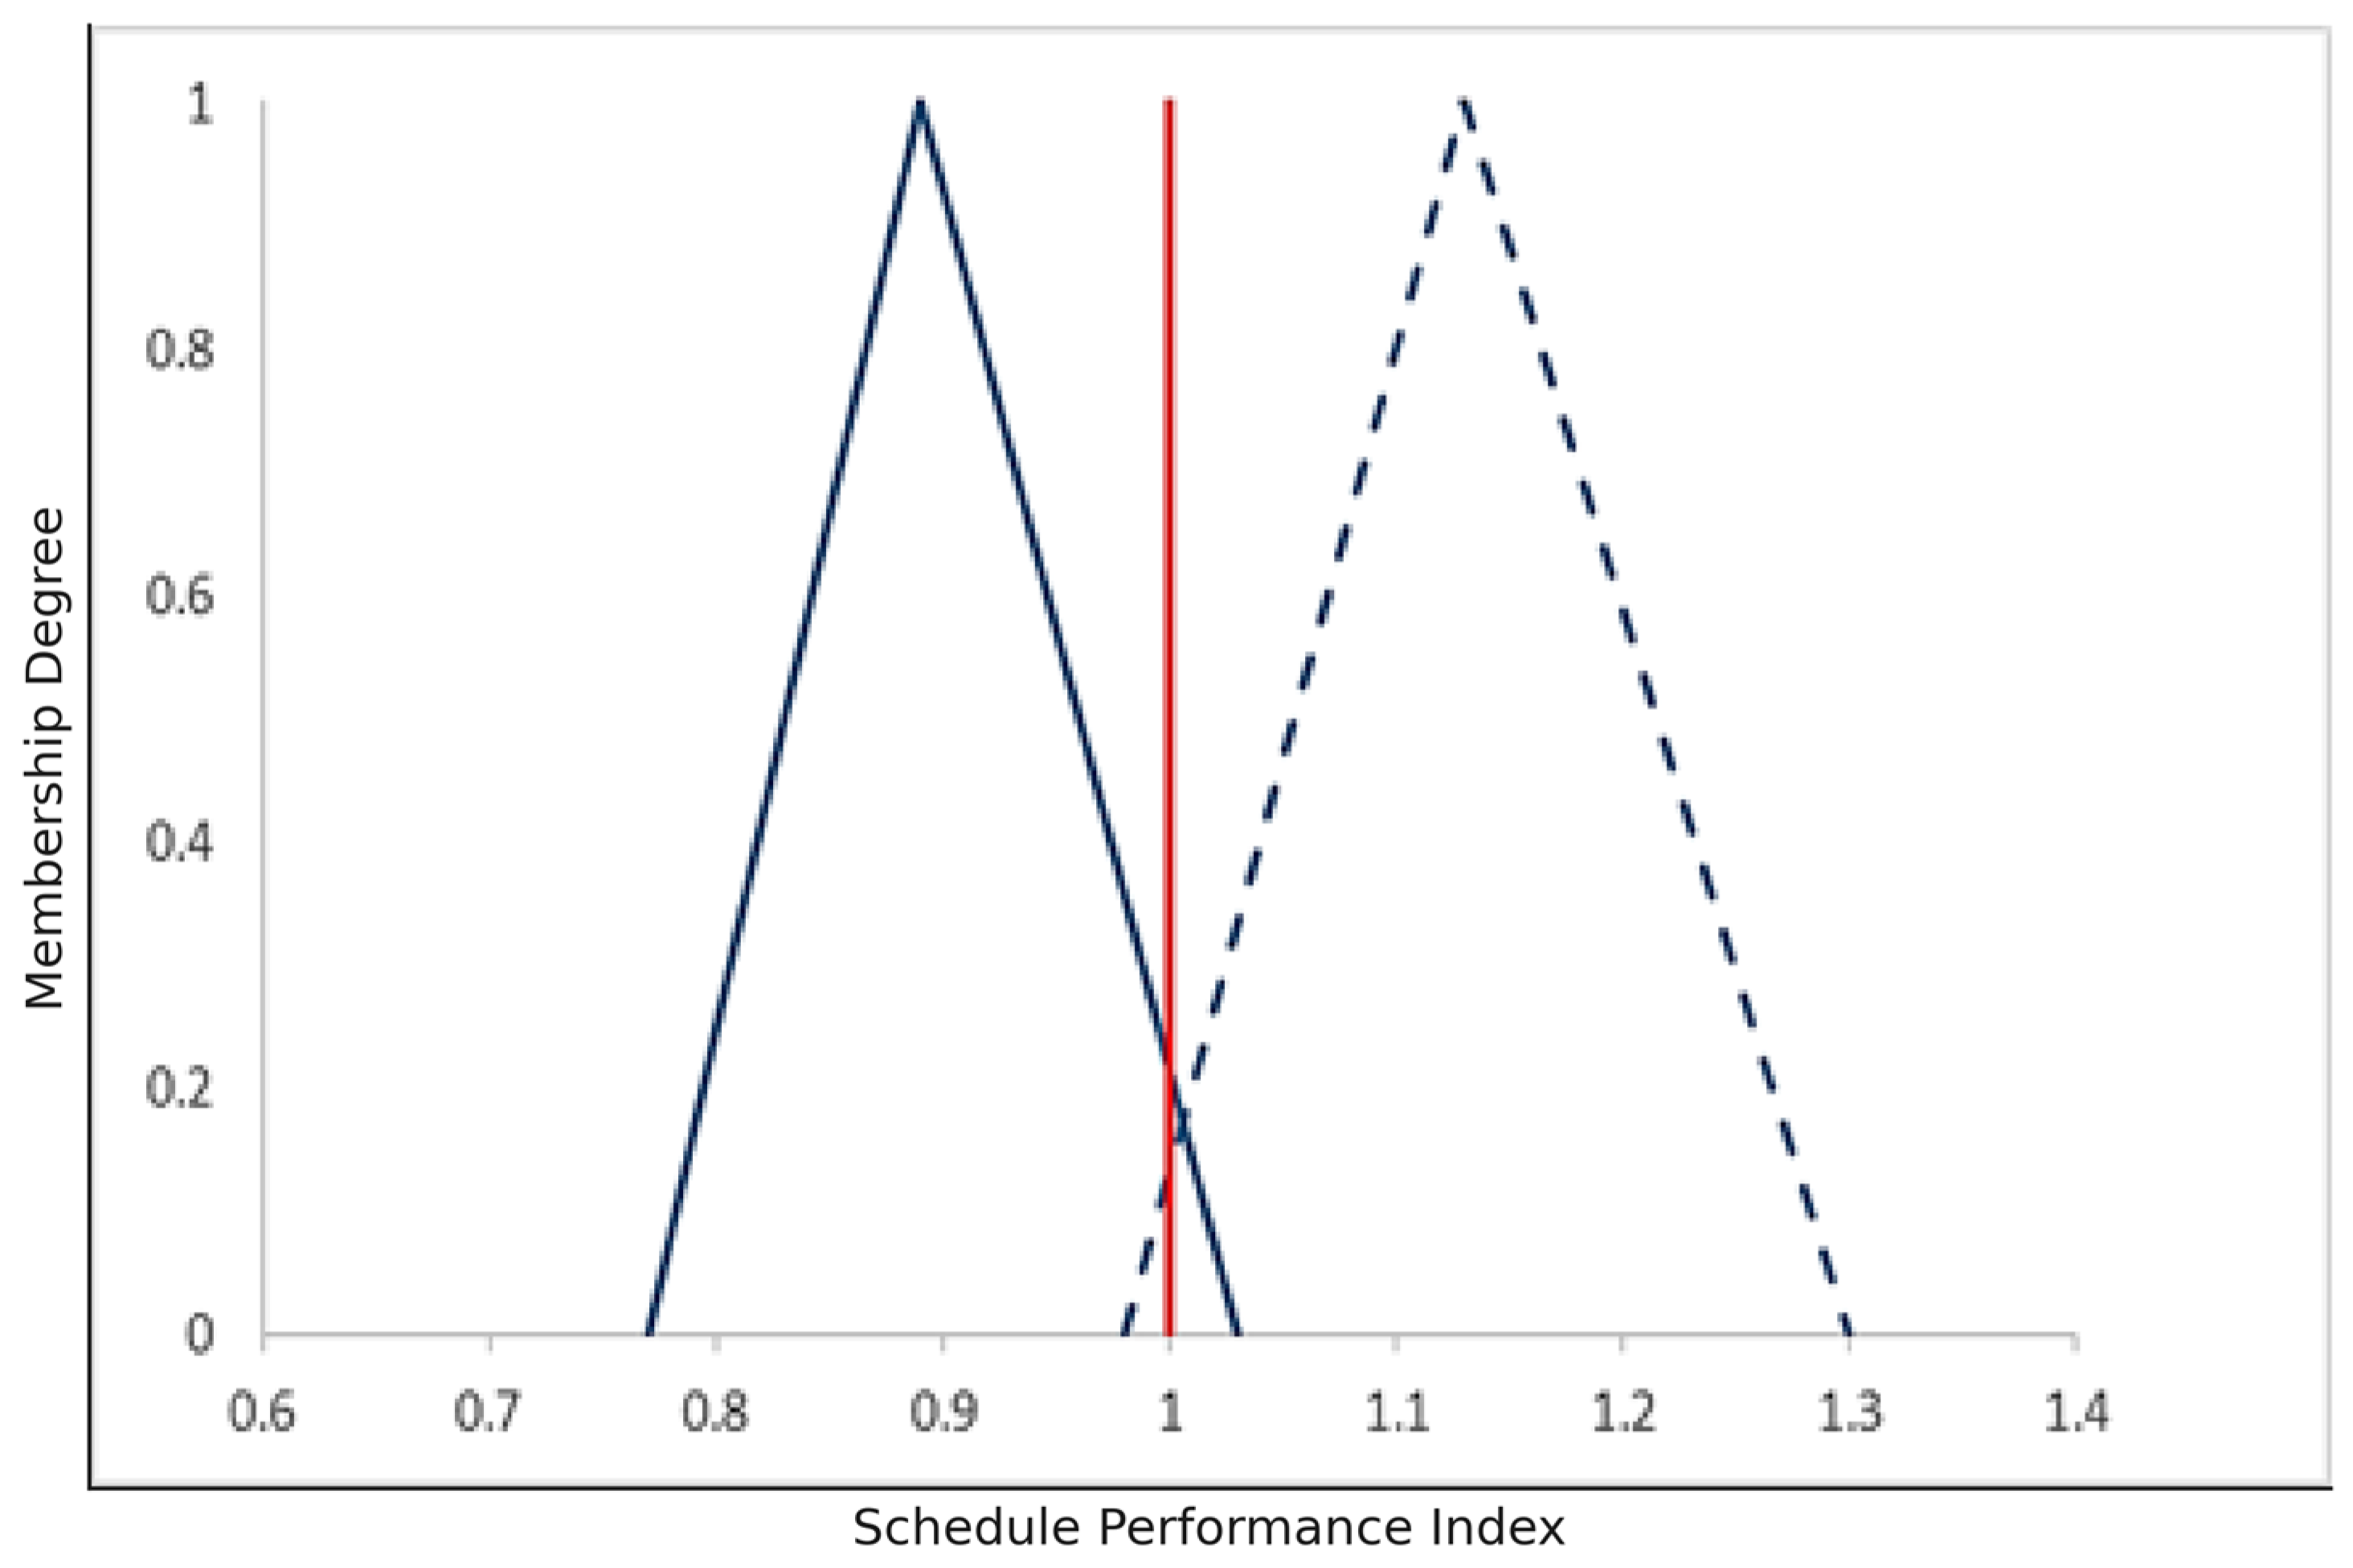
FEVM and ZEVM of phase 1 are shown in Figure 5. When the is obtained for each activity, and the total result value for each phase is obtained to calculate the schedule performance index () and the cost performance index ().
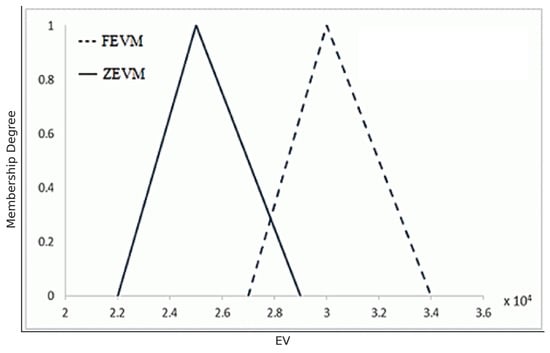
Figure 5.
FEVM and ZEVM of phase 1.
Calculation of scheduling performance index using Z-numbers, calculated using the formulas of this article:
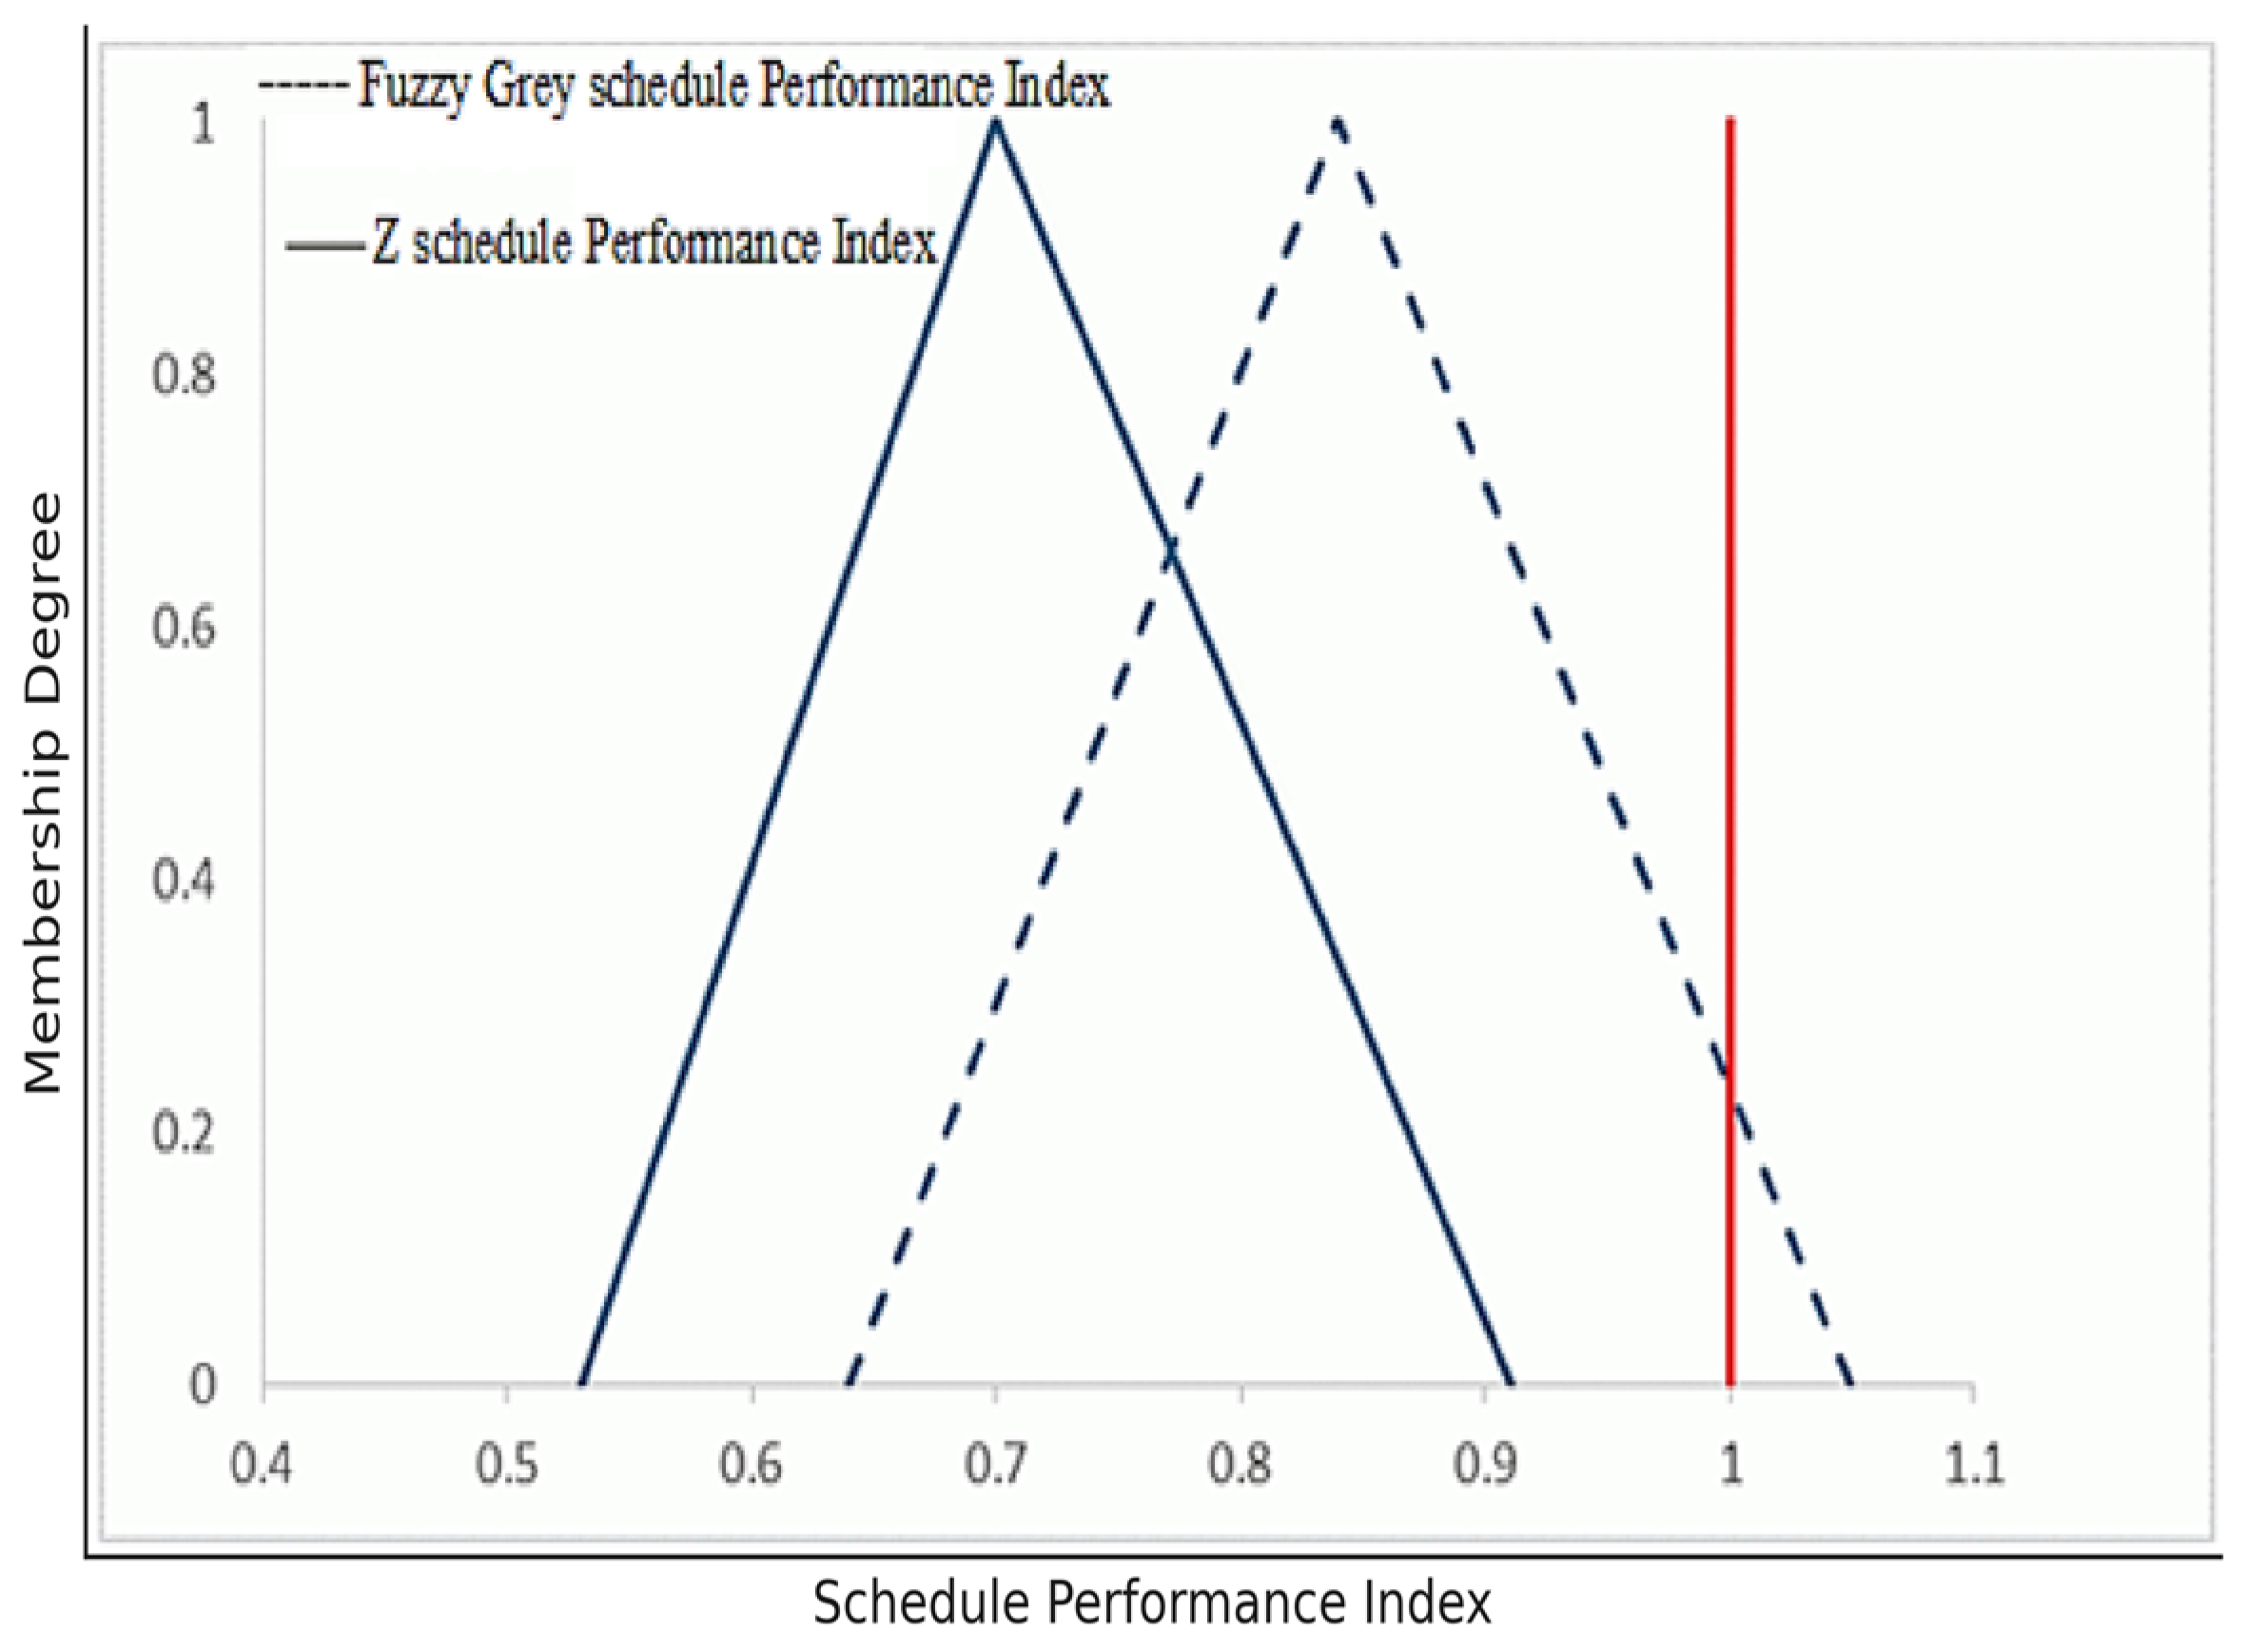
Differences between and in phase 1 are shown in Figure 6.
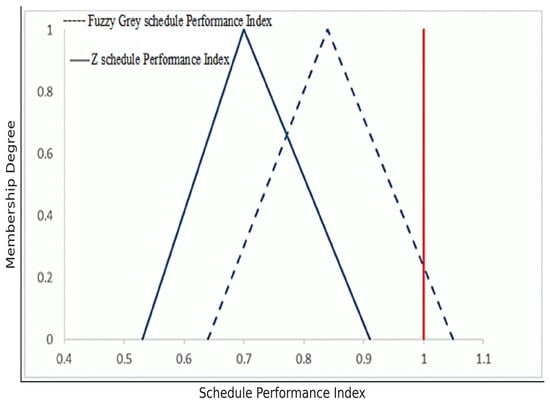
Figure 6.
Differences between and in phase 1.
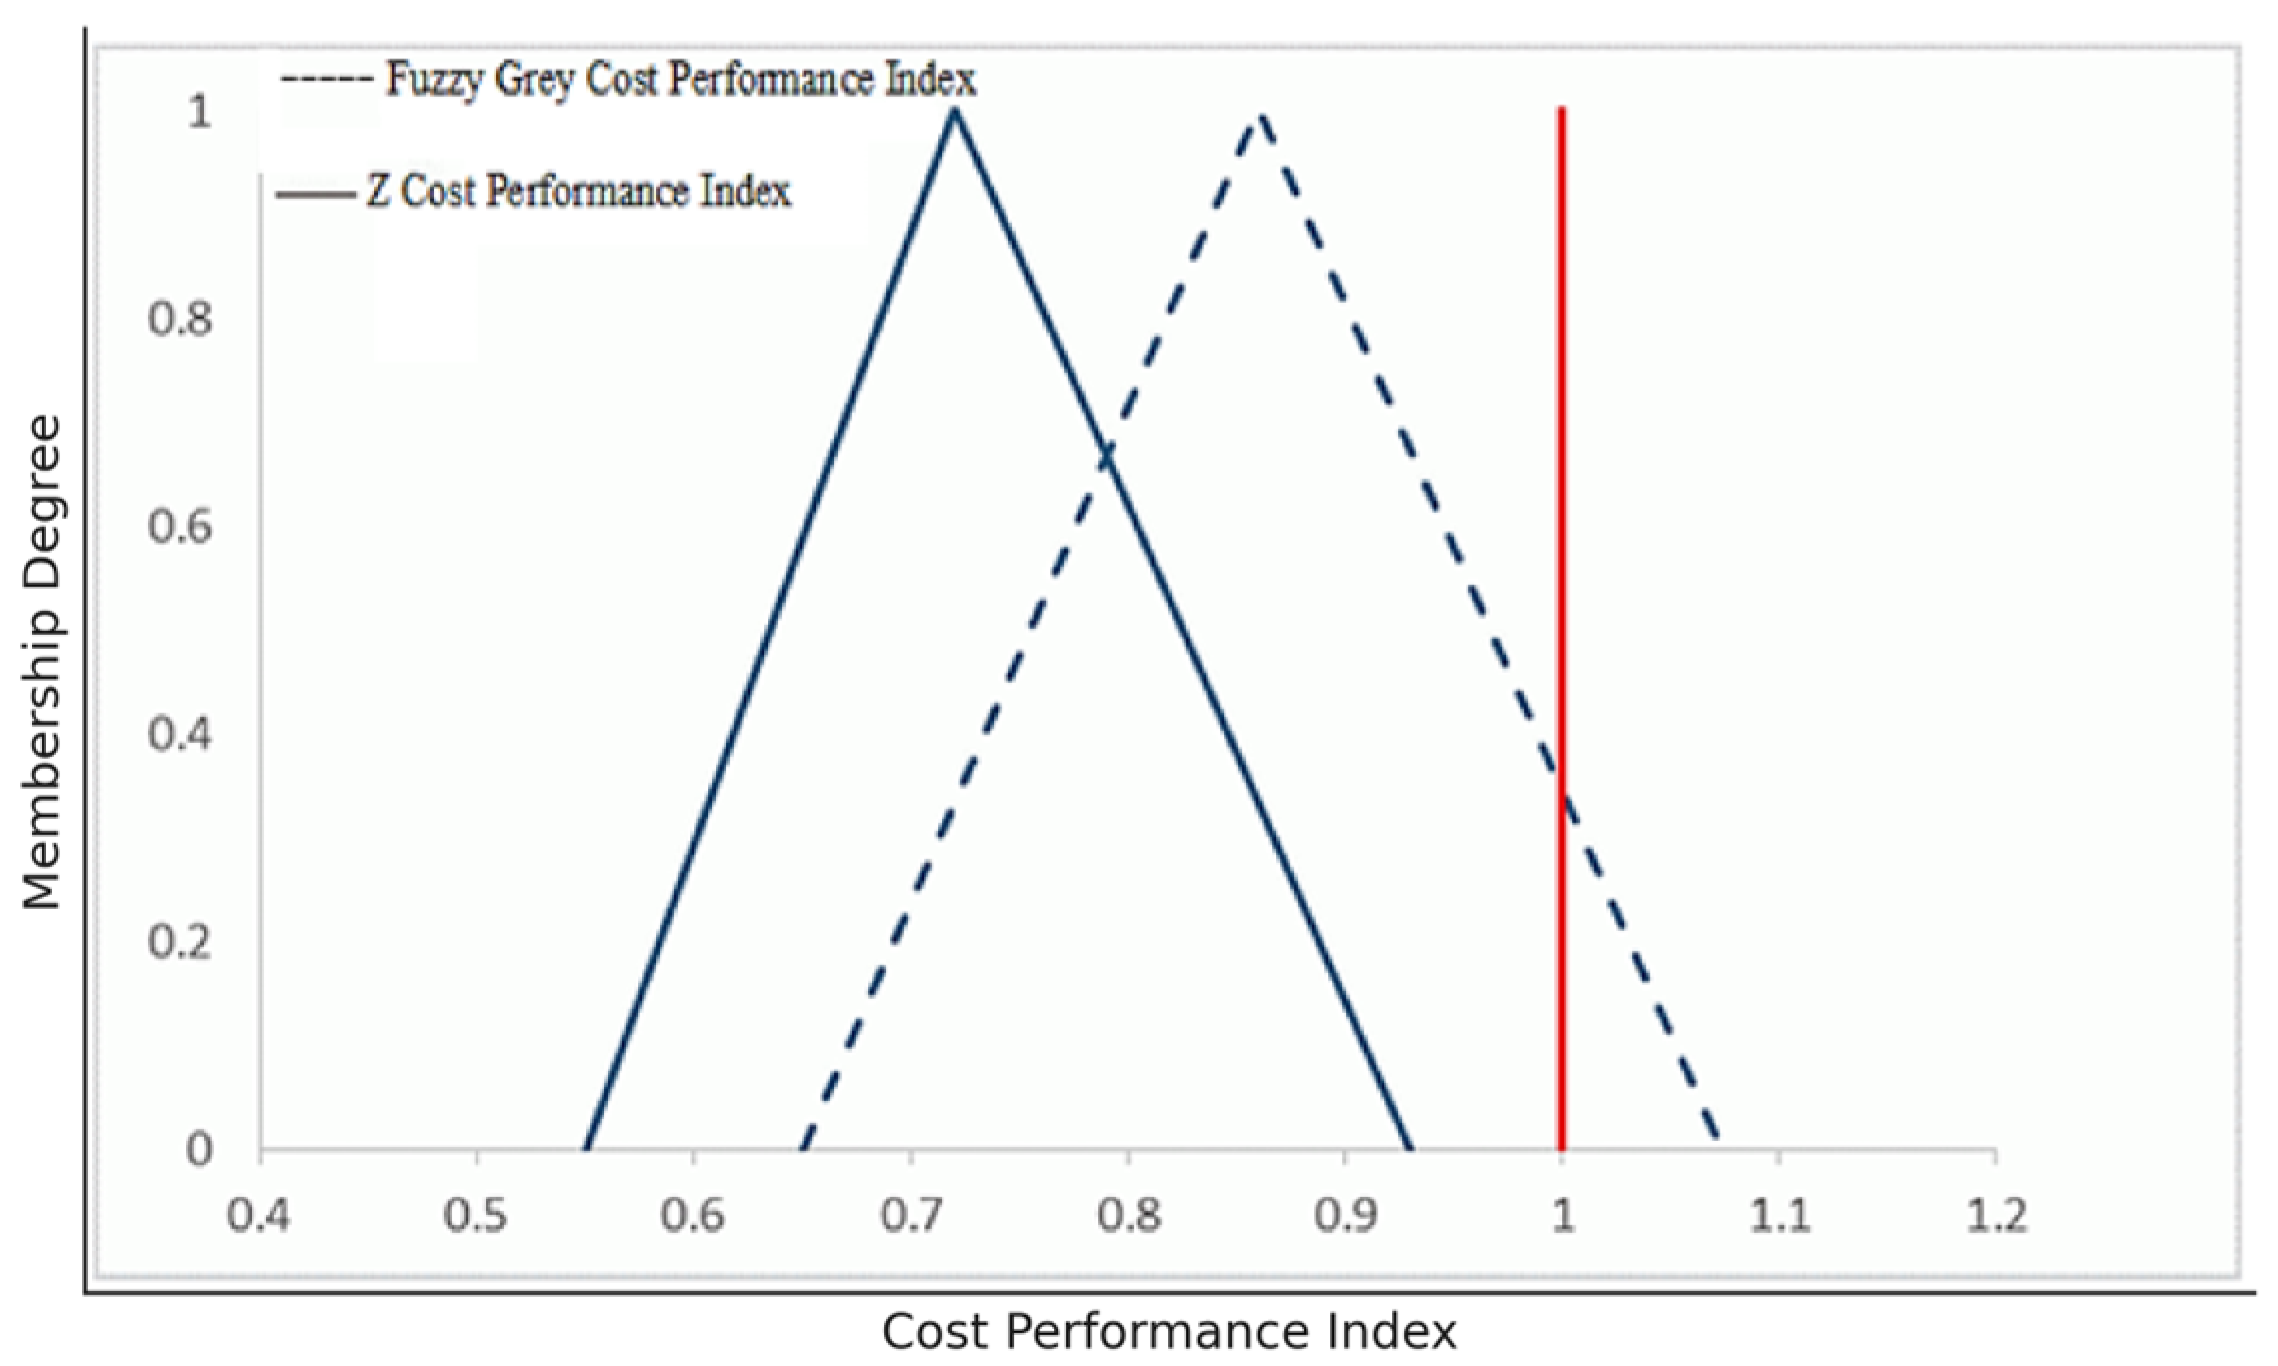
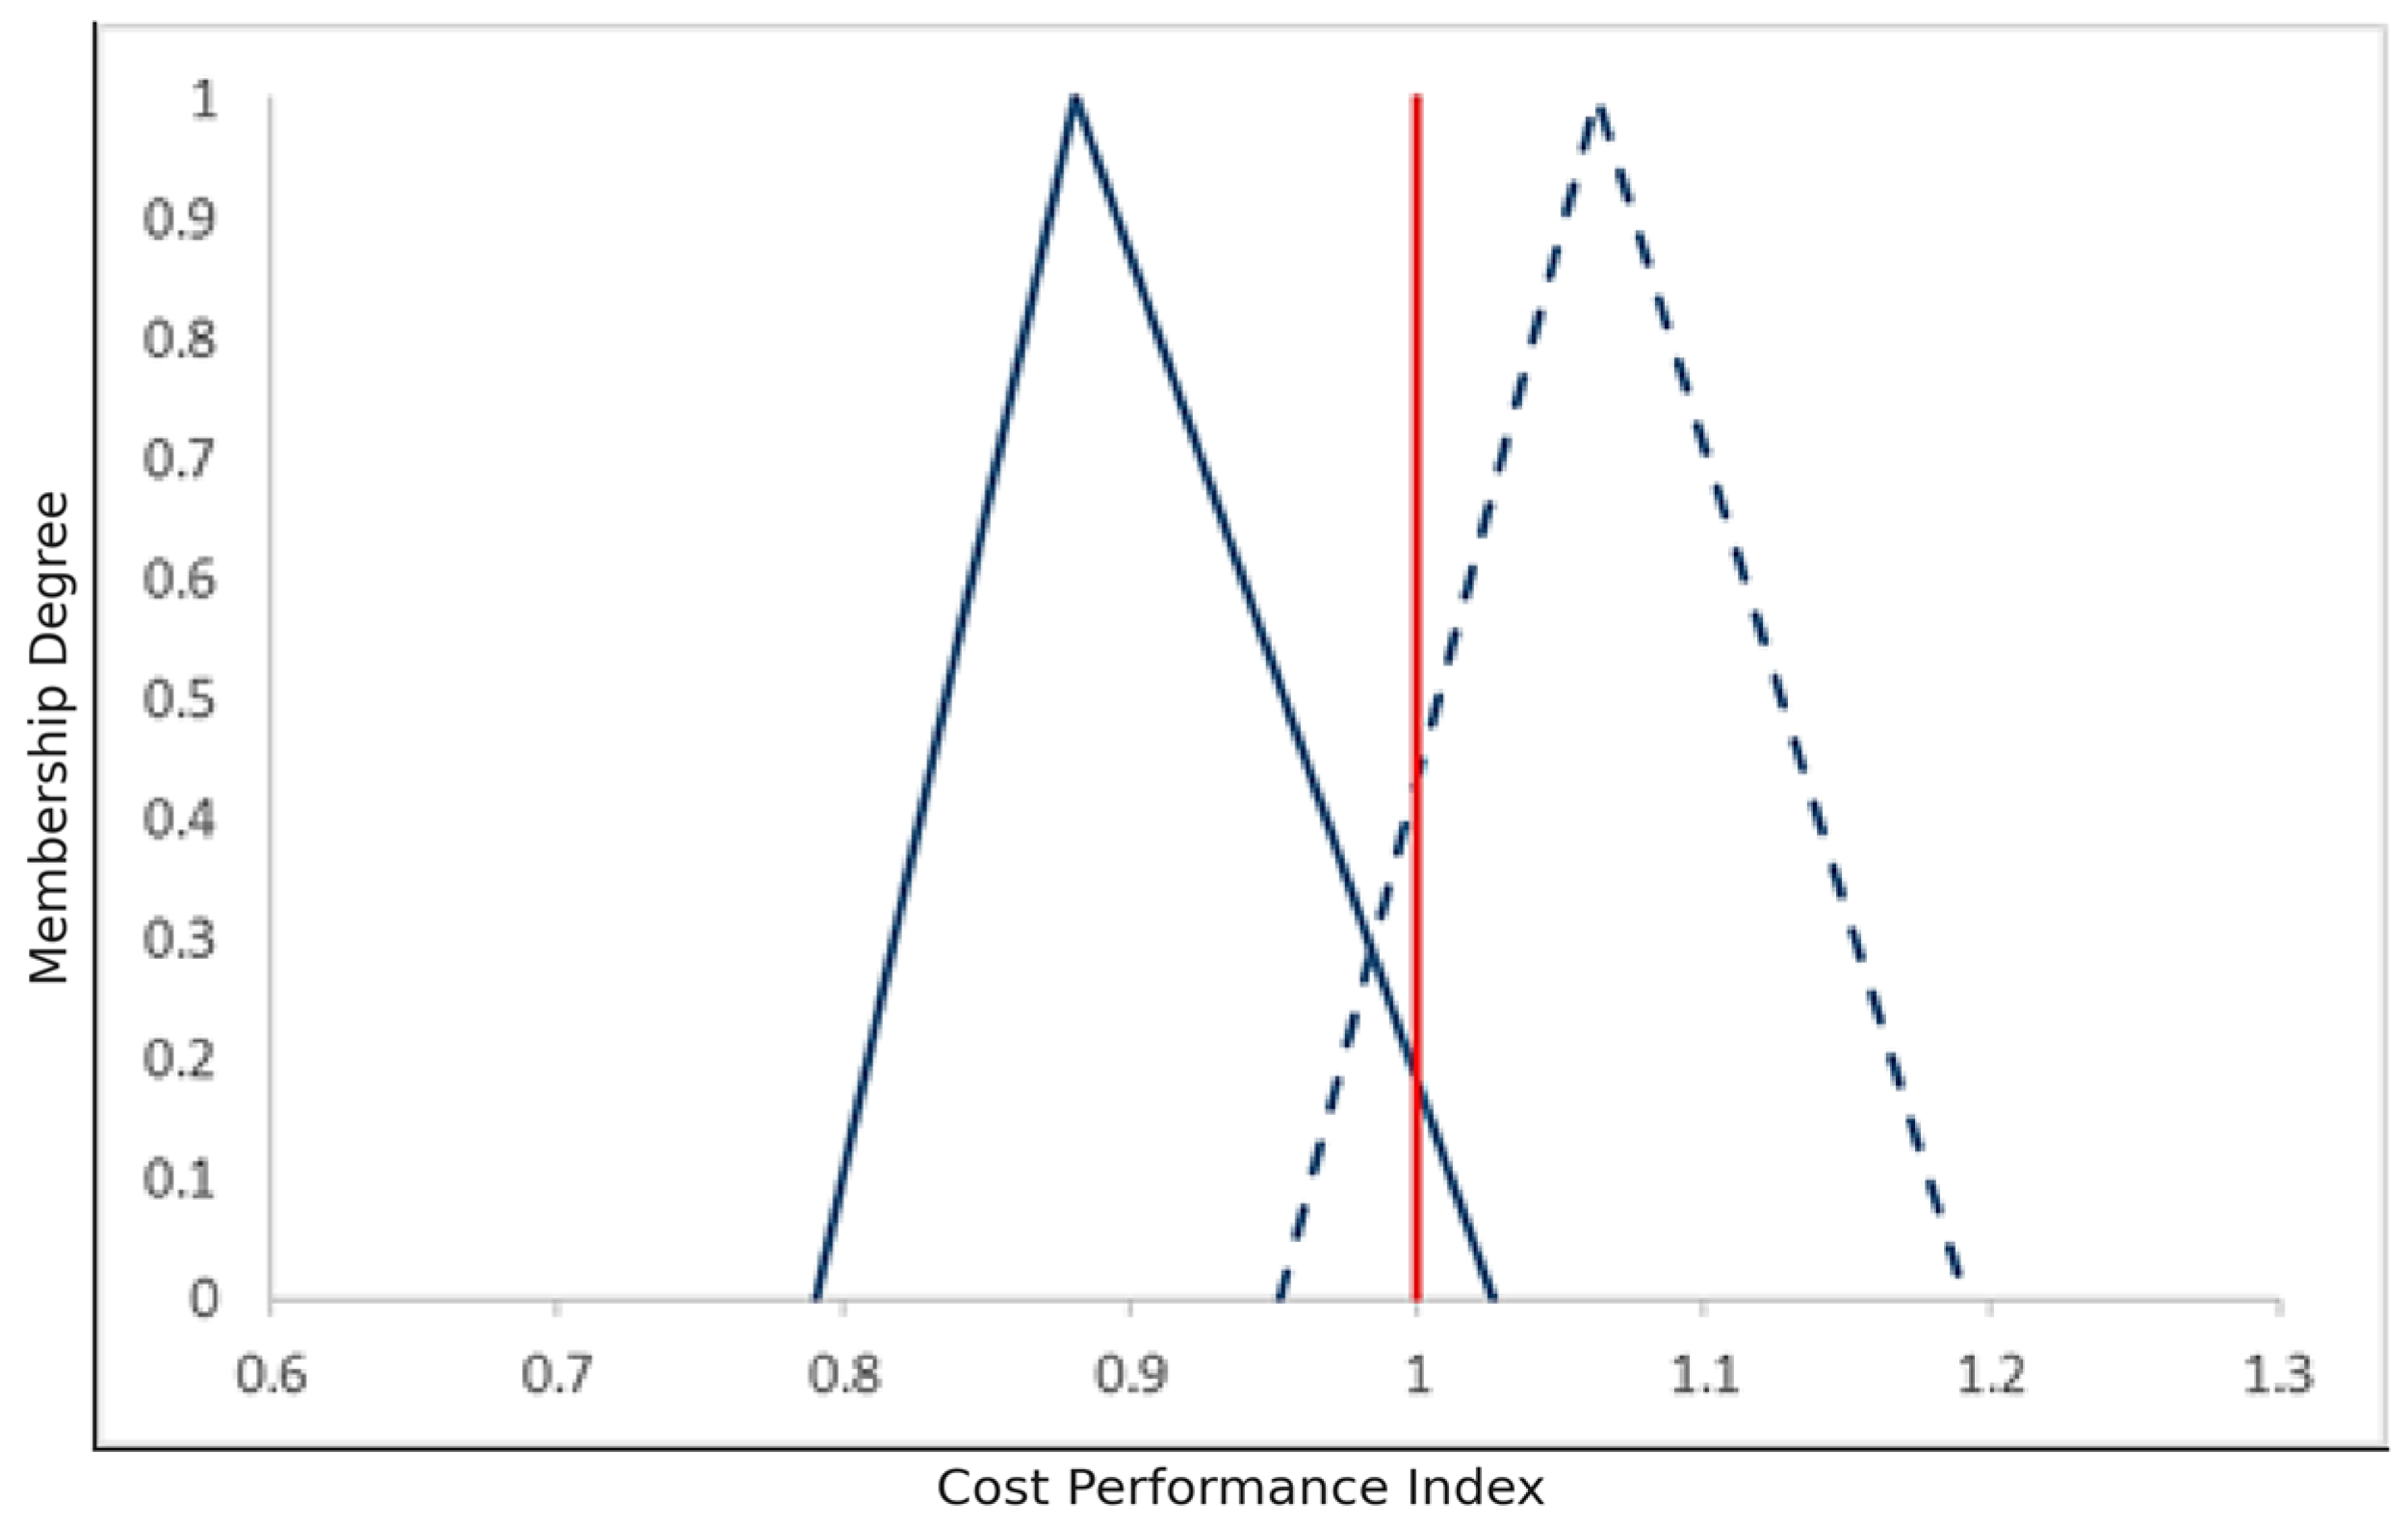
Also, to calculate the performance index, we will have a cost using Z-numbers:
The difference between the fuzzy grey performance index and the Z cost performance index is shown in Figure 7.
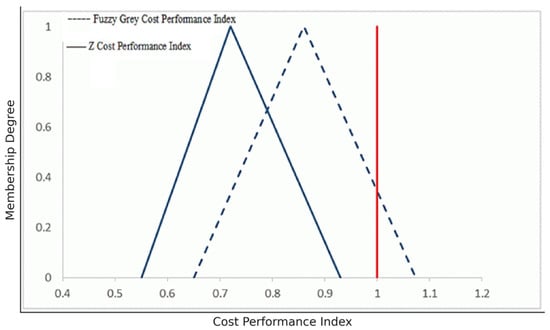
Figure 7.
Differences between and in phase 1.
In general, Table 13 presents the calculations of the schedule performance index (and) and cost performance index (and) for all three phases of the project.
Table 13.
Calculation of time and cost performance indicators for each phase of the project.
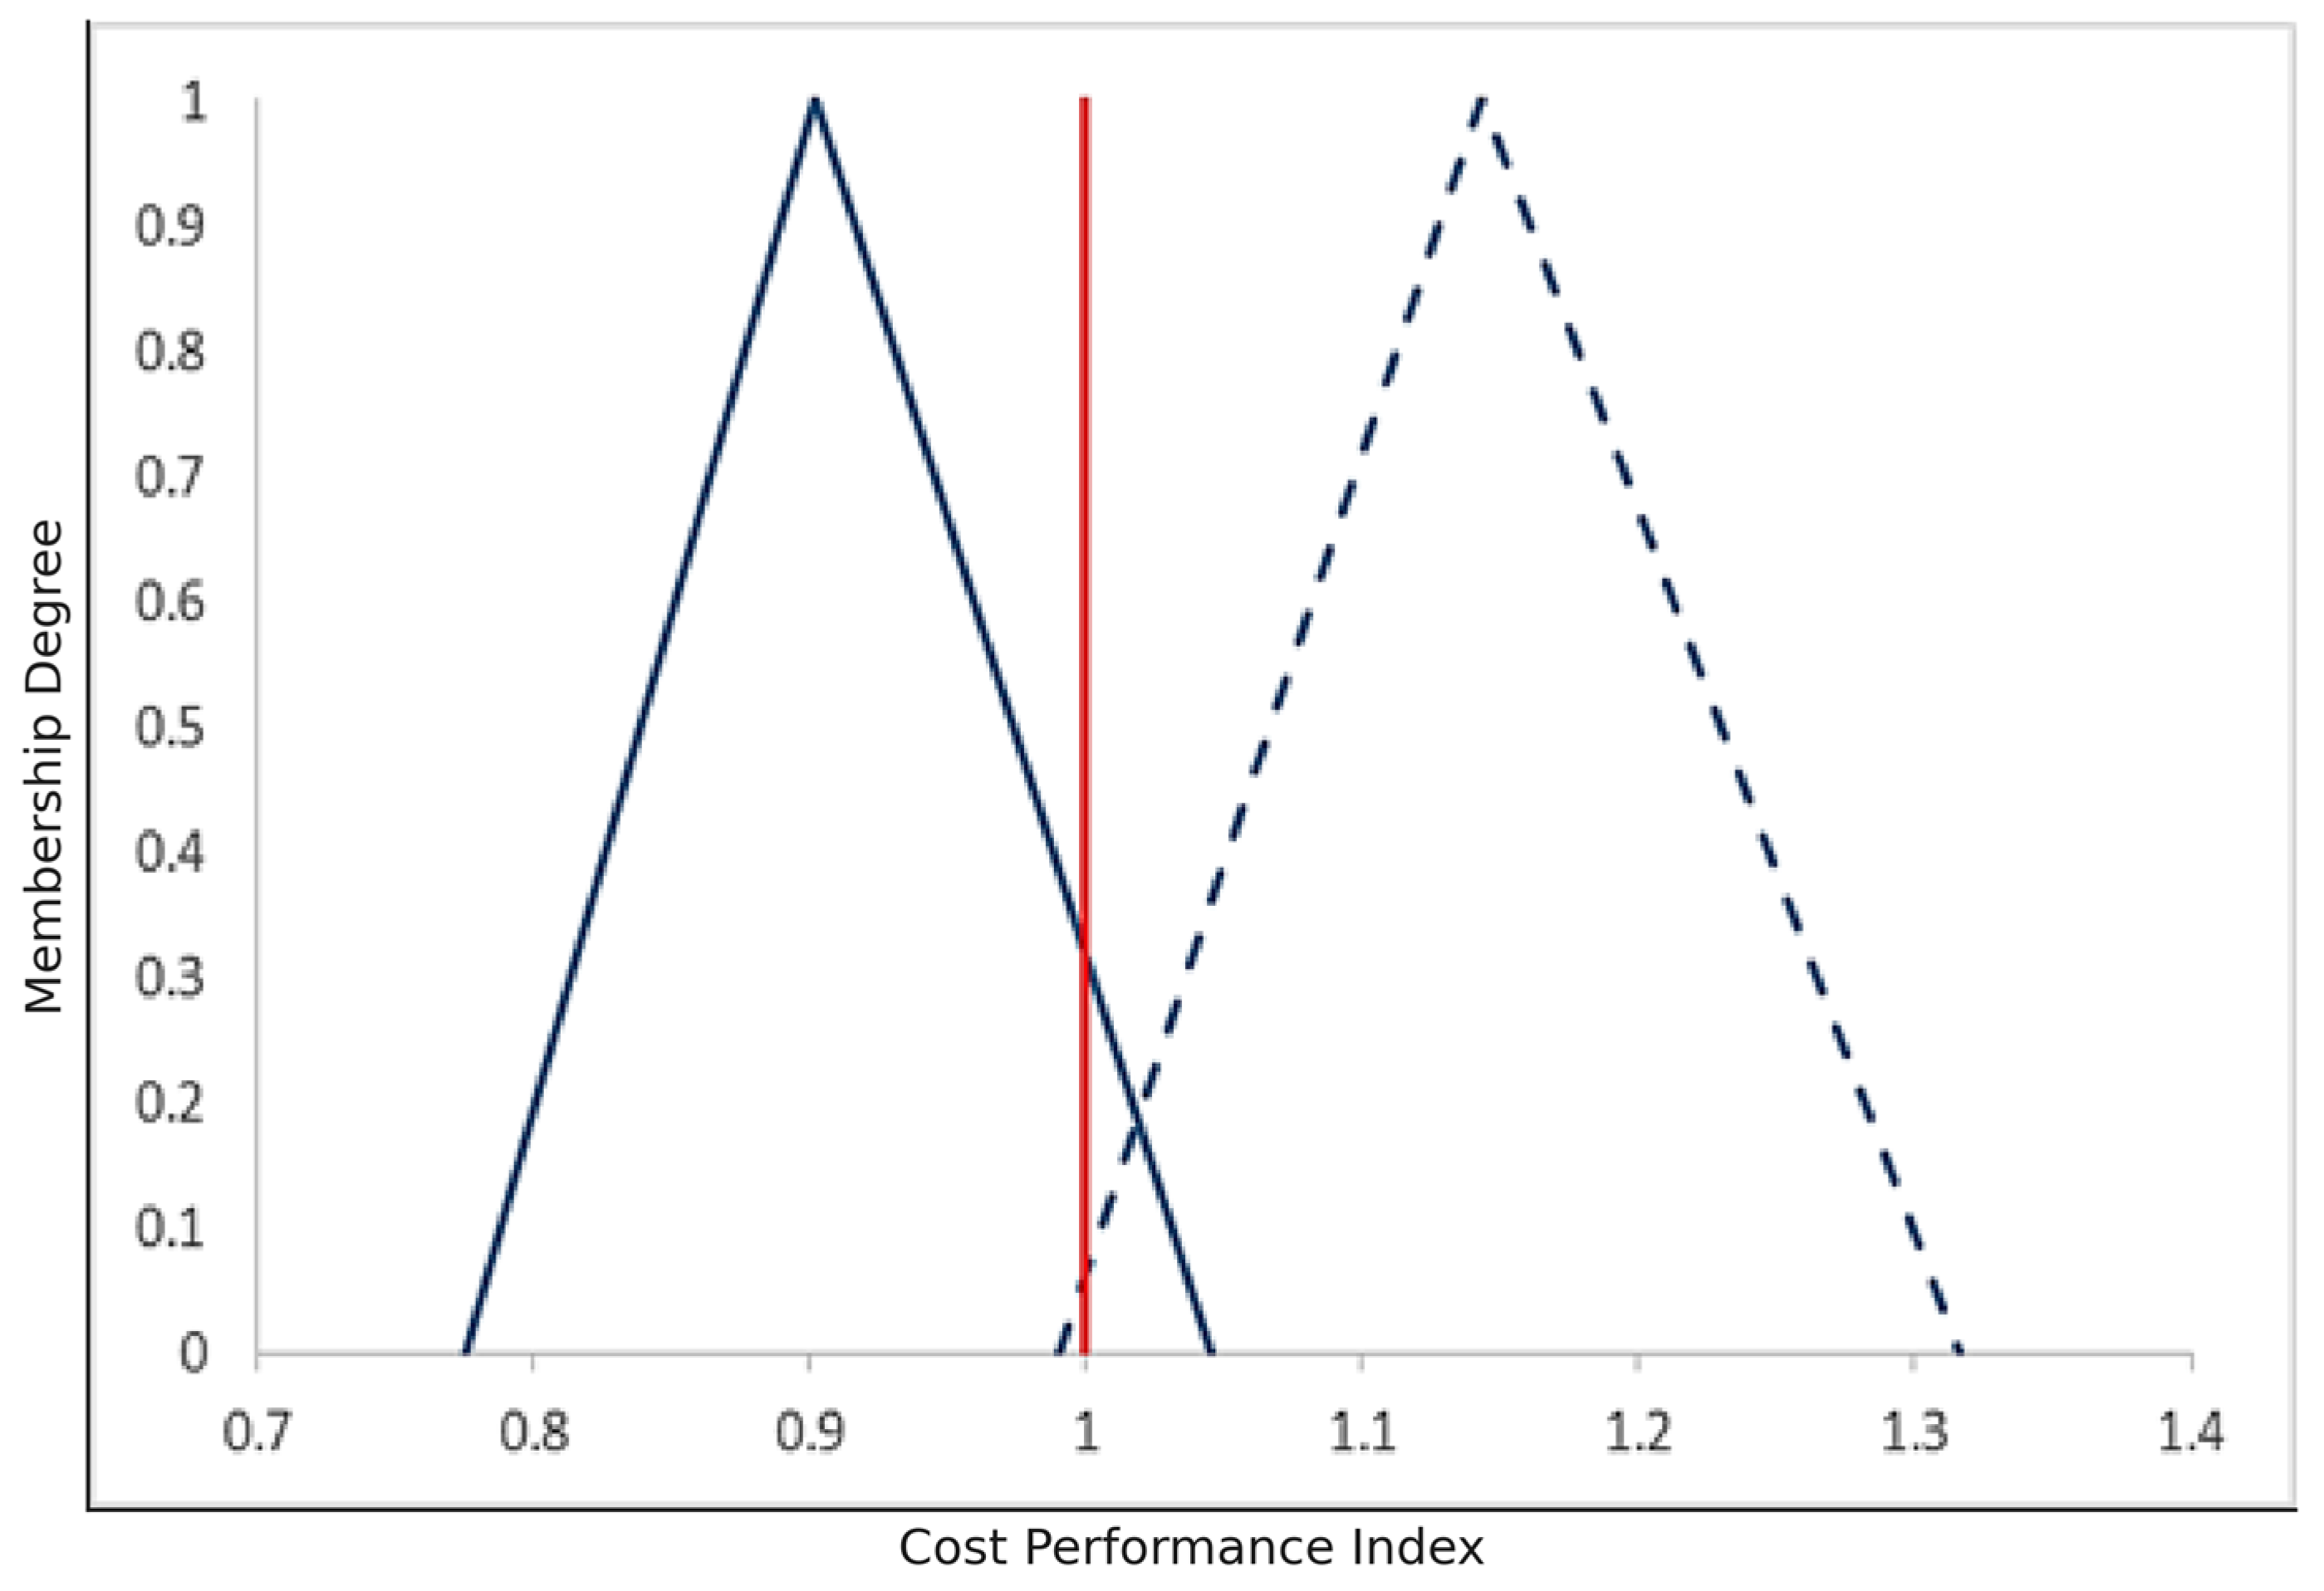
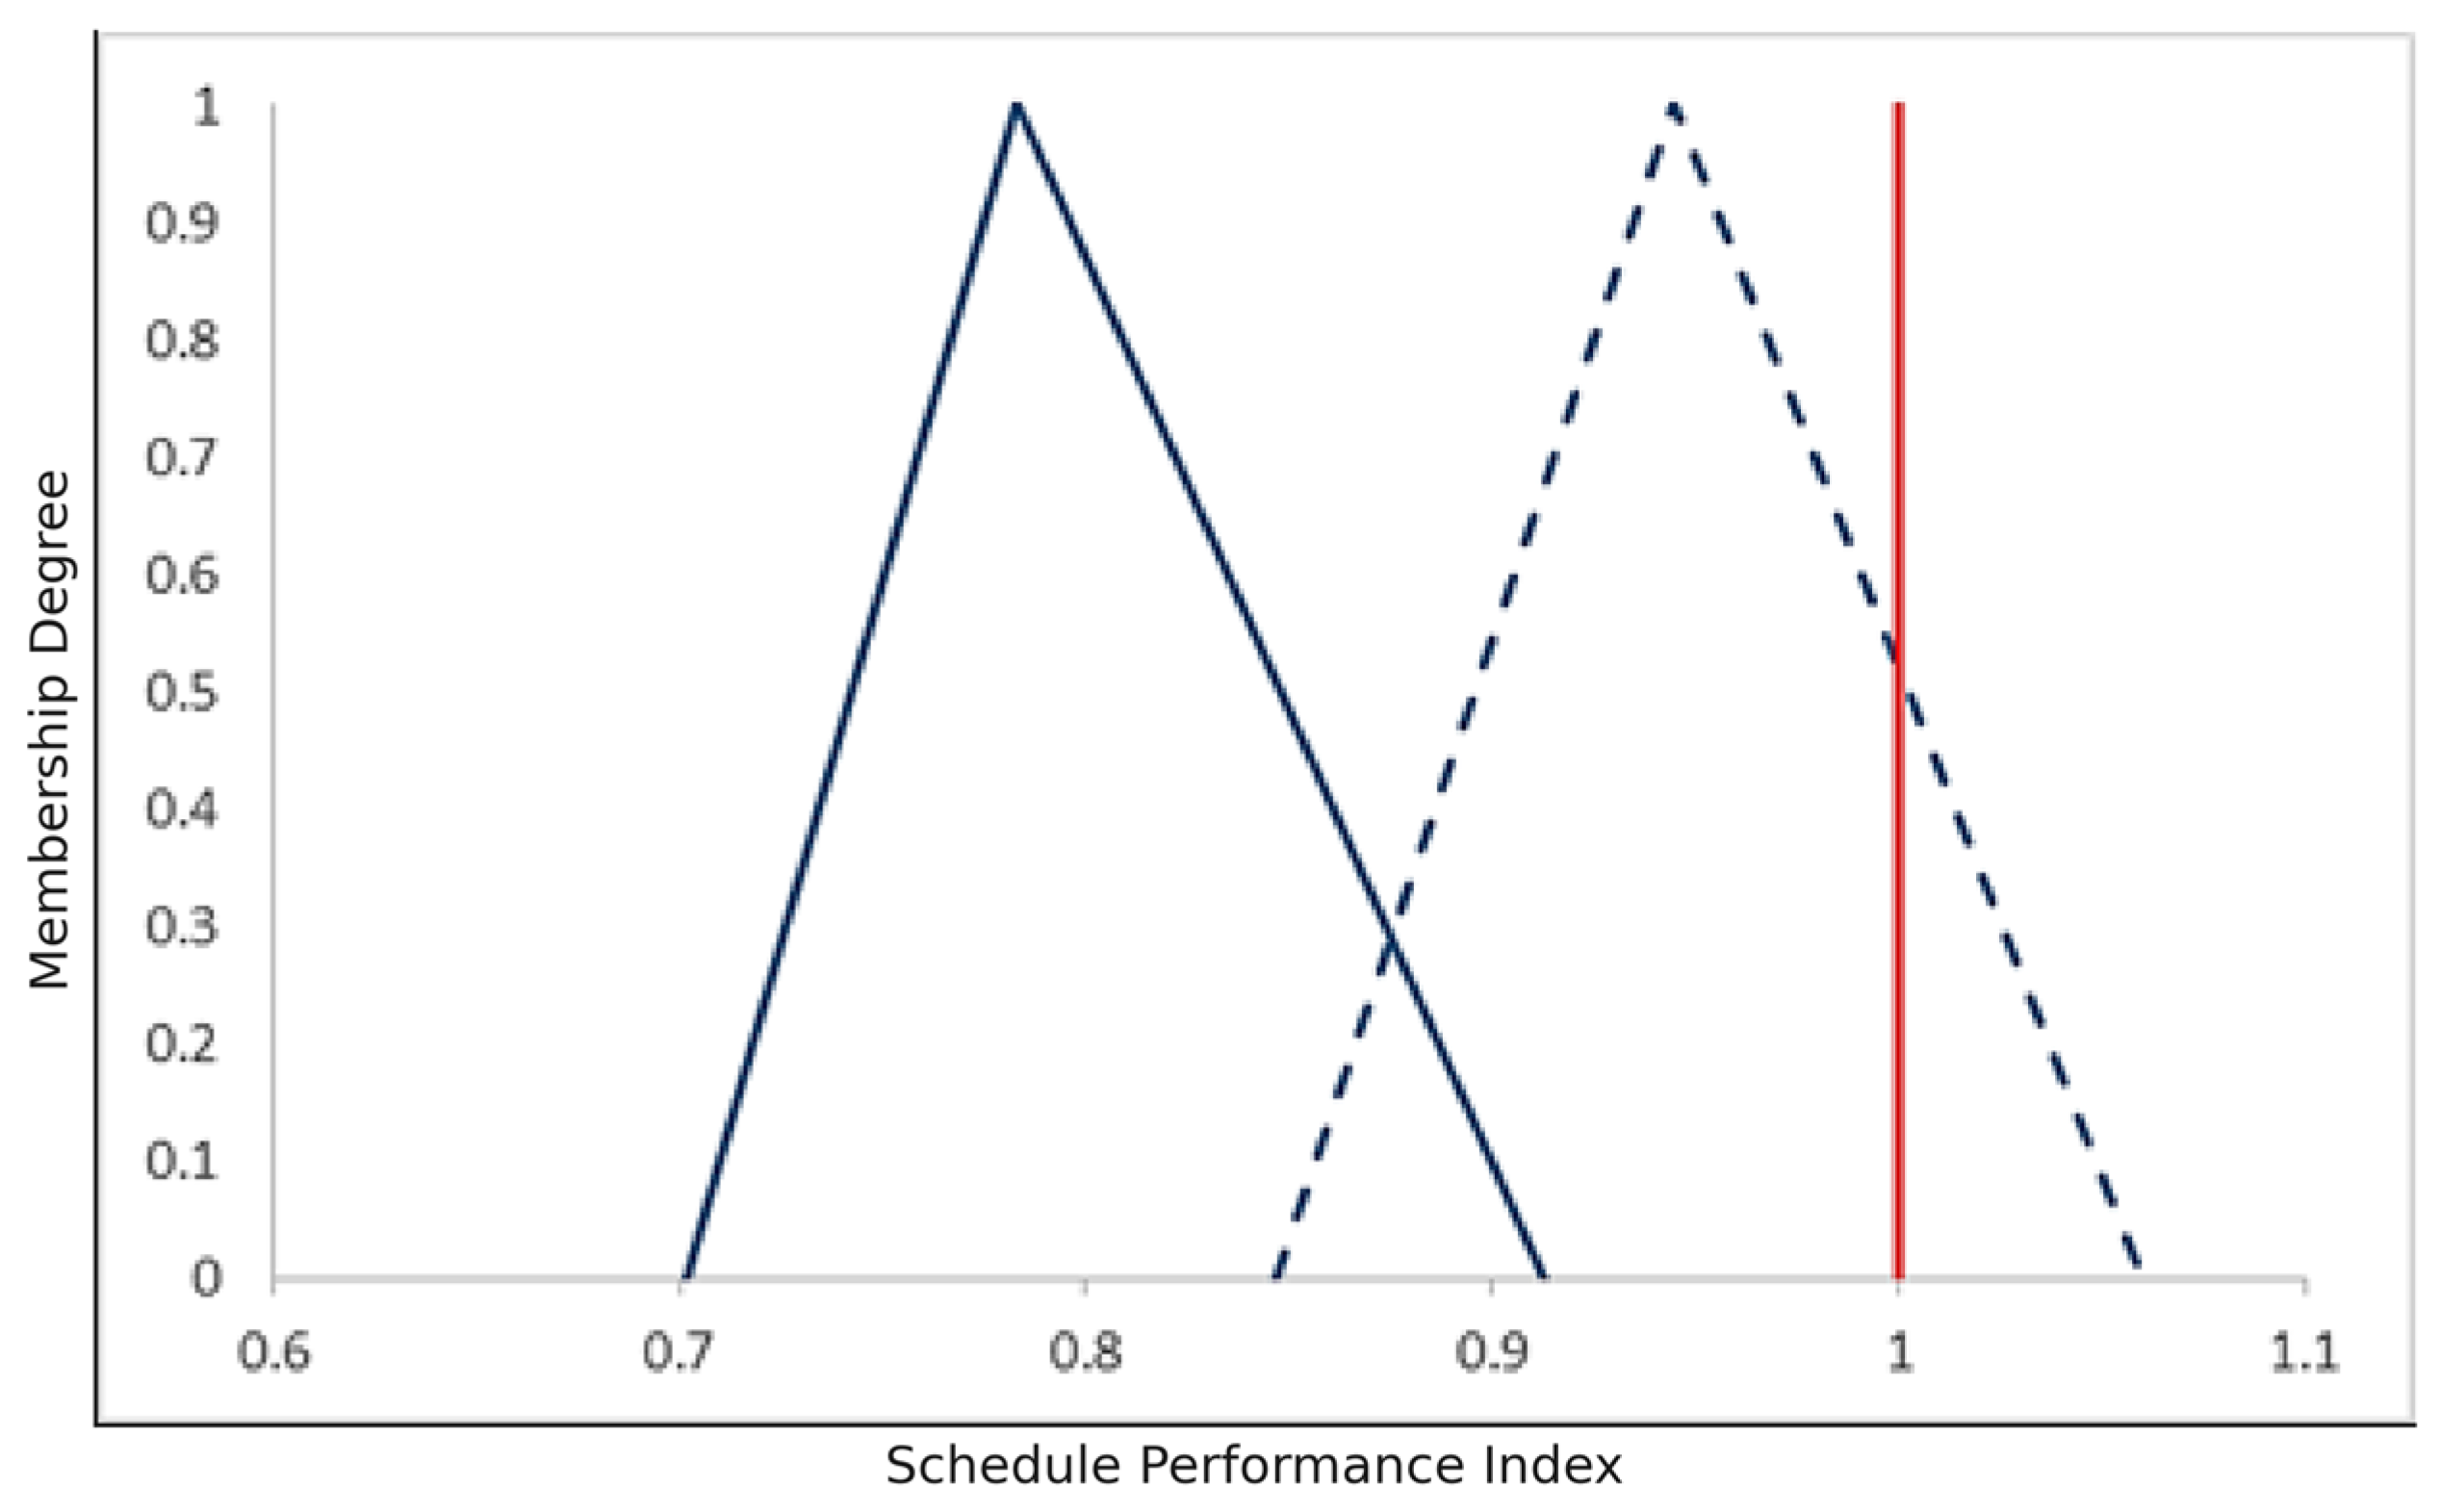
Below, you can see the difference between phases two and three (the dashed blue line indicates fuzzy grey values, and the blue line indicates values based on Z-numbers).
The difference between and in phase 2, and in phase 2, and in phase 3 and , and in phase 3 are depicted in Figure 8, Figure 9, Figure 10 and Figure 11.
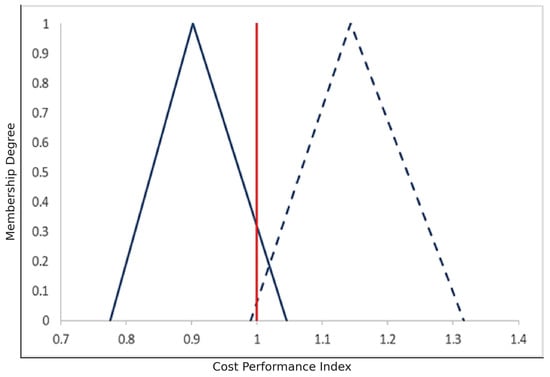
Figure 8.
Differences between and in phase 2.
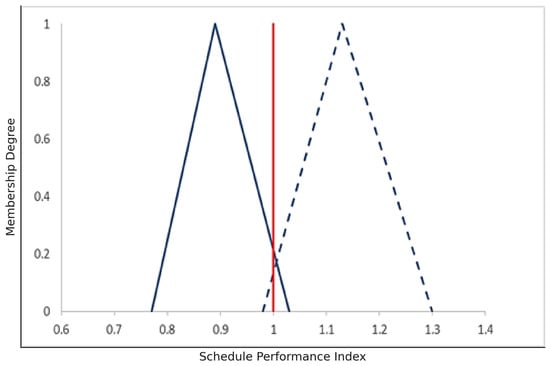
Figure 9.
Differences between and in phase 2.
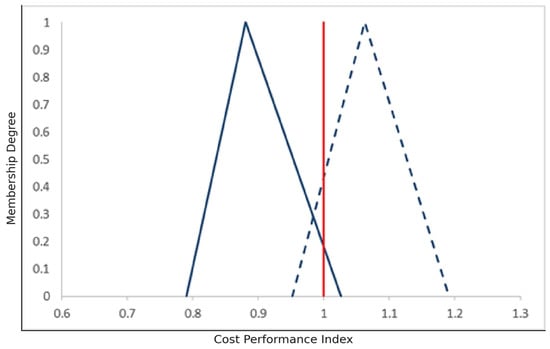
Figure 10.
Differences between and in phase 3.
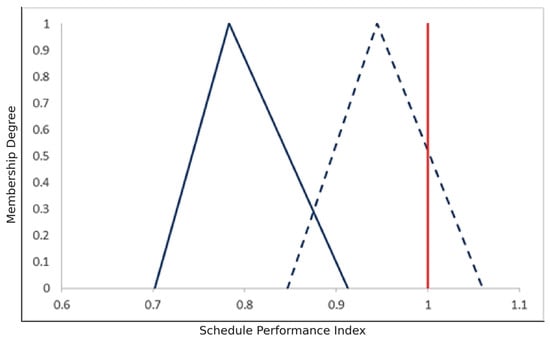
Figure 11.
Differences between and in phase 3.
4.1. The Results of the Health Status of the Project
According to the values obtained for cost and schedule performance indicators and according to the scenarios mentioned in Table 5 and Table 6, Table 13 shows the health status of the project phases from the perspective of time. It specifies the classification and cost. The solution results of the same case study have been compared to the method investigated in this research using the model of Hendiani et al. The expression of the project’s health status using the fuzzy grey value model is associated with a degree of confidence that we do not see in the value management model using the Z-number. For example, the phase status of a project in the model used by Z-numbers shows that it is behind schedule. In the case of the fuzzy grey model, the number in the schedule performance index shows that the project is relatively behind schedule with certainty. The status of each phase of the project in terms of time and cost is shown in Table 14.
Table 14.
Status of each phase of the project in terms of time and cost.
Finally, to determine the status of all project phases, a critical index is calculated using Formula (23) to measure their health status. The following example is a template for calculating the crucial index of phase one, which shows that phase one is almost unhealthy.
These results are used to calculate each phase of the project. For example, the following two models are provided to explain the solution method:
According to Table 15, the values show that at the project’s endpoint, each of phases 1, 2, and 3 will be completed at whatever cost and with whatever degree of confidence. Also, the values show how much money will be spent from the current time to the end of the project and with what certainty. As a result of fuzzy grey value management modeling in this case study, we observed that the three phases of this project, respectively, from phase one to phase three, from the point of view of the project schedule, are almost behind schedule with complete confidence, with nearly full confidence they are ahead of schedule, and with a confidence of less than one (0.8-1) they are almost behind schedule. We determined the advantage of using this model at this stage. In addition to knowing the status of the phases from the perspective of timing and cost, we will also understand the level of confidence of the expert in expressing this situation. By using the fuzzy grey EVM model, we can also estimate the cost that each phase will face until the end of the project, knowing the degree of confidence. For example, we know that phase one will be completed with total certainty at the cost of (72267.23,100914.32,163513). By understanding the status of each phase of the project and examining the related activities that make up the phase that is in an unhealthy state, the project team can take corrective measures to solve these problems.
Table 15.
Calculations of and in the project phases.
4.2. Research Findings
The research findings can be summarized as follows.
- The combination of two theories, fuzzy and grey, can express great uncertainty in the progress of project activities. As evident in the case study, the expert used LTs with uncertainty to describe the amount of progress and even his degree of confidence.
- By comparing the resulting value obtained by the fuzzy grey method with the resulting value of the management method using fuzzy Z-numbers according to forms (3), (4), and (5), we found that the resulting value obtained by the combined fuzzy grey method includes more significant amounts.
- As a result of finding number 2 (larger values of the resulting value) and using forms (8) to (11), we find that the values of cost and schedule performance indicators in the fuzzy grey method are larger, as shown.
- The status of each phase or activity is expressed with degrees of confidence that are not possible with other methods using the fuzzy grey method.
Comprehensive Comparative Analysis of EVM Models under Uncertainty
This part presents a comprehensive comparative analysis of various EVM models used in project performance measurement under uncertainty. The models evaluated include Traditional EVM (TEVM), Fuzzy EVM (FEVM), Grey EVM (GEVM), Z-number EVM (ZEVM), and Grey Fuzzy EVM (GF-EVM). The analysis spans three project phases using three primary metrics: SPI, CPI, and EAC. This part integrates all previous visual and numerical comparisons into a unified report.
Also, higher SPI and CPI values indicate better schedule and cost performance, respectively. Lower EAC suggests more efficient cost forecasting. The SPI and CPI comparisons across EVM models are depicted in the next part.
Comparative Visual Analysis with Data Labels
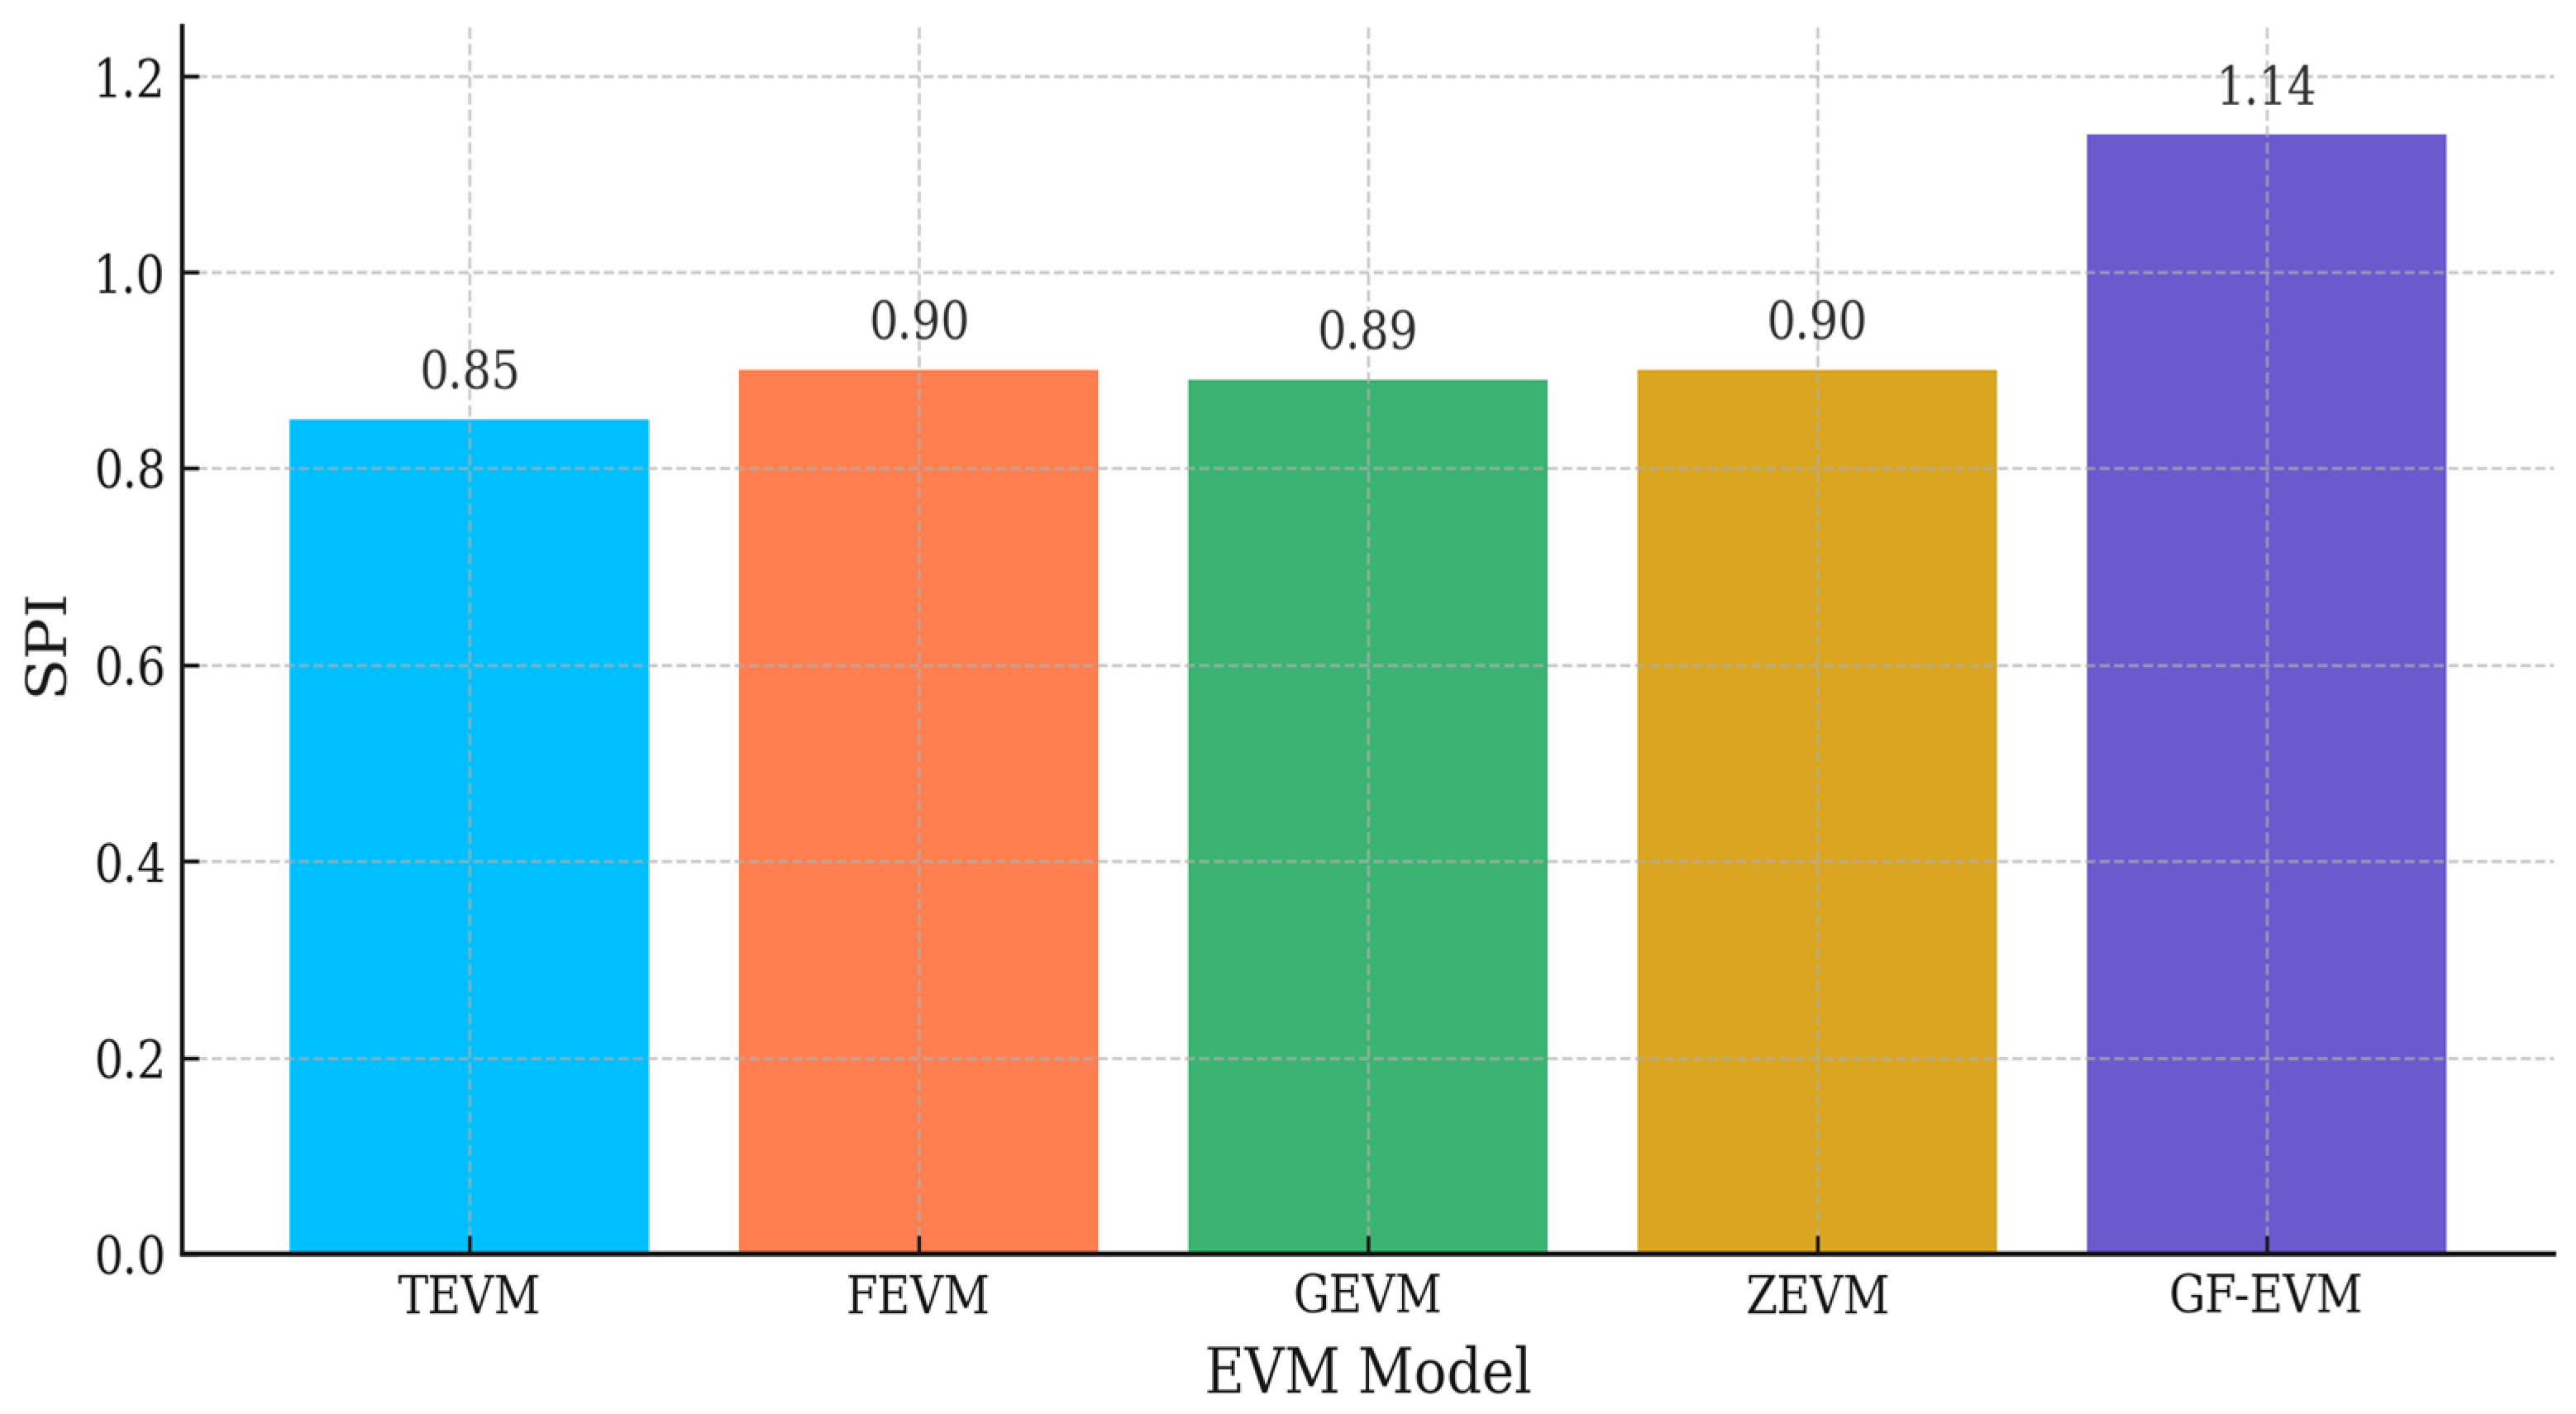
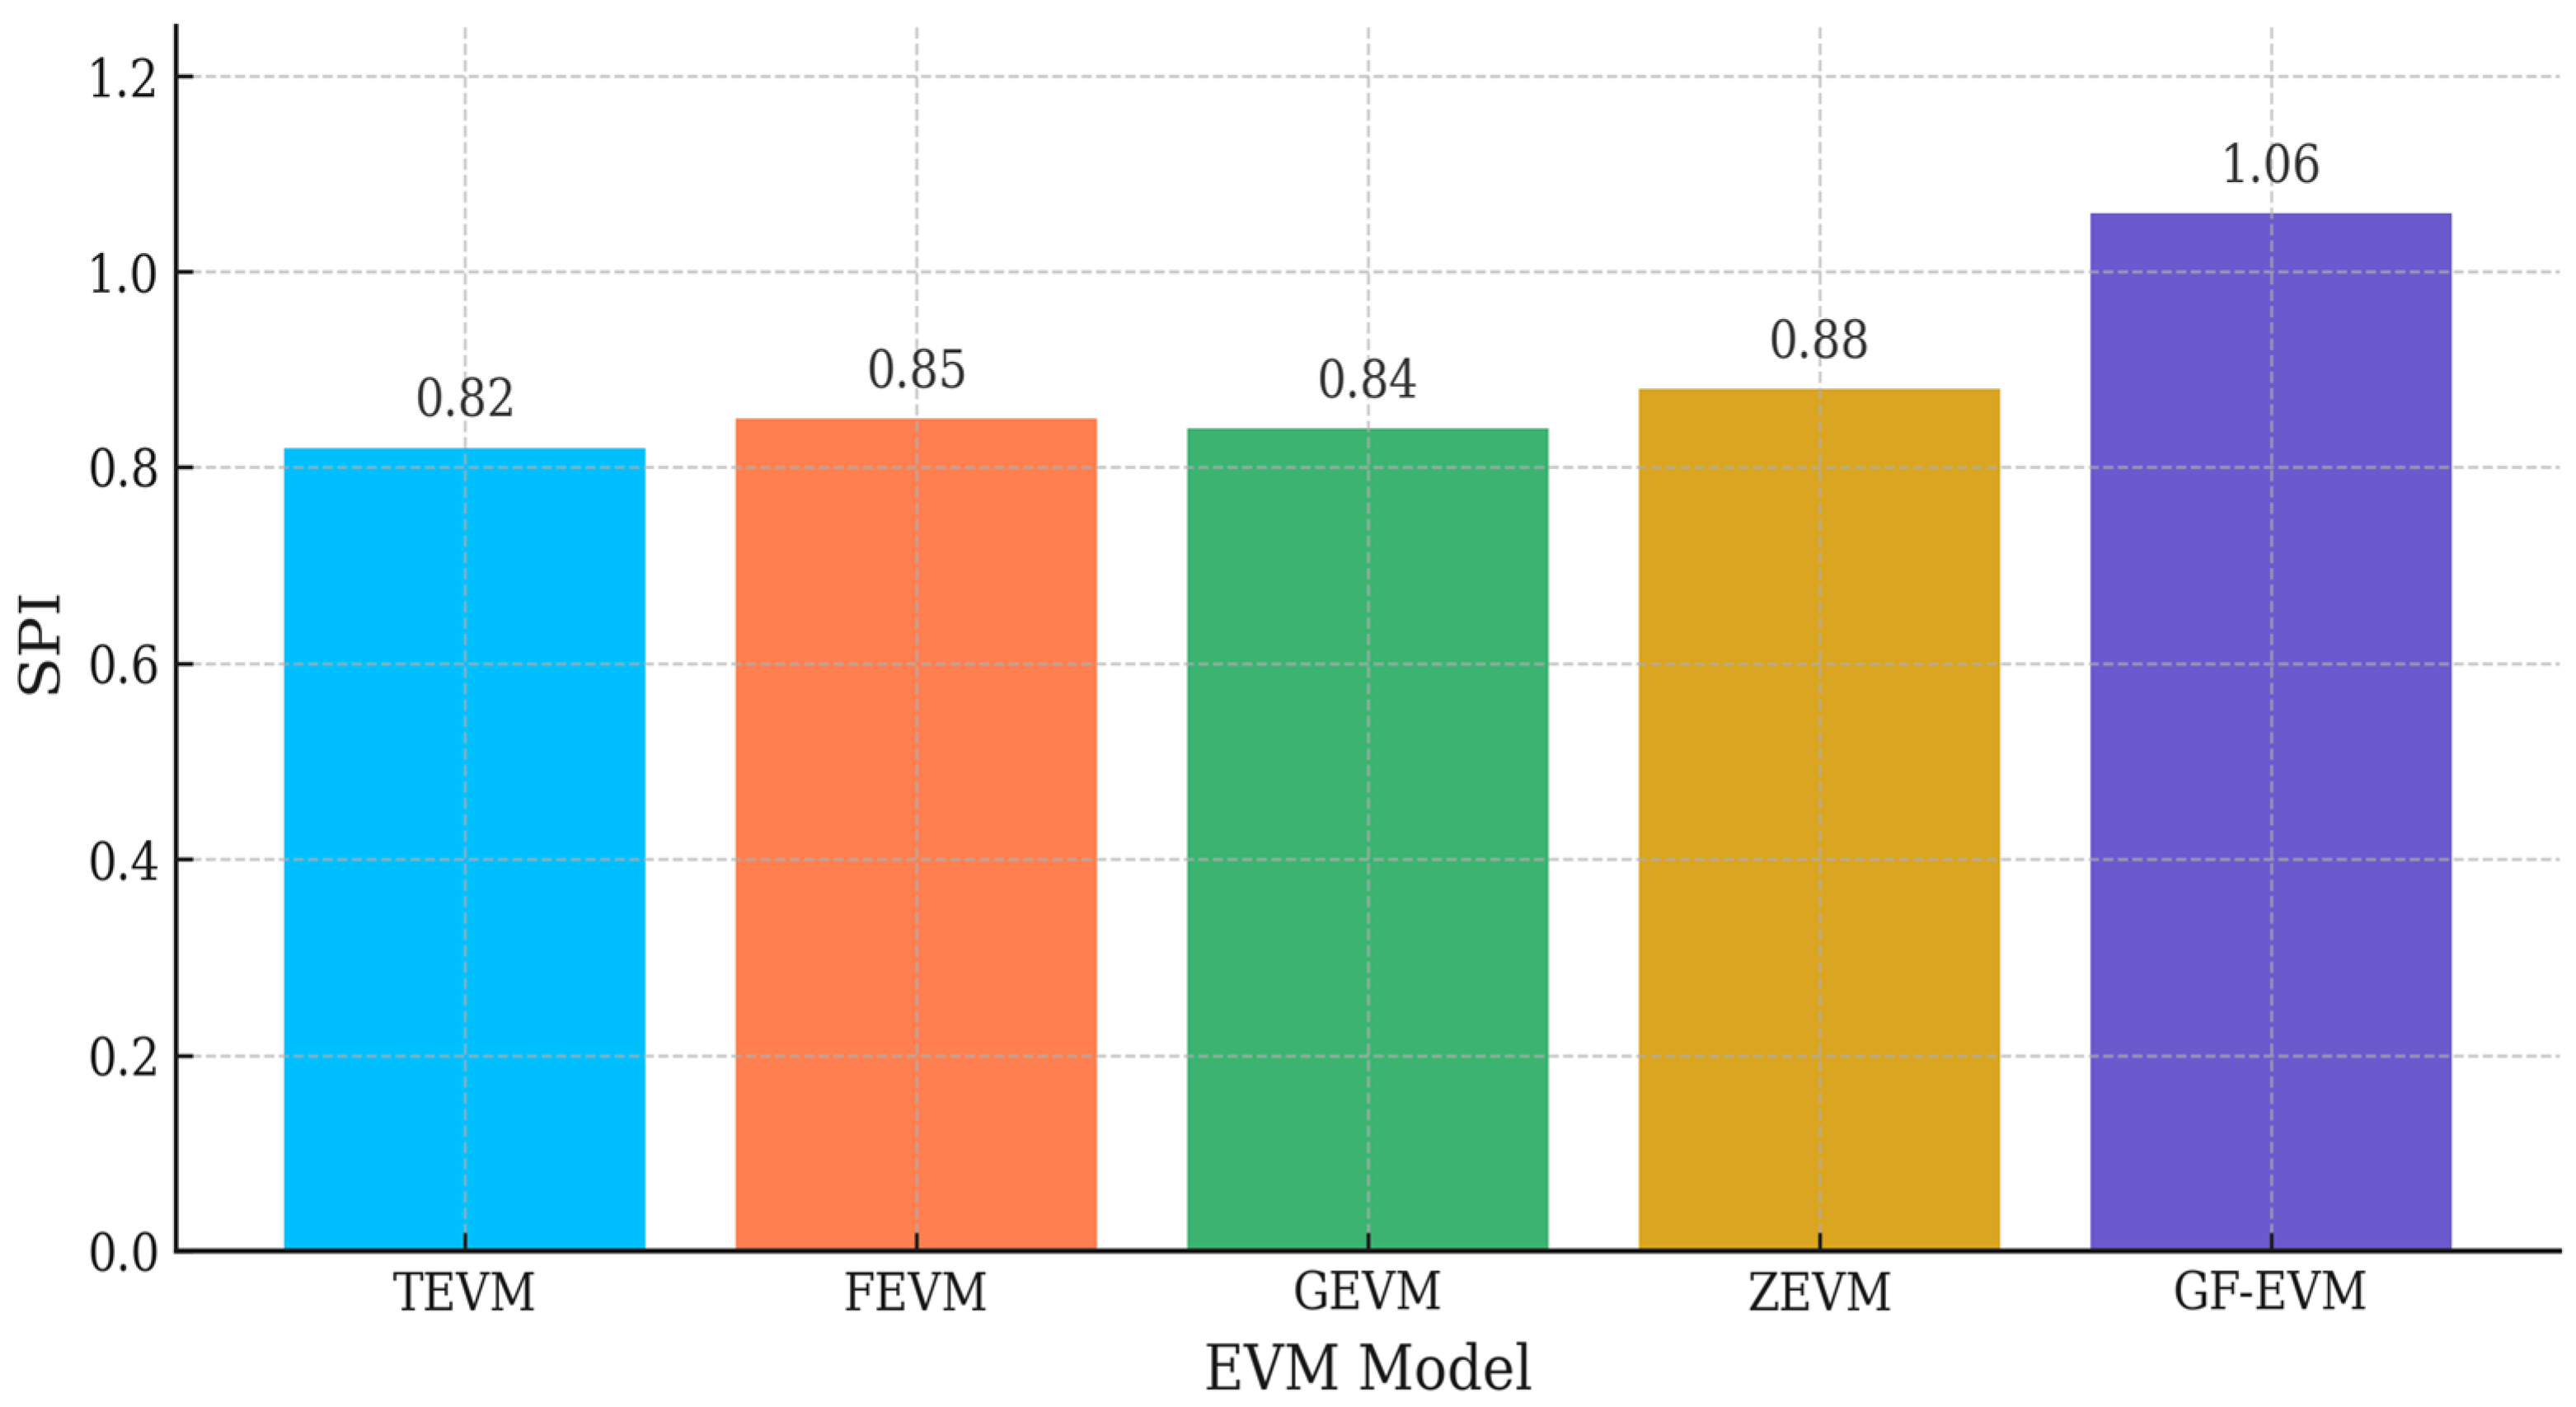
The SPI across EVM models for phase 1 is depicted in Figure 12.
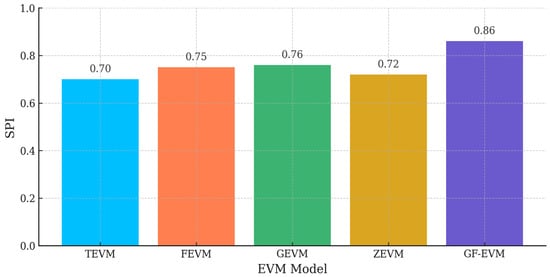
Figure 12.
The SPI across EVM models for phase 1.
GF-EVM achieves the highest SPI in Phase 1, indicating superior schedule forecasting under uncertainty.
The CPI across EVM models for phase 1 is depicted in Figure 13.

Figure 13.
The CPI across EVM models for phase 1.
GF-EVM also leads in CPI for Phase 1, showing better cost efficiency and forecasting precision. The SPI across EVM models for phase 2 is depicted in Figure 14.

Figure 14.
The SPI across EVM models for phase 2.
In phase 2, GF-EVM’s SPI surpasses others, showcasing adaptability to schedule changes. The CPI across EVM models for phase 2 is depicted in Figure 15.
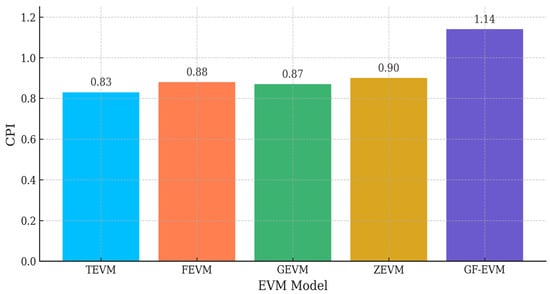
Figure 15.
The CPI across EVM models for phase 2.
GF-EVM continues to excel in CPI for phase 2, suggesting robust cost control capabilities. The SPI across EVM models for phase 3 is depicted in Figure 16.

Figure 16.
The SPI across EVM models for phase 3.
SPI comparison in phase 3 confirms GF-EVM’s consistent lead in schedule performance. The CPI across EVM models for phase 3 is depicted in Figure 17.
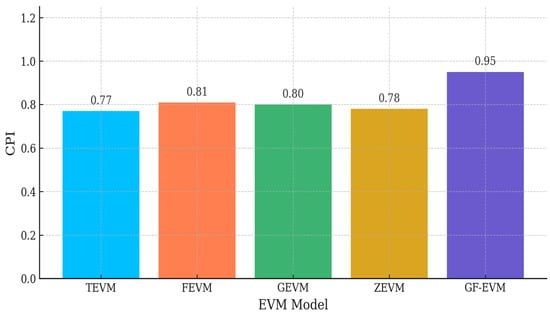
Figure 17.
The CPI across EVM models for phase 3.
CPI comparison in phase 3 illustrates GF-EVM’s sustained edge in cost estimation accuracy.
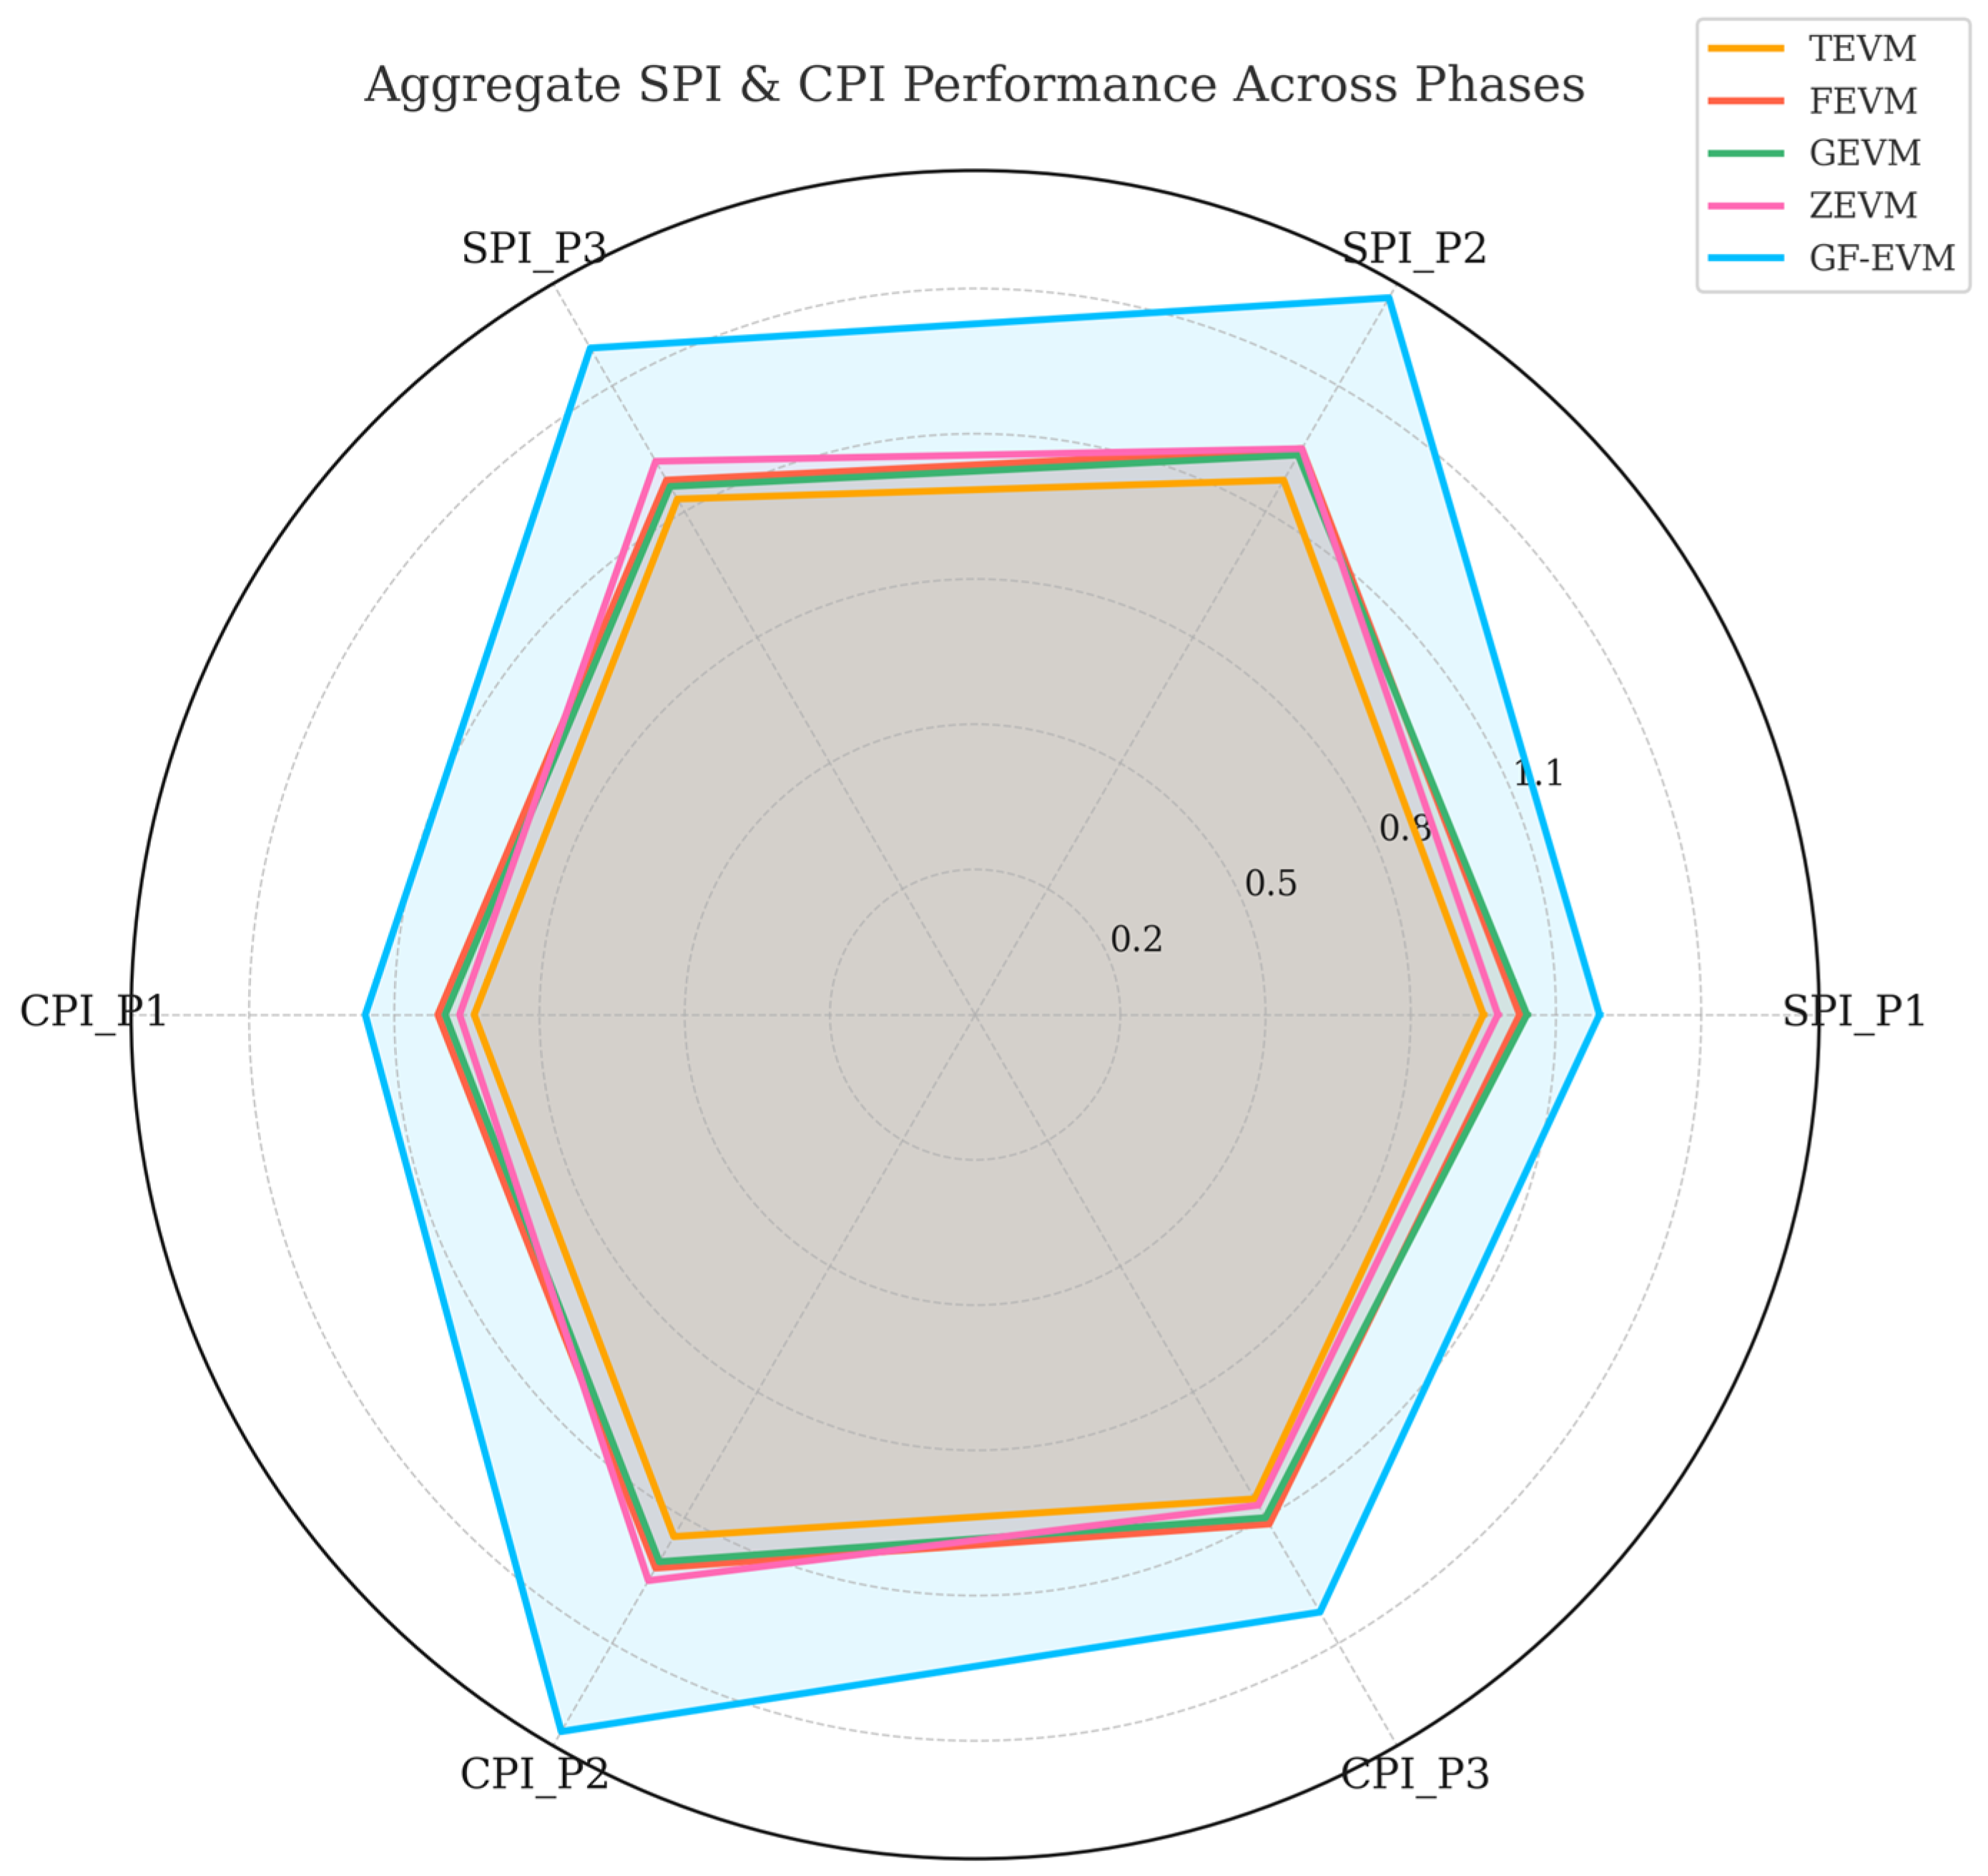
Also, aggregate SPI and CPI performance across phases is shown in Figure 18.
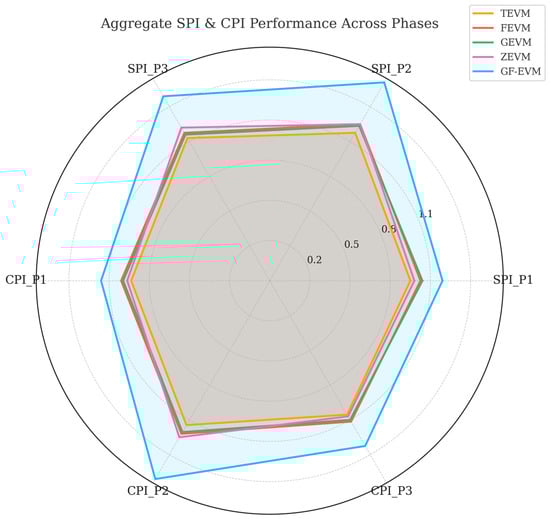
Figure 18.
Aggregate SPI and CPI performance across phases.
Finally, the comparison of EAC across models and phases is illustrated in Figure 19.
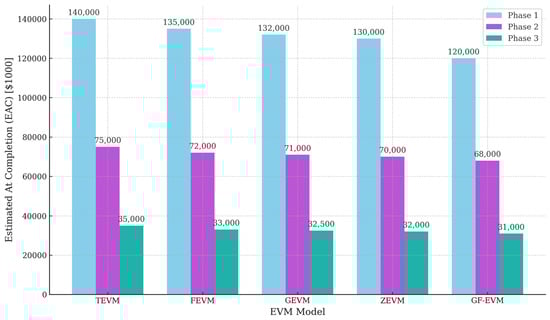
Figure 19.
The comparison of EAC across models and phases.
GF-EVM projects the lowest EAC in all phases, indicating optimal cost prediction.
4.3. Summary and Recommendations
The Grey Fuzzy EVM (GF-EVM) model proves to be the most effective in modeling uncertainty within project management. It surpasses traditional and individual fuzzy/grey/Z-number approaches in both schedule and cost dimensions. For projects with high uncertainty, GF-EVM should be the recommended approach. ZEVM provides a conservative middle ground and can be helpful where risk aversion is prioritized.
5. Discussion and Conclusions
In the current research, the combination of grey and fuzzy theories was used to consider the uncertainties in the expression of the management factors of the resulting value, including the project’s progress. For this purpose, TFNs were used to express the progress of the project, and grey numbers were used to express the uncertainty of the progress amount. In the continuation of this research, using other types of fuzzy numbers, like trapezoidal fuzzy numbers, to express the model’s fuzzy progress is suggested. As the following suggestion, if comparing the model of this research with the resulting value model using Z-numbers infers that ZEVM is stricter, the results will be obtained by comparing this model with the grey resulting value model of GEVM. Also, as was said, this research investigated the uncertainty of progress to benefit from the combination of grey theory in the uncertainty of the budget of project activities. The following discussions can be listed below:
- -
- One of the significant uncertainties in the project management context comes from the uncertainty of progress. This subject could lead to serious financial claims. So, by incorporating the proposed methodology given in this paper, actual progress and, consequently, invoices and financial claims should be efficiently managed.
- -
- This research provides excellent insight for high-level managers who are willing to address the problems that arise due to the uncertainty of progress between the client and contractor.
- -
- The research provides a significant comparative analysis between EV Management under Fuzzy and Grey (FGEVM) and EVM under Z-number (ZEVM) in different situations. The results reveal the superiority of our proposed method.
- -
- The research not only provides an in-depth analysis of cost control systems but also yields proper frameworks for final cost forecasting.
The following further research can be addressed in future studies.
- -
- Addressing fuzzy type 2 integrated with Grey EVM to include the latest advanced fuzzy grey modeling in EVM, not only for cost control purposes but also for forecasting and complex future analysis.
- -
- Developing a decision support system for the research methodology proposed in this paper to automate the process step by step.
- -
- Developing integrated fuzzy grey EVM with the stochastic process to address stochastic conditions in complex project management systems.
Future Research
Although the current study focuses on enhancing the reliability and realism of cost and schedule evaluations under uncertainty through the integration of grey and fuzzy theories, it does not incorporate explicit environmental or sustainability-related performance metrics, such as resource utilization efficiency, energy consumption, waste generation, or carbon emissions. These dimensions are critical components of comprehensive sustainability assessment. They are increasingly relevant in contemporary project environments, particularly in the infrastructure, manufacturing, and energy sectors, where environmental impacts are significant. The term “sustainable” in this research primarily reflects the methodological robustness of the proposed GF-EVM approach in handling epistemic uncertainty and supporting informed, reliable decision making. However, the scope of sustainability can and should be broadened in future work. Specifically, subsequent research could extend the proposed model by embedding quantifiable sustainability indicators into the earned value framework. For example, new metrics could be introduced to measure the environmental cost of delays, the efficiency of resource deployment, or the alignment of project execution with green supply chain practices and regulatory compliance. Furthermore, multidimensional performance indicators—covering economic, environmental, and social pillars of sustainability—could be integrated using advanced MCDM techniques along with the grey-fuzzy structure. This issue would enable project managers to assess trade-offs not only between cost and schedule but also across broader sustainability objectives, thereby moving towards a more holistic and future-ready model of sustainable project management.
Author Contributions
All authors have worked in this paper equally. All authors have read and agreed to the published version of the manuscript.
Funding
No external funding was received.
Data Availability Statement
Data are available upon request.
Conflicts of Interest
There is no conflict of interest.
References
- Nadafi, S.; Moosavirad, S.H.; Ariafar, S. Predicting the project time and costs using EVM based on grey numbers. Eng. Constr. Archit. Manag. 2019, 26, 2107–2119. [Google Scholar] [CrossRef]
- Mortaji, S.T.H.; Bagherpour, M.; Noori, S. Fuzzy earned value management using L-R fuzzy numbers. J. Intell. Fuzzy Syst. 2013, 24, 323–332. [Google Scholar] [CrossRef]
- Hendiani, S.; Bagherpour, M.; Mahmoudi, A.; Liao, H. Z-number based Earned Value Management (ZEVM): A novel pragmatic contribution towards a possibilistic cost-duration assessment. Comput. Ind. Eng. 2020, 143, 106430. [Google Scholar] [CrossRef]
- Kasravi, M.; Mahmoudi, A.; Feylizadeh, M.R. A novel algorithm for solving resource-constrained project scheduling problems: A case study. J. Adv. Manag. Res. 2019, 16, 194–215. [Google Scholar] [CrossRef]
- Avlijaš, G. Using Earned Value Management for more sustainable project schedule control. Manag. J. Sustain. Bus. Manag. Solut. Emerg. Econ. 2022, 27, 12–18. [Google Scholar] [CrossRef]
- Eshghi, A.; Mousavi, S.M.; Mohagheghi, V. A new interval type-2 fuzzy approach for analyzing and monitoring the performance of megaprojects based on earned value analysis (with a case study). Neural Comput. Appl. 2019, 31, 5109–5133. [Google Scholar] [CrossRef]
- Mahmoudi, A.; Bagherpour, M.; Javed, S.A. Grey Earned Value Management: Theory and Applications. IEEE Trans. Eng. Manag. 2019, 68, 1703–1721. [Google Scholar] [CrossRef]
- Mahmoudi, A.; Javed, S.A.; Deng, X. Earned duration management under uncertainty. Soft Comput. 2021, 25, 8921–8940. [Google Scholar] [CrossRef]
- Zadeh, L.A. Fuzzy sets. Inf. Control. 1965, 8, 338–353. [Google Scholar] [CrossRef]
- Lipke, W.H. Software project management. Comput. Phys. Commun. 1999, 17, 17–21. [Google Scholar] [CrossRef]
- Wang, W.P.; Peng, Y.H.; Li, X.Y. Fuzzy–grey prediction of cutting force uncertainty in turning. J. Mater. Process. Technol. 2002, 129, 663–666. [Google Scholar] [CrossRef]
- Wang, Y.F. Predicting stock price using fuzzy grey prediction system. Expert Syst. Appl. 2002, 22, 33–38. [Google Scholar] [CrossRef]
- Anbari, F. Earned value project management method and extensions. Proj. Manag. J. 2003, 34, 12–23. [Google Scholar] [CrossRef]
- Kim, E.H.; Wells, W.G.; Duffey, M.R. A model for effective implementation of Earned Value Management methodology. Int. J. Proj. Manag. 2003, 21, 375–382. [Google Scholar] [CrossRef]
- Henderson, K. Earned Schedule: A Breakthrough Extension to Earned Value Theory? A Retrospective Analysis of Rea. Meas. News 2003, 1, 13–23. [Google Scholar]
- Henderson, K. Further developments in earned schedule. Meas. News 2004, 1, 15–22. [Google Scholar]
- Lipke, W.H. The probability of success. J. Qual. Assur. Inst. 2004, 14, 14–21. [Google Scholar]
- Cioffi, D.F. Designing project management: A scientific notation and an improved formalism for earned value calculations. Int. J. Proj. Manag. 2006, 24, 136–144. [Google Scholar] [CrossRef]
- Chen, H. A fuzzy-grey optimizing prediction model based on the fuzzy membership function. In Proceedings of the 2007 IEEE International Conference on Grey Systems and Intelligent Services, Nanjing, China, 18–20 November 2007; pp. 1028–1030. [Google Scholar] [CrossRef]
- Warburton, R.D.H. A time-dependent earned value model for software projects. Int. J. Proj. Manag. 2011, 29, 1082–1090. [Google Scholar] [CrossRef]
- Naeni, L.M.; Shadrokh, S.; Salehipour, A. A fuzzy approach for the Earned Value Management. Int. J. Proj. Manag. 2010, 29, 764–772. [Google Scholar] [CrossRef]
- Maravas, A.; Pantouvakis, J.P. Project cash flow analysis in the presence of uncertainty in activity duration and cost. Int. J. Proj. Manag. 2012, 30, 374–384. [Google Scholar] [CrossRef]
- Pathak, B.K.; Srivastava, S. Integrated fuzzy–HMH for project uncertainties in time–cost trade-off problem. Appl. Soft Comput. 2014, 21, 320–329. [Google Scholar] [CrossRef]
- Khuman, A.S.; Yang, Y.; John, R. A commentary on some of the intrinsic differences between grey and fuzzy systems. In Proceedings of the International Conference on Systems, Man, and Cybernetics (SMC), San Diego, CA, USA, 5–8 October 2014; pp. 2032–2037. [Google Scholar] [CrossRef]
- Ge, G.; Xie, J. Application of grey forecasting model based on improved residual correction in the cost estimation of university education. Int. J. Emerg. Technol. Learn. 2015, 10, 30–33. [Google Scholar] [CrossRef]
- Guo, L.; Li, H.; Li, P.; Zhang, C. Transaction costs in construction projects under uncertainty. Kybernetes 2014, 45, 866–883. [Google Scholar] [CrossRef]
- Zhao, J.D. A project cost forecasting method based on grey system theory. Chem. Eng. Trans. 2016, 51, 367–372. [Google Scholar] [CrossRef]
- Moradi, N.; Mousavi, S.M.; Vahdani, B. An Earned Value model with risk analysis for project management under uncertain conditions. J. Intell. Fuzzy Syst. 2017, 32, 97–113. [Google Scholar] [CrossRef]
- Wood, D.A. High-level integrated deterministic, stochastic and fuzzy cost-duration analysis aids project planning and monitoring, focusing on uncertainties and earned value metrics. J. Nat. Gas Sci. Eng. 2017, 37, 303–326. [Google Scholar] [CrossRef]
- Amirian, H.; Sahraeian, R. Solving a grey project selection scheduling using a simulated shuffled frog leaping algorithm. Comput. Ind. Eng. 2017, 107, 141–149. [Google Scholar] [CrossRef]
- Amirian, H.; Sahraeian, R. A hybrid integer grey programming for an integrated problem of project selection and scheduling with interval data. J. Ind. Prod. Eng. 2018, 35, 199–213. [Google Scholar] [CrossRef]
- Mensah, G.A. The degree of accuracy and factors that influence the uncertainty of SME cost estimates. Int. J. Constr. Manag. 2018, 19, 413–426. [Google Scholar] [CrossRef]
- Eshghi, V.; Mousavi, S.M.; Antucheviciene, J.; Mohagheghi, V. Earned Value Analysis approach by extending new key performance indicators in a new framework under a grey environment. Econ. Comput. Econ. Cybern. Stud. Res. 2019, 53, 131–150. [Google Scholar] [CrossRef]
- Mirnezami, S.A.; Mousavi, S.M.; Antucheviciene, J.; Mohagheghi, V. A new approach for multi-scenario project cash flow analysis based on TODIM and critical chain methods under grey uncertainty. Econ. Comput. Econ. Cybern. Stud. Res. 2020, 54, 263–279. [Google Scholar] [CrossRef]
- Dahooie, J.H.; Dehshiri, S.J.H.; Banaitis, A.; Binkytė-Vėlienė, A. Identifying and prioritizing cost reduction solutions in the supply chain by integrating value engineering and grey multi-criteria decision-making. Technol. Econ. Dev. Econ. 2020, 26, 1311–1338. [Google Scholar] [CrossRef]
- Azimirad, E.; Ghodsinya, S.R.M. The improvement of uncertainty measurements accuracy in sensor networks based on fuzzy Dempster-Shafer theory. Int. J. Adv. Intell. Inform. 2020, 6, 149–160. [Google Scholar] [CrossRef]
- Dabbaghi, A. Utilization of grey MADM methodology in technology attractiveness assessment: A case study in upstream industry. Indep. J. Manag. Prod. 2020, 11, 2872–2887. [Google Scholar] [CrossRef]
- Leng, L.; Jia, H.; Chen, A.H.; Zhu, D.Z.; Xu, T.; Yu, S. Multi-objective optimization for green-grey infrastructures in response to external uncertainties. Sci. Total Environ. 2021, 775, 145831. [Google Scholar] [CrossRef]
- Deng, J.; Jian, W. Estimating construction project duration and costs upon completion using Monte Carlo simulations and improved Earned Value Management. Buildings 2022, 12, 2173. [Google Scholar] [CrossRef]
- Nejatyan, E.; Sarvari, H.; Hosseini, S.A.; Javanshir, H. Determining the factors influencing construction project management performance improvement through Earned Value-based value engineering strategy: A Delphi-based survey. Buildings 2023, 13, 1964. [Google Scholar] [CrossRef]
- Barrientos-Orellana, A.; Ballesteros-Pérez, P.; Mora-Melià, D.; Cerezo-Narváez, A.; Gutiérrez-Bahamondes, J.H. Comparison of the stability and accuracy of deterministic project cost prediction methods in Earned Value Management. Buildings 2023, 13, 1206. [Google Scholar] [CrossRef]
- Zaneldin, E.; Ahmed, W. A generic framework for managing schedule and cost risks of construction activities using PERT and the EV technique. Buildings 2024, 14, 1918. [Google Scholar] [CrossRef]
- Mayo-Alvarez, L.; Alvarez-Risco, A.; Del-Aguila-Arcentales, S.; Sekar, M.C.; Yáñez, J.A. A systematic review of Earned Value Management methods for monitoring and control of project schedule performance: An AHP approach. Sustainability 2022, 14, 15259. [Google Scholar] [CrossRef]
- Wang, C.; Tang, Y.; Kassem, M.A.; Ong, H.Y.; Yap, J.B.H.; Ali, K.N. Novel quality-embedded Earned Value performance analysis tool for sustainable project portfolio production. Sustainability 2022, 14, 8174. [Google Scholar] [CrossRef]
- Yin, K.; Yang, B.; Jin, X. Grey fuzzy multiple attribute group triangular fuzzy numbers partitioned. Symmetry 2020, 12, 628. [Google Scholar] [CrossRef]


Disclaimer/Publisher’s Note: The statements, opinions and data contained in all publications are solely those of the individual author(s) and contributor(s) and not of MDPI and/or the editor(s). MDPI and/or the editor(s) disclaim responsibility for any injury to people or property resulting from any ideas, methods, instructions or products referred to in the content. |
© 2025 by the authors. Licensee MDPI, Basel, Switzerland. This article is an open access article distributed under the terms and conditions of the Creative Commons Attribution (CC BY) license (https://creativecommons.org/licenses/by/4.0/).