Article

LSTM-Based Time Series Forecasting of User-Derived Quality Signals in Mobile Banking Systems

Department of Management Information Systems, Karadeniz Technical University, Trabzon 61080, Türkiye
Systems 2025, 13(11), 949; https://doi.org/10.3390/systems13110949
Submission received: 19 September 2025 / Revised: 22 October 2025 / Accepted: 24 October 2025 / Published: 25 October 2025

Abstract

Mobile banking applications play a crucial role in providing users with access to financial services, and the quality of user experience is a key factor for their sustainability. This study investigates the predictability of application quality signals derived from user ratings of five leading mobile banking apps in Türkiye. The main problem addressed is understanding how these user-driven quality indicators evolve over time and identifying effective methods for forecasting them. This research problem is critical for understanding how banks can monitor customer satisfaction and reputational risk in real time, as fluctuations in app ratings directly affect user trust and engagement. For this purpose, daily average rating series collected from the Google Play Store were analyzed using LSTM-based time series models, and the results were benchmarked against the seasonal naïve (SNaive) method. The findings show that LSTM consistently achieved lower error rates across all banks, with particularly reliable forecasts for YapıKredi and Akbank, where MAPE values ranged between 16% and 28%. However, low R2 values for some banks suggest limitations in long-term forecasting. The contribution of this study lies in demonstrating that user experience signals in mobile banking can be systematically monitored from a time series perspective, and that LSTM-based approaches provide a more effective method for capturing these quality dynamics.

1. Introduction

With the acceleration of digital transformation, one of the most profound changes in the financial sector has been the transition of banking services to mobile platforms. Mobile banking applications enable users to carry out financial transactions independent of time and place, offering a wide range of services from account management and payments to loan applications and investment instruments [1,2]. Mobile banking, unlike mobile money or mobile payment systems, refers to bank-led digital channels that allow customers to access and manage their existing accounts. It is also distinct from the broader FinTech ecosystem, which includes non-bank innovations such as digital wallets and investment platforms [3]. Consequently, mobile banking has become not only a strategic domain in which banks redesign customer relationships, but also an indispensable component of users’ daily financial lives [4]. These developments highlight that measuring user experience and service quality is critical not only for achieving competitive advantage but also for ensuring sustainable customer satisfaction [5,6].
Despite this strategic importance, limited attention has been given to the temporal evolution and predictability of user satisfaction in mobile banking environments. Most prior studies focus on adoption determinants, while the dynamic nature of user feedback and its predictive modeling remain underexplored. By addressing this gap, the present study contributes to a deeper understanding of how real-time digital signals can inform service improvement and strategic planning in the banking sector.
In the literature, studies on the adoption of mobile banking have primarily focused on factors such as trust, perceived usefulness, ease of use, and expectations for personalized services [7,8]. However, since the vast majority of these studies are based on survey-oriented approaches, they fail to sufficiently capture context-rich insights derived from users’ actual experiences. In contrast, user reviews available in mobile application stores directly reflect issues encountered, interface evaluations, perceptions of performance, and overall satisfaction levels. In recent years, the systematic analysis of such reviews has been shown to make significant contributions to research in software engineering and service quality [9,10,11]. From a theoretical perspective, user-derived quality signals (UDQSs) can be interpreted through established frameworks in service quality and information systems research. According to the expectation confirmation view of user satisfaction [12,13] and the DeLone and McLean IS success model [14,15], perceived performance and satisfaction are central indicators of digital service quality. Ratings and reviews generated by users, therefore, represent post-adoption evaluations that serve as observable signals of perceived service performance in mobile banking environments.
The primary problem addressed in this study is to reveal how quality signals derived from user experiences with mobile banking applications change over time and by which methods these signals can be most effectively predicted. In this study, the response variable is the daily average user rating, representing users’ perceived service quality in mobile banking applications. Time series based on users’ daily average ratings can reflect the impacts of application updates, the integration of new features, or technical failures [16,17]. However, since such data often contain nonlinear structures and long-term dependencies, traditional time series methods (e.g., seasonal naïve) provide only limited predictive power. Deep learning-based methods, particularly Long Short-Term Memory (LSTM) networks, are widely applied in various fields such as finance, healthcare, and social media due to their capacity to model complex dependencies, and they have attracted attention for their strong predictive performance [18,19,20].
This study aims to analyze the daily average rating series obtained from user reviews of five leading mobile banking applications in Türkiye using LSTM-based time series models. Initial findings indicate that LSTM offers lower error rates compared to traditional seasonal naïve methods and provides more reliable forecasts for short-term predictions.
Accordingly, this study seeks to answer the following research question:
RQ. “Can quality signals derived from user experiences with mobile banking applications be effectively predicted using LSTM-based time series methods?”
The contribution of this study to the field is twofold. First, it demonstrates that mobile banking user experiences can be systematically examined not only through cross-sectional survey data but also by leveraging large-scale user feedback from application stores. Second, by introducing a deep learning-based approach to time series analysis, it offers a new methodological perspective for research on user experience. In this respect, the study provides significant contributions to both the academic literature and practitioners in the banking sector by supporting data-driven decision-making processes.
The remainder of the paper is structured as follows: Section 2 provides a detailed discussion of the existing literature. Section 3 describes the dataset, preprocessing steps, and LSTM-based methods employed. Section 4 presents the main results obtained from the analyses. Section 5 interprets these findings in the context of the literature and draws theoretical and practical implications. Section 6 addresses the constraints of the study, while Section 7 summarizes the overall results and provides suggestions for future research.

2. Related Work

The existing body of research on mobile banking applications spans multiple dimensions, ranging from service quality evaluations based on user feedback to methodological advances in forecasting techniques. In particular, user-generated reviews and ratings have been increasingly recognized as rich data sources for understanding customer experiences, while deep learning approaches such as LSTM have gained traction for modeling their temporal dynamics. In this context, the following subsections review relevant studies in three interrelated domains: user reviews and service quality, rating dynamics and release effects, and LSTM-based forecasting of UDQS.

2.1. User Reviews and Service Quality

User reviews available in mobile application stores have become increasingly valuable for both academic and industrial research, as they provide real-time and authentic insights into service quality. Unlike traditional methods such as surveys or laboratory-based experiments, these reviews allow users to share their experiences in a natural and unguided environment. In his 2022 study, Jacek Dąbrowski emphasized that such reviews offer rich content for software engineering tasks, including requirements analysis, bug reporting, and feature suggestions, while also highlighting the challenges of extracting meaningful information from short and often context-free texts [9].
Research on banking applications has shown that app store reviews contain not only information on technical issues but also significant signals regarding the multidimensional aspects of service quality. Alismail and Albesher (2023) examined developer responses to mobile banking app reviews from Saudi Arabia and the United States, demonstrating that the tone and style of these responses play a critical role in shaping user satisfaction [11]. Furthermore, a study analyzing user reviews of mobile banking applications from the five largest banks in Canada, collected from both iOS and Google Play platforms, applied sentiment analysis and topic modeling techniques. This study reported that LSTM-based sentiment classification achieved 82% accuracy on iOS reviews; positive reviews primarily emphasized usability, reliability, and feature appreciation, whereas negative reviews focused on login problems, bugs, and dissatisfaction with updates [21]. Within this body of literature, app store reviews are understood to reflect not only functional problems but also users’ emotional and perceptual experiences [22,23,24]. For instance, expressions such as “fast and easy” indicate a positive user experience, while comments like “constantly crashes” or “stopped working after the update” highlight dissatisfaction and concerns regarding reliability. This field benefits substantially from the application of contextual NLP models, which enable more accurate analysis and, in turn, provide a robust foundation for user-centered improvement processes in software engineering and service management.

2.2. Rating Dynamics and Release Effects

The temporal evolution of user ratings in mobile applications is closely associated with update cycles. Gokgoz et al. (2024) investigated the influence of collective user feedback on subsequent app releases and suggested that user reviews can significantly affect the ratings of upcoming versions [25]. This finding provides strong evidence that updates are directly reflected in users’ evaluations. High-frequency updates have been shown to increase user engagement in utilitarian applications, while in hedonic applications, frequent updates may sometimes create excessive expectations [26]. In this regard, for function-oriented applications such as mobile banking, regular and beneficial updates are particularly important. From an alternative perspective, user feedback is not only linked to technical fixes but also to the communication style and the quality of release notes. In other words, users evaluate not merely the resolution of issues but also the clarity of the information provided. Moreover, natural signals of user satisfaction are often reflected early through reviews and ratings, which can directly influence update decisions.
Nevertheless, the literature also points to complexities that extend beyond the technical dimension of updates, encompassing users’ perceptual reactions. The study by Hazarika et al. (2025) demonstrated that technological frustration and user passion directly affect the temporal changes in ratings and reviews, highlighting that post-update frustrations may increase dissatisfaction [27]. This indicates that developers must consider not only technical improvements but also user motivations. Furthermore, creating a sense of “pleasant surprise” or fostering perceptions of security after updates can generate positive shifts in rating dynamics. Indeed, improvements in perceived security and convenience have been found to significantly enhance mobile banking app ratings [28]. This suggests that technical security measures and usability enhancements are directly reflected in user evaluations. When users recognize improvements in security or convenience in new versions, such perceptions are positively translated into app store ratings. In summary, post-update rating increases depend not only on technical performance but also on the perceived trust and ease of use experienced by users. From another perspective, rating volatility can be linked to the content, intensity, and distribution of user reviews. Periods of intense negative feedback may result in sharp declines in ratings, whereas consistency in review distribution tends to support rating increases [29,30]. Particularly in mobile banking applications, where customer experience is critical, the stability of review distribution following an update is a decisive factor in rating dynamics [31]. For instance, if only a few positive ratings are entered after an update, their impact may remain limited; however, a greater number of reviews that are also rich in content can substantially elevate ratings.
In addition, the user-centered language and clarity of release notes can also influence rating dynamics [32]. When users clearly understand which issues have been resolved or what new features have been introduced, this perception is reflected in their ratings. Thus, release notes evolve from being a purely technical information tool into a communication instrument that shapes the overall user experience.

2.3. LSTM-Based Forecasting of User-Derived Quality Signals

LSTM-based time series forecasting models have emerged as a powerful tool for understanding the dynamics of UDQS, such as user ratings. Compared with traditional methods, LSTM models demonstrate superior performance in capturing long-term dependencies; Siami-Namini and Siami Namin (2018) showed that LSTM outperformed classical models such as ARIMA, achieving 84–87% lower error rates [33]. A comprehensive study on the success of deep learning architectures in time series forecasting further emphasized that LSTM and CNN models produced the most accurate predictions, with LSTM exhibiting the highest overall performance [34]. Moreover, LSTM has been successfully applied in application usage data and evaluation scenarios, such as forecasting mobile app usage and optimizing system performance [35]. In this respect, LSTM models provide suitable solutions for accurately predicting time-varying user perceptions such as mobile app ratings.
Beyond time series forecasting, deep learning approaches have also been widely employed for rating prediction in recommender systems and user feedback modeling. These studies explore how temporal patterns, contextual factors, and user-item interactions can be leveraged to estimate future ratings. For example, recurrent neural architectures such as LSTM and GRU have been used in recommendation/rating prediction settings (e.g., in collaborative filtering systems) to model sequential user behavior [36,37]. Similarly, transformer-based models have recently achieved state-of-the-art performance by integrating attention mechanisms to better model long-range dependencies in user-item interactions [38]. These findings collectively indicate that neural sequence models can generalize well across domains where UDQS evolve over time, thus providing a strong methodological rationale for applying LSTM to forecast app rating dynamics in mobile banking systems.
The success of LSTM stems from its cell and gating mechanisms, which enable the retention of past information in long-term memory, effectively addressing the vanishing gradient problem and allowing the model to capture long-range dependencies [39,40,41]. Furthermore, in advanced architectures such as LSTM-attention-LSTM, the addition of attention mechanisms to encoder–decoder structures allows relationships over longer input sequences to be effectively modeled; such models have been shown to achieve higher accuracy than conventional LSTM in various reactive time series tasks [42]. Nonetheless, relying solely on LSTM for complex time series may limit model performance. Mahmoudi (2025) argued that integrating LSTM with methods such as dynamic system analysis can yield deeper and more robust insights [43]. Applying these approaches to data-driven UDQS, such as mobile banking app ratings, can be effective in detecting fluctuations and trend shifts at an early stage. Systematic data preprocessing, appropriate window size selection, and model hyperparameter optimization substantially improve LSTM performance, while the incorporation of attention mechanisms enables more precise identification of latent triggers [40,44]. Moreover, LSTM-based models often outperform traditional approaches such as seasonal naïve in short-term error metrics (e.g., RMSE or MAPE), thereby offering a predictive advantage in high-impact user feedback scenarios such as mobile app ratings [45].
The recent literature clearly demonstrates that the LSTM approach provides a highly effective methodology for capturing and forecasting temporal changes in UDQS. With advanced architectures such as encoder–decoder and attention mechanisms, the sensitivity of the model can be further enhanced. In this context, applying LSTM-based models to mobile banking application rating data not only achieves success in short-term forecasting but also lays the groundwork for deeper perceptual and behavioral analysis.
The reviewed literature (Table 1) highlights that user reviews in app stores provide valuable insights into service quality, extending beyond technical issues to encompass perceptions of usability, reliability, and emotional experiences. Studies have shown that developer responses, update cycles, and perceived security directly influence user ratings, while recent works apply NLP and sentiment analysis to extract richer signals from textual reviews. Moreover, deep learning methods, particularly LSTM networks, have consistently demonstrated superior forecasting performance over traditional approaches in time series applications across multiple domains. Despite these advances, existing research has not sufficiently addressed the temporal predictability of quantitative UDQS (such as daily average ratings) in mobile banking apps, nor systematically compared deep learning forecasts with classical benchmarks in this context. This study fills that gap by applying LSTM-based forecasting to app rating dynamics, thereby bridging insights from service quality research with time series modeling and offering a new methodological perspective for understanding and predicting user experience in mobile banking.

3. Materials and Methods

This section outlines the methodological framework of the study. It begins with a description of the data source and preprocessing steps, followed by details of the models employed, the hyperparameter optimization process, and the evaluation metrics used.

3.1. Dataset and Preprocessing

The dataset for this study was collected using the Google Play Scraper library, which enables systematic extraction of publicly available app store data (Table 2). Five leading mobile banking applications in Türkiye were selected, namely İşbank with its app İşCep, YapıKredi, Garanti BBVA, Akbank, and Ziraat Bank. The selection of these applications was based on two main reasons. First, these banks represent the largest commercial institutions in Türkiye and cover the majority of active mobile banking users [46]. Second, their applications are among the most downloaded and frequently updated financial apps in the Google Play Store [47,48]. These characteristics make them suitable candidates for the large-scale examination of UDQS.
The reviews span the period between 17 June 2014 and 16 August 2025 (Istanbul local time). After removing duplicates and non-Turkish entries, the final corpus comprised 242,504 user reviews: İşbank (İşCep, 50,007), Yapı Kredi (50,012), Garanti BBVA (50,014), Akbank (50,012), and Ziraat Bank (42,459). Each record included the user’s star rating, review text, app version, and timestamp. During preprocessing, duplicate and near-duplicate review_ids were eliminated; only Turkish-language entries (scrape_lang = “tr”) were retained; empty or bot-like comments were removed; and all timestamps were converted from UTC to Istanbul local time (at_utc, at_ist). Ratings were aggregated to a daily frequency by computing weighted daily mean values based on the number of reviews submitted each day. Days without activity were explicitly retained to preserve temporal continuity. Finally, all numerical features were standardized on the training subset RobustScaler for input variables and MinMaxScaler for rating targets, yielding two aligned daily series per bank, average rating and review volume, which were subsequently used for model training and evaluation.
From the raw dataset, daily average star ratings were computed for each application. This metric was selected because it reflects the aggregated perception of service quality in a time-varying manner and allows direct comparison across applications. In order to reduce distortion from days with very low user activity, daily averages were weighted by the number of reviews submitted on the corresponding day. Missing days were explicitly represented in the series, and outliers such as duplicate or bot-generated reviews were removed.
All timestamps were converted to Istanbul local time (IST) to ensure consistency across reviews. The resulting time series for each bank consisted of two main signals. The first was the daily average rating, which reflects the perceived service quality. The second was the daily review volume, which indicates the intensity of user engagement. Before modeling, the dataset was divided chronologically into training and test subsets. Approximately eighty five percent of the observations were used for model training and the remaining fifteen percent were reserved for evaluation. This temporal split ensures that only past data are used for model training, while unseen future observations are reserved for testing, providing a realistic forecasting setup. To support model convergence, all series were standardized using z-score normalization based only on the training set. This prevented data leakage from the test set into the training process.

3.2. Benchmark Model: Seasonal Naïve (SNaive)

The seasonal naïve method is regarded as one of the simplest yet most powerful benchmarking approaches in time series analysis. In this method, each observation is forecasted as the direct repetition of the value from the same seasonal period in the past [49]. For instance, in a series based on daily data, today’s value would be predicted using the value from the same day in the previous week. This approach provides a reasonable forecast, particularly for time series with pronounced seasonality. The main advantage of the method is that it does not require parameter estimation and can be implemented rapidly. Moreover, no transformation of the dataset is necessary, which further enhances its ease of application [50,51]. In series that may contain periodic fluctuations, such as mobile application user ratings, the seasonal naïve method offers a simple yet effective reference point.
To evaluate the performance of more complex models, their predictive accuracy is often compared first against this baseline. In this context, the seasonal naïve method provides a strong benchmark for advanced deep learning models such as LSTM. In the literature, this approach is frequently reported alongside other fundamental models such as ARIMA or ETS as a standard benchmark [52,53]. The simplicity of the method ensures that it provides an interpretable baseline when assessing predictive performance. From a research perspective, if an advanced model only marginally outperforms the seasonal naïve approach, the significance of such improvement becomes questionable. Particularly in short-term forecasting, the seasonal naïve method may often demonstrate surprisingly high accuracy. Therefore, it serves as a reliable threshold for testing the accuracy and error rates of newly developed models [54]. Considering that UDQS in mobile banking applications may also exhibit recurring weekly or monthly patterns, the seasonal naïve method constitutes an appropriate baseline in this context. Its simplicity allows comparisons across series from different banks using a standardized procedure. Furthermore, its low computational cost enables rapid application across numerous scenarios. For these reasons, the seasonal naïve method plays a critical role in highlighting the methodological contribution of this study.

3.3. LSTM Model Development

The Long Short-Term Memory (LSTM) model was introduced as an alternative to traditional recurrent neural networks (RNNs) [55], particularly to overcome the vanishing and exploding gradient problems observed in long sequential data [39,56,57]. The key innovation of the model is its gating mechanism, which enables the regulation of information flow over time. Each LSTM cell consists of three gates: the forget gate, the input gate, and the output gate (Figure 1). The forget gate determines how much of the past information should be discarded, the input gate controls the proportion of new information to be added to the cell state, and the output gate regulates which part of the cell state is transferred to the hidden state. These operations are mathematically expressed as follows:
f t =   σ W f x t +   U f h t 1 +   b f  
i t = σ W i x t + U i h t 1 + b i
c ~ t = t a n h   ( W c x t + U c h t 1 + b c )
o t = σ   ( W o x t + U o h t 1 + b o )
c t = f t     c t 1 + i t     c ~ t
h t = o t   t a n h ( c t )
where σ denotes the sigmoid activation function, t a n h the hyperbolic tangent function, and the element-wise multiplication. This mechanism enables the model to capture both short-term fluctuations and long-term dependencies in time series data.
In this study, the LSTM architecture was implemented as a two-layer stacked network. The first layer was designed with a larger number of units and configured to return sequences, thereby passing temporal information to the second layer. After this layer, normalization was applied to stabilize the training process, and dropout was employed to reduce overfitting [58]. The second LSTM layer contained fewer units than the first, allowing the learned representations to be compressed into a more compact form [59]. Finally, a dense output layer was added to transform the hidden representation into the final prediction. Since the user score series was scaled to the [0, 1] range, a sigmoid activation function was used at the output layer, whereas for the log-transformed volume series, a linear activation function was adopted.
With this design, the LSTM network is able to learn from daily time series, selectively retain relevant past patterns, and generate meaningful forecasts. The two-layer architecture, supported by dropout and normalization, enables the model to capture complex seasonal and trend-related structures while maintaining strong predictive performance.
In this configuration, the model input was defined as a univariate time series to ensure methodological simplicity and interpretability. The LSTM network was trained exclusively on daily average rating values derived from user reviews, without incorporating auxiliary variables such as review volume, app version, or sentiment indicators. This approach allows the model to concentrate solely on the intrinsic temporal dynamics of the user-derived quality signal, thereby isolating its predictive capacity from potential external influences.

3.4. Hyperparameter Optimization

Hyperparameter optimization was carried out via random search; the search space and fixed training settings are summarized in Table 3 and Table 4, respectively. For each bank and target series, a fixed number of trials was executed in which window length, hidden units, dropout, mini-batch size, learning rate, and epoch count were sampled from the search space. The data were split into training and test sets while preserving temporal order, and supervised tensors were rebuilt for each window length. Validation was performed on the terminal portion of the training set to respect chronology; when this was not feasible, an internal validation split was employed. The optimization objective was to minimize the validation Huber loss, and the best configuration was selected as the model achieving the lowest validation loss. Training used Adam with the learning rate drawn from the search space. To mitigate overfitting, early stopping was enabled; when the loss plateaued, the learning rate was automatically reduced. Feature scaling was fit only on training statistics to prevent leakage.
Output layers and target transformations were aligned with the target type: the rating series was modeled on a bounded scale, whereas the volume series was modeled on a log-transformed scale, with the appropriate inverse transformations applied at evaluation. Trials with insufficient sequence length were excluded on robustness grounds. The selected model generated test-period forecasts, performance metrics were computed, and results were archived in tabular form. Training histories were retained for loss-curve visualization. For benchmarking, a seasonal naive baseline with weekly seasonality was constructed, although model selection relied solely on validation loss. When hyperparameter optimization was disabled, a compact grid search served as a fallback. Randomness sources were fixed to ensure reproducibility. This design yields a comparable and reliable selection-and-evaluation pipeline across banks and target series.
In this study, we focused on comparing a modern nonlinear sequence model (LSTM) with a simple yet strong seasonal baseline (SNaive). The primary objective was to examine whether a deep learning model could capture temporal dynamics beyond a classical seasonal pattern, rather than to perform a full benchmarking across all forecasting families. Other forecasting approaches, such as ARIMA, GRU, and hybrid ensemble models, were not included for two main reasons. First, ARIMA-type models require manual order selection and stationarity diagnostics for each time series, which makes them less scalable across multiple banks and targets. Second, GRU and hybrid deep models have been shown in prior studies to produce results highly comparable to LSTM when tuned under similar conditions, offering only marginal gains at the cost of higher complexity [34,60]. For the sake of reproducibility and interpretability, the comparison was limited to LSTM and SNaive only. Potential extensions could incorporate GRU, ARIMA, hybrid, or transformer-based architectures in future studies, particularly for multi-step or multivariate forecasting.

4. Results

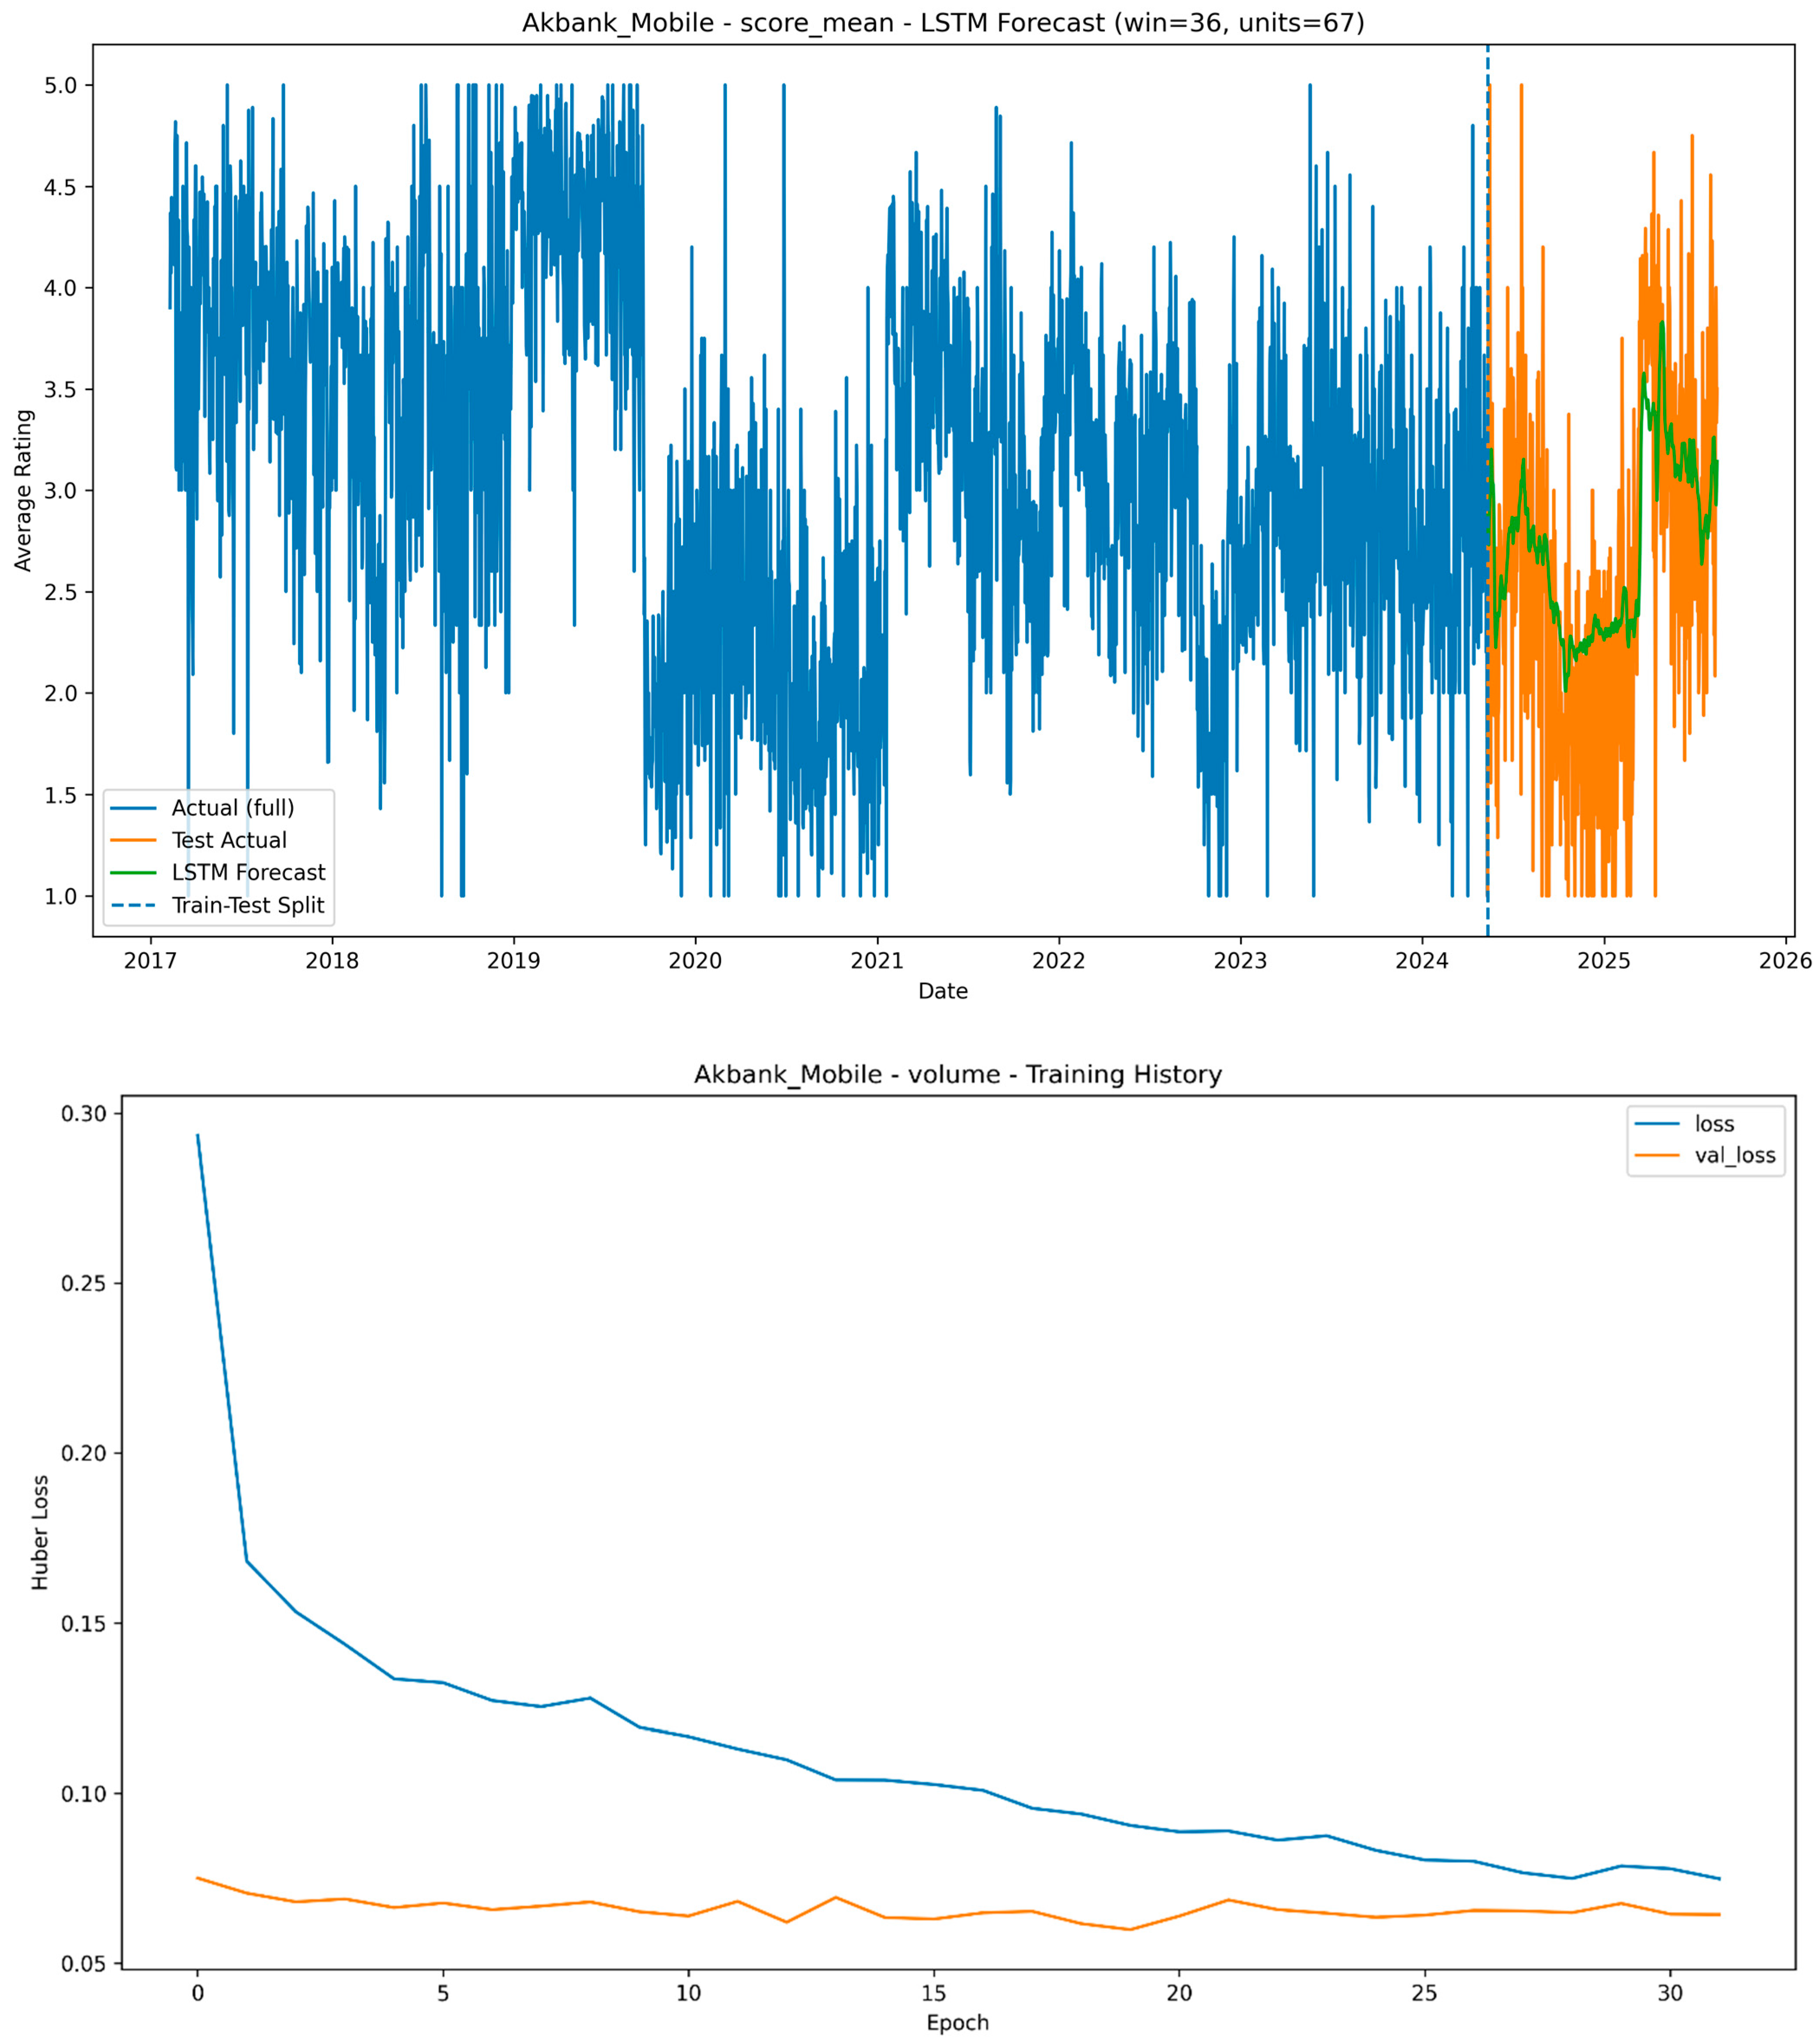
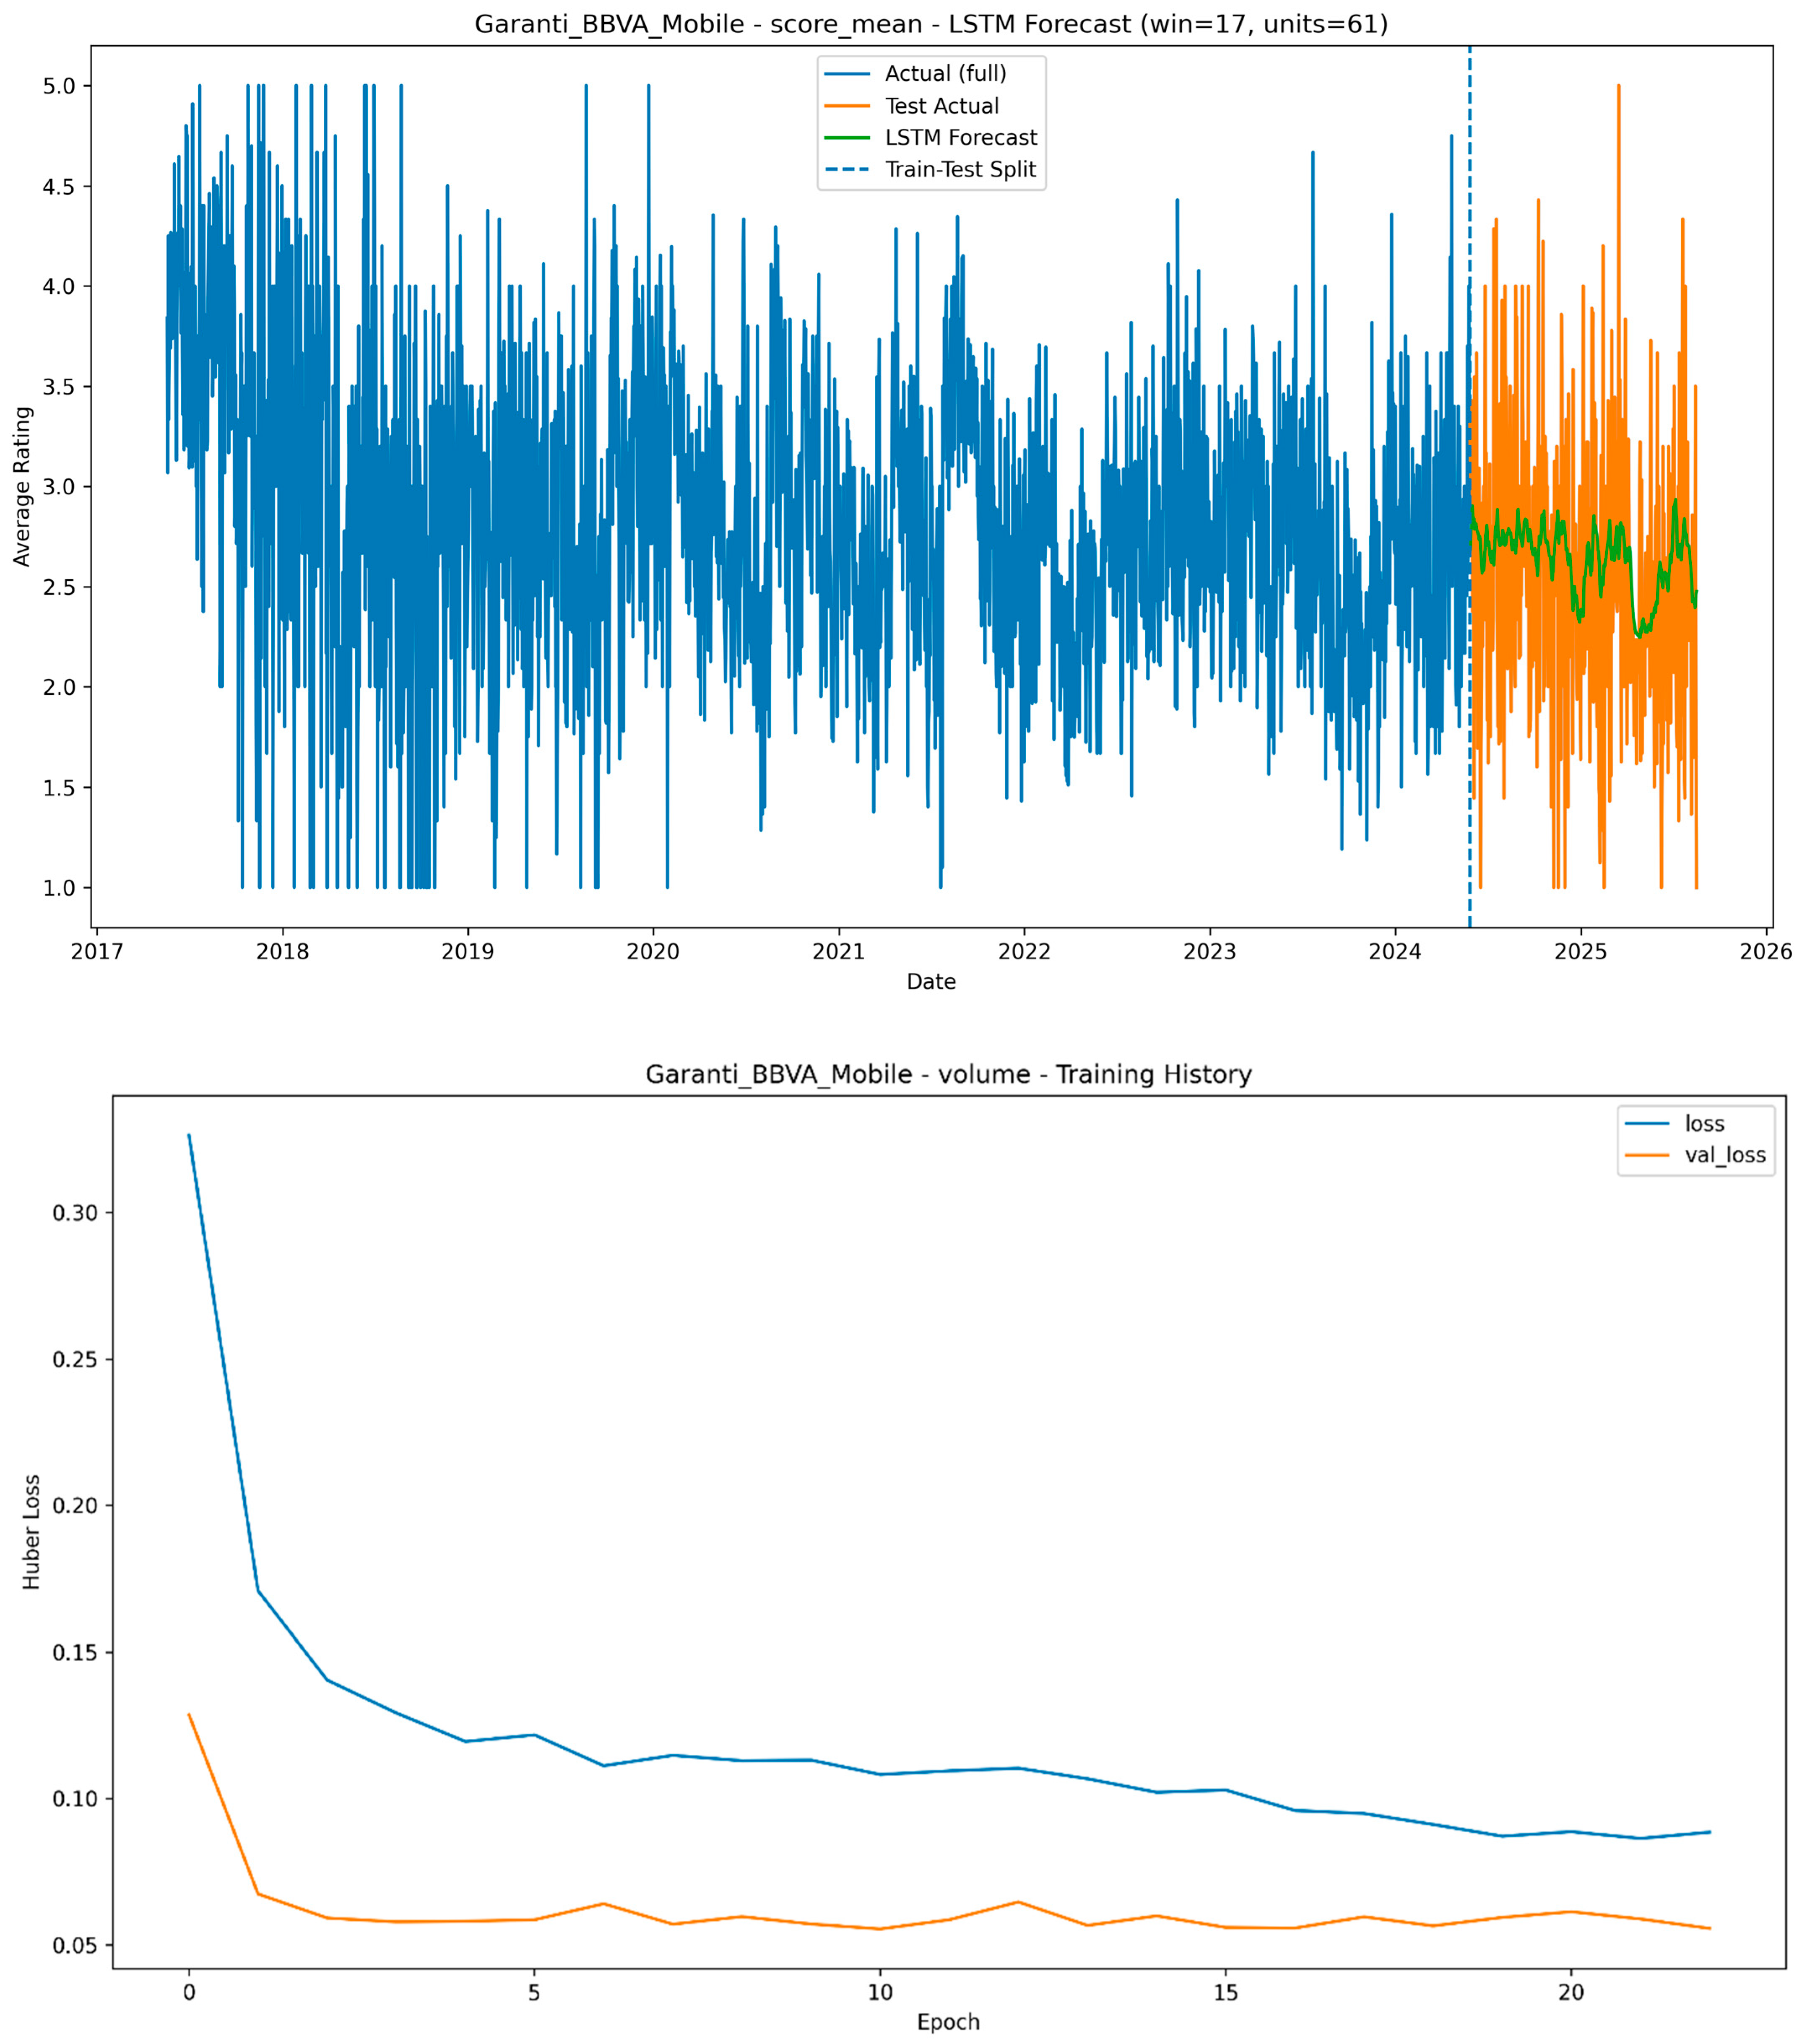
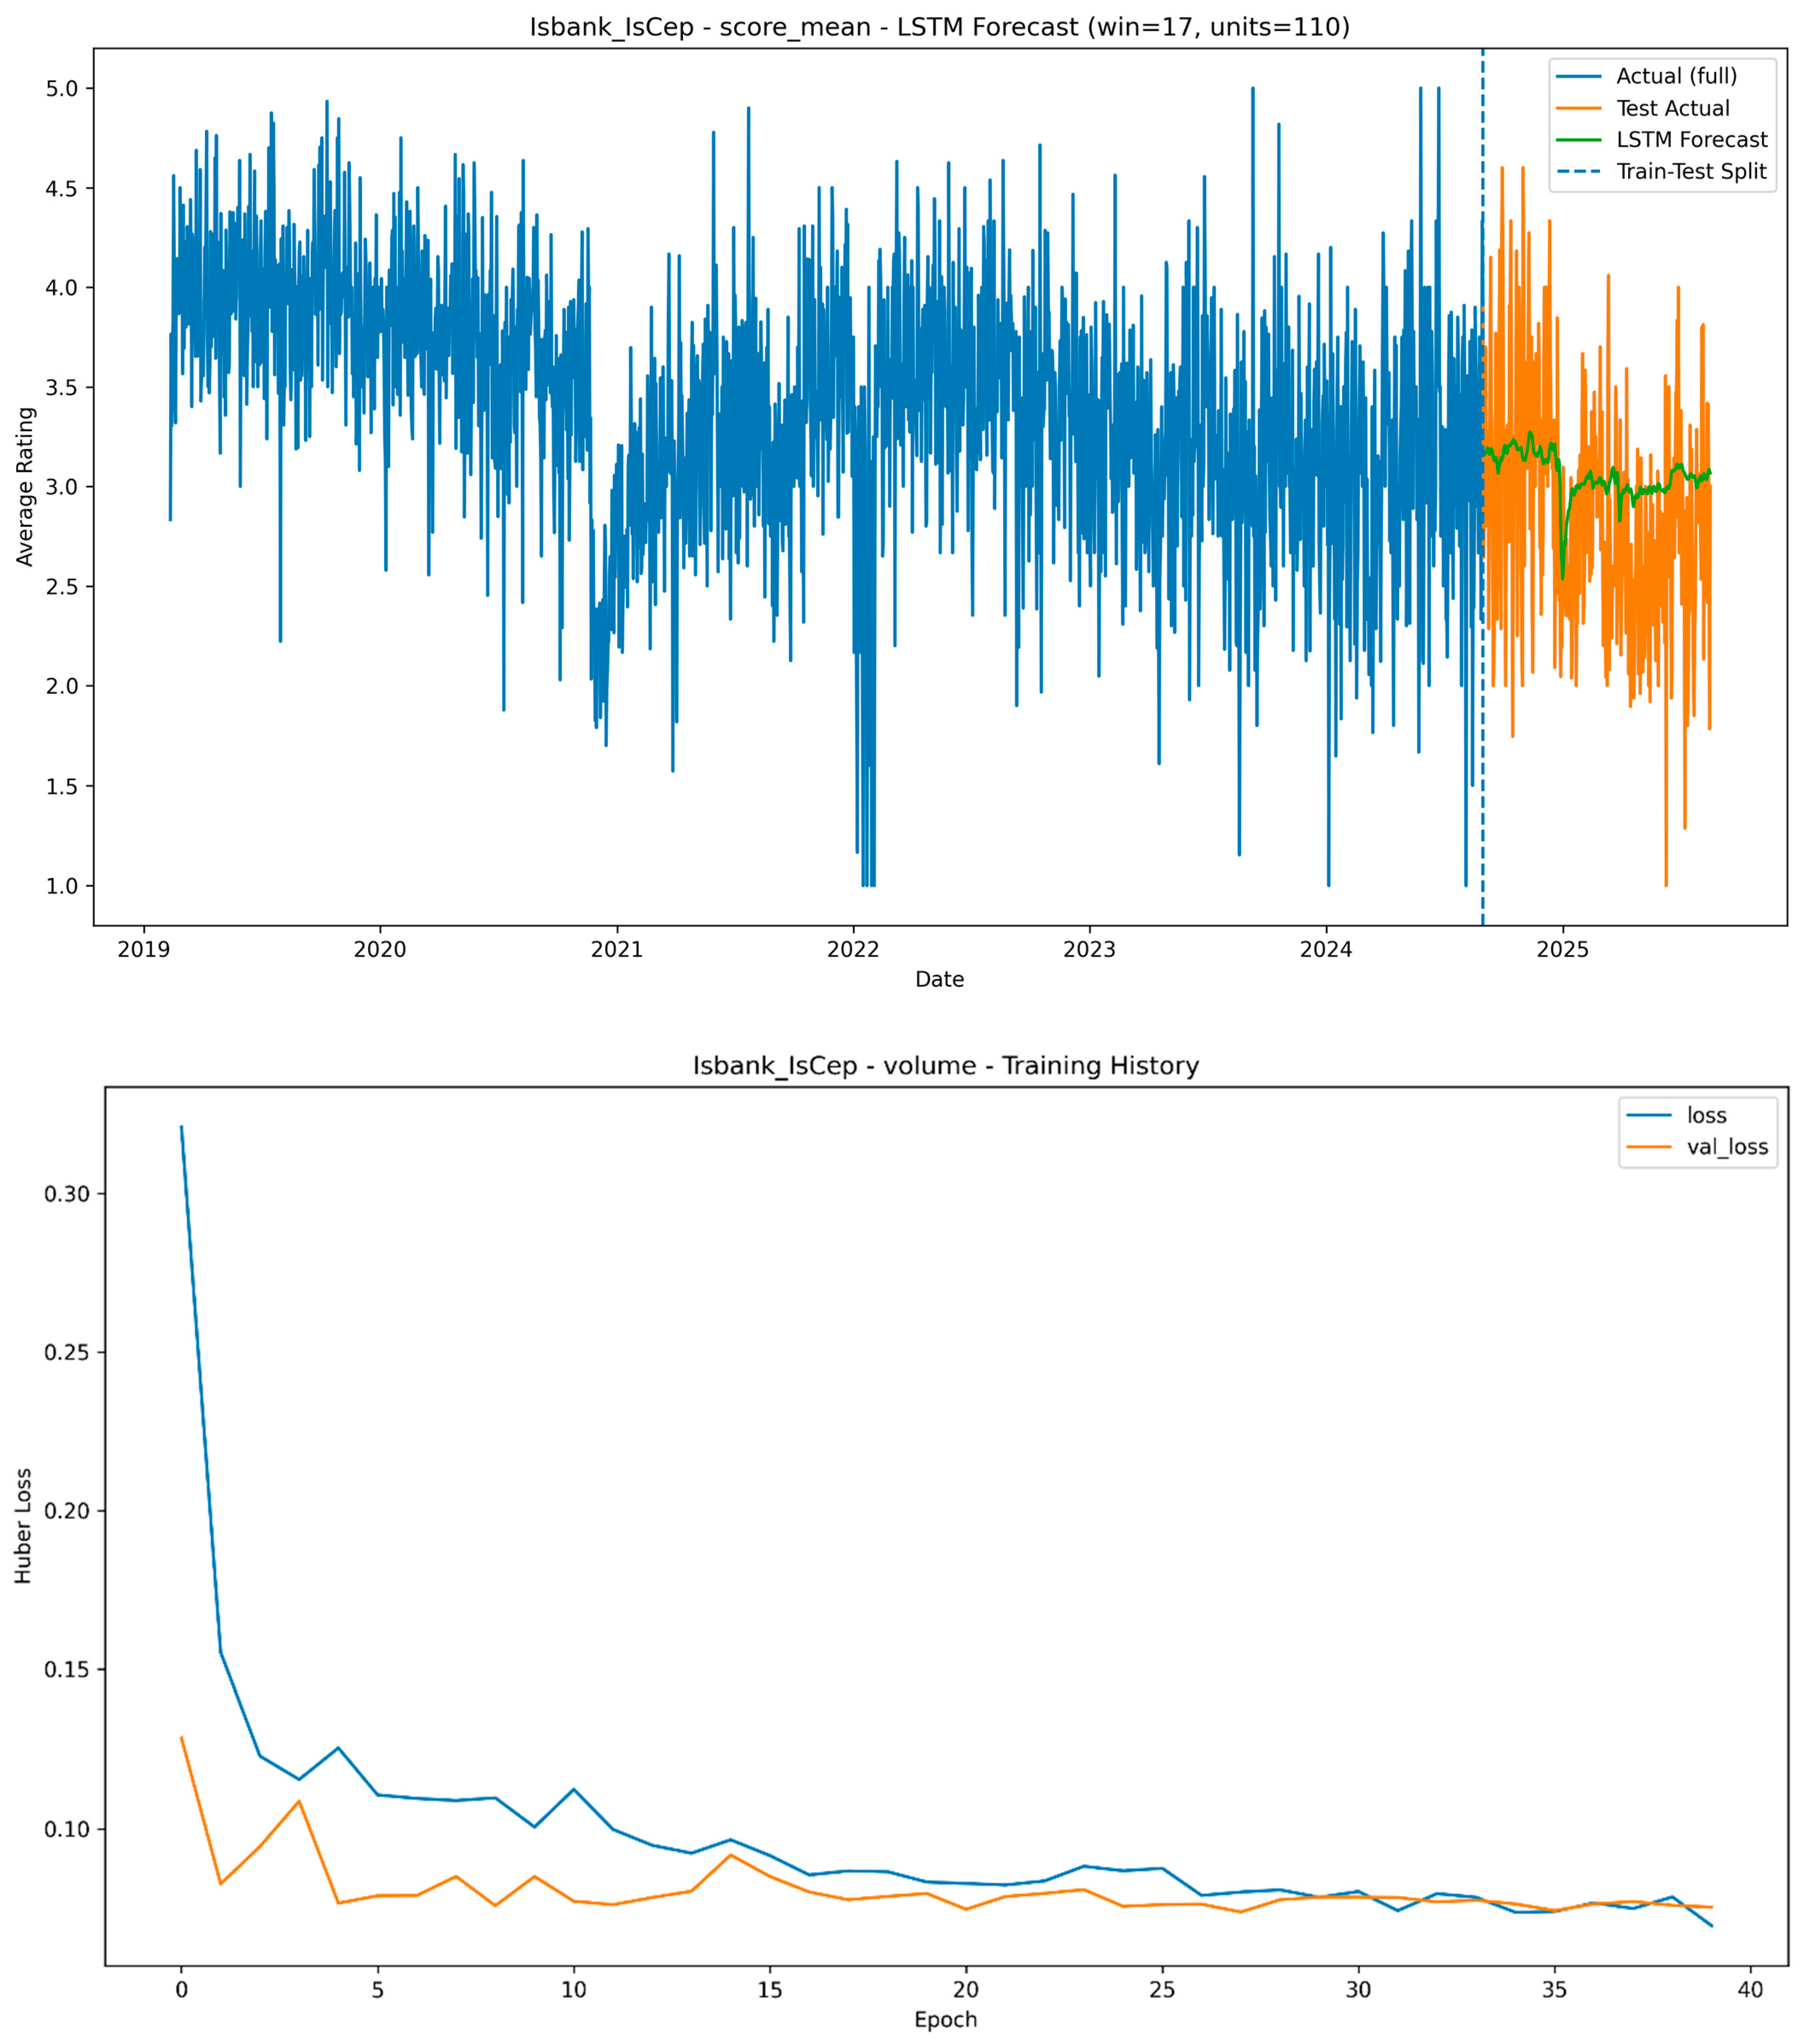
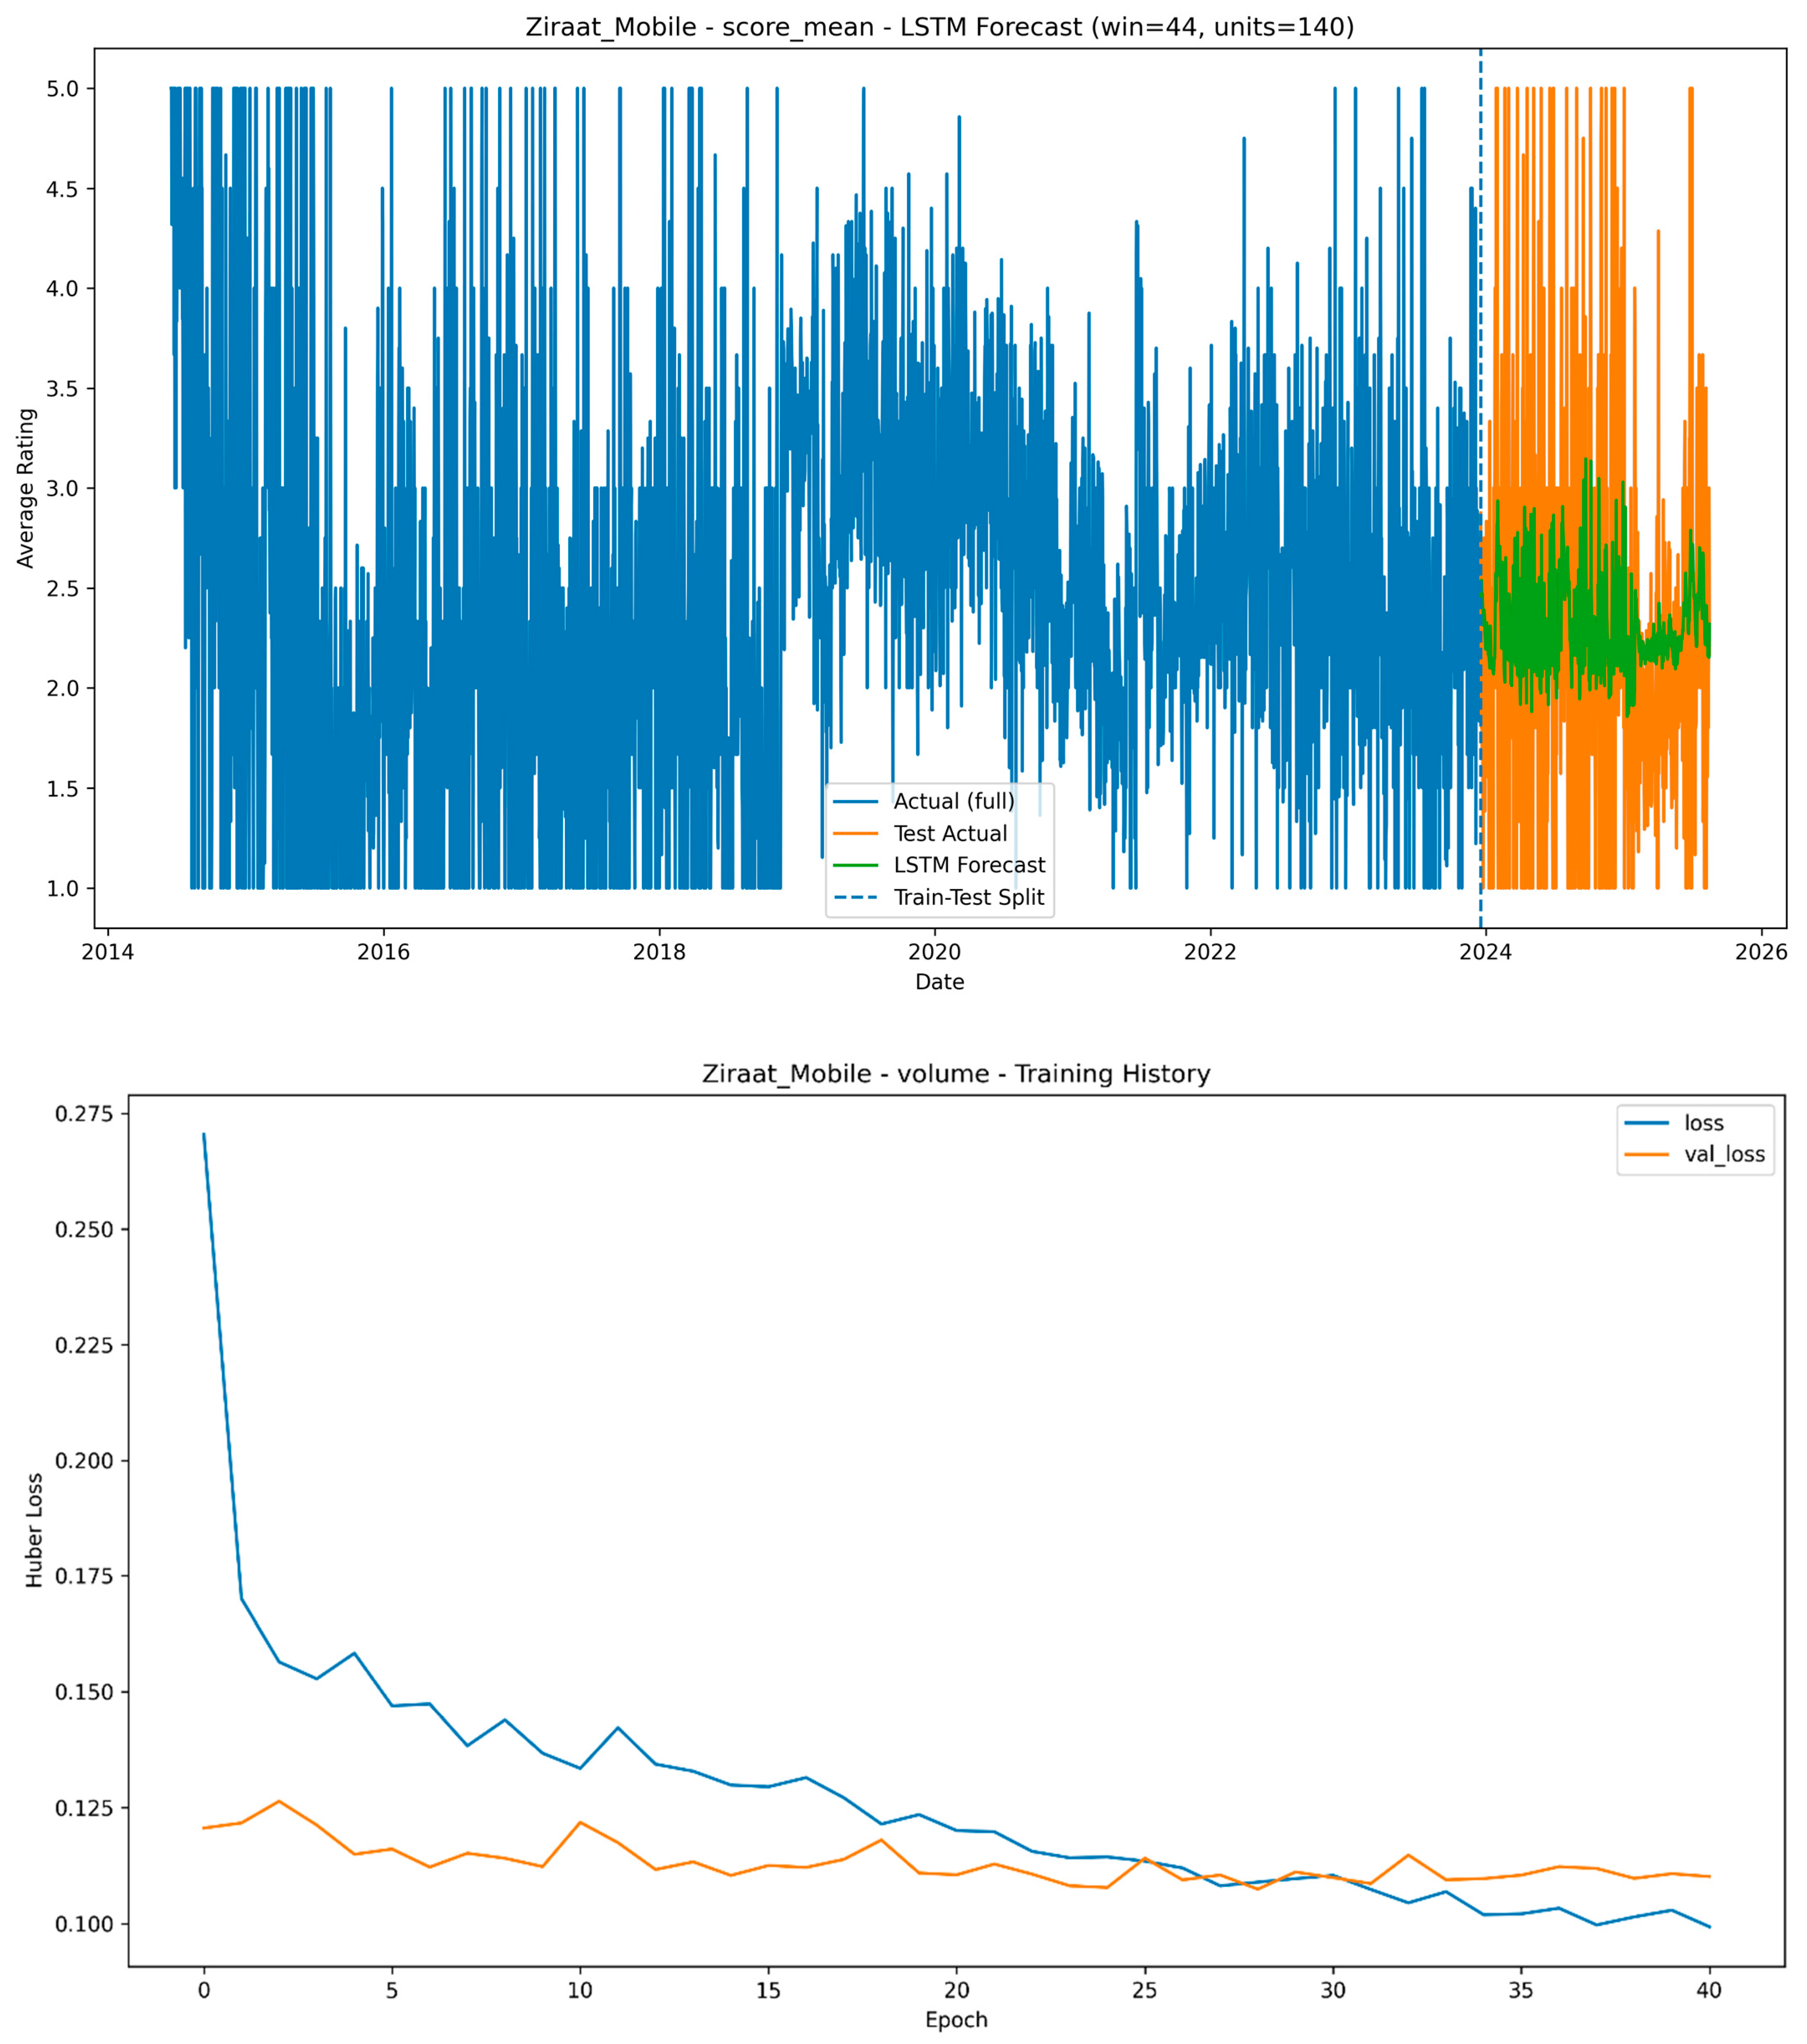
This section presents the empirical results for forecasting daily average ratings (the primary response variable). Performance is reported for each bank by comparing LSTM with the Seasonal Naïve (SNaive) benchmark using error-based metrics (MAE, RMSE, MAPE, sMAPE, MASE) and R 2 . Detailed numbers are provided in Table A1. Model fit and generalization behaviour are illustrated in Figure 2, Figure 3, Figure 4, Figure 5 and Figure 6, which plot test-period forecasts and training histories for the rating series. While review volumes are informative for engagement context, they are treated as supplementary and are reported in Table A2.
For Akbank, the LSTM model substantially improves the forecasting accuracy of daily average ratings compared to the SNaive benchmark. The mean squared error decreases from 0.89 to 0.48, corresponding to an improvement of approximately 46 percent. The model produces an MAE of 0.55 and an RMSE of 0.70, which indicates moderate but stable predictive precision. The MAPE value of 28.47 percent and the symmetric MAPE of 23.16 percent show that the relative errors are kept within reasonable bounds. The R2 score of 0.36 suggests that the model captures a meaningful portion of the variation in user ratings, despite the volatility of daily data. The graphical results (Figure 2) reveal that the predicted ratings closely follow actual user evaluations during the test period. Although some lag is observed in capturing abrupt declines following major updates, the overall trend is well preserved. This finding implies that LSTM is capable of recognizing the rhythm of Akbank users’ satisfaction cycles, particularly in short-term windows. The stable training and validation losses indicate effective convergence without overfitting.
Figure 2. Daily average rating for Akbank: LSTM test forecast and training history.
Systems 13 00949 g002
For Garanti BBVA, the predictive performance of the LSTM model again surpasses that of the SNaive method, though the improvement is slightly smaller than in Akbank. The mean squared error declines from 0.77 to 0.42, marking a gain of roughly 45 percent. The MAE and RMSE values are 0.50 and 0.65, respectively, while the MAPE and sMAPE stand at 23.03 percent and 19.98 percent. The R2 score is approximately zero, reflecting the limited explanatory power of variance-based measures for bounded and relatively stable series such as ratings. Nevertheless, the consistent reduction in absolute error demonstrates that LSTM captures subtle variations that SNaive cannot. The time series visualization confirms that the model tracks local fluctuations with a smoother pattern, especially during intervals of steady user satisfaction (Figure 3). Small discrepancies at sharp peaks may correspond to unmodeled events such as feature launches or temporary technical issues. Overall, for Garanti BBVA, the LSTM model provides a reliable short-term forecasting structure for predicting daily user evaluations.
Figure 3. Daily average rating for Garanti: LSTM test forecast and training history.
Systems 13 00949 g003
The results for İşbank also confirm the superior performance of LSTM compared to SNaive, with a decrease in mean squared error from 0.54 to 0.34, representing an improvement of nearly 37 percent. The MAE is 0.47, the RMSE is 0.58, and the percentage errors (MAPE 18.59 and sMAPE 16.54) are among the lowest across all banks. Although the R2 value is slightly negative (−0.01), this result mainly reflects the low variance of the target series rather than poor predictive quality. The visualization of İşbank’s daily average ratings (Figure 4) shows that LSTM effectively reproduces the general pattern of fluctuations, maintaining stable forecasts even around mild oscillations. Occasional mismatches correspond to days with low review activity, when small changes in review tone can create disproportionate shifts in the average rating. The minimal gap between training and validation losses confirms that the model remains generalizable and not overfitted. Taken together, these results suggest that the satisfaction patterns of İşbank users are more consistent than those of other banks, allowing LSTM to model them more accurately.
Figure 4. Daily average rating for Isbank: LSTM test forecast and training history.
Systems 13 00949 g004
Among the analyzed banks, Yapı Kredi exhibits one of the most predictable daily average rating patterns. The LSTM model reduces the mean squared error from 1.04 to 0.39, indicating an improvement of approximately 62 percent, the largest reduction observed in the sample. The MAE and RMSE values are 0.49 and 0.63, and the MAPE and sMAPE are 16.59 and 15.74 percent, respectively. The R2 value of 0.32 is positive and relatively high, showing that the model successfully captures rating dynamics. Visual inspection of Yapı Kredi’s forecasts reveals that the LSTM model follows both upward and downward trends with minimal delay (Figure 5). The bank’s app appears to generate more stable user experiences, as the amplitude of fluctuations is smaller compared with others. The learning curves further indicate that the model converged efficiently and remained stable during validation. This result suggests that the more homogeneous feedback pattern of Yapı Kredi users enables the LSTM network to generalize temporal dependencies more effectively, reinforcing the reliability of its forecasts in this context.
Figure 5. Daily average rating for Yapı Kredi: LSTM test forecast and training history.
Systems 13 00949 g005
For Ziraat Bank, the daily average ratings display the highest degree of variability, and consequently, the forecast errors are larger than for the other banks. The mean squared error drops from 1.75 to 0.91, representing an improvement of about 48 percent. The MAE is 0.72, the RMSE is 0.95, and the relative errors (MAPE 39.59 percent and sMAPE 32.16 percent) remain elevated, highlighting the difficulty of modeling strongly fluctuating satisfaction signals. The R2 value is slightly negative (−0.06), suggesting that the variance explained by the model is limited. Despite these challenges, LSTM still outperforms the SNaive baseline across all error-based metrics, showing that even noisy user-generated data can yield valuable predictive patterns. The visual results indicate that the model captures overall rating tendencies but struggles to react promptly to sudden drops following negative user episodes or app updates (Figure 6). The higher noise level in Ziraat Bank’s series likely stems from a broader and more diverse customer base, where feedback reflects a wider range of user experiences. This finding supports the interpretation that user heterogeneity contributes significantly to the unpredictability of satisfaction patterns in mobile banking systems.
Figure 6. Daily average rating for Ziraat: LSTM test forecast and training history.
Systems 13 00949 g006
In summary, across all five banks, the LSTM model consistently outperforms the Seasonal Naïve baseline in forecasting daily average ratings. The reductions in mean squared error range from approximately 37 to 62 percent, with particularly strong gains for Yapı Kredi and Akbank. While the R2 metric varies due to the bounded and low-variance nature of rating data, the error-based metrics consistently confirm the superior performance of LSTM.
Overall, the model effectively captures the short-term temporal dynamics of user satisfaction, even under moderate volatility. Remaining deviations are likely associated with unmodeled exogenous factors such as application updates, user interface changes, or external events. These findings reinforce the view that deep sequence models such as LSTM provide a robust analytical framework for predicting user-derived quality signals in mobile banking, enabling a more nuanced understanding of customer experience dynamics over time.

5. Discussion

Section 5 interprets the empirical findings of the study in light of existing literature and theoretical perspectives. It highlights the implications of user behavior heterogeneity for forecasting accuracy, digital transformation strategies, and the broader field of management information systems.

5.1. Theoretical Implications

This study makes several theoretical contributions to the information systems and service quality literature. First, it extends the understanding of UDQS by framing daily average user ratings as measurable reflections of perceived service quality and post-adoption satisfaction. By linking these signals to established frameworks such as the Expectation–Confirmation Theory (ECT) and the DeLone and McLean IS Success Model [13,15], the study empirically demonstrates that user ratings encapsulate confirmation or disconfirmation of expectations over time, serving as a dynamic indicator of system success.
Second, the study advances the methodological perspective of digital service quality evaluation. Traditional models in IS research have predominantly relied on cross-sectional surveys or self-reported satisfaction scales [61,62]. In contrast, this research introduces a longitudinal and data-driven approach that operationalizes user experience through temporal analysis of user feedback. The integration of deep learning-based forecasting, particularly LSTM networks, provides a robust analytical framework for capturing nonlinear dependencies and evolving perceptions of digital service performance.
Finally, the findings contribute to emerging discussions on temporal dynamics in information systems success. The demonstrated predictability of daily user ratings supports the notion that satisfaction and perceived quality are not static constructs but evolve in response to ongoing service interactions, technological changes, and environmental factors. This temporal lens enriches theoretical models of user satisfaction by emphasizing continuity and adaptation, suggesting that service quality assessment in digital environments should account for the dynamic nature of user perceptions over time.

5.2. Model Performance and Comparative Effectiveness

The findings indicate that the LSTM model achieved a significant improvement over the seasonal naïve (SNaive) method across all banks. As shown in Table A1, particularly notable reductions in error rates are observed for Yapı Kredi and Akbank. For instance, in the case of Yapı Kredi’s daily average rating series, the MSE decreased from 1.04 under SNaive to 0.39 with LSTM, reducing the error to nearly one-third. Similarly, for Akbank’s daily average ratings, LSTM reduced the MSE from 0.89 to 0.48, an improvement of approximately 46 percent. These results confirm the strength of LSTM in capturing short-term dependencies and complex temporal dynamics, aligning with previous studies that reported the superiority of deep learning-based time series models [33,63].
However, the relatively high MAPE and sMAPE values observed in some banks highlight the challenges of predicting user-generated rating fluctuations. For example, Ziraat Bank’s daily average rating series exhibited a MAPE of 39.6 percent, indicating that user satisfaction levels can change abruptly in response to app updates or service issues. This finding is consistent with the literature emphasizing that the irregular and noisy nature of user-driven data increases forecasting errors [64,65,66]. Nevertheless, the fact that the LSTM model consistently outperformed the SNaive baseline across all banks demonstrates its robustness, even when predicting fluctuating rating patterns. On the other hand, examination of R2 values reveals the model’s limited ability to explain variance in user ratings. While Yapı Kredi and Ziraat displayed relatively higher R2 values (0.32 and 0.43, respectively), the values for İşbank and Garanti were considerably lower. This outcome reflects the bounded and nonlinear nature of rating data rather than a methodological limitation. The literature frequently emphasizes that R2 is not a reliable performance indicator for user-generated time series characterized by short-term volatility and non-stationarity, and it should therefore be interpreted together with error-based metrics [49,67]. Accordingly, by employing multiple metrics in this study (MAE, RMSE, MAPE, sMAPE, and MASE), a more comprehensive and balanced evaluation of forecasting performance was achieved.
In conclusion, the results demonstrate that the LSTM model offers a powerful alternative for capturing short-term dynamics, though the high error rates in certain series indicate that it may not always be sufficient on its own. Although these findings are consistent with the broader literature confirming the superiority of deep learning models for time series forecasting, this study extends that understanding by contextualizing LSTM performance within user-generated and service-quality-oriented datasets. In this regard, it highlights the applicability of deep learning to context-rich and volatile data environments, particularly within the Turkish mobile banking ecosystem. Future research is encouraged to enhance accuracy in such cases by incorporating additional modeling strategies or integrating external variables.

5.3. Heterogeneity of User Behavior Across Banks

Differences in user behavior across banks have long been a subject of discussion in the banking and finance literature. These differences stem not only from the diversity of customer bases but also from varying levels of digital adaptation, service strategies, and user experience-oriented approaches. In particular, studies on the API economy and open banking demonstrate that digital transformation has profoundly influenced banks’ customer interaction strategies [68].
Empirical research highlights that users’ demographic characteristics and levels of technological affinity are key determinants of their interaction patterns. In banks with a younger and more tech-savvy customer base, user reviews tend to be more frequent, detailed, and technical. In contrast, banks with more traditional customer profiles generally receive shorter, less frequent reviews that emphasize overall service quality. Such behavioral differences increase the heterogeneity of time series dynamics across banks and lead to unpredictable fluctuations in the volume of user reviews. The literature has long emphasized that irregular and noisy user-generated data reduce forecasting performance and increase error rates [69]. More recent findings indicate that heterogeneity in user activity constitutes a critical limitation for predictive accuracy in machine learning and time series forecasting models [70]. The varying implementation of digitalization strategies by different banks further amplifies this heterogeneity. Banks that prioritize digitalization and frequently update their applications tend to receive more consistent and voluminous user feedback, whereas those with fewer updates or limited digital channels often face irregular, sparse, and unpredictable review patterns. Contemporary studies examining user heterogeneity in mobile banking systems show that such diversity significantly affects both system performance and customer experience management [71].
Moreover, the effects of digital transformation vary by bank type and size. A recent study emphasizes that risk management and digital transformation processes generate different outcomes across banking institutions, making heterogeneity an inseparable component of corporate strategy [72]. Similarly, research conducted in China reveals that the impact of digital financial inclusion on banking performance differs substantially across regions, illustrating that heterogeneity exists not only institutionally but also geographically [73]. Furthermore, an analysis of customer satisfaction with digital banking services in the aftermath of COVID-19 found that factors such as transaction speed, reliability, and efficiency carried different levels of importance across banks, thereby demonstrating how behavioral heterogeneity extends into the dimension of customer experience [74].

5.4. Implications for Practical Applications and Future Research

The findings of this study carry several implications for both practical applications and future lines of inquiry. From a practical perspective, the demonstrated heterogeneity of user behaviors across banks highlights the necessity for financial institutions to adopt adaptive digital strategies. Banks should not rely on uniform service models but instead design flexible and context-sensitive engagement mechanisms that reflect the demographic and technological diversity of their customers.
Beyond this strategic insight, the predictive modeling results offer concrete managerial applications. Forecasts of daily user ratings can serve as early warning indicators of usability or performance issues following mobile app updates. A sudden decline in predicted ratings may signal interface instability or negative user reactions, prompting developers to intervene before customer dissatisfaction escalates. Conversely, spikes in review volume may reflect successful engagement after feature launches or marketing campaigns, providing feedback for optimizing communication strategies. Integrating these predictive insights into customer experience dashboards would allow managers to monitor satisfaction trends in real time, prioritize design improvements, and schedule maintenance or feature releases more effectively. These capabilities transform predictive analytics from an observational tool into a decision-support mechanism that strengthens proactive service management in the banking sector.
It should also be acknowledged that the current framework provides short-term predictive insights rather than fully operational forecasting capabilities. The results are therefore more suitable for early detection and trend monitoring than for long-term strategic planning.
For practitioners in the field of management information systems (MISs), the study underscores the value of integrating advanced machine learning and time series forecasting techniques into decision-making processes. By leveraging these methods, banks can develop predictive models that better account for behavioral heterogeneity and noise in user data, thereby improving the reliability of digital service planning. More broadly, the study contributes to the MIS discipline by illustrating how user-driven data sources, such as mobile banking reviews, can serve as critical inputs for designing customer-centric information systems. This perspective expands the traditional scope of MIS beyond transactional efficiency, emphasizing the role of user experience analytics in shaping digital transformation strategies.
In terms of future research, several directions emerge. First, comparative studies across different countries and financial ecosystems would provide deeper insights into the role of institutional and cultural contexts in shaping user behavior heterogeneity. Second, future work may extend the methodological framework by integrating hybrid forecasting models that combine statistical, deep learning, and sentiment-based approaches, potentially leading to more robust performance. Finally, longitudinal analyses that examine the evolution of user feedback before and after major regulatory or technological shifts, such as the implementation of open banking standards or the adoption of AI-driven customer support, could further advance the understanding of dynamic user-bank interactions.
Collectively, these implications highlight the dual relevance of the study for practice and scholarship. While offering practical guidance for banks aiming to optimize digital engagement, the study also provides a theoretical contribution to the MIS field by framing user behavior heterogeneity as a critical factor in the design and evaluation of information systems.

6. Limitations

This study has several limitations. First, the dataset is based solely on user reviews and daily average ratings from the Google Play Store, which excludes feedback from iOS users and may therefore introduce a platform-related bias, as user behavior and satisfaction patterns can differ between ecosystems. Second, the forecasts were conducted for a one-step-ahead horizon that focuses on short-term dynamics; while this design enhances model stability, it limits the practical usefulness of the results for long-term strategic planning. Future studies could extend the forecasting window to weekly or monthly horizons to improve managerial applicability. In addition, the evaluation compared LSTM only with the Seasonal Naïve benchmark; incorporating other conventional or advanced methods in future studies could further enrich the benchmarking framework.
Moreover, user ratings and review volumes are often influenced by exogenous factors such as app updates, marketing campaigns, or macroeconomic conditions, which were not explicitly modeled in this study. This univariate design isolates intrinsic temporal patterns but may limit adaptability during sudden behavioral shifts driven by external events. Future studies could integrate such exogenous variables to improve model responsiveness and capture event-driven volatility more effectively.
Finally, user reviews may contain uncertainties due to individual biases, varying expression styles, or automated filtering mechanisms. Future studies should also consider applying sentiment analysis or text-mining techniques to reduce such noise and better distinguish genuine user feedback. These limitations suggest promising directions for future research, including the use of broader datasets, extended model comparisons, and the integration of exogenous variables. In future work, extending the current framework to multi-step or multivariate forecasting could help uncover longer-term dynamics in user satisfaction. Future research could also explore hybrid and transformer-based architectures to enhance prediction accuracy across different banks. Additionally, combining textual sentiment features or cross-platform data from iOS could provide a more holistic understanding of user experience. Beyond these directions, ensemble forecasting frameworks that integrate multiple deep learning and statistical models could offer improved robustness. Furthermore, leveraging multimodal data such as app usage metrics, interface logs, and review sentiments may help capture broader shifts in user behavior and strengthen the operational value of predictive analytics for banks. Such extensions would further improve both the methodological depth and the practical relevance of forecasting user-derived quality signals in mobile banking.

7. Conclusions

This study provides a comprehensive assessment of the predictability of UDQS in mobile banking applications through time series forecasting. Drawing on daily average ratings and review volumes from the Google Play Store, the empirical results demonstrated that the LSTM model consistently outperformed the Seasonal Naïve benchmark by producing significantly lower error values. These findings reveal the potential of deep learning approaches to capture short-term dynamics in user behavior within the mobile banking ecosystem. In particular, the ability to model sudden shifts in user ratings represents a valuable contribution for monitoring customer satisfaction.
The findings are significant not only from an academic perspective but also in terms of practical applications. In today’s digital banking landscape, user reviews and ratings have become one of the most direct indicators of customer experience. Leveraging LSTM-based forecasts enables the early detection of potential declines or improvements in customer satisfaction, allowing banks to take timely and proactive measures. Such predictive monitoring offers strategic advantages for strengthening service quality, optimizing app performance, and enhancing customer loyalty. Beyond these empirical findings, the study contributes new conceptual understanding by framing user-derived app-store ratings as dynamic quality signals that evolve over time. This perspective extends prior work by linking time-series forecasting to customer experience management, highlighting how banks can proactively interpret shifts in user sentiment as early indicators of digital service performance.
The study also contributes methodologically by positioning user review data within a time series forecasting framework, which has received relatively little attention in the existing literature. Evaluating deep learning models alongside benchmark approaches provides a novel methodological perspective for user experience research. This dual contribution, bridging advanced modeling techniques with practical insights, enhances both the academic discourse and the ongoing digital transformation of the banking sector.
In conclusion, the study demonstrates that user experience in mobile banking applications can indeed be predicted and that these predictions can inform actionable strategies for improving service quality. The findings reinforce the value of data-driven decision-making in the financial sector, supporting the effective management of digital services and the long-term sustainability of customer satisfaction.

Funding

This research received no external funding.

Institutional Review Board Statement

Not applicable.

Informed Consent Statement

Not applicable.

Data Availability Statement

The data that support the findings of this study are available from the corresponding author upon reasonable request.

Conflicts of Interest

The author declares no conflicts of interest.

Appendix A

Table A1. Forecasting results for daily average ratings.
MetricİşbankYapı KrediGarantiAkbankZiraat
n_train1,998,0001,483,0002,536,0002,620,0003,442,000
n_test352,000261,000447,000462,000607,000
Window size1720173644
Units1101116167140
Batch size83461034875
Learning rate0.0030.0040.0040.0030.005
Dropout0.290.400.390.390.20
Epochs109152141144114
MAE0.470.490.500.550.72
RMSE0.580.630.650.700.95
MAPE (%)18.5916.5923.0328.4739.59
sMAPE (%)16.5415.7419.9823.1632.16
MedAE0.430.410.390.460.55
R2−0.010.320.000.36−0.06
MASE (m = 7)0.900.650.750.860.84
Mean bias0.20−0.070.080.140.06
MSE (LSTM)0.340.390.420.480.91
MSE (SNaive)0.541.040.770.891.75
Table A2. Forecasting results for daily review volumes.
MetricAkbankGarantiZiraatİşbankYapı Kredi
n_train2,620,0002,536,0003,442,0001,998,0001,483,000
n_test462,000447,000607,000352,000261,000
Window size2823181725
Units55179133128103
Batch size3276795754
Learning rate0.0040.0050.0040.0040.005
Dropout0.290.310.360.340.31
Epochs8310180154104
MAE3.634.153.585.116.83
RMSE6.356.726.998.1510.89
MAPE (%)45.2537.9258.4135.1136.56
sMAPE (%)37.5731.9049.1830.8437.63
MedAE2.702.962.043.663.91
R20.270.320.430.390.39
MASE (m = 7)7.929.186.7614.079.22
Mean bias−0.63−0.74−1.32−1.31−4.16
MSE (LSTM)40.2845.0948.8866.41118.59
MSE (SNaive)97.4890.08110.87170.88355.91

References

  1. Alt, R.; Fridgen, G.; Chang, Y. The Future of Fintech—Towards Ubiquitous Financial Services. Electron. Mark. 2024, 34, 3. [Google Scholar] [CrossRef]
  2. Rahman, M.; Yee, H.P.; Masud, M.A.K.; Uzir, M.U.H. Examining the Dynamics of Mobile Banking App. Adoption during the COVID-19 Pandemic: A Digital Shift in the Crisis. Digit. Bus. 2024, 4, 100088. [Google Scholar] [CrossRef]
  3. Karjaluoto, H.; Glavee-Geo, R.; Ramdhony, D.; Shaikh, A.A.; Hurpaul, A. Consumption Values and Mobile Banking Services: Understanding the Urban–Rural Dichotomy in a Developing Economy. Int. J. Bank Mark. 2021, 39, 272–293. [Google Scholar] [CrossRef]
  4. Papathomas, A.; Konteos, G. Financial Institutions Digital Transformation: The Stages of the Journey and Business Metrics to Follow. J. Financ. Serv. Mark. 2023, 29, 590–606. [Google Scholar] [CrossRef]
  5. Adiningtyas, H.; Auliani, A.S. Sentiment Analysis for Mobile Banking Service Quality Measurement. Procedia Comput. Sci. 2024, 234, 40–50. [Google Scholar] [CrossRef]
  6. Kim, L.; Jindabot, T.; Yeo, S.F. Understanding Customer Loyalty in Banking Industry: A Systematic Review and Meta Analysis. Heliyon 2024, 10, e36619. [Google Scholar] [CrossRef]
  7. Shaikh, A.A.; Karjaluoto, H. Mobile Banking Adoption: A Literature Review. Telemat. Inform. 2015, 32, 129–142. [Google Scholar] [CrossRef]
  8. Sharma, N. A Digital Cohort Analysis of Consumers’ Mobile Banking App Experience. Int. J. Consum. Stud. 2024, 48, e12989. [Google Scholar] [CrossRef]
  9. Dąbrowski, J.; Letier, E.; Perini, A.; Susi, A. Analysing App Reviews for Software Engineering: A Systematic Literature Review. Empir. Softw. Eng. 2022, 27, 43. [Google Scholar] [CrossRef]
  10. Genc-Nayebi, N.; Abran, A. A Systematic Literature Review: Opinion Mining Studies from Mobile App Store User Reviews. J. Syst. Softw. 2017, 125, 207–219. [Google Scholar] [CrossRef]
  11. Alismail, M.A.; Albesher, A.S. Evaluating Developer Responses to App Reviews: The Case of Mobile Banking Apps in Saudi Arabia and the United States. Sustainability 2023, 15, 6701. [Google Scholar] [CrossRef]
  12. Oliver, R.L. A Cognitive Model of the Antecedents and Consequences of Satisfaction Decisions. J. Mark. Res. 1980, 17, 460–469. [Google Scholar] [CrossRef]
  13. Bhattacherjee, A. Understanding Information Systems Continuance: An Expectation-Confirmation Model. MIS Q. 2001, 25, 351–370. [Google Scholar] [CrossRef]
  14. DeLone, W.H.; McLean, E.R. Information Systems Success: The Quest for the Dependent Variable. Inf. Syst. Res. 1992, 3, 60–95. [Google Scholar] [CrossRef]
  15. DeLone, W.H.; McLean, E.R. The DeLone and McLean Model of Information Systems Success: A Ten-Year Update. J. Manag. Inf. Syst. 2003, 19, 9–30. [Google Scholar] [CrossRef]
  16. Larsen, M.E.; Nicholas, J.; Christensen, H. Quantifying App Store Dynamics: Longitudinal Tracking of Mental Health Apps. JMIR Mhealth Uhealth 2016, 4, e96. [Google Scholar] [CrossRef]
  17. Martin, W.; Sarro, F.; Harman, M. Causal Impact Analysis for App Releases in Google Play. In Proceedings of the 2016 24th ACM SIGSOFT International Symposium on Foundations of Software Engineering, Seattle, WA, USA, 13–16 November 2016; Association for Computing Machinery: New York, NY, USA, 2016; pp. 435–446. [Google Scholar]
  18. Mroua, M.; Lamine, A. Financial Time Series Prediction under Covid-19 Pandemic Crisis with Long Short-Term Memory (LSTM) Network. Humanit. Soc. Sci. Commun. 2023, 10, 530. [Google Scholar] [CrossRef]
  19. Tuhin, K.H.; Nobi, A.; Rakib, M.H.; Lee, J.W. Long Short-Term Memory Autoencoder Based Network of Financial Indices. Humanit. Soc. Sci. Commun. 2025, 12, 100. [Google Scholar] [CrossRef]
  20. Ricchiuti, F.; Sperlí, G. An Advisor Neural Network Framework Using LSTM-Based Informative Stock Analysis. Expert Syst. Appl. 2025, 259, 125299. [Google Scholar] [CrossRef]
  21. Amirkhalili, Y.; Wong, H.Y. Banking on Feedback: Text Analysis of Mobile Banking iOS and Google App Reviews. arXiv 2025, arXiv:2503.11861. [Google Scholar]
  22. Pınarbaşı, F. Mapping the Online Reviews Sentiment Landscape: An Exploration of Emotion Spectrum in User Reviews of Mobile Apps. Nevşehir Hacı Bektaş Veli Üniversitesi SBE Dergisi 2024, 14, 1598–1619. [Google Scholar] [CrossRef]
  23. Sun, P. Customers’ Emotional Impact on Star Rating and Thumbs-up Behavior Towards Food Delivery Service Apps. 2024. Available online: https://papers.ssrn.com/sol3/papers.cfm?abstract_id=4912648 (accessed on 23 August 2025).
  24. Motger, Q.; Oriol, M.; Tiessler, M.; Franch, X.; Marco, J. What About Emotions? Guiding Fine-Grained Emotion Extraction from Mobile App Reviews. In Proceedings of the 2025 IEEE 33rd International Requirements Engineering Conference (RE), Valencia, Spain, 1–5 September 2025. [Google Scholar]
  25. Aydin Gokgoz, Z.; Ataman, M.B.; van Bruggen, G.H. If It Ain’t Broke, Should You Still Fix It? Effects of Incorporating User Feedback in Product Development on Mobile Application Ratings. Int. J. Res. Mark. 2025, 42, 467–486. [Google Scholar] [CrossRef]
  26. Gong, X.; Razzaq, A.; Wang, W. More Haste, Less Speed: How Update Frequency of Mobile Apps Influences Consumer Interest. J. Theor. Appl. Electron. Commer. Res. 2021, 16, 2922–2942. [Google Scholar] [CrossRef]
  27. Hazarika, B.; Shrivastava, U.; Hiele, T.M.; Pham, C. The Impact of Technology Frustration and Consumer Passion on Consumer Evaluation Shift in Case of Mobile Apps. Acta Psychol. 2025, 256, 105006. [Google Scholar] [CrossRef]
  28. Oh, Y.K.; Kim, J.-M. What Improves Customer Satisfaction in Mobile Banking Apps? An Application of Text Mining Analysis. Asia Mark. J. 2022, 23, 3. [Google Scholar] [CrossRef]
  29. Sällberg, H.; Wang, S.; Numminen, E. The Combinatory Role of Online Ratings and Reviews in Mobile App Downloads: An Empirical Investigation of Gaming and Productivity Apps from Their Initial App Store Launch. J. Mark. Anal. 2022, 11, 426–442. [Google Scholar] [CrossRef]
  30. Su, Q.; Namin, A.; Ketron, S. The Effect of Online Company Responses on App Review Quality. J. Consum. Mark. 2024, 41, 110–125. [Google Scholar] [CrossRef]
  31. Kapoor, A.P.; Vij, M. How to Boost Your App Store Rating? An Empirical Assessment of Ratings for Mobile Banking Apps. J. Theor. Appl. Electron. Commer. Res. 2020, 15, 99–115. [Google Scholar] [CrossRef]
  32. Wang, C.; Liu, T.; Liang, P.; Daneva, M.; van Sinderen, M. The Role of User Reviews in App Updates: A Preliminary Investigation on App Release Notes. In Proceedings of the 2021 28th Asia-Pacific Software Engineering Conference (APSEC), Taipei, Taiwan, 6–9 December 2021; pp. 520–525. [Google Scholar]
  33. Siami-Namini, S.; Namin, A.S. Forecasting Economics and Financial Time Series: ARIMA vs. LSTM. arXiv 2018, arXiv:1803.06386. [Google Scholar] [CrossRef]
  34. Lara-Benítez, P.; Carranza-García, M.; Riquelme, J.C. An Experimental Review on Deep Learning Architectures for Time Series Forecasting. Int. J. Neural Syst. 2021, 31, 2130001. [Google Scholar] [CrossRef]
  35. Cheng, J.; Zhuo, Y.; Yao, Z.; Deng, J. Mobile Application Usage Forecast Based on LSTM. In Proceedings of the 2023 International Conference on Frontiers of Artificial Intelligence and Machine Learning, Beijing China, 14–16 April 2023; Association for Computing Machinery: New York, NY, USA, 2024; pp. 92–97. [Google Scholar]
  36. Gheewala, S.; Xu, S.; Yeom, S. In-Depth Survey: Deep Learning in Recommender Systems—Exploring Prediction and Ranking Models, Datasets, Feature Analysis, and Emerging Trends. Neural Comput. Appl. 2025, 37, 10875–10947. [Google Scholar] [CrossRef]
  37. Li, P.; Noah, S.A.M.; Sarim, H.M. A Survey on Deep Neural Networks in Collaborative Filtering Recommendation Systems. arXiv 2024, arXiv:2412.01378. [Google Scholar] [CrossRef]
  38. Zhou, H.; Xiong, F.; Chen, H. A Comprehensive Survey of Recommender Systems Based on Deep Learning. Appl. Sci. 2023, 13, 11378. [Google Scholar] [CrossRef]
  39. Noh, S.-H. Analysis of Gradient Vanishing of RNNs and Performance Comparison. Information 2021, 12, 442. [Google Scholar] [CrossRef]
  40. Bougteb, Y.; Ouhbi, B.; Frikh, B.; Zemmouri, E.M. A Multi-Criteria Attention-LSTM Approach for Enhancing Privacy and Accuracy in Recommender Systems. Soc. Netw. Anal. Min. 2025, 15, 38. [Google Scholar] [CrossRef]
  41. Zhang, J.; Zeng, Y.; Starly, B. Recurrent Neural Networks with Long Term Temporal Dependencies in Machine Tool Wear Diagnosis and Prognosis. SN Appl. Sci. 2021, 3, 442. [Google Scholar] [CrossRef]
  42. Wen, X.; Li, W. Time Series Prediction Based on LSTM-Attention-LSTM Model. IEEE Access 2023, 11, 48322–48331. [Google Scholar] [CrossRef]
  43. Mahmoudi, A. Investigating LSTM-Based Time Series Prediction Using Dynamic Systems Measures. Evol. Syst. 2025, 16, 71. [Google Scholar] [CrossRef]
  44. Waqas, M.; Humphries, U.W. A Critical Review of RNN and LSTM Variants in Hydrological Time Series Predictions. MethodsX 2024, 13, 102946. [Google Scholar] [CrossRef] [PubMed]
  45. Ibrahim, I.A.; Hossain, M.J. Short-Term Multivariate Time Series Load Data Forecasting at Low-Voltage Level Using Optimised Deep-Ensemble Learning-Based Models. Energy Convers. Manag. 2023, 296, 117663. [Google Scholar] [CrossRef]
  46. Banks Union of Türkiye. Digital, Internet and Mobile Banking Statistics; Banks Union of Türkiye: Istanbul, Turkey, 2025. [Google Scholar]
  47. Similarweb. Top Finance Apps Ranking—Most Popular Finance Apps in Turkey. Available online: https://www.similarweb.com/top-apps/google/turkey/finance/ (accessed on 25 August 2025).
  48. Appfigures. Top Finance Apps for Android on Google Play in Turkey. Available online: https://appfigures.com/top-apps/google-play/turkey/finance (accessed on 25 August 2025).
  49. Hewamalage, H.; Ackermann, K.; Bergmeir, C. Forecast Evaluation for Data Scientists: Common Pitfalls and Best Practices. Data Min. Knowl. Discov. 2022, 37, 788–832. [Google Scholar] [CrossRef] [PubMed]
  50. de Camargo, A.A.R.; de Oliveira, M.A. Analysis of the Application of Different Forecasting Methods for Time Series in the Context of the Aeronautical Industry. Eng. Proc. 2023, 39, 74. [Google Scholar] [CrossRef]
  51. Beck, N.; Dovern, J.; Vogl, S. Mind the Naive Forecast! A Rigorous Evaluation of Forecasting Models for Time Series with Low Predictability. Appl. Intell. 2025, 55, 395. [Google Scholar] [CrossRef]
  52. Oliveira, J.M.; Ramos, P. Evaluating the Effectiveness of Time Series Transformers for Demand Forecasting in Retail. Mathematics 2024, 12, 2728. [Google Scholar] [CrossRef]
  53. Unterberger, V.; Lichtenegger, K.; Kaisermayer, V.; Gölles, M.; Horn, M. An Adaptive Short-Term Forecasting Method for the Energy Yield of Flat-Plate Solar Collector Systems. Appl. Energy 2021, 293, 116891. [Google Scholar] [CrossRef]
  54. Kreuzer, D.; Munz, M.; Schlüter, S. Short-Term Temperature Forecasts Using a Convolutional Neural Network—An Application to Different Weather Stations in Germany. Mach. Learn. Appl. 2020, 2, 100007. [Google Scholar] [CrossRef]
  55. Kılınç, M.; Aydın, C.; Tarhan, Ç. Kitle Fonlamasındaki Proje Metin İçeriklerinin LSTM ile Analizi. J. Res. Bus. 2022, 7, 48–59. [Google Scholar] [CrossRef]
  56. Om, K.; Boukoros, S.; Nugaliyadde, A.; McGill, T.; Dixon, M.; Koutsakis, P.; Wong, K.W. Modelling Email Traffic Workloads with RNN and LSTM Models. Hum.-Centric Comput. Inf. Sci. 2020, 10, 39. [Google Scholar] [CrossRef]
  57. Yu, Y.; Si, X.; Hu, C.; Zhang, J. A Review of Recurrent Neural Networks: LSTM Cells and Network Architectures. Neural Comput. 2019, 31, 1235–1270. [Google Scholar] [CrossRef]
  58. Ozyegen, O.; Ilic, I.; Cevik, M. Evaluation of Interpretability Methods for Multivariate Time Series Forecasting. Appl. Intell. 2021, 52, 4727–4743. [Google Scholar] [CrossRef]
  59. Dip Das, J.; Thulasiram, R.K.; Henry, C.; Thavaneswaran, A. Encoder–Decoder Based LSTM and GRU Architectures for Stocks and Cryptocurrency Prediction. J. Risk Financ. Manag. 2024, 17, 200. [Google Scholar] [CrossRef]
  60. Chung, J.; Gulcehre, C.; Cho, K.; Bengio, Y. Empirical Evaluation of Gated Recurrent Neural Networks on Sequence Modeling. arXiv 2014, arXiv:1412.3555. [Google Scholar] [CrossRef]
  61. Gefen, D.; Karahanna, E.; Straub, D.W. Trust and TAM in Online Shopping: An Integrated Model. MIS Q. 2003, 27, 51–90. [Google Scholar] [CrossRef]
  62. Venkatesh, V.; Morris, M.G.; Davis, G.B.; Davis, F.D. User Acceptance of Information Technology: Toward a Unified View. MIS Q. 2003, 27, 425–478. [Google Scholar] [CrossRef]
  63. Lim, B.; Zohren, S. Time-Series Forecasting with Deep Learning: A Survey. Philos. Trans. R. Soc. A Math. Phys. Eng. Sci. 2021, 379, 20200209. [Google Scholar] [CrossRef] [PubMed]
  64. Xu, X. What Are Customers Commenting on, and How Is Their Satisfaction Affected? Examining Online Reviews in the on-Demand Food Service Context. Decis. Support Syst. 2021, 142, 113467. [Google Scholar] [CrossRef]
  65. Markiewicz, M.; Wyłomańska, A. Time Series Forecasting: Problem of Heavy-Tailed Distributed Noise. Int. J. Adv. Eng. Sci. Appl. Math. 2021, 13, 248–256. [Google Scholar] [CrossRef]
  66. Zhang, Y.; Zhou, X.; Zhang, Y.; Li, S.; Liu, S. Improving Time Series Forecasting in Frequency Domain Using a Multi Resolution Dual Branch Mixer with Noise Insensitive ArcTanLoss. Sci. Rep. 2025, 15, 12557. [Google Scholar] [CrossRef]
  67. Hyndman, R.J.; Koehler, A.B. Another Look at Measures of Forecast Accuracy. Int. J. Forecast. 2006, 22, 679–688. [Google Scholar] [CrossRef]
  68. Zachariadis, M.; Ozcan, P. The API Economy and Digital Transformation in Financial Services: The Case of Open Banking. 2017. Available online: https://papers.ssrn.com/sol3/papers.cfm?abstract_id=2975199 (accessed on 27 August 2025).
  69. Armstrong, J.S. Findings from Evidence-Based Forecasting: Methods for Reducing Forecast Error. Int. J. Forecast. 2007, 22, 583–598. [Google Scholar] [CrossRef]
  70. Ng, K.W.; Horawalavithana, S.; Iamnitchi, A. Social Media Activity Forecasting with Exogenous and Endogenous Signals. Soc. Netw. Anal. Min. 2022, 12, 102. [Google Scholar] [CrossRef]
  71. Motiwalla, L.F.; Albashrawi, M.; Kartal, H.B. Uncovering Unobserved Heterogeneity Bias: Measuring Mobile Banking System Success. Int. J. Inf. Manag. 2019, 49, 439–451. [Google Scholar] [CrossRef]
  72. Yu, Z.; Liu, J. The Digital Revolution in Banking: Unpacking Risk Management in the Age of Transformation. Int. Rev. Econ. Financ. 2025, 103, 104444. [Google Scholar] [CrossRef]
  73. Zhao, J.; Wang, C.; Ibrahim, H.; Chen, Y. The Impact of Digital Financial Inclusion on Bank Performance: An Exploration of Mechanisms of Action and Heterogeneity. PLoS ONE 2024, 19, e0309099. [Google Scholar] [CrossRef]
  74. Barjaktarovic Rakocevic, S.; Rakic, N.; Rakocevic, R. An Interplay Between Digital Banking Services, Perceived Risks, Customers’ Expectations, and Customers’ Satisfaction. Risks 2025, 13, 39. [Google Scholar] [CrossRef]
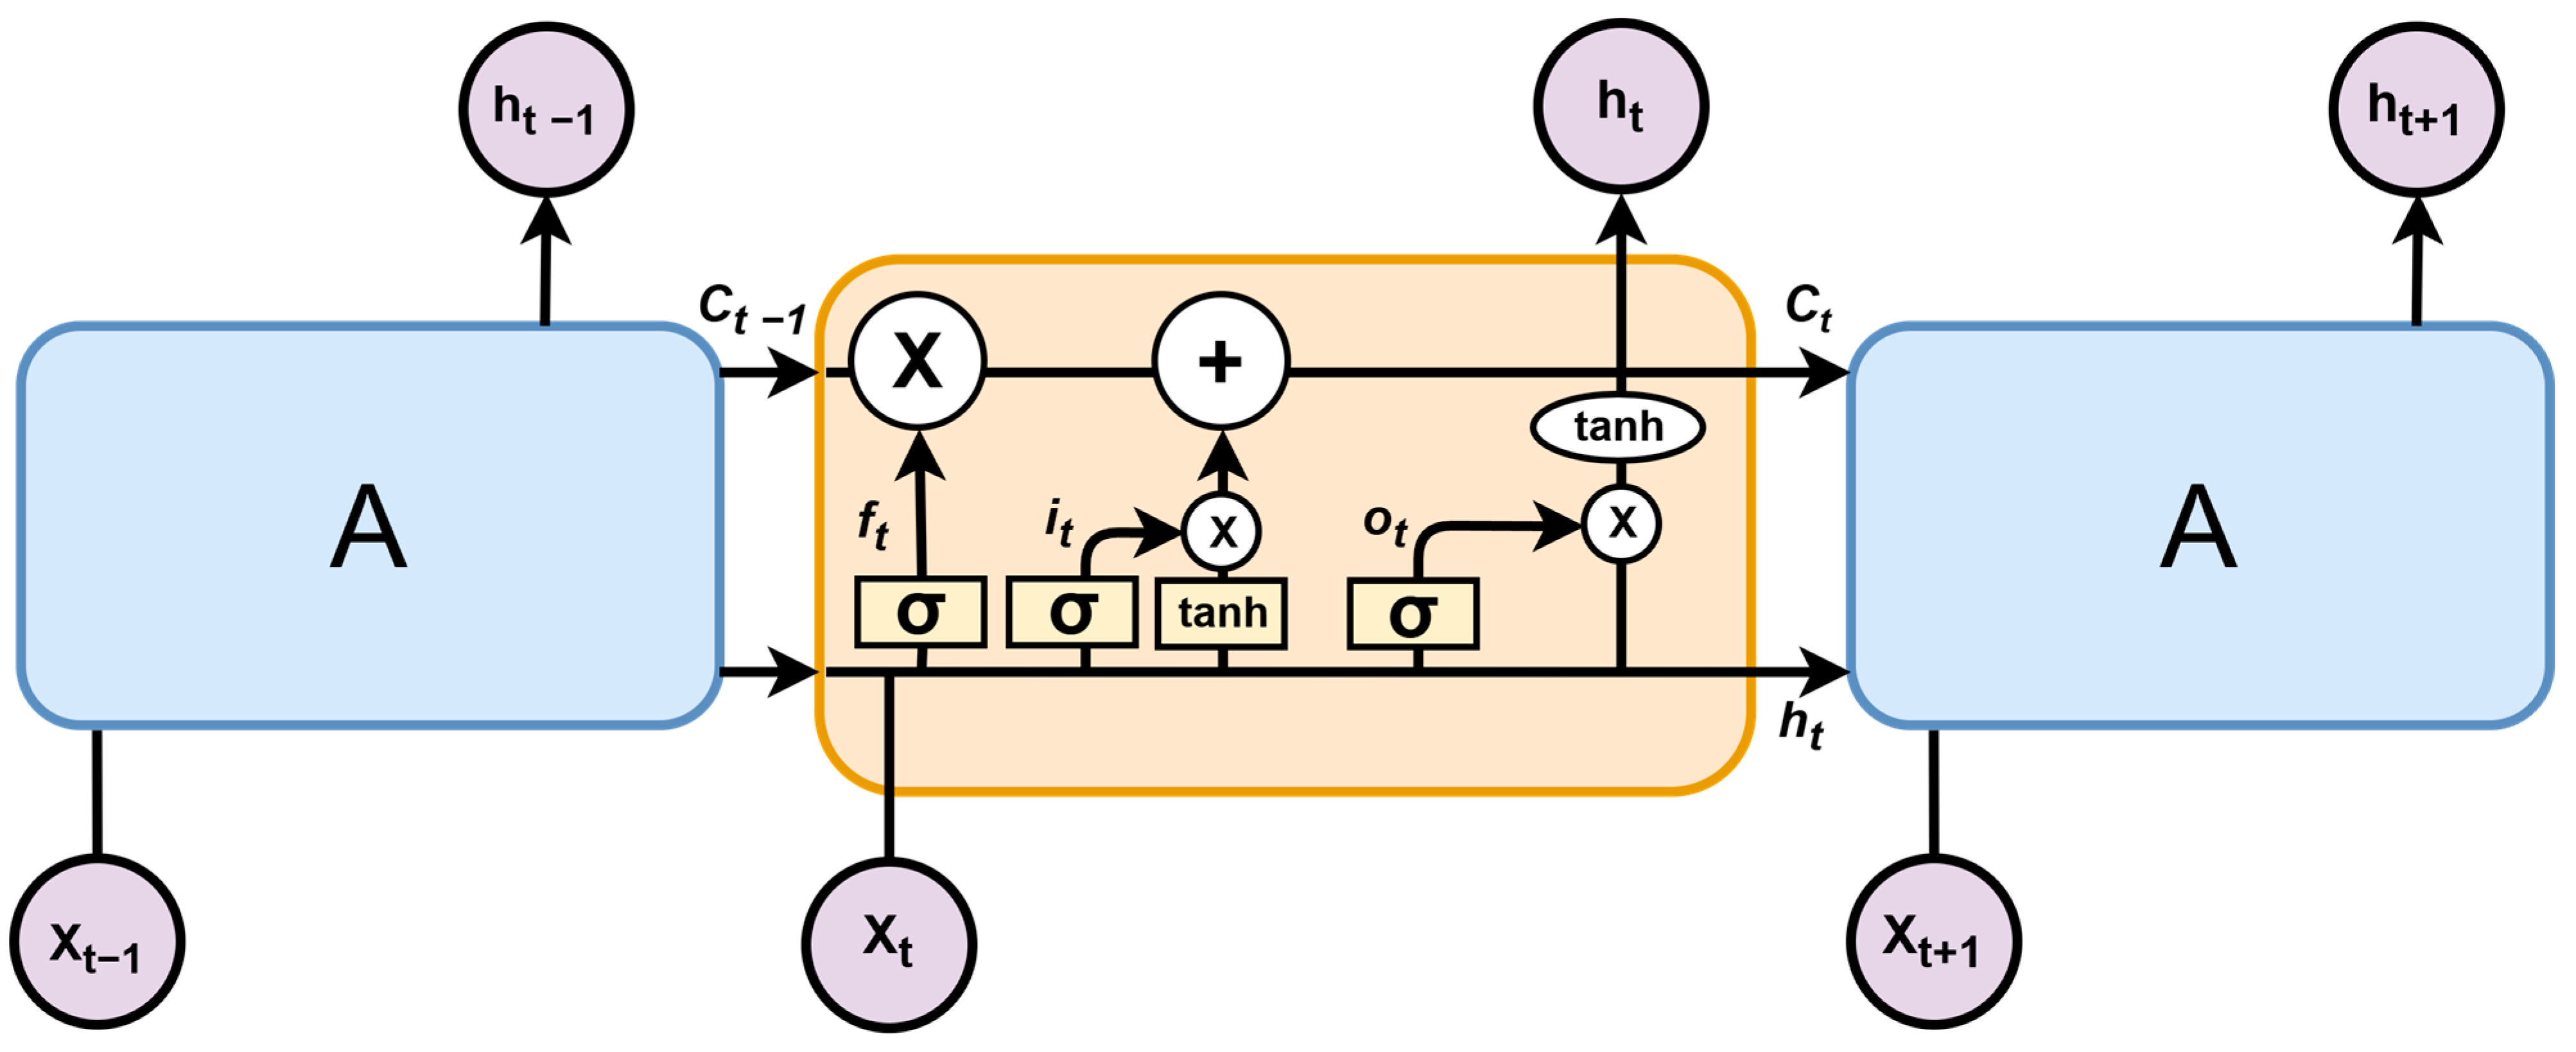
Figure 1. Information flow within an LSTM cell.
Systems 13 00949 g001
Table 1. Comparative review of literature.
ResearchContextData SourceMethodKey FindingsContribution/Limitation
[9]Use of app reviews in software engineeringApp store reviews (general)Systematic literature reviewReviews useful for requirements and bug reporting, but short/fragmented texts pose challengesComprehensive mapping for SE, not banking-specific
[11]Developer responses in banking appsApp store reviews (KSA & USA)Content analysisResponse tone/style strongly influence user satisfactionHighlights developer–user communication, limited scope
[21]Canadian mobile banking app reviewsiOS & Google Play reviewsLSTM-based sentiment analysis, topic modeling82% accuracy; positives: usability/reliability, negatives: login issues & bugsStrong methodological focus, single-country limitation
[25]User feedback and release effectsMobile app reviewsRegression analysisFeedback significantly impacts subsequent ratingsCausal link shown, not app-specific
[27]Technological frustration in updatesMobile apps (general)Survey & data analysisFrustration and passion drive post-update dissatisfactionEmphasizes psychological factors
[28]Determinants of satisfaction in banking appsKorean mobile banking appsText miningSecurity and ease of use strongly improve ratingsBanking-specific, limited to one region
[33]Financial time series forecastingFinancial indicesLSTM vs. ARIMALSTM achieved 80%+ lower errorBaseline methodological reference
[34]Deep learning architectures in time seriesMultidomain datasetsLSTM, CNN, RNN comparisonLSTM outperforms in overall accuracyGeneral methodological benchmark
Table 2. Features of the collected dataset.
Feature NameData TypeDescription
package_nameobjectUnique identifier of the mobile banking app (e.g., com.pozitron.iscep).
review_idobjectUnique ID for each user review.
contentobjectText content of the user review.
scoreint64Star rating provided by the user (1–5).
thumbs_up_countint64Number of likes/upvotes a review received.
review_created_versionobjectApp version at the time the review was written.
at_utcobjectReview timestamp in UTC.
scrape_langobjectLanguage of the review text (e.g., tr).
scrape_countryobjectCountry of origin of the review (e.g., tr).
scraped_at_utcobjectTime when the review was scraped in UTC.
at_istobjectReview timestamp converted to Istanbul local time.
scraped_at_istobjectScraping timestamp in Istanbul local time.
bank_nameobjectName of the bank associated with the application.
Table 3. Hyperparameter search space.
HyperparameterRange/ValuesTypeDescription
window10–45IntegerInput window length (in days)
units48–192IntegerNumber of neurons in the LSTM layer
dropout0.10–0.40FloatDropout rate to reduce overfitting
batch_size32–128IntegerNumber of samples per training batch
lr0.0005–0.005FloatLearning rate of the Adam optimizer
epochs80–160IntegerMaximum number of training epochs
Table 4. Fixed training and validation settings.
SettingValueNotes
LossHuber(delta = 1.0)Robust to outliers
OptimizerAdamlr taken from the search space
EarlyStoppingpatience = 12, restore_best_weightsMonitors val_loss
ReduceLROnPlateaufactor = 0.5, patience = 6, min_lr = 1 × 10⁻⁵Monitors val_loss
Validation splitTime ordered, about 20%Falls back to validation_split = 0.2 if needed
Random seed42Reproducibility
Output activation (rating)sigmoidTarget scaled to [0, 1] with MinMax
Output activation (volume)linearTarget uses log1p, inverse applied for metrics
Test shareabout 15%Time ordered split
Seasonalitym = 7For SNaive baseline comparison
Forecast horizon1 dayOutput dimension
Feature scalingRobustScalerFit on train only to prevent leakage
Fallback grid (HPO off)window {14, 30}, units {64, 128}, epochs 120, batch 64, lr 0.002, dropout 0.2Used when HPO is disabled
Disclaimer/Publisher’s Note: The statements, opinions and data contained in all publications are solely those of the individual author(s) and contributor(s) and not of MDPI and/or the editor(s). MDPI and/or the editor(s) disclaim responsibility for any injury to people or property resulting from any ideas, methods, instructions or products referred to in the content.