


Green Innovation Driven by Digital Transformation: An Innovation Chain Perspective

Abstract
1. Introduction
- (1)
- To discuss the concept of the IC and define the green innovation chain (GIC);
- (2)
- To evaluate the impact of DT on GI from the perspective of the GIC;
- (3)
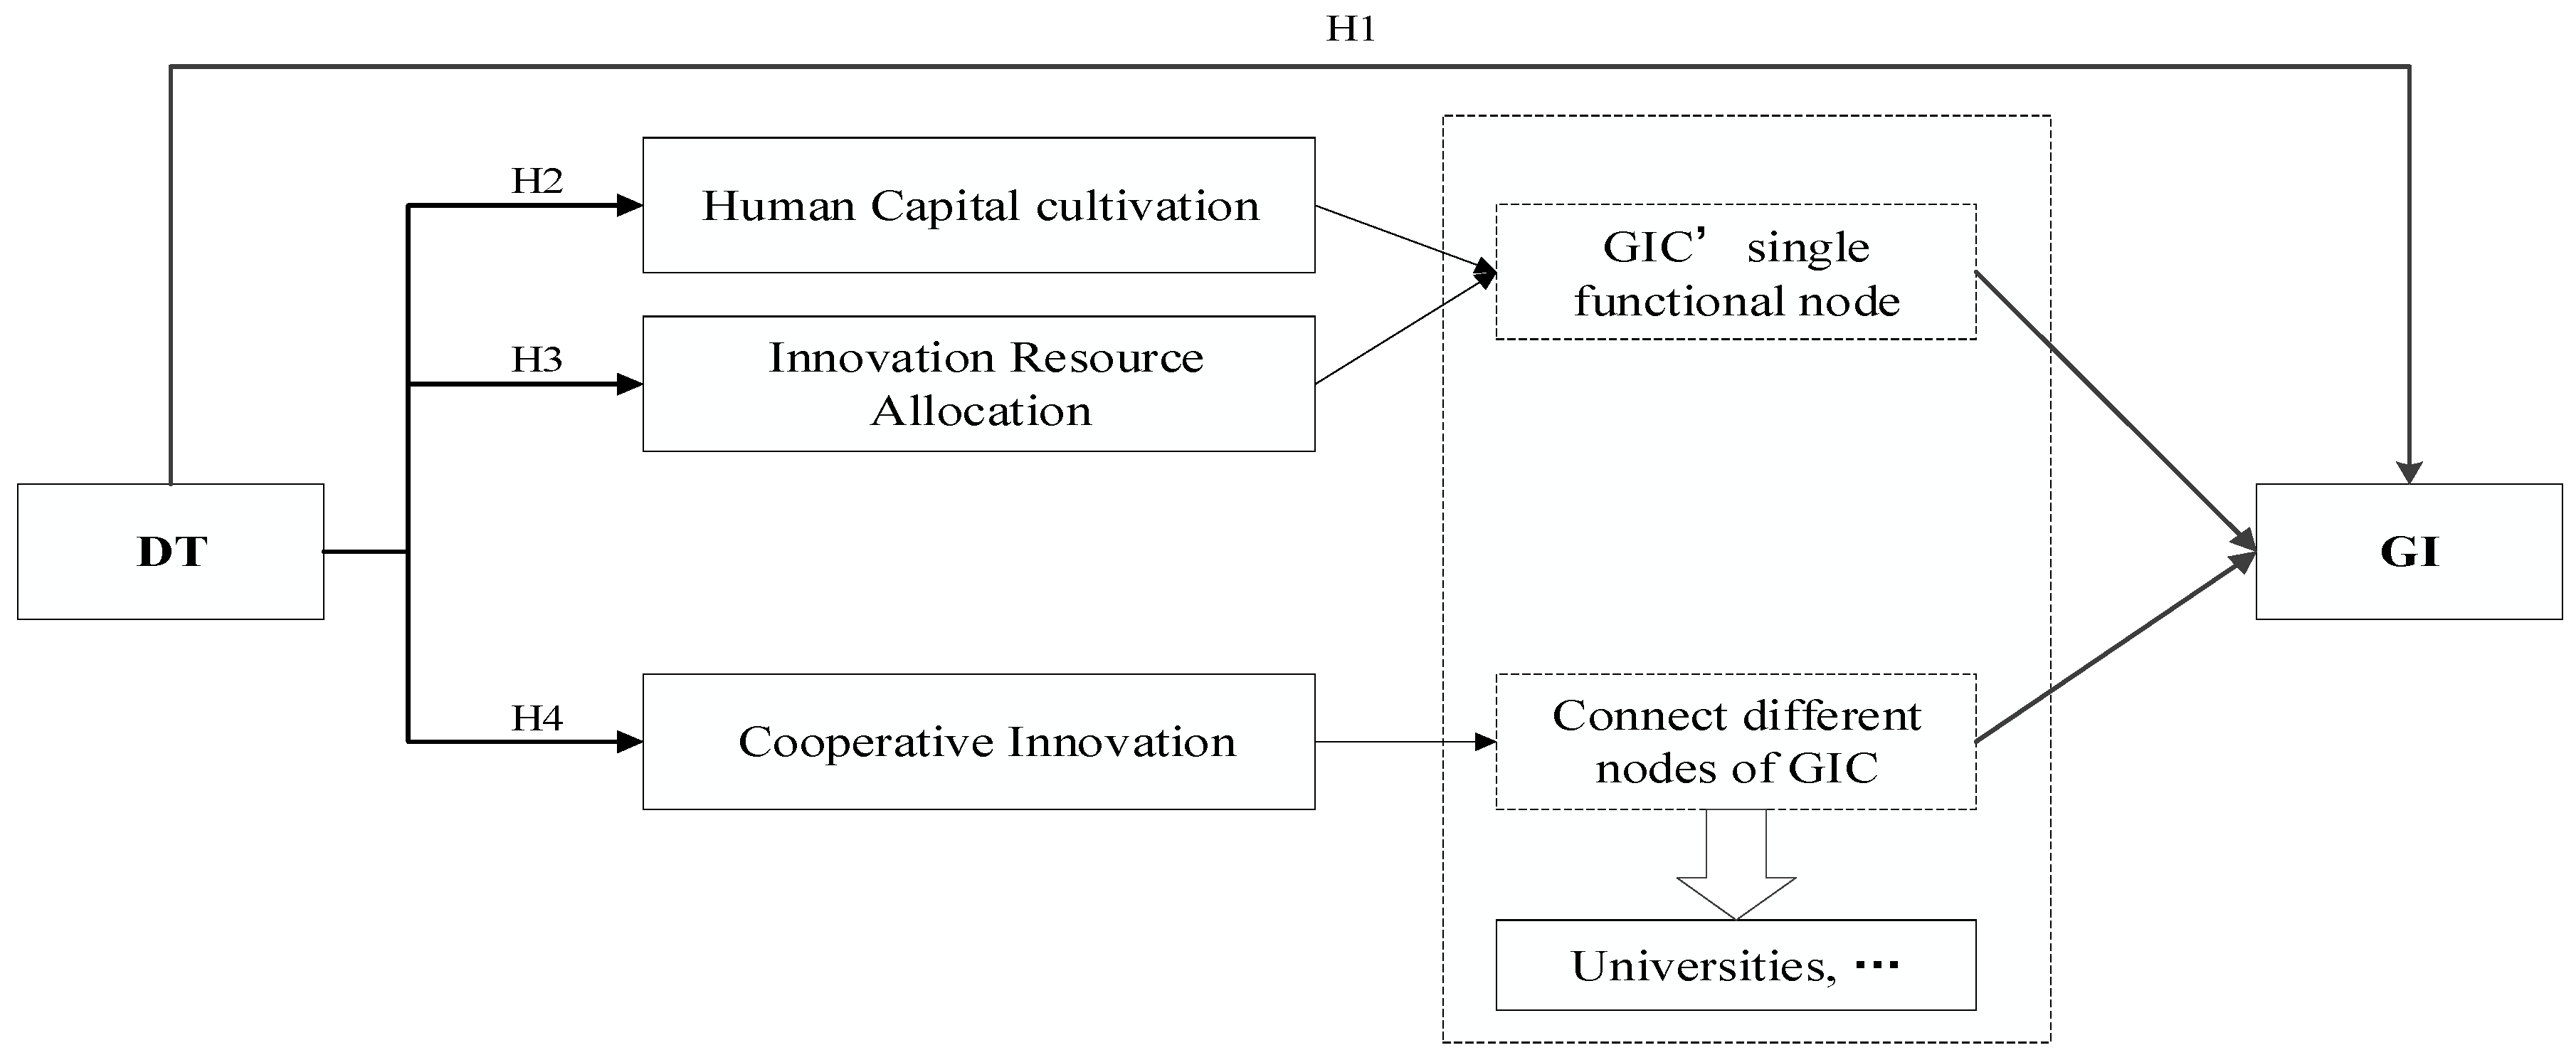
- To explore the mechanisms through which DT affects GI from the perspective of the GIC.
2. Literature Review and Research Hypothesis
2.1. Definition and Research Progress of Innovation Chain
2.2. The Theoretical Logic of Enterprise Digital Transformation Affecting Green Innovation
3. Methodology
3.1. Research Sample and Data Source
3.2. Variable Setting
3.3. Econometric Model
4. Results
4.1. Baseline Regression
4.2. Robustness Tests
4.2.1. Endogeneity Tests
4.2.2. Robustness Tests in Other Ways
- (1)
- Alternative Measurement of Independent Variables. Firstly, we added an alternative indicator for DT, using the ratio of intangible assets related to digital technologies (DT_assets) as a robustness check. According to Tao et al. [49], we identified intangible assets related to digital technologies from the total intangible assets of companies and then calculated the ratio of these intangible assets relative to total assets as an alternative indicator for DT. The result is presented in column (1) of Table 5. From column (1) of Table 5, it can be seen that the coefficient of DT_assets is significantly positive at the statistical level of 1%. Secondly, we conducted a principal component analysis (PCA) of the five technology dimensions to remove redundant information provided by individual indicators and generate a new DT indicator (DT_FCA). The results are shown in column (2) of Table 5. The results in column (2) indicate the robustness of the results.
- (2)
- Alternative Estimation Methods. In the fixed-effects model designed in the baseline regression, only industry and year-fixed effects were controlled, which might overlook some individual-level factors affecting companies. Therefore, we added controls for individual company effects to the model. The results are presented in column (3) of Table 5. The results in column (3) of Table 5 indicate that even after controlling for individual company effects, DT is statistically significant at the 1% level.
- (3)
- Eliminate the influence of the strategic behavior of exaggerating DT in the annual report. Since the DT indicator used in this study is obtained from annual reports, companies may engage in exaggeration in their disclosures, resulting in an overestimation of the degree of DT. We also observed that there are observations with zero DT in the sample, indicating that some companies may not have undergone DT. Therefore, we re-estimated the regression after removing samples with zero DT. The results are shown in column (4) of Table 5. In column (4) of Table 5, the coefficient of DT is 0.098 and statistically significant at the 1% level.
- (4)
- Consider the entry and exit of enterprises. Entry and exit behaviors of companies are essential factors influencing industry competition, which, in turn, affect a company’s GI [50]. To account for this, we used a balanced panel format that excludes the impact of company entry and exit. The results are shown in column (5) of Table 5. The entry and exit behavior of companies, as shown in the regression results in column (5) of Table 5, still supports the conclusion of the baseline regression.
5. Heterogeneity Analysis
5.1. Heterogeneity in Firm Size
5.2. Heterogeneity in Industry Policies
5.3. Heterogeneity in Market Competition Level
5.4. Heterogeneity in Social Environmental Concern
6. Mediation Mechanism Analysis
7. Discussion
7.1. Findings
- (1)
- Corporate DT positively affects GI behavior. This conclusion remains robust even after addressing endogeneity concerns and taking robustness tests.
- (2)
- DT not only augments the quantity of green patent applications but also elevates the quality and efficiency of GI activities within enterprises.
- (3)
- SEMs, companies receiving government R&D subsidies, facing lower environmental regulatory pressures, and possessing higher-quality information disclosure tend to experience a more pronounced positive impact of DT. Moreover, the effect of DT on GI becomes more potent as industry competition intensifies, although this effect shows diminishing returns beyond a certain threshold.
- (4)
- DT exerts its influence on GI through three principal mechanisms: the improvement of human capital, the allocation of innovation resources, and the facilitation of cooperative innovation.
7.2. Implications for Policymakers
7.3. Limitations and Future Research
Author Contributions
Funding
Institutional Review Board Statement
Data Availability Statement
Conflicts of Interest
References
- Liu, Y.; Zhang, X.; Shen, Y. Technology-driven carbon reduction: Analyzing the impact of digital technology on China’s carbon emission and its mechanism. Technol. Forecast. Soc. Chang. 2024, 200, 123124. [Google Scholar] [CrossRef] [Scilit]
- Schiederig, T.; Tietze, F.; Herstatt, C. Green innovation in technology and innovation management—An exploratory literature review. RD Manag. 2012, 42, 180–192. [Google Scholar] [CrossRef] [Scilit]
- Shen, Y.; Zhang, X. Intelligent manufacturing, green technological innovation and environmental pollution. J. Innov. Knowl. 2023, 279, 122474. [Google Scholar] [CrossRef] [Scilit]
- Hur, W.M.; Kim, Y.; Park, K. Assessing the effects of perceived value and satisfaction on customer loyalty: A ‘green’ perspective. Corp. Soc. Responsib. Environ. Manag. 2013, 20, 146–156. [Google Scholar] [CrossRef] [Scilit]
- Fliaster, A.; Kolloch, M. Implementation of green innovations—The impact of stakeholders and their network relations. RD Manag. 2017, 47, 689–700. [Google Scholar] [CrossRef] [Scilit]
- Hao, X.; Li, Y.; Ren, S.; Wu, H.; Hao, Y. The role of digitalization on green economic growth: Does industrial structure optimization and green innovation matter? J. Environ. Manag. 2023, 325, 116504. [Google Scholar] [CrossRef] [Scilit]
- Shen, Y.; Zhang, X. Digital economy, intelligent manufacturing, and labor mismatch. J. Adv. Comput. Intell. Intell. Inform. 2022, 26, 655–664. [Google Scholar] [CrossRef] [Scilit]
- Yang, Z.; Ling, H.; Chen, J. Urban green development attention and enterprise green technology innovation. J. World Econ. 2024, 47, 211–232. [Google Scholar]
- Wu, G.; Deng, L.; Niu, X. Evolutionary game analysis of green technology innovation behaviour for enterprises from the perspective of prospect theory. Discret. Dyn. Nat. Soc. 2022, 200, 5892384. [Google Scholar] [CrossRef] [Scilit]
- Huang, X.; Wang, Y.; Chen, Y.; Hu, Z. Green technology innovation and enterprise performance: An analysis based on causal machine learning models. Sustainability 2024, 16, 2309. [Google Scholar] [CrossRef] [Scilit]
- Gil-Gomez, H.; Guerola-Navarro, V.; Oltra-Badenes, R.; Lozano-Quilis, J.A. Customer relationship management: Digital transformation and sustainable business model innovation. Econ. Res. Ekon. Istraživanja 2020, 33, 2733–2750. [Google Scholar] [CrossRef] [Scilit]
- Liu, X.; Liu, F.; Ren, X. Firms’ digitalization in manufacturing and the structure and direction of green innovation. J. Environ. Manag. 2023, 335, 117525. [Google Scholar] [CrossRef] [Scilit]
- Luo, S.; Yimamu, N.; Li, Y.; Wu, H.; Irfan, M.; Hao, Y. Digitalization and sustainable development: How could digital economy development improve green innovation in China? Bus. Strategy Environ. 2023, 32, 1847–1871. [Google Scholar] [CrossRef] [Scilit]
- Huan, Y.L.; Liu, Q.; Han, Z.Y. Digital Development Influencing Mechanism on Green Innovation Performance: A Perspective of Green Innovation Network. IEE Access 2023, 11, 22490–22504. [Google Scholar] [CrossRef] [Scilit]
- Le, T.T.; Phan Vo Nhu, Q.; Bui Ngoc Bao, T.; Vu Nguyen Thao, L.; Pereira, V. Digitalisation driving sustainable corporate performance: The mediation of green innovation and green supply chain management. J. Clean. Prod. 2024, 446, 141290. [Google Scholar] [CrossRef] [Scilit]
- Zheng, Y.; Zhang, Q. Digital transformation, corporate social responsibility and green technology innovation-based on empirical evidence of listed companies in China. J. Clean. Prod. 2023, 424, 138805. [Google Scholar] [CrossRef] [Scilit]
- Aghion, P.; Dechezleprêtre, A.; Hemous, D.; Martin, R.; Van Reenen, J. Carbon taxes, path dependency, and directed technical change: Evidence from the auto industry. J. Political Econ. 2016, 124, 1–51. [Google Scholar] [CrossRef] [Scilit]
- Ma, D.; Zhu, Q. Innovation in emerging economies: Research on the digital economy driving high-quality green development. J. Bus. Res. 2022, 145, 801–813. [Google Scholar] [CrossRef] [Scilit]
- Rosa, F.S.; Compagnucci, L.; Lunkes, R.J.; Monteiro, J.J. Green innovation ecosystem and water performance in the food service industry: The effects of environmental management controls and digitalization. Bus. Strateg. Environ. 2023, 32, 5459–5476. [Google Scholar] [CrossRef] [Scilit]
- Rowan, N.J.; Murray, N.; Qiao, Y.; O’Neill, E.; Clifford, E.; Barceló, D.; Power, D.M. Digital transformation of peatland eco-innovations (‘Paludiculture’): Enabling a paradigm shift towards the real-time sustainable production of ‘green-friendly’ products and services. Sci. Total Environ. 2022, 838, 156328. [Google Scholar] [CrossRef] [Scilit]
- Yuan, Y.; Guo, X.; Shen, Y. Digitalization drives the green transformation of agriculture-related enterprises: A case study of a-share agriculture-related listed companies. Agriculture 2024, 14, 1308. [Google Scholar] [CrossRef] [Scilit]
- Shao, Y.; Xu, K.; Shan, Y.G. Leveraging corporate digitalization for green technology innovation: The mediating role of resource endowments. Technovation 2024, 133, 102999. [Google Scholar] [CrossRef] [Scilit]
- Han, Y.; Li, Z.; Feng, T.; Qiu, S.; Hu, J.; Yadav, K.K.; Obaidullah, A.J. Unraveling the impact of digital transformation on green innovation through microdata and machine learning. J. Environ. Manag. 2024, 354, 120271. [Google Scholar] [CrossRef] [Scilit]
- Fan, W.; Wu, X.; He, Q. Digitalization drives green transformation of supply chains: A two-stage evolutionary game analysis. Ann. Oper. Res. 2024; early access. [CrossRef] [Scilit]
- Li, S.; Gao, L.; Han, C.; Gupta, B.; Alhalabi, W.; Almakdi, S. Exploring the effect of digital transformation on Firms’ innovation performance. J. Innov. Knowl. 2023, 8, 100317. [Google Scholar] [CrossRef] [Scilit]
- Kogut, B.; Zander, U. Knowledge of the firm, combinative capabilities, and the replication of technology. Organ. Sci. 1992, 3, 383–397. [Google Scholar] [CrossRef] [Scilit]
- Freeman, C.P. Technology Policy and Economic Performance: Lessons from Japan; New York Pinter Publishers: London, UK, 1987. [Google Scholar]
- Tirole, J. The Theory of Industrial Organization; MIT Press: Cambridge, MA, USA, 1998. [Google Scholar]
- Peng, S.; Wu, S.; Tu, C. On the Technological Innovation Chain’s Structure, Formation and Operation. Appl. Mech. Mater. 2012, 174, 2024–2028. [Google Scholar] [CrossRef] [Scilit]
- Adner, R.; Kapoor, R. Value creation in innovation ecosystems: How the structure of technological interdependence affects firm performance in new technology generations. Strateg. Manag. J. 2010, 31, 306–333. [Google Scholar] [CrossRef]
- Chesbrough, H. Open innovation: A new paradigm for understanding industrial innovation. Open Innov. Res. A New Paradig. 2006, 400, 19. [Google Scholar] [CrossRef] [Scilit]
- Lin, X.; Liu, B.; Han, J.; Chen, X. Industrial upgrading based on global innovation chains: A case study of Huawei technologies Co., Ltd. Shenzhen. Int. J. Innov. Stud. 2018, 2, 81–90. [Google Scholar] [CrossRef] [Scilit]
- Hong, Y. Analysis of the stage of scientific and technological innovation and its innovation value chain. Economist 2017, 220, 5–12. [Google Scholar] [CrossRef]
- Liu, Z. From global value chain to global innovation chain: Engine of industrial development in new normal. Acad. Mon. 2015, 47, 5–14. [Google Scholar] [CrossRef]
- Salim, R.; Yao, Y.; Chen, G. Does human capital matter for energy consumption in China? Energy Econ. 2017, 67, 49–59. [Google Scholar] [CrossRef] [Scilit]
- Wang, C.H.; Juo, W. An environmental policy of green intellectual capital: Green innovation strategy for performance sustainability. Bus. Strategy Environ. 2021, 30, 3241–3254. [Google Scholar] [CrossRef] [Scilit]
- Tao, F.; Zhao, J.; Zhou, H. Does environmental regulation improve the quantity and quality of green innovation—Evidence from the target responsibility system of environmental protection. China Ind. Econ. 2021, 395, 136–154. [Google Scholar] [CrossRef]
- Cirillo, V.; Fanti, L.; Mina, A.; Ricci, A. The adoption of digital technologies: Investment, skills, work organisation. Struct. Change Econ. Dyn. 2023, 66, 89–105. [Google Scholar] [CrossRef] [Scilit]
- Köhler, J.; Sönnichsen, S.D.; Beske Jansen, P. Towards a collaboration framework for circular economy: The role of dynamic capabilities and open innovation. Bus. Strategy Environ. 2022, 31, 2700–2713. [Google Scholar] [CrossRef] [Scilit]
- Triguero, A.; Moreno-Mondéjar, L.; Davia, M.A. Drivers of different types of eco-innovation in European SMEs. Ecol. Econ. 2013, 92, 25–33. [Google Scholar] [CrossRef] [Scilit]
- Hsu, C.; Quang-Thanh, N.; Chien, F.; Li, L.; Mohsin, M. Evaluating green innovation and performance of financial development: Mediating concerns of environmental regulation. Environ. Sci. Pollut. Res. 2021, 28, 57386–57397. [Google Scholar] [CrossRef] [Scilit]
- Hess, T.; Matt, C.; Benlian, A.; Wiesboeck, F. Options for Formulating a Digital Transformation Strategy. Mis Q. Exec. 2016, 15, 123–139. Available online: https://aisel.aisnet.org/misqe/vol15/iss2/6 (accessed on 20 August 2024).
- Yoo, Y., Jr.; Boland, R.J.; Lyytinen, K.; Majchrzak, A. Organizing for Innovation in the Digitized World. Organ. Sci. 2012, 23, 1398–1408. [Google Scholar] [CrossRef] [Scilit]
- Wu, F.; Hu, H.; Lin, H.; Ren, X. Enterprise digital transformation and capital market performance: Empirical evidence from stock liquidity. J. Manag. World 2021, 37, 130–144. [Google Scholar] [CrossRef]
- Hansen, T. Juggling with proximity and distance: Cooperative innovation projects in the danish cleantech industry. Econ. Geogr. 2014, 90, 375–402. [Google Scholar] [CrossRef] [Scilit]
- Horbach, J. Determinants of environmental innovation—New evidence from German panel data sources. Res. Policy 2008, 37, 163–173. [Google Scholar] [CrossRef] [Scilit]
- Lin, B.; Ma, R. How does digital finance influence green technology innovation in China? Evidence from the financing constraints perspective. J. Environ. Manag. 2022, 320, 115833. [Google Scholar] [CrossRef] [Scilit]
- Brynjolfsson, E.; McElheran, K. The Rapid Adoption of Data-Driven Decision-Making. Am. Econ. Rev. 2016, 106, 133–139. [Google Scholar] [CrossRef] [Scilit]
- Tao, F.; Wang, X.R.; Xu, Y.; Zhu, P. Digital Transformation, Resilience of Industrial Chain and Supply Chain, and Enterprise Productivity. China Ind. Econ. 2023, 5, 118–136. [Google Scholar] [CrossRef]
- Aghion, P.; Bloom, N.; Blundell, R.; Griffith, R.; Howitt, P. Competition and innovation: An inverted-U relationship. Q. J. Econ. 2005, 120, 701–728. [Google Scholar] [CrossRef] [Scilit]
- Acemoglu, D.; Akcigit, U.; Hanley, D.; Kerr, W. Transition to clean technology. J. Political Econ. 2016, 124, 52–104. [Google Scholar] [CrossRef] [Scilit]
- Liu, S.; Yan, J.; Zhang, S.; Lin, H. Can corporate digital transformation promote input-output efficiency? J. Manag. World 2021, 37, 170–190. [Google Scholar] [CrossRef]
- Wang, S.; Li, X.; Li, Z.; Ye, Y. The effects of government support on enterprises’ digital transformation: Evidence from China. Manag. Decis. Econ. 2023, 44, 2520–2539. [Google Scholar] [CrossRef] [Scilit]
- Bai, M.; Guan, H.; Hong, Y.; Sun, H. A Study of the Impact of Manufacturing Servitization on Firms’ Cost Stickiness. Systems 2024, 12, 266. [Google Scholar] [CrossRef] [Scilit]
- Jaškevičiūtė, V.; Zsigmond, T.; Berke, S.; Berber, N. Investigating the impact of person-organization fit on employee well-being in uncertain conditions: A study in three central European countries. Empl. Relat. 2024, 46, 188–211. [Google Scholar] [CrossRef] [Scilit]
- Powell, W. Neither market nor hierarchy: The sociology of organizations: Classic, contemporary, and critical readings. Res. Organ. Behav. 1990, 12, 295–336. [Google Scholar]
- Porter, M.E. Competitive Strategy: Techniques for Analyzing Industries and Competitors; Free Press: New York, NY, USA, 1980. [Google Scholar]
- Straughan, R.D.; Roberts, J.A. Environmental segmentation alternatives: A look at green consumer behavior in the new millennium. J. Consum. Mark. 1999, 16, 558–575. [Google Scholar] [CrossRef] [Scilit]
- Testa, F.; Pretner, G.; Iovino, R.; Bianchi, G.; Tessitore, S.; Iraldo, F. Drivers to green consumption: A systematic review. Environ. Dev. Sustain. 2021, 23, 4826–4880. [Google Scholar] [CrossRef] [Scilit]
- Cheng, J.; Liu, Y. The effects of public attention on the environmental performance of high-polluting firms: Based on big data from web search in China. J. Clean. Prod. 2018, 186, 335–341. [Google Scholar] [CrossRef] [Scilit]
- He, Q.; Ribeiro-Navarrete, S.; Botella-Carrubi, D. A matter of motivation: The impact of enterprise digital transformation on green innovation. Rev. Manag. Sci. 2024, 18, 1489–1518. [Google Scholar] [CrossRef] [Scilit]

| Variables | Symbol | Definition | N | Mean | Sd | Min | Max |
|---|---|---|---|---|---|---|---|
| Green innovation | GI | Logarithm (base e) of the number of green invention patent applications by manufacturing enterprises, with a constant of 1 added. | 16,366 | 0.761 | 0.000 | 3.664 | 0.377 |
| Digital transformation | DT | Logarithm (base e) of the word frequency related to digital transformation found in the manufacturing enterprises’ annual reports, with a constant of 1 added. | 16,366 | 1.443 | 0.000 | 5.209 | 1.635 |
| Enterprise age | AGE | Logarithm (base e) of the difference between the year of sample observation and the year of the enterprise’s establishment. | 16,366 | 0.324 | 1.946 | 3.497 | 2.871 |
| Enterprise ownership | SOE | Binary variable, where 1 represents state-owned enterprises, and 0 represents private enterprises. | 16,366 | 0.452 | 0.000 | 1.000 | 0.287 |
| Enterprise size | SIZE | Logarithm (base e) of the number of total number of employees. | 16,366 | 1.156 | 5.384 | 11.086 | 7.747 |
| Duality of roles | GOV | Binary variable, where 1 indicates that the chairman and the general manager roles are held concurrently by the same person, and 0 indicates otherwise. | 16,366 | 0.465 | 0.000 | 1.000 | 0.315 |
| Leverage ratio | LEV | Ratio of total liabilities to assets. | 16,366 | 0.190 | 0.060 | 0.859 | 0.401 |
| ROA | Return on assets, ratio of net income to total asset. | 16,366 | 0.065 | −0.276 | 0.201 | 0.039 | |
| Business revenue | BR | The increase rate of operating revenue. | 16,366 | 0.809 | −0.936 | 5.877 | 0.207 |
| Tobin Q | TQ | Proportion of market capitalization to total assets. | 16,366 | 1.362 | 0.858 | 8.690 | 2.161 |
| Management ownership | MO | Proportion of all shares held by directors, supervisors and executives. | 16,366 | 0.201 | 0.000 | 0.675 | 0.163 |
| Herfindahl–Hirschman index | HHI | Herfindahl–Hirschman Index | 16,366 | 0.138 | 0.027 | 0.862 | 0.135 |
| Variables | (1) | (2) | (3) | (4) |
|---|---|---|---|---|
| DT | 0.097 *** | 0.073 *** | 0.379 *** | 0.218 *** |
| (0.012) | (0.011) | (0.074) | (0.072) | |
| Constant | 0.236 *** | −0.882 *** | 0.742 *** | −6.857 *** |
| (0.020) | (0.181) | (0.202) | (1.206) | |
| CV | No | Yes | No | Yes |
| N | 12,837 | 12,837 | 12,646 | 12,646 |
| Industry FE | Yes | Yes | Yes | Yes |
| Year FE | Yes | Yes | Yes | Yes |
| Adj R2 | 0.128 | 0.194 | ||
| Pseudo R2 | 0.247 | 0.492 |
| Variables | (1) | (2) | (3) | (4) | (5) |
|---|---|---|---|---|---|
| L.AI | 0.108 *** | ||||
| (0.018) | |||||
| L. BLOCKCHAIN | 0.179 | ||||
| (0.133) | |||||
| L. CLOUD | 0.100 *** | ||||
| (0.017) | |||||
| L. BDA | 0.068 *** | ||||
| (0.017) | |||||
| L. DTAP | 0.063 *** | ||||
| (0.012) | |||||
| Control variable | Yes | Yes | Yes | Yes | Yes |
| Constant | −0.860 *** | −0.861 *** | −0.864 *** | −0.856 *** | −0.863 *** |
| (0.180) | (0.182) | (0.180) | (0.181) | (0.182) | |
| N | 12,837 | 12,837 | 12,837 | 12,837 | 12,837 |
| Industry FE | Yes | Yes | Yes | Yes | Yes |
| Year FE | Yes | Yes | Yes | Yes | Yes |
| Adj R2 | 0.192 | 0.185 | 0.194 | 0.188 | 0.190 |
| Variables | (1) | (2) | (3) | (4) |
|---|---|---|---|---|
| 2SLS | DID | OLS | OLS | |
| DT | 0.047 ** | 0.069 *** | 0.064 *** | |
| (0.019) | (0.011) | (0.011) | ||
| Digdum × Yeardum | 0.053 ** | |||
| (0.021) | ||||
| CV | Yes | Yes | Yes | Yes |
| N | 12,837 | 12,837 | 12,837 | 12,837 |
| Industry FE | Yes | Yes | Yes | Yes |
| Year FE | Yes | Yes | Yes | Yes |
| City FE | No | No | No | Yes |
| F statistics | 1359.55 | |||
| Kleibergen–Paap rk LM statistic | 482.643 | |||
| Cragg–Donald Wald F statistic | 8966.931 | |||
| Adj R2 | 0.087 | 0.185 | 0.200 | 0.231 |
| Variables | (1) | (2) | (3) | (4) | (5) |
|---|---|---|---|---|---|
| DT_assets | 0.646 *** | ||||
| (0.124) | |||||
| DT_FCA | 0.303 *** | ||||
| (0.049) | |||||
| DT | 0.025 *** | 0.098 *** | 0.084 *** | ||
| (0.008) | (0.015) | (0.020) | |||
| Constant | −0.883 *** | 0.040 | −1.345 *** | −1.396 *** | |
| (0.182) | (0.503) | (0.223) | (0.354) | ||
| N | 12,837 | 12,837 | 12,837 | 8438 | 4766 |
| CV | Yes | Yes | Yes | Yes | Yes |
| Industry FE | Yes | Yes | Yes | Yes | Yes |
| Year FE | Yes | Yes | Yes | Yes | Yes |
| Enterprise FE | No | No | Yes | No | No |
| Adj R2 | 0.192 | 0.195 | 0.687 | 0.217 | 0.219 |
| Variables | (1) | (2) |
|---|---|---|
| Small and Medium Firms | Large Firms | |
| DT | 0.055 *** | 0.035 * |
| (0.010) | (0.018) | |
| Constant | 0.031 | 0.103 |
| (0.145) | (1.219) | |
| N | 8188 | 4649 |
| CV | Yes | Yes |
| Industry FE | Yes | Yes |
| Year FE | Yes | Yes |
| Adj R2 | 0.136 | 0.739 |
| The empirical p-value of Fisher’s permutation test | 0.002 | |
| Variables | (1) | (2) | (3) | (4) | (5) | (6) | (7) |
|---|---|---|---|---|---|---|---|
| Non-Subsidy | Subsidy | Non-Pollution | Pollution | Low-HHI | Medium-HHI | High-HHI | |
| DT | 0.066 *** | 0.094 *** | 0.085 *** | 0.033 * | 0.043 ** | 0.118 *** | 0.048 *** |
| (0.011) | (0.027) | (0.013) | (0.019) | (0.018) | (0.018) | (0.016) | |
| Constant | −0.864 *** | −1.144 *** | −0.818 *** | −1.189 *** | −1.096 *** | −0.800 ** | −0.893 *** |
| (0.193) | (0.326) | (0.190) | (0.318) | (0.300) | (0.311) | (0.295) | |
| N | 10,088 | 2749 | 8714 | 4123 | 4254 | 4340 | 4243 |
| CV | Yes | Yes | Yes | Yes | Yes | Yes | Yes |
| Industry FE | Yes | Yes | Yes | Yes | Yes | Yes | Yes |
| Year FE | Yes | Yes | Yes | Yes | Yes | Yes | Yes |
| Adj R2 | 0.195 | 0.191 | 0.194 | 0.213 | 0.153 | 0.197 | 0.235 |
| The empirical p-value of Fisher’s permutation test | 0.016 | 0.000 | |||||
| Variable | (1) | (2) | (3) | (4) |
|---|---|---|---|---|
| Low-Out Attention | High-Out Attention | Low-Quality Disclosure | High-Quality Disclosure | |
| DT | 0.067 *** | 0.079 *** | 0.044 ** | 0.075 *** |
| (0.015) | (0.014) | (0.021) | (0.012) | |
| Constant | −0.559 ** | −1.157 *** | −0.423 | −0.967 *** |
| (0.240) | (0.245) | (0.286) | (0.196) | |
| N | 6281 | 6556 | 1631 | 11,206 |
| CV | Yes | Yes | Yes | Yes |
| Industry FE | Yes | Yes | Yes | Yes |
| Year FE | Yes | Yes | Yes | Yes |
| Adj R2 | 0.179 | 0.213 | 0.101 | 0.206 |
| The empirical p-value of Fisher’s permutation test | 0.170 | 0.074 | ||
| Variables | (1) | (2) | (3) | (4) | (5) | (6) | (7) | (8) |
|---|---|---|---|---|---|---|---|---|
| Hu-Resource | GI | R&D | GI | TFP | GI | Cooperate | GI | |
| DT | 0.007 *** | 0.052 *** | 0.004 *** | 0.064 *** | 0.074 *** | 0.062 *** | 0.014 *** | 0.055 *** |
| (0.001) | (0.011) | (0.001) | (0.011) | (0.009) | (0.011) | (0.004) | (0.009) | |
| Hu-resource | 2.945 *** | |||||||
| (0.353) | ||||||||
| R&D | 2.079 *** | |||||||
| (0.315) | ||||||||
| TFP | 0.149 *** | |||||||
| (0.021) | ||||||||
| Cooperate | 1.246 *** | |||||||
| (0.040) | ||||||||
| Constant | 0.081 *** | −1.120 *** | 0.071 *** | −1.029 *** | 4.666 *** | −1.578 *** | −0.285 *** | −0.527 *** |
| (0.013) | (0.180) | (0.009) | (0.183) | (0.153) | (0.225) | (0.060) | (0.149) | |
| N | 12,837 | 12,837 | 12,837 | 12,837 | 12,837 | 12,837 | 12,837 | 12,837 |
| CV | Yes | Yes | Yes | Yes | Yes | Yes | Yes | Yes |
| Industry FE | Yes | Yes | Yes | Yes | Yes | Yes | Yes | Yes |
| Year FE | Yes | Yes | Yes | Yes | Yes | Yes | Yes | Yes |
| Adj R2 | 0.251 | 0.224 | 0.429 | 0.202 | 0.691 | 0.205 | 0.092 | 0.397 |
| Hypotheses | Contents | Hypothesis Testing Results |
|---|---|---|
| H1 | Enterprises DT has a positive effect on GI. | Validated |
| H2 | Enterprise DT promotes GI through human capital cultivation. | Validated |
| H3 | Enterprise DT promotes GI by improving the ability to allocate innovative resources. | Validated |
| H4 | Enterprise DT promotes GI by enhancing cooperative innovation capabilities. | Validated |
Disclaimer/Publisher’s Note: The statements, opinions and data contained in all publications are solely those of the individual author(s) and contributor(s) and not of MDPI and/or the editor(s). MDPI and/or the editor(s) disclaim responsibility for any injury to people or property resulting from any ideas, methods, instructions or products referred to in the content. |
© 2024 by the authors. Licensee MDPI, Basel, Switzerland. This article is an open access article distributed under the terms and conditions of the Creative Commons Attribution (CC BY) license (https://creativecommons.org/licenses/by/4.0/).
Share and Cite
Dong, C.; Shen, Y.; Geng, G. Green Innovation Driven by Digital Transformation: An Innovation Chain Perspective. Systems 2024, 12, 349. https://doi.org/10.3390/systems12090349
Dong C, Shen Y, Geng G. Green Innovation Driven by Digital Transformation: An Innovation Chain Perspective. Systems. 2024; 12(9):349. https://doi.org/10.3390/systems12090349
Chicago/Turabian StyleDong, Chenguang, Yang Shen, and Guobin Geng. 2024. "Green Innovation Driven by Digital Transformation: An Innovation Chain Perspective" Systems 12, no. 9: 349. https://doi.org/10.3390/systems12090349
APA StyleDong, C., Shen, Y., & Geng, G. (2024). Green Innovation Driven by Digital Transformation: An Innovation Chain Perspective. Systems, 12(9), 349. https://doi.org/10.3390/systems12090349

