
Resilience Characteristics and Driving Mechanism of Urban Collaborative Innovation Network—A Case Study of China’s New Energy Vehicle Industry

1
School of Business, Shandong University, Weihai 264209, China
2
Institutes of Science and Development, Chinese Academy of Sciences, Beijing 100190, China
3
School of Public Policy and Management, University of Chinese Academy of Sciences, Beijing 100049, China
*
Author to whom correspondence should be addressed.
Systems 2023, 11(5), 214; https://doi.org/10.3390/systems11050214
Submission received: 2 April 2023
/
Revised: 20 April 2023
/
Accepted: 20 April 2023
/
Published: 22 April 2023
(This article belongs to the Special Issue Frontiers in Complex Network Theory and Its Applications)
Abstract
:The innovation ecosystem of the new energy vehicle industry is highly complex and spans several sectors; it is important to increase the resistance of the new energy vehicle industry network. This paper explores regional resilience in the context of China’s new energy vehicle industry. Using patent cooperation data from 2011 to 2021, we construct a three-stage urban collaborative innovation network and analyze its structural characteristics. We also develop a resilience evaluation index system to measure the resilience of the network and its nodes. Furthermore, we propose a framework for resilience analysis that operates at the network, community, and node levels. Through our analysis of the network’s resilience characteristics and evolution, we investigate the driving mechanisms behind its formation using the exponential random graph model (ERGM). Empirical results demonstrate that the urban collaborative innovation network is expanding and strengthening, with increased resilience and the ability to withstand uncertainty. Notably, the distribution of node resilience exhibits spatial heterogeneity, with cities in the eastern and central regions demonstrating higher resilience than those in other areas. Furthermore, the study finds that economic development and investment in education and technology can enhance network connections and resilience. Additionally, this paper reveals a strong dependence of inter-city cooperation on geographical proximity.
JEL Classification:
C32; C51; C52; C531. Introduction
The innovation ecosystem of the new energy vehicle industry is highly complex and spans several sectors, including energy, transport, and urban planning. This ecosystem transcends the boundaries of traditional innovation and the responsibilities of individual departments. Numerous companies are involved in collaborative partnerships with organizations across the country, leading to the formation of innovation networks. Consequently, intercity cooperation is fostered to establish a regional collaborative innovation network. China is actively promoting the development of the new energy industry. Twenty-seven provinces, such as Jiangsu, Zhejiang, and Henan, have strategically incorporated the new energy industry into their development plans for advanced manufacturing industry clusters. According to the “2021 China New Energy Vehicle City Development Report”, as China’s new energy vehicle industry enters the stage of marketization, the focus of development will shift. The major cities and clusters of cities as development centers are poised to foster high-quality development in the new energy vehicle industry. Although previous research on regional innovation networks has examined network formation [1], development [2], and cooperation prediction [3], studies exploring the potential negative effects of these networks are still nascent [4]. As an emerging strategic industry, the new energy vehicle industry differs significantly from other industries when it comes to innovation subjects and technological evolution processes. Ongoing innovation output from enterprises, universities, research centers, etc., is crucial for sustainable growth in this industry. Strong urban collaborative relationships can support the establishment of network clusters. However, external shocks have the potential to disrupt collaboration between various creative entities, limiting the industry’s growth potential. The new energy vehicle industry often fails to keep up with the rapid development needs of the industry and upgrade its industrial standards due to innovation resource distribution issues, untimely innovation investment, and innovation success transformation barriers. Examples of this gap in innovation collaboration include the lack of integration between high-power charging technology and charging safety, decision control chip technology, supply chain security, and the various stages of dynamic growth in innovation networks. The current environment is becoming increasingly volatile and uncertain. There have been various external shocks, including worldwide technological competition, technology lockdown, and the COVID-19 pandemic. After the formation of the collaborative urban innovation network, it is important to increase the resistance of the network. Furthermore, enhancing the resilience of the innovation network and achieving the steady and rapid development of the new energy vehicle industry are urgent issues that require attention.
Historically, the term “resilience” can be traced back to the Latin word “resilio.” Its concept was first applied to physics to represent the properties of springs and the ability of materials to absorb energy, remain stable, or return to their initial state following disruptions. [5]. The theory of resilience has undergone significant development and has been widely applied in multiple disciplines, including ecology [6], sociology [7], psychology [8], economics [9], and disaster studies [10]. Although the concept and scope of resilience are constantly evolving, at its core, resilience refers to the ability of a system to recover its stability after being subjected to external disruptions. On the one hand, a stable state implies that the system remains unaffected by the shock. On the other hand, the system may recover to its initial state despite being affected by the shock or even adapt to it and evolve into a new system, demonstrating evolutionary resilience. Therefore, compared to defining resilience, it is more important for researchers to focus on examining how resilience can facilitate system development and determining methods to optimize its effectiveness in this context. As a system characteristic, resilience enables the system to anticipate dangers in advance, take measures to protect against them, and recover quickly after a shock [4,11].
The role of resilience in innovation systems is also crucial. Previous research on innovation resilience believes that it refers to the capacity of an innovation system to withstand unexpected disturbances, sustain its stability, and adjust or advance toward a more advanced functional level. Research has emphasized the self-adjustment and dynamic development of the innovation system in the face of adversity [12]. However, the existing literature focuses primarily on the role of innovation in organizational [13,14] and regional resilience [15], with inadequate attention paid to innovation resilience [16]. The study of the evolution of resilience in innovation regions and technology clusters is a crucial aspect of regional resilience research [17]. Therefore, exploring the development of innovation resilience at the regional level offers valuable information for establishing an effective innovation resilience system.
The idea of regional resilience arises from the intersection of the concepts of resilience and region. Boschma [18] defined it from an evolutionary standpoint, believing that it encompasses not only a region’s ability to withstand disruptions but also to achieve evolution by developing new growth paths. Scholars have conducted extensive research on the characteristics of regional resilience, concentrating on two key areas: (1) assessing regional resilience and (2) identifying the determinants that affect regional resilience.
Hundreds of studies have been conducted to quantify regional resilience, with two notable assessment methods gaining prominence. The first involves the development of an index system that incorporates indicators from various domains. Burton [19] used a wide range of indicators to measure disaster resilience, such as economic, social, and institutional indicators. Liang et al. [20] developed an index system to assess the resilience of China’s innovation ecosystem in national new districts across four dimensions: diversity, evolution, mobility, and buffering. Tan et al. [21] used eight indicators to describe urban economic resilience from three perspectives: persistence, adaptability, and transformation. The second approach involves illustrating resilience through case studies, which typically involve the analysis of historical documents and data. For example, Evans and Karecha [22] conducted an in-depth investigation of innovation clusters to explore the economic resilience of Munich, Germany, drawing on historical analysis. Ainuddin and Routray [23] used a simple random sample of households in Quetta to construct a composite community resilience index to assess community resilience following an earthquake. The two predominant methods for assessing resilience, namely, the selection of various dimensions and the investigation of cases, are primarily subjective in nature. In addition, they often overlook the crucial structural role of micro-individuals in enhancing regional resilience. In contrast, complex networks exhibit a more systemic and specific response in terms of resilience to external perturbations. Specifically, when an innovation ecosystem encounters external shocks, the innovation subjects (i.e., nodes) within the network, as well as the overall network structure, experience interrelated and mutually influential changes.
As for the factors that affect regional resilience, Boschma [18] considers the primary factors affecting regional resilience to be the industrial structure, network, and institutions. Wei and Ren [16], based on data from China’s cooperative patent applications, argue that diversification of innovation input does not promote resilience to local cooperative innovation and that the industrial and enterprise structure plays an intermediary role in this process. Lee’s research shows that collaborative innovation networks between cities can improve urban resilience and mitigate the negative effects of disasters and economic downturns [24]. Li et al. [25], who used the Liaoning Province of China as an example, developed a spatial econometric model and discovered that local governance and innovation ability benefit regional economic resilience. In contrast, the proportion of secondary industry and other factors have a detrimental effect. Regional resilience is largely determined by external factors, such as geography [26] and institutional arrangements [27], as well as internal mechanisms of adaptability, such as the ability of the local economy [28], infrastructure [29], and other factors to respond to disruptions and thrive in a circular economic system.
After reviewing the literature on regional resilience characteristics, it is evident that scholars have primarily utilized three tools in their research. The first tool is the case study method. Capello et al. [30] used a quantitative foresight method to investigate the impact of city size and functions on regional economic resilience, using Europe as a case study. Gong et al. [31] examined China’s resilience during and after the COVID-19 outbreak, arguing that regional resilience can be strengthened by combining institutional experience from previous infectious disease outbreaks, government support, and industrial structure. Similarly, Yu et al. [32] conducted field interviews and text analysis on the oil drilling and production equipment cluster in Dalian City, China, to investigate the impact of technological innovation, relational governance, and market diversification on regional resilience. However, the subjective nature of case studies means their findings are often susceptible to the researcher’s biases. The second tool uses indicators, such as those employed in the study by Cutter et al. [33], which employed 27 indicators in five dimensions, including society and economy, to analyze and evaluate regional resilience. In another study, Martin et al. [34] used resistance and recoverability indicators to examine regional resilience under economic recession by comparing the expected value before the shock with the actual value after the shock. However, describing the various stages of resilience evolution with these two tools is difficult. The complex network method has been increasingly employed as it can effectively capture the dynamic adaptive capacity of a region in response to external shocks and explore the process of resilience evolution. Numerous scholars have discovered that the network structure is critical in determining regional resilience [17,35]. As external shocks occur, the nodes in the network will change their states to deal with them. This will be followed by a change in the network’s structure, which lets the network adapt and recover, stay stable, or grow into a more sophisticated state.
In the studies to date, research on innovation and regional resilience has yielded substantial results. Most studies have concentrated on comparing resilience among various urban agglomerations or examining resilience from the perspective of inner cities. However, there is currently a dearth of comprehensive and systematic methods to measure the resilience of innovation networks. Furthermore, the analysis of resilience-driving factors focuses mainly on the evolution level. An analysis of the factors driving urban innovation resilience is absent. This paper uses the complex network technique to determine the durability of the collaborative innovation network of cities in China’s new energy vehicle industry. We create a three-stage collaborative urban innovation network from 2011 to 2021 based on patent cooperation data and analyze the network’s structural characteristics and evolutionary trends. We design a resilience evaluation index system based on the urban cooperative relationships in the innovation network to reveal the resilience characteristics of regional innovation networks. The random exponential graph model (ERGM) is used to investigate the resilience driving mechanism. This paper gives more empirical evidence and growth recommendations for China’s new energy vehicle industry, which has significant implications for making urban innovation networks more robust and increasing innovation output.
The structure of the rest of this paper is as follows: Section 2 introduces the overall research design of this article, including data collection and stage division, the construction of a resilience evaluation index system, and the application of the ERGM model in this study. Section 3 presents the empirical results. It describes the structural characteristics and the spatiotemporal distribution pattern of the resilience of the collaborative innovation network, analyzes the resilience results of the nodes, and identifies the driving mechanisms of resilience evolution. Finally, Section 4 provides conclusions and recommendations.
2. Research Design
2.1. Data Collection and Stage Division
2.1.1. Data Collection and Processing
The technological innovations in the new energy vehicle industry are reflected primarily in invention patents. This study used data from the PatSnap Global Patent Database. We searched for cooperative invention patents in China’s new energy vehicle industry from 2011 to 2021 using the keywords “pure electric”, “new energy”, “hybrid power”, “hydrogen power” and “fuel vehicle” [36]. The retrieved data were then processed as follows: (1) Cooperative invention patents unrelated to the new energy vehicle industry were eliminated. (2) To ensure the availability of follow-up research data, cooperative patents involving individuals, foreign enterprises, and companies from Hong Kong, Macao, and Taiwan were excluded from our analysis. (3) We used the “Aiqicha” enterprise inquiry platform to obtain the geographical location of each patent application unit. In cases where the partner of a patent was located in two different prefecture-level cities, we recorded one cooperative relationship between the two cities. If three or more cities were involved, we recorded a cooperative relationship between every two cities. This study obtained a total of 10,951 effective patent cooperation data in the new energy vehicle industry, resulting in 31,990 pairs of cooperation data from 272 prefecture-level and above cities.
2.1.2. Stage Division
The development of China’s new energy vehicle industry clearly exhibits stage characteristics. In October 2010, after the “Decision of the State Council on Accelerating the Fostering and Development of Strategic Emerging Industries” identified the new energy vehicle industry as one of China’s seven strategic emerging industries, the industry is poised for a new growth opportunity. The state has issued a substantial number of relevant policies. In 2015, “Made in China 2025” intends to make “energy-efficient and new energy vehicles” a key development field and increase research and development of critical components and technologies. As a result, the innovation network of the new energy vehicle industry has reached an advanced stage of development. In 2018, the “Notice by the Ministry of Finance, the Ministry of Industry and Information Technology, the Ministry of Science and Technology, and the National Development and Reform Commission of Further Improving the Fiscal Subsidy Policies for the Promotion and Application of New Energy Vehicles” strengthened the oversight of the new energy vehicle industry from various perspectives, and as a result, the innovation network entered the stage of standardized development. Consequently, this article divides the data into three stages: 2011–2014, 2015–2017, and 2018–2021, based on the above policy analysis. Using each city as a node and the collaboration between two cities as a border, this study constructed a three-stage collaborative urban innovation network for China’s new energy vehicle industry.
2.2. Resilience Evaluation Index System
With the aid of complex network theory, network resilience can describe the evolution of urban collaborative innovation systems. Network resilience is reflected in the ability of innovation entities to adapt and resist external shocks, maintain cooperative relationships, and foster new connections [37,38]. This study draws on prior research to measure resilience using three network indicators (network transmissibility, clustering, and hierarchy) and three centrality measures (degree, proximity, and mediation) at the overall network and node levels, respectively [17,39,40]. We employ the Infomap community detection algorithm [41] to derive community-level insights into the structural characteristics of urban collaborative innovation network resilience. This results in a comprehensive and systematic framework for resilience analysis that operates at the network, community, and node levels.
2.2.1. Network Resilience Evaluation Indicators
A resilient innovation network can maintain stability, reduce impact, and quickly adapt and evolve in response to external shocks. The structure of the innovation network is a critical factor that determines its resilience and toughness. This paper develops an index system to quantify the resilience of the collaborative innovation network of cities in the new energy vehicle industry, taking into account network transmissibility, clustering, and hierarchy as the three key aspects.
(1) Network transmissibility, measured by the average path length, reflects the speed and cost of resource flow between nodes in the network, such as knowledge, information, and capital. A shorter average path length indicates faster and cheaper knowledge exchange between nodes, leading to faster response times and stronger resilience in the face of external shocks.
(2) Network clustering demonstrates the degree of clustering of nodes in a network and is determined by the average clustering coefficient. A higher average clustering coefficient indicates a greater degree of clustering of nodes in the network, where some nodes are closely connected to form a local area network (LAN).
C is the average clustering coefficient of the network; Ci represents the ratio of the observed number of edges connected to node i and the maximum number of edges that could potentially exist among all of its neighboring nodes, according to the theoretical maximum. Ki represents the number of neighboring nodes connected to node i in the network; Ei refers to the number of edges that are present in the LAN formed by node i and its neighboring nodes in the network.
(3) The slope of the degree distribution curve represents the network hierarchy, with nodes sorted in descending order of their degree size and a power law curve plotted using the rank scale rule. The absolute value of the slope indicates the level of the network and the heterogeneity of its nodes, with a steeper slope indicating a higher level and stronger heterogeneity.
Ki is the degree of node i, while denotes the rank of the degree of node i in the network, and C is a constant. The slope of the degree distribution curve is denoted by α.
2.2.2. Community Detection: Resilience at the Community Level
Community detection methods can identify subsets of nodes and edges within a complex network, which can have different degrees of interconnectivity. The Infomap algorithm, based on flow and information theory proposed by Rosvall and Bergstrom [41] in 2008, is a highly effective and efficient algorithm for community detection in complex networks. This method considers the topological properties of the network and provides a scientific approach to community detection by accurately dividing the network into different communities. For example, in a collaborative urban innovation network, cities can form communities based on factors such as geographical proximity. By identifying and clustering closely connected cities, the resilient structure and evolution of the network can be explored.
2.2.3. Indicators for the Evaluation of Resilience of Nodes
(1) Degree centrality is a measure of the number of immediate neighbors of a node in a network. It quantifies the degree of connectivity of a node to other nodes and serves as an important indicator of its status in the network. Nodes with high-degree centrality exhibit greater resilience to external shocks and less susceptibility to strong fluctuations, owing to their closely connected neighbors. They also display stronger cohesion and tend to occupy central positions in the network.
CD(i) is the degree centrality of node i in a network that consists of n nodes. The presence of a cooperative relationship between node i and node j in the network is denoted by aij, where a value of 1 represents a connection and a value of 0 represents the absence of a connection.
(2) Proximity centrality measures the closeness of a node to other nodes in a network. It quantifies the efficiency of a node’s access to the rest of the network, reflecting the speed of resource circulation and the ease of connection to other nodes. Nodes with higher closeness centrality have shorter distances to other nodes, resulting in faster resource circulation and easier access to other nodes. In addition, these nodes are less susceptible to control by other nodes due to their enhanced connectivity and accessibility.
Cc(i) denotes the closeness centrality of node i in a network. The distance between node i and node j is denoted by d(ni, nj), representing the shortest path length between them.
(3) Mediation centrality measures the intermediary position of a node in the network, indicating the extent to which other nodes need to connect through it. Nodes with higher intermediary centrality have a greater bridge function in the network, enabling them to control resource flows and facilitate the exchange of innovative resources. This centrality metric is a useful indicator of a node’s ability to influence the network structure and dynamics.
CB(i) is the mediation centrality of node i, Numerator is the number of shortest paths between node j and node k, while the denominator is the number of shortest paths between node j and node k that pass through node i.
2.2.4. Coupling Harmonious Degree Model
The data of the six indicators included in the resilience evaluation index system is processed using the min-max value standardization, which scales the data to a range between 0 and 1.
When a positive index, .
When a negative index, .
After normalizing the data, this paper calculates the resilience values of the network and individual nodes by integrating each resilience indicator using the system coupling coordination degree method [20]. The formulas are as follows:
U1, U2, and U3 are the normalized indicator values; C is the coordination levels of these indicators; T is the coordination index; α = β = γ = ⅓. The resulting value R represents the resilience value of the network or node.
2.3. Exponential Random Graph Models
The exponential random graph model utilizes the Markov chain Monte Carlo maximum likelihood estimation method (MCMC-MLE) to incorporate various variables affecting network connections into the model. It compares the real network with a random network and iterates continuously until the optimal estimation parameters are obtained. This allows for investigating how different factors affect the connections between network nodes. The significance is expressed by t-statistics, and the model’s goodness-of-fit is usually detected using the Akaike information measure (AIC) and Bayesian information measure (BIC), where lower values indicate a better fit.
According to the collaborative urban innovation network constructed in the three stages of China’s new energy vehicle industry, this paper identifies the network self-organization effect, individual attribute effect, and exogenous network effect. Furthermore, it explores the preferential mechanism and proximity mechanism of urban cooperation. In addition, we estimate the degree of influence of these factors on node connection probability using the coefficients estimated by the model. The ERGM model established in this paper is as follows:
- (1)
- Network self-organization effect
We use the number of edges as the network self-organization effect variable to assess the fundamental effect of network development and explore the randomness of network formation.
- (2)
- Individual attribute effect
Based on previous research on urban networks and network resilience, this paper explores the effects of individual attributes, including economic development level, education investment level, and science and technology investment level. The study uses per capita GDP, local financial expenditure on education, and local financial expenditure on science and technology as variables to investigate whether there is a preferential mechanism for selecting partners with high levels of economic development and greater investment in education and science and technology. Data were obtained from the “China City Statistical Yearbook” and the statistical yearbooks of some cities. In addition, local GDP per capita data for 2021 were predicted through regression analysis.
- (3)
- Exogenous Network Effect
To examine the impact of exogenous network effects on node cooperation and explore the role of geographic and spatial proximity in shaping resilience, this paper constructs a 273 × 273 geographic adjacency matrix and a 273 × 273 spatial adjacency matrix. The geographic adjacency matrix represents the geographical distance between cities. A shorter distance implies lower costs for exchanging knowledge, technology, and information between different cities and faster resource circulation. The matrix is constructed by calculating the centroid distance between two cities based on their latitude and longitude. The spatial adjacency matrix represents whether the cooperative cities are adjacent. Cities that are adjacent to each other are given a value of 1, while cities that are not adjacent are given a value of 0. Thus, the urban spatial adjacency matrix is constructed. The interpretation of variables is shown in Table 1.
3. Results and Analysis
3.1. Resilience of the Network
Using the coupling harmonious degree model, we have calculated the innovation network resilience of the new energy vehicle industry for 2011–2014, 2015–2017, and 2018–2021 shown in Table 2. Based on the resilience evaluation index system constructed above, the resilience values were found to be 0.01, 0.77, and 0.99, respectively. The results show a clear upward trend in the resilience of collaborative urban innovation networks. Specifically, the second stage exhibited significant improvement compared to the first stage, and the third stage continued to progress steadily from the foundation laid in the second stage. These results indicate that the ability of the urban collaborative innovation network to withstand uncertainty and disturbances is gradually strengthening, which is advantageous for adapting to external environmental changes and facilitating sustainable growth in the new energy vehicle industry.
As more innovation subjects enter the network from stage 1 to stage 3, the connections between nodes become diluted, leading to a decrease in network density. In addition, the network density in the three stages is relatively low, indicating that even though the collaborative innovation network of cities has been established, the connections within the network are relatively loose, and there is still considerable potential for further development.
3.1.1. Analysis of Transmissibility
It takes an average of more than two cities to connect cities in three stages. This shortening of the average path length implies improved network transmission efficiency, acceleration of resource diffusion across different cities, and enhanced network accessibility. These developments are conducive to the circulation of innovative resources across various nodes.
3.1.2. Analysis of Clustering
The observed increase in the average clustering coefficient suggests an increase in the average clustering level among nodes. Close cooperation between cities has resulted in the emergence of local area networks, and certain cities have established stable connections with a high level of mutual trust. This has led to a notable clustering effect within the network, consistent with the community detection results presented in the following.
3.1.3. Analysis of Hierarchy
The observed increasing absolute value of the slope of the degree distribution across the three stages indicates that as additional cities join the innovation network, the level of network heterogeneity increases. The slope of the degree distribution results are shown in Figure 1. This results in a few cities occupying a prominent core position and playing a leading role. While the average degree of the network displays an upward trend across the three stages (3.93, 5.25, and 8.03), it remains consistently low, indicating an evident polarization effect within the network. On average, over 70% of cities in the three stages have a degree centrality lower than average, indicating that innovation cooperation in the new energy vehicle industry is concentrated in a few cities, and the overall level of connectivity is weak.
3.2. Community Detection Results
In this study, we used the Infomap community detection algorithm to partition the resilient structure of the collaborative urban innovation network. Each node city in the network is assigned to a subset or community, and the community detection results of the three stages are visualized as distinct clusters in Figure 2.
The figures illustrate that communities in the new energy vehicle industry undergo constant changes in their number and size. This suggests that the resilience structures at the community level are constantly evolving. In stage 11–14, 12 communities were developed, with 32 cities within the largest community. Intercity cooperation was limited, and innovation was predominantly limited to a few cities. Thus, the potential for intercity cooperative innovation was substantial. In stage 15–17, the number of communities decreased to four, and a significant core community of 150 cities emerged, with almost all nodes participating. This resulted in closer technological collaborations between cities, leading to increased influence and driving role of core cities within the network. Stage 18–21 represents a further evolution of stage 15–17. Some cities have developed stable cooperative relationships, indicating that the network’s resilience tends toward stability as the new energy vehicle industry grows rapidly. Consequently, the randomness of the network has decreased.
3.3. Resilience of the Nodes
Based on the resilience evaluation index system constructed above, the resilience values of node cities are shown in Table 3. Due to space constraints, this paper only presents the node resilience values of the top 50 cities in stage 3 for the three stages. Blank positions indicate that the city did not participate in collaborative innovation during that stage. The results suggest that the node cities have a distribution pattern of “one super many strong,” where Beijing maintains a considerable lead in innovation resilience compared to other cities, reflecting its dominant core radiation role in the network. This observation aligns with the typical Matthew effect.
Apart from Beijing, other node cities with increased resilience, such as Shanghai, Nanjing, Shenzhen, and Xi’an, have emerged as vital supporters of the network. These resilient cities, generally municipalities and provincial capitals with a high administrative level and a developed economy possess abundant innovation resources, favorable transportation conditions, and preferential policies, attracting other cities to collaborate with them. As a result, they assume a hub role in the network and establish cross-regional connections with different cities, facilitating the circulation of innovative resources.
The resilience of node cities is calculated based on three centrality degrees. Beijing ranks first in all three measures, indicating its strong position in the network. Beijing collaborated with the most cities and played a significant driving and bridge role. As China’s political center, Beijing boasts a thriving economy, rich knowledge and technology resources, and a favorable innovation environment that fosters strong innovation capabilities. This city attracts a plethora of exceptional innovation entities, including the State Grid Corporation Limited, China Electric Power Research Institute Co., Ltd., renowned universities such as Tsinghua University and North China Electric Power University, and various research institutes. In addition, supporting national policies is an important reason for the rapid development of the new energy vehicle industry. Furthermore, the support of government policies has been a significant factor contributing to the accelerated progress of the new energy vehicle industry. As one of the first pilot cities, Beijing experimented with various preferential policies, promoting rapid innovation in the industry.
This paper analyzes the degree of centrality of each city and observes a gradual increase, highlighting their strengthening role in the collaborative urban innovation network. Among the node cities in the network, Beijing, Shanghai, and Nanjing consistently rank in the top three in terms of degree centrality. This implies that these cities occupy a stable core position in the network, possess strong influence and competitive advantages, and attract numerous cities to establish connections with them.
The proximity centrality analysis revealed that 66.3%, 72.78%, and 67.32% of the cities had a higher proximity centrality than the average in the three stages, denoting that they are closely associated with other cities due to their short “distance”. On the other hand, the intermediary centrality analysis demonstrated an increasing trend in the intermediary centrality of most cities. About 55.43%, 58.23%, and 48.25% of the cities had zero intermediary centrality in the three stages, indicating that they did not control the collaborative innovation of other cities and did not play an intermediary transmission role. Additionally, 20.65%, 17.09%, and 13.62% of the cities had an intermediary centrality higher than the mean in the three stages. This suggests that only a few cities in the network could control the generation and development of connections between other nodes.
3.4. Spatial Distribution Characteristics of the Collaborative Urban Innovation Network
The urban collaborative innovation network of China’s new energy vehicle industry was constructed in three stages using ArcGIS software, as illustrated in Figure 3. In these three figures, blue denotes the internal cooperation strength, representing the collaboration among diverse innovation entities within the same city. The size of the red circle is proportional to the node’s resilience, while the connection line signifies the network connection strength. The internal cooperation strength, network connection strength, and node resilience were categorized into five levels using the natural break point approach.
3.4.1. Innovation Networks Have Been Expanding in Scale, and the Strength of Network Connections Has Been Strengthened
The new energy vehicle industry in China has fostered a sizable innovation network among cities. Collaborative innovation has become increasingly prevalent and impactful. During stage 1, 92 cities formed 181 city pairs and collaborated 628 times across regions. Most of the cities in the network were situated in the eastern and central regions, while the western cities exhibited low participation. In stage 2, the network expanded to 158 cities, forming 415 city pairs, each engaging in 2740 cross-regional collaborations. Network connections have been strengthened, resulting in an increase in the number of cooperation partners between cities. The level of interaction among network subjects is becoming more complex and dynamic.
During stage 1, cross-regional collaborative innovation was poorly developed, and the network connection was weak. Beijing is the only city with more than 40 collaborations with other cities, including Shijiazhuang, Nanjing, and Zhangjiakou. During stage 2, Beijing closely collaborated with several cities, including Nanjing, Jinan, Zhangjiakou, Lanzhou, Xuchang, and Shanghai. Among them, Beijing and Nanjing cooperated 299 times, significantly higher than other cities. In stage 3, the relationship between Beijing and Nanjing had become the strongest, with 752 collaborations indicating a stable and trustworthy partnership. Beijing also increased collaborations with Xuchang and Nanchong to 294 and 290, respectively, with a steady strengthening of ties. Hangzhou and Ningbo collaborated 450 times, also generating a strong connection.
3.4.2. The Patent Partners Are Still Mainly Located in the Same City
Figure 4 compares the strength of the network connection and internal connection, while Figure 3 depicts the internal connection strength through blue shading. Despite the continuous enhancement of collaborative innovation between regions with industrial development, collaboration among enterprises, universities, and research institutes within the same city remains the primary mode of cooperation. Sharing resources and exchanging knowledge within the same region is more convenient and reduces opportunistic behavior while increasing mutual trust among different innovation subjects. For this reason, innovation entities are more likely to establish partnerships with other organizations in the same city.
Furthermore, Beijing, Nanjing, Hangzhou, and Shanghai exhibit prominent positions in internal collaboration and consistently maintain their top four rankings at all three stages.
3.4.3. The Distribution of Node Resilience Exhibits Spatial Heterogeneity and the Development of Regions Is Unbalanced
The resilience distribution of node cities presents a distinct spatial heterogeneity and evolves with industry development. Resilient cities are primarily located in north, east, south, and central China. However, few cities in the southwest, northwest, and northeast regions show high resilience, lacking support from cities with strong innovation resilience. Collaborative innovation activities are concentrated in the Beijing-Tianjin-Hebei, Yangtze River Delta, and Pearl River Delta urban agglomerations, radiating outward, with the former dominating. In general, there are significant regional disparities, imbalanced development, and significant Matthew effects. This pattern stems from the fact that nearly all first-tier and second-tier cities are concentrated in the east and central regions, which have high economic development, marketization, and complete infrastructure and are rich in high-quality innovation resources and advanced talents and technologies. On the contrary, western cities often lack innovation resources and rely on cooperation with their eastern and central counterparts to enhance their innovation capabilities.
The dynamic evolution of the urban innovation network in the new energy vehicle industry leads to continuous changes in the network topology. This evolution enhances knowledge sharing and spillover among cities and accelerates the flow of resources among different subjects. Compared to stage 1, where Beijing is the only center, the current network presents a multicenter development pattern with innovation activities concentrated in large municipalities, provincial capitals, and economically developed cities, such as Beijing, Shanghai, Nanjing, Guangzhou, and Shenzhen. These cities exhibit stronger radiation and driving ability, along with greater innovation advantages, leading other cities to engage in collaborative innovation. Overall, the network displays an unbalanced pattern, with few cities being particularly strong and many relatively weak.
3.5. Empirical Results of the Exponential Random Graph Model
3.5.1. Network Self-Organization Effect
In this study, we used the number of edges as a key variable to assess the network self-organizational effect. In ERGM models, the number of edges is considered the primary endogenous structural variable. Our findings demonstrate that the coefficients of all three stages are significantly negative. These results suggest that the urban collaborative innovation network analyzed in this study is not generated randomly [42]. Therefore, our research has practical implications and is worth further research.
3.5.2. Individual Attribute Effect
The economic development level in stage 3 is statistically significant at the 5% level and has a positive correlation. This implies that cities tend to cooperate preferentially with those with higher economic development levels, suggesting that a highly developed city is more attractive to other cities and can enhance innovation resilience. Additionally, education investment has a consistently positive impact in all three stages, with a significance level of 0.1%, indicating that greater investment in education promotes collaborative innovation in the new energy vehicle industry between cities. Finally, in the last two stages, the level of science and technology investment also shows a positive impact with increasing coefficient values, demonstrating that it has a growing role in enhancing urban innovation resilience.
3.5.3. Exogenous Network Effect
Table 4 shows a positive coefficient of geographical proximity in all three stages, passing the significance test of 0.1%.
At the same stage, the coefficient of geographical proximity is substantially larger than other factors. The resilience of the intercity collaborative innovation network strongly depends on geographical proximity during its evolution. Cities tend to collaborate with those in close proximity, allowing cheaper and more convenient exchanges of knowledge, technology, and resources. However, the spatial proximity coefficient is only significant in stage 1. It does not have a significant effect in stages 2 and 3, suggesting a decrease in dependence on spatial proximity due to network development and more diversified contact methods. Figure 2, Figure 3 and Figure 4 also support this conclusion. For example, closely connected cities like Beijing-Nanjing, Beijing-Xuchang, and Hangzhou-Nanchong are not adjacent to each other but still engage in significant collaboration. From the perspective of urban basic resilience characteristics, the resilience values of Beijing and Hangzhou have significantly improved in the past decade, which is closely related to the economic, educational, and scientific development of the two cities. The cooperative relationship among the three groups of cities is also highly associated with the early establishment of border relations. For example, the cooperation between Beijing and Nanjing began as early as 2011, when the Beijing New Energy Vehicle Company signed a cooperation agreement between cities and enterprises with Nanjing, laying the foundation for sustainable innovation activities in the future.
4. Conclusions and Discussion
Based on cooperative patent data from 2011 to 2021, this study employs complex network analysis to establish a collaborative urban innovation network in China’s new energy vehicle industry. It investigates the characteristics and spatio-temporal distribution patterns of resilience at the network, community, and node levels. Additionally, this paper also explores the driving mechanisms of innovation network resilience using the ERGM model, identifying the variables that affect city cooperation.
The contributions in this paper are as follows: First, it develops a resilience evaluation index system based on network, community, and node levels. This approach responds to the call by Peng et al. for research on regional resilience by creating a more systematic methodology [43]. The paper incorporates endogenous and exogenous factors into a framework to explore the influencing factors of regional resilience and improve the exploration content of the resilience-driving mechanism. Furthermore, the paper applies regional resilience theory to the new energy vehicle industry, filling a gap in research that previously focused on structural characteristics and evolution [44,45]. Finally, the paper provides recommendations for promoting collaborative innovation resilience within the industry.
After analyzing the results, the following conclusions can be reached: (1) A large-scale collaborative urban innovation network has been established for the new energy vehicle industry, encompassing practically all prefecture-level cities. The network’s connectivity has intensified. Its structure has transformed from a “single-center” configuration, where Beijing served as the focal point, to a “multicenter” arrangement with additional centers in Nanjing, Hangzhou, and Shanghai. However, the network exhibits an imbalance in regional development, resulting in a phenomenon of “few strong nodes and many weak ones”. (2) The levels of resilience in both the network and its nodes have increased, which implies an enhanced ability of innovative subjects to cope with uncertainty shocks. (3) The network is influenced by several significant elements, including the level of regional economic development, investment in education and science and technology, and geographical distance between cities. Cities with higher economic development and investments in education, science, and technology are more likely to foster innovation with other cities. Additionally, innovation subjects tend to collaborate with organizations located close to them. From the results of this study, the following recommendations can be made.
To foster innovation and create a conducive environment, the government should boost its funding in local education, science, and technology in order to cultivate and nurture innovative talents. This will attract the convergence of innovative factors and promote innovation. For cities with low innovation levels and weak innovation resilience, preferential policies and adequate financial support should be provided to offer targeted support. Furthermore, to strengthen the overall planning of the innovation network, the gap in innovation capacity among cities should be narrowed. This will help address the unbalanced development of regional innovation resilience.
Encouraging collaborative innovation between enterprises, universities, and research institutes is a recommended approach to strengthen cross-regional collaboration, stimulate urban innovation vitality, and build an open and shared cross-regional innovation environment. This can promote nationwide improvements in urban innovation levels and enhance innovation entities’ ability to cope with uncertain risks and shocks, thereby improving innovation resilience. Additionally, the vigorous development of the economy is crucial for improving innovation capabilities. Cities should prioritize infrastructure construction to reduce resource circulation costs between regions and promote the transregional diffusion of innovative resources such as information, technology, and capital. Using the role of geographical proximity, cities can shorten the “distance” between them, gain diverse knowledge, and increase innovation output.
To drive the balanced development of urban innovation networks, it is recommended that key innovative, resilient cities, led by Beijing, leverage their advantages and strengthen collaborative innovation with weaker cities. Central and western cities in China, as well as those in Northeast China, should actively participate in the collaborative innovation network of the new energy vehicle industry. By working together with high-capacity cities, they can enhance innovation momentum and resilience. This will help narrow the innovation gap between regions and promote the implementation of the innovation-driven development strategy, making the new energy vehicle industry a new engine for urban development.
Author Contributions
Y.G. and L.L. initiated the project and suggested the methodology; Y.G. and L.L. developed the model and program and examined the theory validation; Y.G. and C.L. conducted the empirical research and analyzed the results. The manuscript was written through the contribution of all authors. All authors have read and agreed to the published version of the manuscript.
Funding
This research was supported by the National Social Science Foundation of China (Grant No. 21BGL304).
Institutional Review Board Statement
Not applicable.
Informed Consent Statement
Not applicable.
Data Availability Statement
The data that support the findings of this study are available from the PatSnap Global Patent databases. Restrictions apply to the availability of these data, which were used under license for this study. Data are available from the authors with the permission of the PatSnap Global Patent databases.
Conflicts of Interest
The authors declare no conflict of interest.
References
- Rutten, R.; Boekema, F. Regional social capital: Embeddedness, innovation networks and regional economic development. Technol. Forecast. Soc. Chang. 2007, 74, 1834–1846. [Google Scholar] [CrossRef]
- Zhang, Y.; Zhang, J. Exploring regional innovation growth through a network approach: A case study of the Yangtze River Delta region, China. Chin. Geogr. Sci. 2022, 32, 16–30. [Google Scholar] [CrossRef]
- Chen, Y.; Fang, S. Mapping the evolving patterns of patent assignees’ collaboration networks and identifying the collaboration potential. Scientometrics 2014, 101, 1215–1231. [Google Scholar] [CrossRef]
- Wei, Y.; Xiu, C.L. Study on the concept and analytical framework of city network resilience. Prog. Geogr. 2020, 39, 488–502. [Google Scholar] [CrossRef]
- Davoudi, S.; Shaw, K.; Haider, L.J.; Quinlan, A.E.; Peterson, G.D.; Wilkinson, C.; Fünfgeld, H.; McEvoy, D.; Porter, L.; Davoudi, S. Resilience: A Bridging Concept or a Dead End? “Reframing” Resilience: Challenges for Planning Theory and Practice Interacting Traps: Resilience Assessment of a Pasture Management System in Northern Afghanistan Urban Resilience: What Does it Mean in Planning Practice? Resilience as a Useful Concept for Climate Change Adaptation? The Politics of Resilience for Planning: A Cautionary Note. Plan. Theory Pract. 2012, 13, 299–333. [Google Scholar]
- Holling, C.S. Resilience and stability of ecological systems. Annu. Rev. Ecol. Syst. 1973, 4, 1–23. [Google Scholar] [CrossRef]
- Adger, W.N. Social and ecological resilience: Are they related? Prog. Hum. Geogr. 2000, 24, 347–364. [Google Scholar] [CrossRef]
- Winfield, L.F. Developing Resilience in Urban Youth; Urban Monograph Series; North Central Regional Educational Laboratory: Oak Brook, IL, USA, 1994. [Google Scholar]
- Rose, A. Defining and measuring economic resilience to disasters. Disaster Prev. Manag. 2004, 13, 307–314. [Google Scholar] [CrossRef]
- Chen, C.; Xu, L.; Zhao, D.; Xu, T.; Lei, P. A new model for describing the urban resilience considering adaptability, resistance and recovery. Saf. Sci. 2020, 128, 104756. [Google Scholar] [CrossRef]
- Hynes, W.; Trump, B.; Love, P.; Linkov, I. Bouncing forward: A resilience approach to dealing with COVID-19 and future systemic shocks. Environ. Syst. Decis. 2020, 40, 174–184. [Google Scholar] [CrossRef]
- Hu, J.; Yu, L. Research on the Influence Mechanism and Characteristics of Innovation Resilience on High-tech Industry Innovation. Science & Technology Progress and Policy. Sci. Technol. Prog. Policy 2022, 39, 49–59. [Google Scholar]
- Zhang, J.; Long, J.; von Schaewen, A.M.E. How does digital transformation improve organizational resilience?—Findings from PLS-SEM and fsQCA. Sustainability 2021, 13, 11487. [Google Scholar] [CrossRef]
- Mafabi, S.; Munene, J.C.; Ahiauzu, A. Creative climate and organisational resilience: The mediating role of innovation. Int. J. Organ. Anal. 2015, 23, 564–587. [Google Scholar] [CrossRef]
- Muštra, V.; Šimundić, B.; Kuliš, Z. Does innovation matter for regional labour resilience? The case of EU regions. Reg. Sci. Policy Pract. 2020, 12, 955–970. [Google Scholar] [CrossRef]
- Wei, J.; Ren, T. Innovation Diversification, Economic Structure and Innovation Resilience. Sci. Technol. Manag. Res. 2022, 42, 39–48. [Google Scholar]
- Crespo, J.; Suire, R.; Vicente, J. Lock-in or lock-out? How structural properties of knowledge networks affect regional resilience. J. Econ. Geogr. 2013, 14, 199–219. [Google Scholar] [CrossRef]
- Boschma, R. Towards an Evolutionary Perspective on Regional Resilience. Reg. Stud. 2014, 49, 733–751. [Google Scholar] [CrossRef]
- Burton, C.G. A Validation of Metrics for Community Resilience to Natural Hazards and Disasters Using the Recovery from Hurricane Katrina as a Case Study. Ann. Assoc. Am. Geogr. 2014, 105, 67–86. [Google Scholar] [CrossRef]
- Liang, L.; Zhao, Y.; Liu, B. Research on Monitoring And Early Warning of the Resilience of the Innovation Ecosystem in the China’s National New Districts. China Soft Sci. 2020, 7, 92–111. [Google Scholar]
- Tan, J.; Zhang, P.; Lo, K.; Li, J.; Liu, S. Conceptualizing and measuring economic resilience of resource-based cities: Case study of Northeast China. Chin. Geogr. Sci. 2017, 27, 471–481. [Google Scholar] [CrossRef]
- Evans, R.; Karecha, J. Staying on Top: Why is Munich so Resilient and Successful? Eur. Plan. Stud. 2013, 22, 1259–1279. [Google Scholar] [CrossRef]
- Ainuddin, S.; Routray, J.K. Earthquake hazards and community resilience in Baluchistan. Nat. Hazards 2012, 63, 909–937. [Google Scholar] [CrossRef]
- Lee, D.-S. Towards Urban Resilience through Inter-City Networks of Co-Invention: A Case Study of U.S. Cities. Sustainability 2018, 10, 289. [Google Scholar] [CrossRef]
- Li, L.; Zhang, P.; Li, X. Regional economic resilience of the old industrial bases in China—A case study of Liaoning Province. Sustainability 2019, 11, 723. [Google Scholar] [CrossRef]
- Serdar, M.Z.; Koç, M.; Al-Ghamdi, S.G. Urban Transportation Networks Resilience: Indicators, Disturbances, and Assessment Methods. Sustain. Cities Soc. 2022, 76, 103452. [Google Scholar] [CrossRef]
- Hu, X.; Li, L.; Dong, K. What matters for regional economic resilience amid COVID-19? Evidence from cities in Northeast China. Cities 2022, 120, 103440. [Google Scholar] [CrossRef]
- Shi, J.; Wang, X.; Wang, C.; Liu, H.; Miao, Y.; Ci, F. Evaluation and Influencing Factors of Network Resilience in Guangdong-Hong Kong-Macao Greater Bay Area: A Structural Perspective. Sustainability 2022, 14, 8005. [Google Scholar] [CrossRef]
- Chacon-Hurtado, D.; Kumar, I.; Gkritza, K.; Fricker, J.D.; Beaulieu, L.J. The role of transportation accessibility in regional economic resilience. J. Transp. Geogr. 2020, 84, 102695. [Google Scholar] [CrossRef]
- Capello, R.; Caragliu, A.; Fratesi, U. Spatial heterogeneity in the costs of the economic crisis in Europe: Are cities sources of regional resilience? J. Econ. Geogr. 2015, 15, 951–972. [Google Scholar] [CrossRef]
- Gong, H.; Hassink, R.; Tan, J.; Huang, D. Regional resilience in times of a pandemic crisis: The case of COVID-19 in China. Tijdschr. Econ. Soc. Geogr. 2020, 111, 497–512. [Google Scholar] [CrossRef]
- Yu, G.; He, C.; Zhu, S. lndustrial cluster resilience: Technological innovation, relational governance, and market diversification. Geogr. Res. 2020, 39, 1343–1356. [Google Scholar]
- Cutter, S.L.; Ash, K.D.; Emrich, C.T. The geographies of community disaster resilience. Glob. Environ. Chang.-Hum. Policy Dimens. 2014, 29, 65–77. [Google Scholar] [CrossRef]
- Martin, R.; Sunley, P.; Gardiner, B.; Tyler, P. How Regions React to Recessions: Resilience and the Role of Economic Structure. Reg. Stud. 2016, 50, 561–585. [Google Scholar] [CrossRef]
- Graciela, C.; Jones, J.; Statsenko, L. Managing Innovation Networks for Knowledge Mobility and Appropriability: A Complexity Perspective. Entrep. Res. J. 2016, 6, 75–109. [Google Scholar]
- Xiong, Z.; Zhang, W. Study on Innovation Networks and lts Spillover Effect of China’s New Energy Automobile Industry. Bull. Chin. Acad. Sci. 2022, 37, 1819–1832. [Google Scholar]
- Holm, J.R.; Østergaard, C.R. Regional employment growth, shocks and regional industrial resilience: A quantitative analysis of the Danish ICT sector. Reg. Stud. 2015, 49, 95–112. [Google Scholar] [CrossRef]
- Liu, X.; Li, D.; Ma, M.; Szymanski, B.K.; Stanley, H.E.; Gao, J. Network resilience. Phys. Rep. 2022, 971, 1–108. [Google Scholar] [CrossRef]
- Peng, C.; Lin, Y.; Gu, C. Evaluation and optimization strategy of city network structural resilience in the middle reaches of Yangtze River. Geogr. Res. 2018, 37, 1193–1207. [Google Scholar]
- Yuliana, I.; Santosa, P.I.; Setiawan, N.A. Finding The Most Important Actor in Online Crowd by Social Network Analysis. J. Phys. Conf. Ser. 2017, 812, 012095. [Google Scholar] [CrossRef]
- Rosvall, M.; Bergstrom, C.T. Maps of random walks on complex networks reveal community structure. Proc. Natl. Acad. Sci. USA 2008, 105, 1118–1123. [Google Scholar] [CrossRef]
- Liu, X.; Derudder, B.; Liu, Y. Regional geographies of intercity corporate networks: The use of exponential random graph models to assess regional network-formation. Pap. Reg. Sci. 2015, 94, 109–126. [Google Scholar]
- Peng, C.; Yuan, M.; Gu, C.; Peng, Z. Research Progress on the Theory and Practice of Regional Resilience. Urban Plan. Forum 2015, 59, 84–92. [Google Scholar]
- Cao, X.; Li, C.; Ling, C. A research on the evolution of patent cooperation networks based on new energy vehicles. Sci. Res. Manag. 2019, 40, 179–188. [Google Scholar]
- Sun, H.; Geng, Y.; Hu, L.; Shi, L.; Xu, T. Measuring China’s new energy vehicle patents: A social network analysis approach. Energy 2018, 153, 685–693. [Google Scholar] [CrossRef]
Figure 1.
Network hierarchy.

Figure 2.
Community detection results.
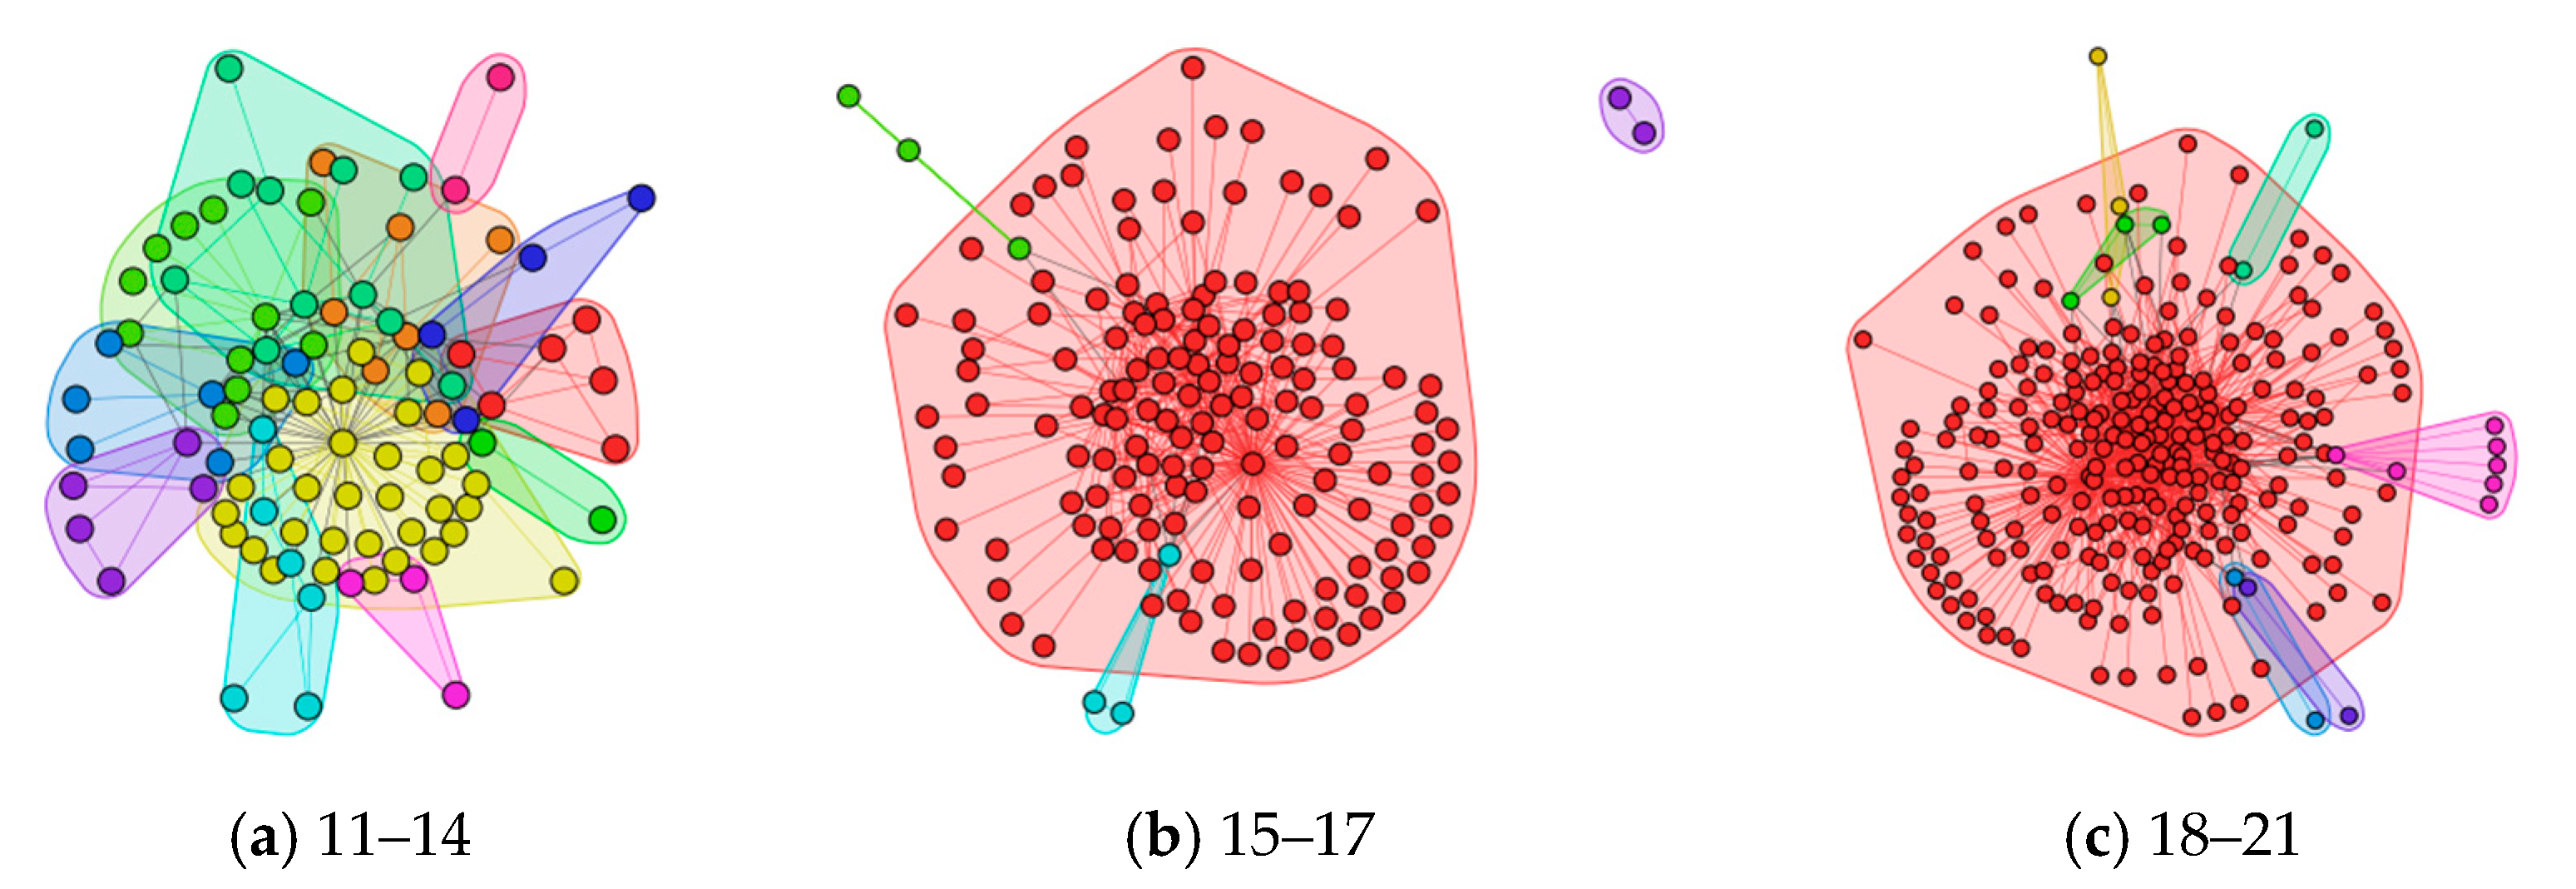
Figure 3.
China’s new energy vehicle industry city collaborative innovation network. Note: Figure 3 is based on the standard map No. GS (2019) 1822 downloaded from the standard map service website of the Ministry of Natural Resources, and the boundary of the base map has not been modified.
Figure 3.
China’s new energy vehicle industry city collaborative innovation network. Note: Figure 3 is based on the standard map No. GS (2019) 1822 downloaded from the standard map service website of the Ministry of Natural Resources, and the boundary of the base map has not been modified.
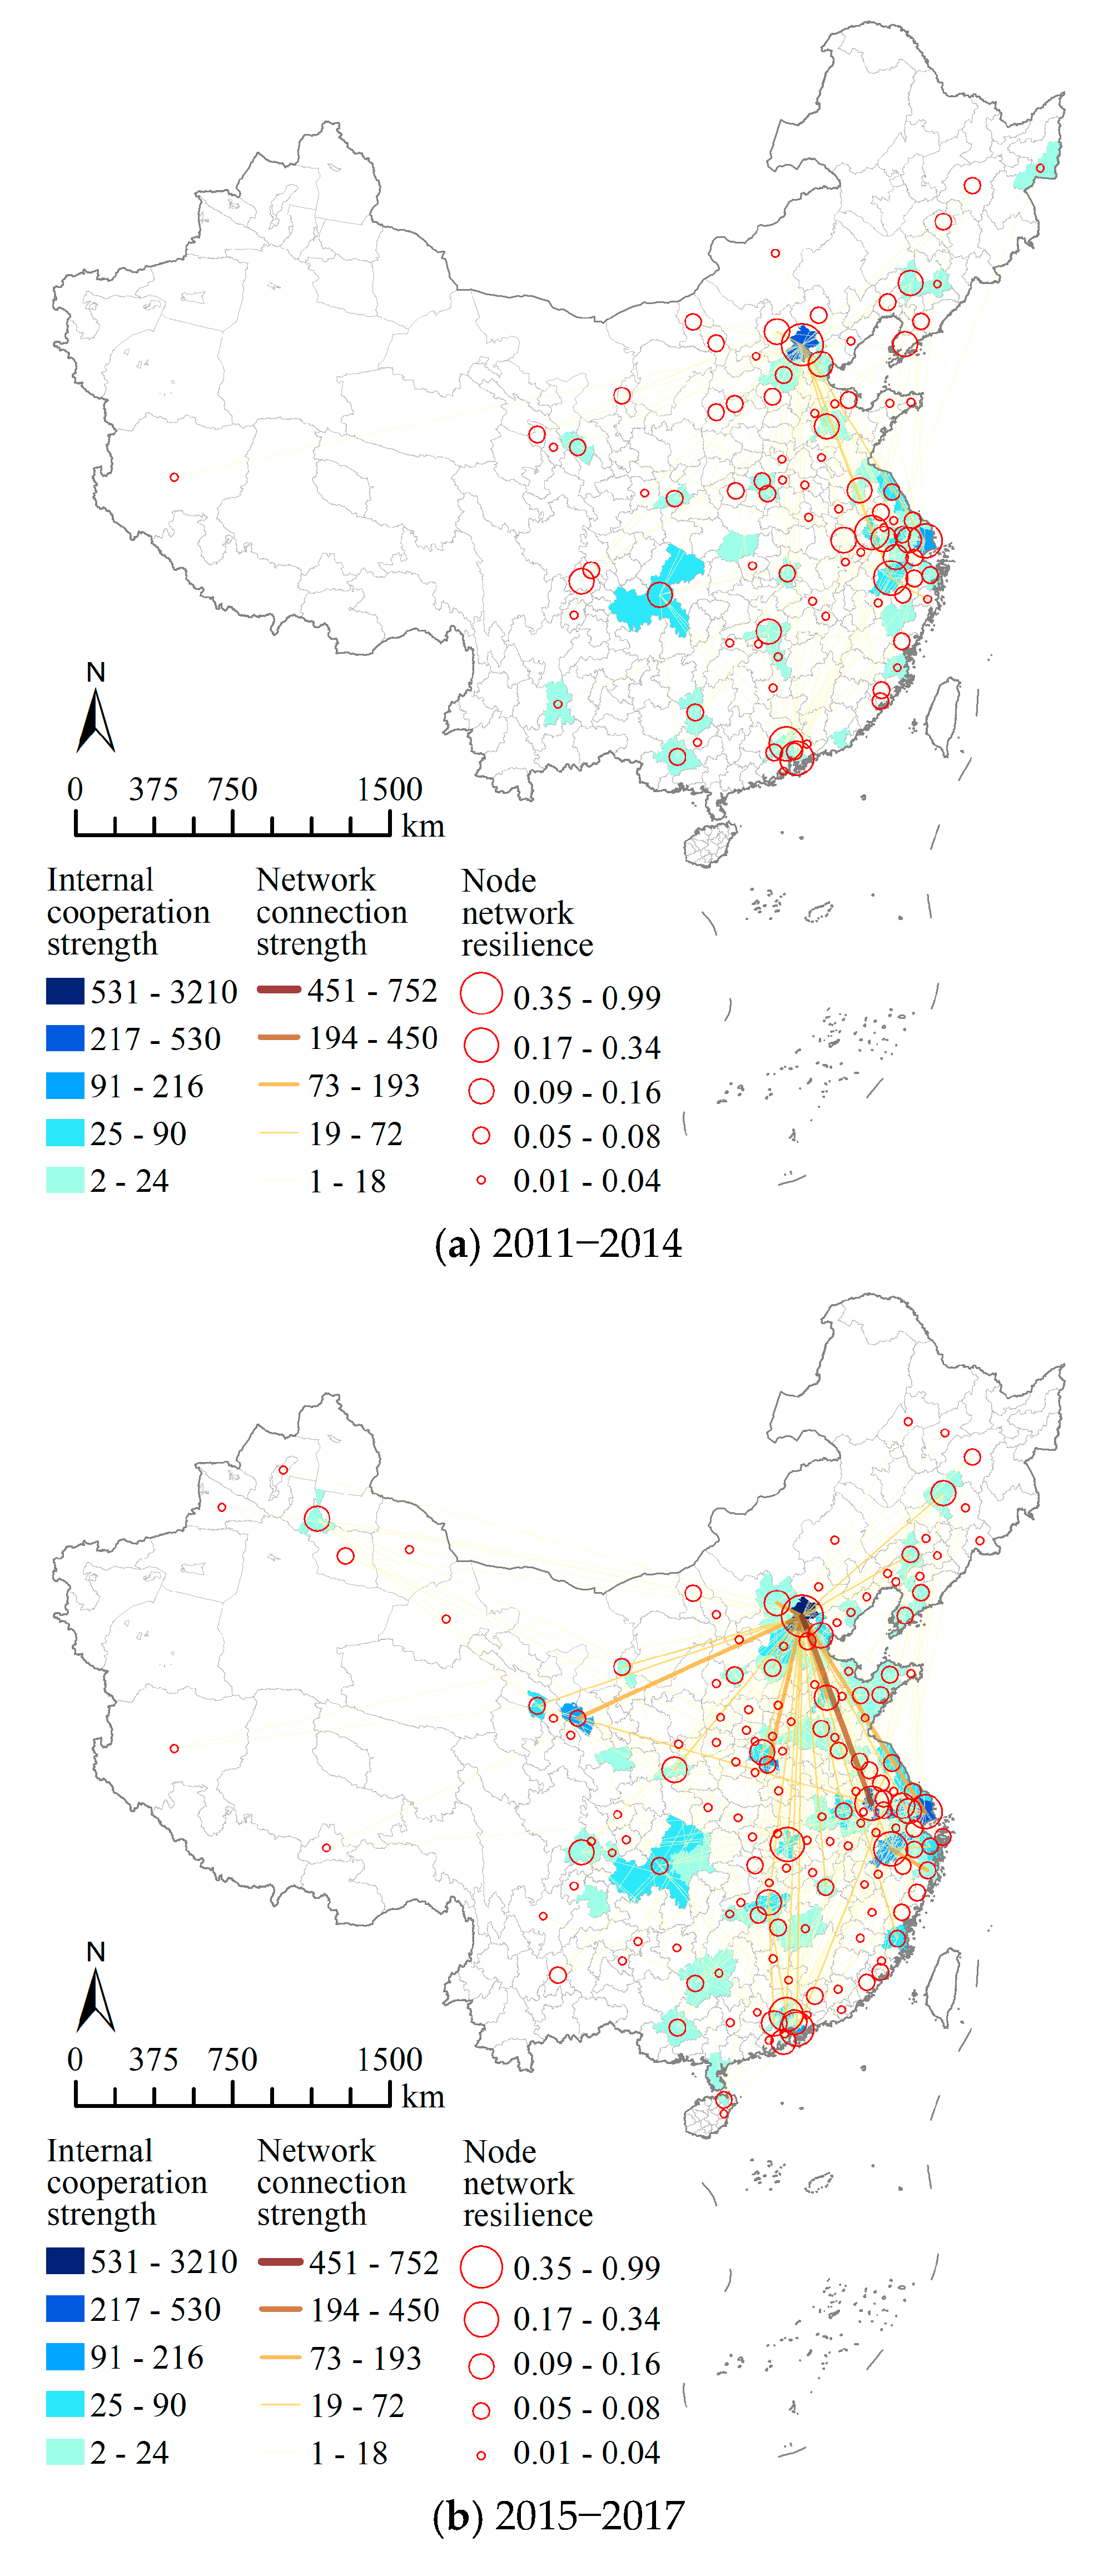
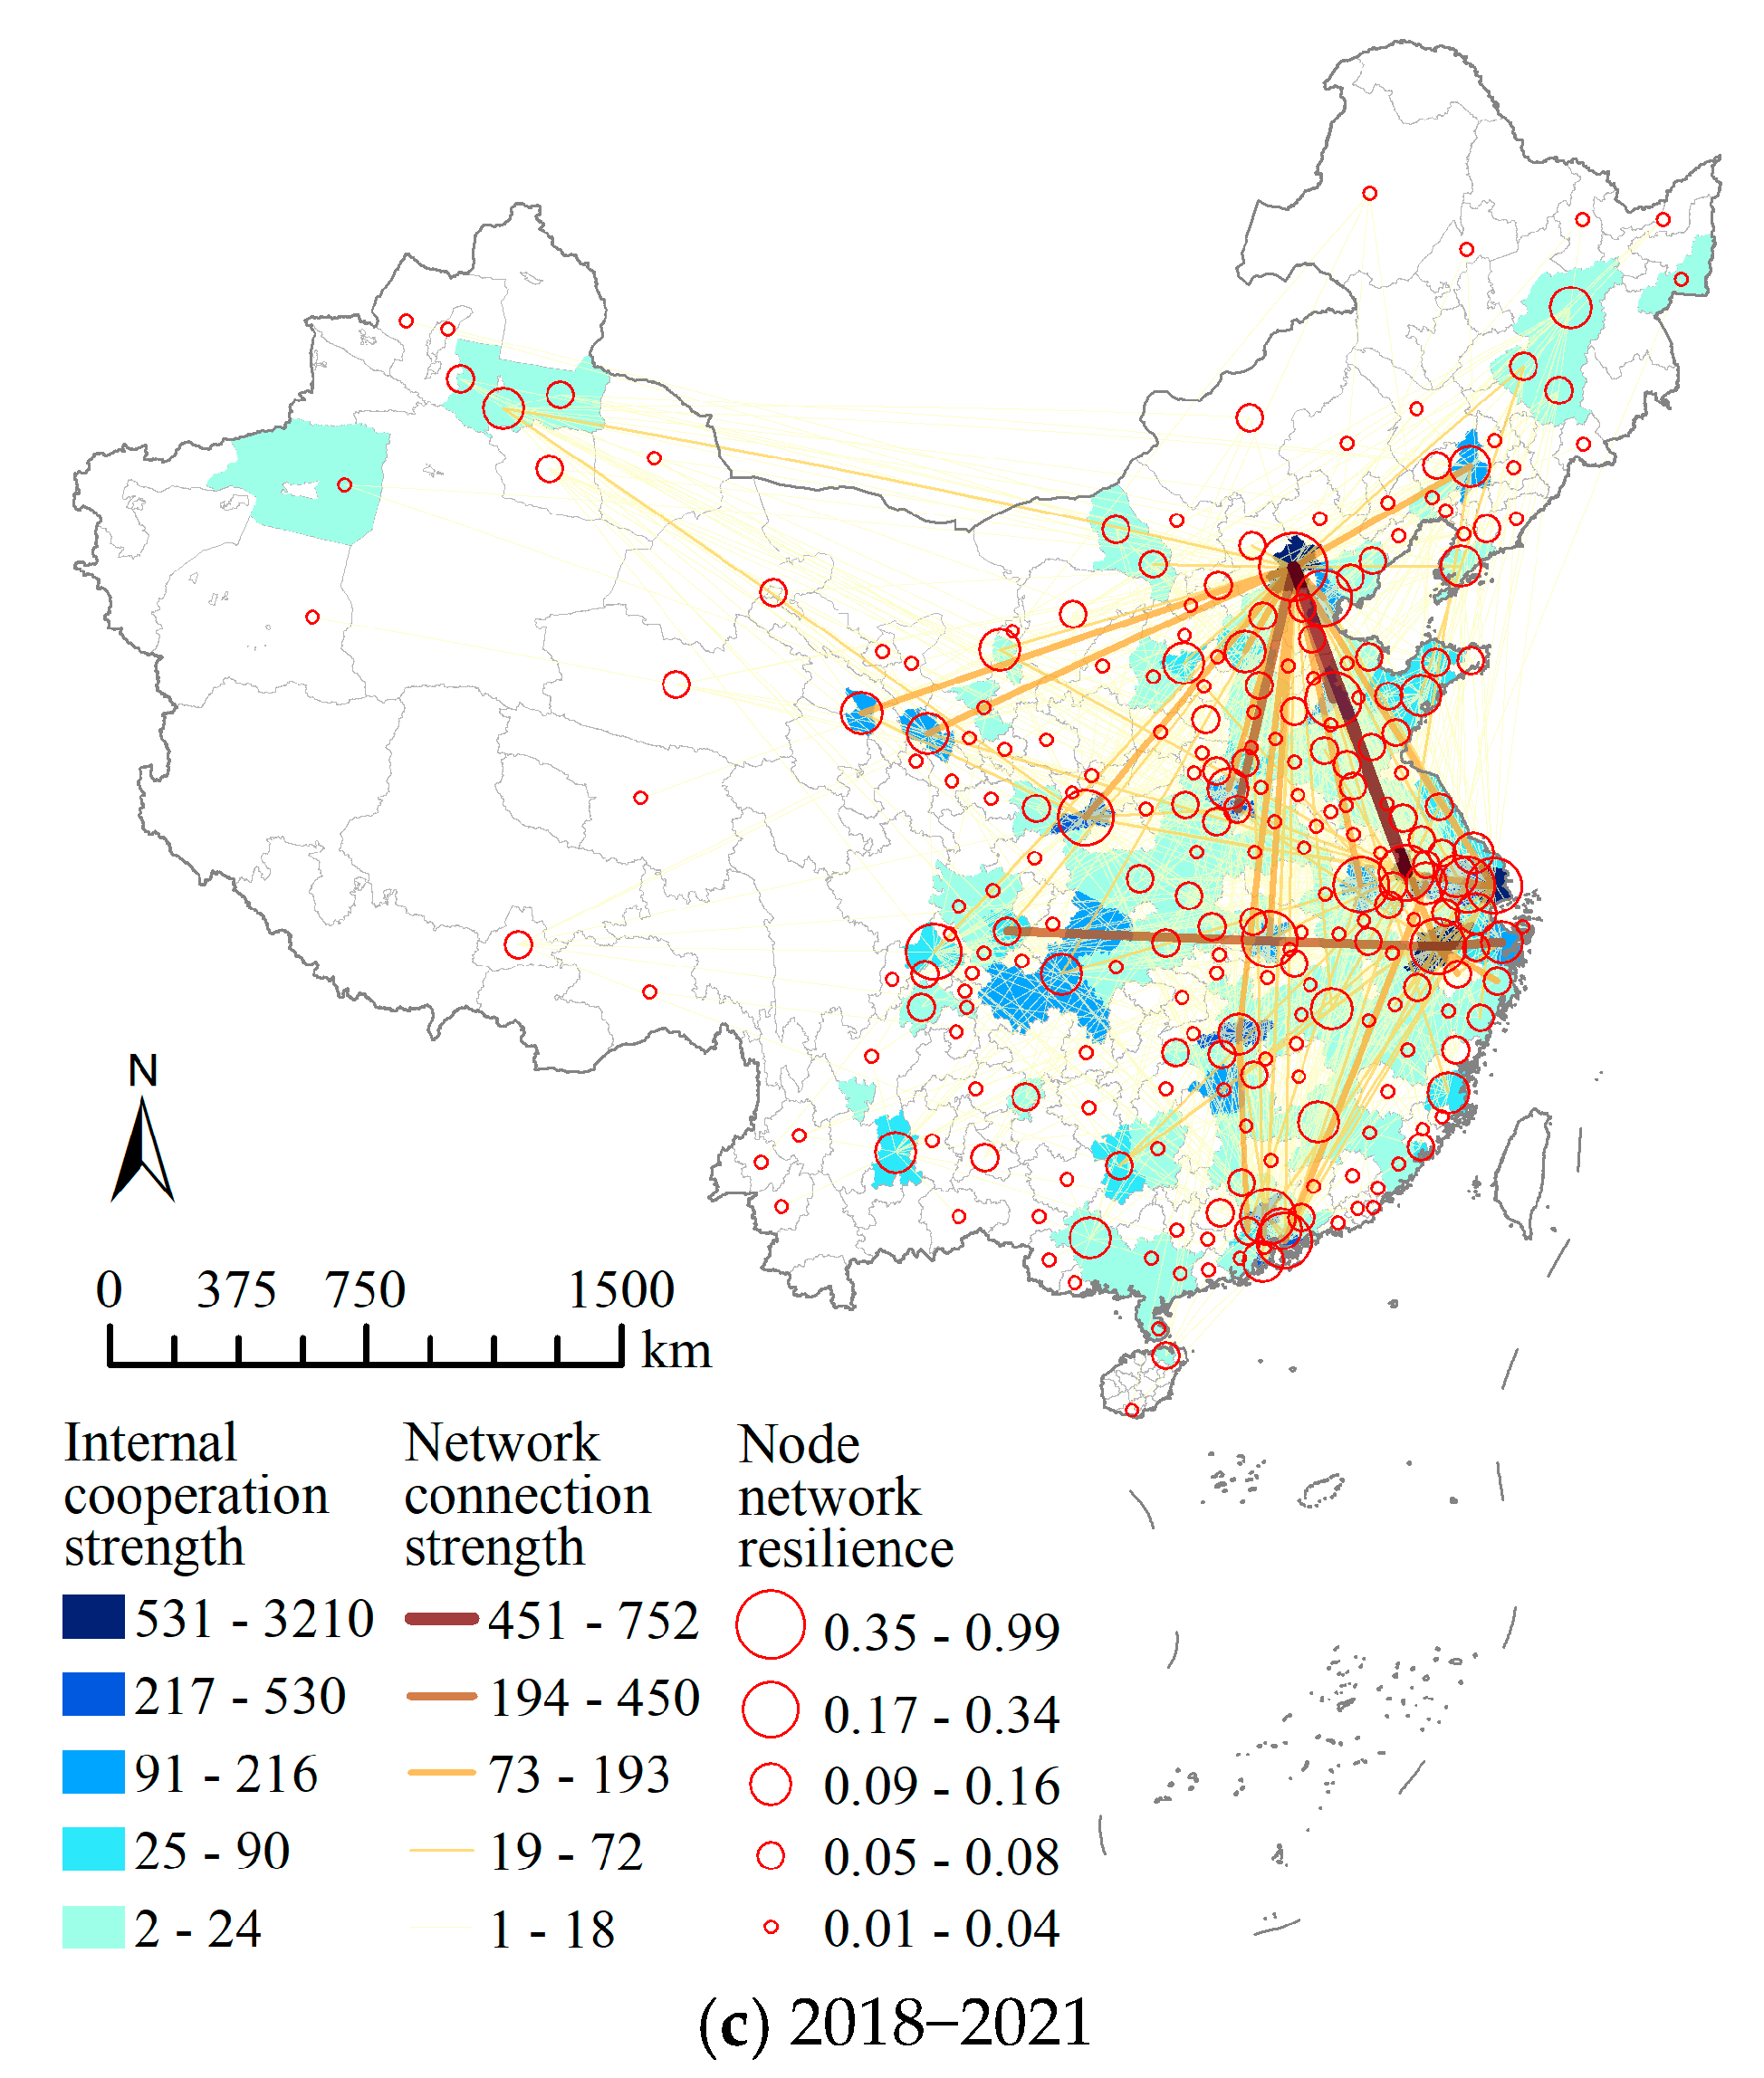
Figure 4.
Network and internal connection strength.


Table 1.
Factors driving the evolution of network resilience.
| Factors | Variables | Structure Diagram | Meaning of Variables | Effect | Explanation |
|---|---|---|---|---|---|
| Network Self-organization Effect | Edges |  | The Number of Edges | The Fundamental Effect | The tendency of node connections |
| Individual Attribute Effect | Nodecov.GDP |  | Economic Development | Matthew Effect | Whether nodes with higher levels of economic development are more attractive |
| Nodecov.EDU |  | Education Investment | Matthew Effect | Whether nodes with higher levels of education investment are more attractive | |
| Nodecov.SCI |  | Science and Technology Investment | Matthew Effect | Science and Technology Investment | |
| Exogenous Network Effect | Edgecov.GEO |  | Geographical Proximity | Dependence | Whether node cooperation is dependent on geographical proximity |
| Edgecov.SPA |  | Spatial Proximity | Dependence | Whether node cooperation is dependent on spatial proximity |
Table 2.
Basic characteristics of the innovation network and results of network resilience.
| Stage | Nodes | Edges | Network Density | Transmissibility | Clustering | Hierarchy |
|---|---|---|---|---|---|---|
| Average Path Length | Average Cluster Coefficient | Slope | ||||
| 11–14 | 92 | 181 | 0.043 | 2.565 | 0.56 | −0.947 |
| 15–17 | 158 | 415 | 0.033 | 2.45 | 0.63 | −1.117 |
| 18–21 | 257 | 1032 | 0.031 | 2.436 | 0.662 | −1.168 |
Table 3.
Resilience values of node cities.
| City | Stage 1 | Stage 2 | Stage 3 | City | Stage 1 | Stage 2 | Stage 3 |
|---|---|---|---|---|---|---|---|
| Beijing | 0.99000 | 0.92671 | 0.99000 | Wuxi | 0.06777 | 0.10092 | 0.10381 |
| Shanghai | 0.28796 | 0.27971 | 0.34363 | Ningbo | 0.07025 | 0.07218 | 0.10254 |
| Nanjing | 0.20407 | 0.25471 | 0.31725 | Dongguan | 0.08099 | 0.09209 | 0.09931 |
| Shenzhen | 0.18683 | 0.18807 | 0.31559 | Harbin | 0.06743 | 0.05396 | 0.09552 |
| Xi’an | 0.05398 | 0.15015 | 0.30052 | Taiyuan | 0.04502 | 0.05827 | 0.09228 |
| Hangzhou | 0.24837 | 0.21757 | 0.27914 | Yinchuan | 0.05373 | 0.06199 | 0.09213 |
| Guangzhou | 0.20703 | 0.20777 | 0.24603 | Ganzhou | 0.09156 | ||
| Wuhan | 0.05446 | 0.21178 | 0.23371 | Nantong | 0.05021 | 0.05795 | 0.09008 |
| Tianjin | 0.12834 | 0.15872 | 0.21616 | Urumqi | 0.10191 | 0.08895 | |
| Chengdu | 0.10383 | 0.11037 | 0.21555 | Jiaxing | 0.04571 | 0.07439 | 0.08876 |
| Jinan | 0.09464 | 0.14167 | 0.18743 | Chongqing | 0.13422 | 0.08210 | 0.08825 |
| Hefei | 0.11757 | 0.08140 | 0.18686 | Fuzhou | 0.03218 | 0.06579 | 0.08626 |
| Suzhou | 0.09040 | 0.15376 | 0.18369 | Changzhou | 0.10362 | 0.06928 | 0.08623 |
| Changsha | 0.14988 | 0.13000 | 0.16272 | Xuchang | 0.08092 | 0.06479 | 0.08283 |
| Zhengzhou | 0.04502 | 0.11099 | 0.15929 | Xiamen | 0.04571 | 0.05901 | 0.08276 |
| Nanning | 0.05432 | 0.06775 | 0.14110 | Foshan | 0.07273 | 0.12783 | 0.08045 |
| Zhuhai | 0.03387 | 0.08736 | 0.13710 | Huizhou | 0.03680 | 0.03968 | 0.07804 |
| Kunming | 0.02620 | 0.05423 | 0.13211 | Weifang | 0.04964 | 0.07593 | |
| Shenyang | 0.09156 | 0.08159 | 0.13139 | Yantai | 0.01453 | 0.04540 | 0.07423 |
| Lanzhou | 0.04523 | 0.05385 | 0.12614 | Yangzhou | 0.07058 | 0.05898 | 0.07074 |
| Nanchang | 0.03218 | 0.04482 | 0.11616 | Changchun | 0.05441 | 0.10291 | 0.07052 |
| Shijiazhuang | 0.04502 | 0.05501 | 0.11376 | Xiangtan | 0.03294 | 0.05514 | 0.06991 |
| Qingdao | 0.06449 | 0.11227 | Zhangjiakou | 0.12472 | 0.09157 | 0.06921 | |
| Dalian | 0.08994 | 0.05479 | 0.11098 | Jilin | 0.04049 | 0.06870 | |
| Xining | 0.04502 | 0.06614 | 0.10610 | Zhuzhou | 0.02529 | 0.04501 | 0.06559 |
Table 4.
Empirical results of exponential random graph model.
| Variable | 2011–2014 | 2015–2017 | 2018–2021 |
|---|---|---|---|
| Edges | −7.55 *** | −6.56 *** | −5.39 *** |
| (0.18) | (0.12) | (0.07) | |
| Nodecov.GDP | −1.33 × 10⁻⁹ | 3.14 × 10⁻⁹ | 3.45 × 10⁻⁹ ** |
| (0.00) | (0.00) | (0.00) | |
| Nodecov.EDU | 5.50 × 10⁻⁷ *** | 4.87 × 10⁻⁷ *** | 4.41 × 10⁻⁷ *** |
| (0.00) | (0.00) | (0.00) | |
| Nodecov.SCI | 1.59 × 10⁻⁷ | 3.03 × 10⁻⁷ ** | 3.80 × 10⁻⁷ *** |
| (0.00) | (0.00) | (0.00) | |
| Edgecov.GEO | 169.80 *** | 223.01 *** | 275.18 *** |
| (39.82) | (30.21) | (21.34) | |
| Edgecov.SPA | 1.11 * | 0.31 | 0.12 |
| (0.47) | (0.36) | (0.23) | |
| AIC | 1547.23 | 3121.39 | 6868.63 |
| BIC | 1598.32 | 3172.47 | 6919.72 |
Note: The statistical significance levels for ***, **, and * were 0.1%, 1%, and 5%, respectively, with t values in parentheses.
Disclaimer/Publisher’s Note: The statements, opinions and data contained in all publications are solely those of the individual author(s) and contributor(s) and not of MDPI and/or the editor(s). MDPI and/or the editor(s) disclaim responsibility for any injury to people or property resulting from any ideas, methods, instructions or products referred to in the content. |
© 2023 by the authors. Licensee MDPI, Basel, Switzerland. This article is an open access article distributed under the terms and conditions of the Creative Commons Attribution (CC BY) license (https://creativecommons.org/licenses/by/4.0/).
Share and Cite
MDPI and ACS Style
Guan, Y.; Li, L.; Liu, C. Resilience Characteristics and Driving Mechanism of Urban Collaborative Innovation Network—A Case Study of China’s New Energy Vehicle Industry. Systems 2023, 11, 214. https://doi.org/10.3390/systems11050214
AMA Style
Guan Y, Li L, Liu C. Resilience Characteristics and Driving Mechanism of Urban Collaborative Innovation Network—A Case Study of China’s New Energy Vehicle Industry. Systems. 2023; 11(5):214. https://doi.org/10.3390/systems11050214
Chicago/Turabian StyleGuan, Yuyue, Longfei Li, and Chao Liu. 2023. "Resilience Characteristics and Driving Mechanism of Urban Collaborative Innovation Network—A Case Study of China’s New Energy Vehicle Industry" Systems 11, no. 5: 214. https://doi.org/10.3390/systems11050214
Note that from the first issue of 2016, this journal uses article numbers instead of page numbers. See further details here.