Abstract
Globally, Emergency Care Systems (ECS) are a critical resource that needs to be used judiciously as demand can easily exceed supply capacity. Sub-optimal ECS use contributes to Emergency Department (ED) crowding; this adversely affects ECS as well as system-wide service performance. Alternate Care Service Pathways (ACSPs) are innovations intended to mitigate ED crowding by re-routing less-urgent cases to sites of care other than the ED. As in other countries, policymakers in Singapore need to respond to increasing ED utilization and are evaluating the introduction of ACSPs. However, developing ACSPs is costly, entails tinkering with established critical services, and runs the risk of unintended adverse consequences. Through a Causal Loop Diagram (CLD) developed in four stages, we present a view of the current Singapore ECS and the intended role of ACSPs in relieving its stress. This exercise suggests that to be successful ACSPs must change the prevailing mental model of the ED as a “one-stop shop” but should focus on integrating with primary care. The discussions stimulated by the development, critiquing, and revision of the CLD highlighted the importance of accounting for the reservations of stakeholders for changes. The CLD has enhanced shared understanding and will be used to guide quantitative simulation modeling to promote informed policy.
1. Background
The Emergency Care System (ECS) [1] is an essential, high-cost, scarce, and critical resource for the community it serves. Aside from bringing emergency care to patients in the field, it acts as a gateway to the hospital system. Closely linked to ECS is the Emergency Department (ED), which has a unique role as a societal safety net [2]. Judicious use of the ECS is of utmost importance for a variety of reasons.
Globally, ECSs are challenged by rising demands resulting from higher expectations, aging populations with a higher prevalence of chronic illnesses, and limited resources. Sub-optimal or inappropriate use results in delayed emergency care and excess patient morbidity and mortality; at least two patients suffer each time an ambulance is unable to offload: the one in the ambulance and another patient waiting for it [3]. In many countries, demand for ECS exceeds the available supply capacity resulting in ED crowding [4]. The adverse consequences of ED crowding are widely researched [5,6,7], but despite the attention, it persists, having been described as a “moral problem” [8]. ED crowding is a key issue for multiple professional societies, including the International Federation for Emergency Medicine (IFEM) [9], the American College of Emergency Physicians (ACEP) [10], and the Royal College of Emergency Medicine (RCEM) in the UK [3,11], all stressing the need for solutions.
In Singapore, ECS usage is rising. Figure 1 shows the situation in the form of a reference mode [12], a behavior-over-time graph that incorporates the past and some possible futures of a system. The resident population and ED attendance are shown year-on-year, with both indexed to their 2006 values. Over the period 2006–2019, ED attendance grew at a rate that was disproportionate to population growth. Even before the COVID-19 pandemic, there were already warning signs of sub-optimal use of the ECS. In 2018, out of a total of about 188,000 overall “9-9-5” calls, about 18,000 calls to the Singapore Civil Defence Force (SCDF) EMS were non-emergencies, while only 23,000 were life-and-death cases [13]. In 2015, 1 out of 10 ED visits was labeled as ‘inappropriate’ in Singapore [14]. The healthcare system in Singapore was stretched to the limit by the COVID-19 pandemic, forcing solutions to be implemented in a reactive mode. The on-the-fly responses contributed to stress and burnout among providers and anxiety in the population at large [15,16]. The experience led to the realization that unforeseen surges of demand can quickly wipe out ‘buffer’ capacity in the health system. The warning signs, together with the shock of the pandemic, have led to the realization that there is an urgent need to develop well-thought-out solutions for ED crowding.
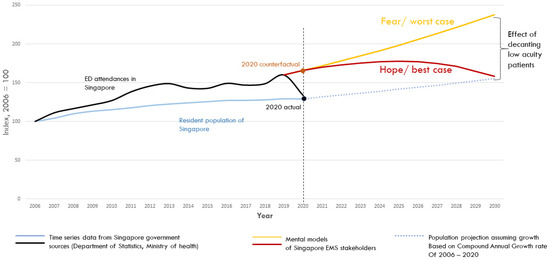
Figure 1.
A reference mode diagram of ED attendance relative to Singapore’s resident population.
In this context, policymakers in Singapore are considering reconfiguration of emergency services by introducing Alternate Care Service Pathways (ACSPs). Collectively, the ACSPs will form an interconnected set of pathways aiming to provide severity-appropriate responses to the patients using emergency services. Thus, patients who can be safely managed outside ECS will be referred to lower-level care facilities at an early stage of ECS care (Figure 2).
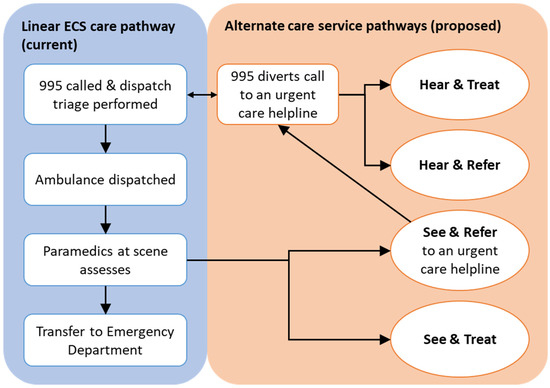
Figure 2.
A schematic representation of the current and proposed care service pathways.
This strategy will reduce the avoidable load on the various components of the ECS. Some patients will be managed by ‘Hear and treat’ pathways, others will be managed by ‘See and treat’ pathways, while still others will be managed through either ‘hear and refer’ or ‘see and refer’ pathways. Only the remaining will be transferred to EDs. These ACSPs can be implemented in various forms, such as management by Telehealth Nurses (THNs), at-scene care by ambulance crews, co-located General Practitioners (GPs), i.e., primary care facilities built next to EDs, operating extended hours, or alternate care facilities (including urgent care providers) geared up for patients referred by the ECS [9,11,17].
The introduction of ACSPs is motivated by the intent to reduce unit cost and increase provider and patient satisfaction while maintaining population health, moving towards the quadruple aim of health care [18]. ACSPs are intended to re-route less-urgent cases to sites of care other than the ED, following newly created service pathways. The resulting load reduction on ECS will help maintain its reserve capacity to cover demand surges, making the system more robust and resilient. ACSPs are currently in the very early stages of introduction in Singapore, with their effectiveness not yet evaluated.
ACSP introduction involves a major reengineering of finely balanced components of the ECS, and this needs carefully planned evaluation. The published literature does not provide the needed guidance. A recent scoping review concludes that “most studies lacked methodologically rigorous evidence and failed to evaluate safe patient outcomes” [19]. Real-life evaluation of ACSPs is costly, time-consuming, and would involve tinkering with a critical set of resources meeting population needs round-the-clock. In addition, policymakers are also aware that implementing ACSPs is fraught with unintended consequences. In the USA, Urgent Care Centers and Retail Clinics, instances of ACSPs, were expected to reduce ED utilization by 13–27% and achieve cost reductions of US$ 4.4 Billion annually [20]. In a retrospective study, it was found that 37 additional Urgent Care Center visits were associated with the reduction of a single ED visit and that new overall spending on lower-acuity care had increased [21]. In the UK, the 1-1-1 service received “wildly contrasting views”; it was found to have achieved some objectives (labor substitution, increased use, and patient satisfaction), but there was insufficient evidence of its effect on provider satisfaction, other health services, and overall costs [22]. Clearly, the transformation of the ECS by adding ACSPs to it cannot be planned with simplistic, linear thinking.
Thus, there is a clear need for systems thinking in approaching the design and implementation of ACSPs. While quantitative simulation has the power to help avoid costly mistakes by performing what-if analysis, systems thinking recognizes that certain systems—such as ECS—have structures that result in policy resistance, that is, “our best efforts to solve problems often make them worse” [23]. Policy resistance arises because of dynamic complexity, or the counter-intuitive behavior that results from interactions of a system’s agents over time [23,24]. Such systems typically exhibit several characteristics [23,25]: (i) constant change, (ii) tight coupling of system elements, (iii) feedback, (iv) nonlinearity, (v) history-dependence, (vi) self-organization, (vii) adaptation and evolution, (viii) trade-offs in outcomes. A systems thinking approach will attune planners to consider possible unintended consequences.
The objective of this paper is to present a logic diagram—a Causal Loop Diagram in System Dynamics terms—of the current ECS in Singapore based on what is known and hypothesized to play a role in the dynamics of ED attendance and the potential effect of ACSPs on that dynamic. The role of such a model is two-fold. First, it provides a visual aid to promote communication and shared understanding between policymakers, clinicians, and researchers. Second, a CLD can aid in the development of a quantitative simulation (in silico) study and policy analysis to be covered in future papers.
2. Methodology
Causal Loop Diagrams (CLD) are visual systems thinking tools that “identify and label feedback loops to facilitate understanding, dynamic reasoning and formal modeling” [12]. They are widely used in studies on policy in general [25] and health policy in particular [26,27,28,29,30,31,32,33].
CLDs originated as a preliminary step toward developing quantitative simulation models but grew into a standalone method to develop a shared understanding of the structure and causal linkages of a system [29]. CLDs serve the purpose of identifying the variables of interest and hypothesizing how they interact because causality in a CLD is based on beliefs and world-views, the “mental models”, of the modelers and the stakeholders involved in CLD development. Their qualitative nature has the advantage that it frees researchers, for the time being, from being encumbered by what data is available or easily measured and allows them to focus on variables and relationships that really matter in the real world. As an approach, the use of CLDs provides insight into the systemic structure of feedback loops and delays that produce behavior-over-time patterns that can be counter-intuitive. This insight allows for a deeper analysis of policy initiatives at a nascent stage. Developing a CLD will, therefore, help to frame the discussions on designing, quantitatively simulating, and testing ACSPs.
CLDs follow certain conventions and practices [25,29]. Variables and the driving relationships between them are depicted as nodes and directed edges, respectively. Positive polarity means that other things being constant, an increase in the driving variable causes an increase in the driven variable; likewise, a decrease in the driving variable would cause a decrease in the driven variable. In contrast, negative polarity implies an inverse relationship. Two parallel lines across an arrow indicate a delay between the effect and the cause. A feedback loop is a series of links such that a variable, through a series of directed edges, is linked back to itself. Feedback loops can be either reinforcing or balancing and are denoted by the capitalized letters ‘R’ for reinforcing and ‘B’ for balancing. In a reinforcing loop, an increase in a variable has cascading effects along the loop and results in a further increase in that variable. In a balancing loop, an increase in a variable has cascading effects that ultimately result in a decrease in that variable.
The present CLD was developed in four phases: (i) Three authors (FJS, JA, and AK) developed a “seed CLD” based on domain knowledge, prior work, discussions with emergency medicine doctors, and literature; (ii) The CLD was reviewed by three authors (ZL, MO, and DM); (iii) The updated CLD was presented to the Health Systems Interest Group of the System Dynamics Society; (iv) The work was presented to about thirty Singaporean ECS stakeholders in five meetings for their critique. Following the approach of “legitimate reservations” [34], the consulted experts were welcomed to ask questions and make suggestions on the completeness and validity of the set of nodes and edges of the CLD. Feedback received in each of the phases (ii), (iii), and (iv) was incorporated progressively. In phase (ii), revisions were made for the clarity of variable names and readability of the CLD. Further, the issue of hospital crowding leading to access blocks was raised, and the CLD was modified accordingly. In phase (iii), reviewers critiqued the logic of the CLD from the viewpoint of system dynamics methodology experts and also provided us with insight into ACSPs from countries other than Singapore. Discussions with practitioners (including YYN, BL, ZL, and MO) in phase (iv) led us to add variables representing financial incentives to both providers and patients, along with their associated causal links to the CLD. Thus, the CLD is built up with insight from global and local experts who view the ECS from different lenses. The resulting CLD, developed in Vensim DSS version 8.0.9 for Windows, is presented step-by-step in the next section. The Vensim file containing the CLD is provided as Supplement File S1.
3. Results
The team produced a CLD of the dynamics of ED crowding in Singapore and the potential role of ACSPs in addressing it. The CLD has twenty variables, and it depicts a shared understanding of the systemic structure that perpetuates potential ED crowding and hence the role that ACSPs must play as solutions to ED crowding. The CLD has four feedback loops, with two of them being reinforcing loops and two balancing loops. In the following paragraphs, we describe the CLD, adding one loop at a time.
As shown in Figure 3, other things being constant, ED crowding (variable 2 in the CLD) increases with patients in ED (variable 1) and decreases with ED Capacity (variable 6). It should be noted that ED crowding changes minute-by-minute and can experience surges, while ED capacity is a slow-changing stock. Financial incentives (based on the payment mechanisms) for longer LOS (5) can affect Average LOS (variable 4). Higher ED crowding leads to a higher average total waiting time (variable 3) at different stages of service, which leads to a higher Average Length of Stay (LOS, variable 4) in the ED. Finally, a higher Average LOS drives the number of patients in the ED (variable 1). The resulting reinforcing loop, “Potential crowding”, is labeled R1.
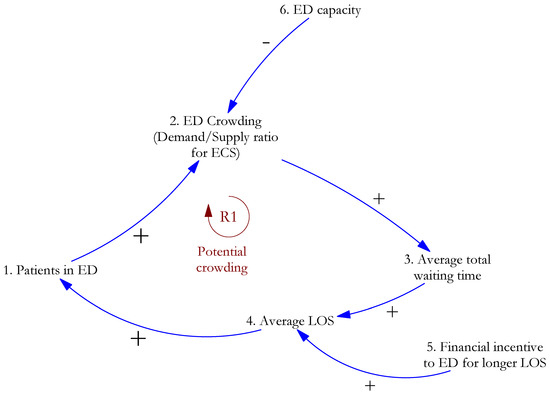
Figure 3.
The interplay of demand for and supply of ED capacity may result in ED crowding.
Next, Figure 4 builds on the elements of the CLD shown in Figure 3. Stakeholders in the Singapore health system ensure that as there as signs of ED crowding, actions are taken to increase capacity (variable 7), with a time delay in the causal effect. The increased capacity (variable 6) reduces ED crowding (variable 2), thus completing a balancing loop, “Capacity Planning”, labeled B1. Hospital crowding (variable 8) drives ED boarding (variable 9), which negatively affects ED capacity (variable 6).
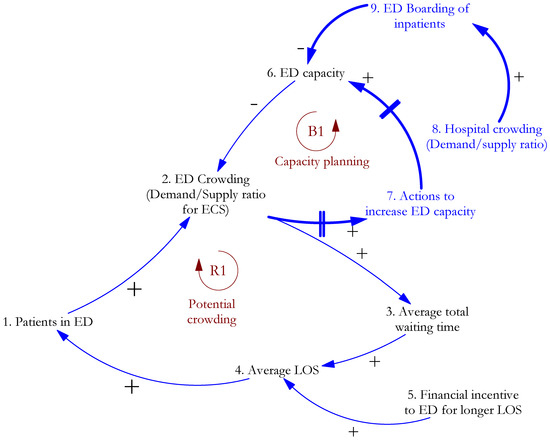
Figure 4.
Capacity planning heads off potential ED crowding.
Figure 5 incorporates additional elements of the CLD. In Singapore, ECS patients are assigned a Patient Acuity Category (PAC). The PAC takes one of four mutually exclusive values: P1 for critically ill patients, P2 for those that are non-ambulant with major emergencies, P3 for ambulant cases with minor emergencies, and P4 for non-emergency cases [35]. In the present work, patients with Patient Acuity Category P1 and P2 are all considered high acuity, while P3 and P4 patients are considered low acuity. The present system caters to patients of both high and low acuity. ED attendances (variable 19) consist of low acuity admissions (variable 17) and high acuity admissions (variable 18). As ED crowding (variable 2) decreases, with average total waiting time (variable 3) decreasing, consequently, the satisfaction of patients and their caregivers (variable 10) increases. The perception (variable 11) is built up in the population—both among low and high-acuity patients—that whatever the health problem, the ED is the one place where one can be sure it will be fixed. In the absence of alternatives (ACSPs), the ED is seen as a “one-stop shop” for health services. From a patient perspective, the Out-of-Pocket (OOP) cost in the ED (variable 14), inclusive of diagnostic tests, is lower than the expected costs in primary care, further increasing the attractiveness of the ED. The balancing loop B2, “Crowding-perception”, reflects this set of causal links. If they are to succeed, ACSPs must counteract the perception of the ED as a one-stop shop.
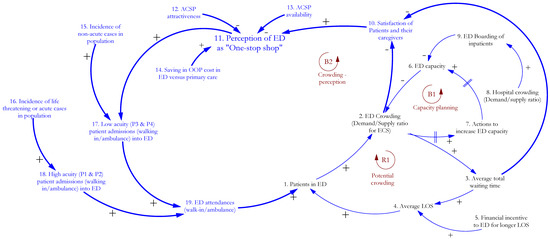
Figure 5.
Perception of ED as a one-stop shop builds up in the population.
Finally, the new variable 20 and its associated links added in Figure 6 shows that the combination of ever more patients treated successfully in the ED (variable 20) and the one-stop-shop perception of the ED (variable 11) result in more ED attendances from P3 and P4 patients (variable 17). The sequence of effects from the variables 1, 20, 17, 19, and back to 1 creates the reinforcing loop R2, “ED filling primary care gaps”.
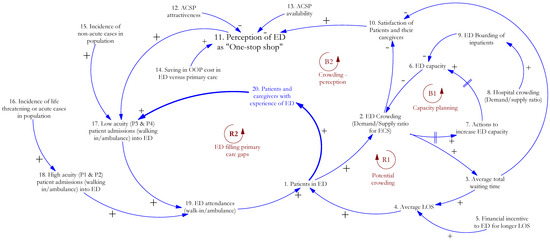
Figure 6.
ED fills primary care gaps.
The four loops in the CLD are listed in Table 1. “Capacity planning” loop B1 counteracts the tendency of “Potential crowding” loop R1 to congest the ED and cause severe degradation of EMS. “Crowding perception” loop B2 maintains a balance so that satisfaction with emergency services is not compromised. Finally, “ED filling primary care gaps”, R2, is the loop that stakeholders must act on to enhance the appropriate use of emergency services—that is, to decrease the proportion of low acuity patient attendance in the ED.

Table 1.
Summary of causal loops.
4. Discussion
In this paper, we have traced the development of a CLD, a systems thinking tool, to explain the logic for intervening in the ECS with ACSPs. The CLD presented here can be translated into a quantitative dynamic model, allowing in silico evaluation of the potential systemwide effects of ACSP policy decisions. However, it has already served to enhance the shared understanding of the potential role of ACSPs in the Singapore ECS.
4.1. Implications
It may be obvious with the benefit of hindsight, but an essential insight that emerges is that to be successful, ACSPs in Singapore must change the currently prevailing use of the ED as a one-stop shop for all medical needs, including low-acuity needs. This pattern of ED use is not only evident in Singapore but also in other countries [36,37,38,39]. The ACSPs appear to have the potential to meet this imperative, as they enhance the availability of primary care in terms of both time and location. The one-stop shop ED use model leads to emergency services substituting for primary care. Consequently, the design approach of ACSPs should focus on enhancing the availability of primary care, for example, by meeting the urgent care needs of low-acuity patients at a lower price point and with a shorter waiting time. Further, the perception of the ECS as a “one-stop shop” (variable 11 in Figure 6) has been built up over decades and is self-reinforcing (loop R2 of the CLD). In this context, as one stakeholder commented, Singapore’s emergency system is a victim of its own success. It will require investment in education and publicity, based on early evidence from well-designed ACSPs, to change ingrained ideas about appropriate emergency services use.
By following an approach that encourages the expression of legitimate reservations [40], several key questions were raised in the discussions that shaped the CLD. The most important reservations were centered around whether the incidence of emergency cases (variables 15 and 16) is indeed an exogenous variable in the context of planning for ACSPs. Three questions were raised. Firstly, the incidence rates may be affected by the aging of the population, leading to a greater prevalence of risk factors and a higher proportion of the population with frailty. Secondly, it may be hypothesized that the availability of ACSPs (variable 13), through additional factors not shown in the CLD, improves population health to the extent that the incidence of emergency cases is reduced. Thirdly, the cautionary experience of Urgent Care Centers in the USA was pointed out [21]. Thus, it is possible that the availability of ACSPs leads to the unintended consequence of their increased usage to the extent that gains in ED utilization reduction are wiped out. A distinct likelihood can exist that there is a stock of unmet needs in the population, and the availability of ACSPs expands the demand for the newly available services, i.e., the demand for ECS increases. Each of these questions will be evaluated during the quantitative simulation of ACSPs. The value of the present CLD as a tool that promotes shared understanding has already been demonstrated through its ability to elicit these questions.
Availability and attractiveness of the ACSPs (variables 12 and 13) were highlighted during the consultations as factors that require extensive study and validation. Improved preventive care, improved health literacy, and provider focus on shaping health-seeking behaviors were recommended as requisites to enhancing ACSP attractiveness. Effective and efficient triage processes to determine the eligibility of each patient for the appropriate ACSP will be key to the large-scale adoption of ACSPs. Some learnings from other jurisdictions were also pointed out during the discussions. A study showed there was potential to reduce ED referrals by about 75% when GPs reviewed triage decisions made by call handlers aided by decision support systems in the 1-1-1 service in the UK [41]. On the other hand, there are emerging possibilities to develop machine learning solutions to aid triage [42,43,44]. Challenges faced in the 7-1-1-9 emergency telephone consultation service in Japan include difficulties in recruiting skilled THNs and in selecting the appropriate geographic setting for facilities [45]. Such factors have a bearing on the availability of ACSPs.
Finally, it was pointed out that a critical success factor for the large-scale use of ACSPs will be the ability to extend their operation to walk-in patients, apart from those who call the emergency number 9-9-5. Only about 20% of ED cases in Singapore are 9-9-5 callers [46]; thus, scaling up ACSPs requires them to be applicable to walk-in patients as well. This requires large-scale changes in the design of the Singapore ECS—for example, it may be mandatory to call a number to avail ED services. However, it will be challenging to take this step in a manner that does not increase inequity and cause a denial of service to acute cases.
Recent research [47] clusters strategies for coping with hospital congestion in general (i.e., not only ED congestion) into two groups: patient absorption strategies, which are employed initially as capacity is strained, and patient expulsion and exclusion strategies, that are resorted to when the capacity shortage becomes too acute. These coping strategies have unintended consequences. Earlier, solutions for ED crowding have been grouped into those that decrease input, increase throughput, or increase output [3,4,9,10,11]; many “solutions”, such as ambulance diversion and displaying wait times for non-urgent cases at ED are, in fact, coping strategies. The ACSPs proposed in Singapore, aimed at reducing the sub-optimal use of EMS to plug gaps in primary care, go beyond coping strategies. They are investments in fundamentally new pathways that seek to minimize the current mismatch between patient and provider perceptions of the appropriate use of the ECS. They are aligned with the realization that “the problem and therefore the solutions to ED crowding lie largely outside of the ED” [5]. However, they require extensive strategizing before being implemented on the ground, and the present CLD aids such strategizing, as shown by the issues that it has helped bring to the fore so far.
4.2. Limitations and Scope for Future Work
CLDs have inherent limitations [48], chief among them being that they do not distinguish between stocks (such as Patients in ED, variable 1) and other variables such as flows (such as incidence or admissions, variables 15 through 18) or parameters (Average length of stay, variable 4). The present CLD is not a substitute for a quantitative simulation model that shows how the different ACSPs can possibly interact with each other and the conventional pathways of walk-ins and ambulance dispatch. However, at this nascent stage of ACSP design, our CLD plays the role of a “boundary object” that facilitates “meaning-making conversations among modelers and non-modelers alike” [49]. In addition to its role as a facilitator of policy discussions, it is a first step towards a quantitative “virtual ECS model” [50]. The CLD will continue to be updated, reflecting the shared understanding of stakeholders, as the policy discussions and quantitative modeling proceed. Through this paper, we also invite input from the wider interested audience, with the caveat that our work reflects a Singaporean viewpoint.
Supplementary Materials
The following supporting information can be downloaded at: https://www.mdpi.com/article/10.3390/systems11050215/s1.
Author Contributions
Conceptualization, A.K., Z.L., J.P.A., D.B.M., M.E.H.O. and F.J.S.; methodology, A.K., Z.L., J.P.A., M.E.H.O. and F.J.S.; software, A.K. and F.J.S.; validation, A.K., J.P.A. and F.J.S.; formal analysis, A.K. and F.J.S.; investigation, A.K., M.E.H.O. and F.J.S.; resources, A.K., M.E.H.O. and F.J.S.; data curation, A.K. and F.J.S.; writing—original draft preparation, A.K. and F.J.S.; writing—review and editing, A.K., Z.L., J.P.A., Y.Y.N., B.S.-H.L., D.B.M., M.E.H.O. and F.J.S.; visualization, A.K. and F.J.S.; supervision, M.E.H.O. and F.J.S.; project administration, M.E.H.O. and F.J.S.; funding acquisition, M.E.H.O. All authors have read and agreed to the published version of the manuscript.
Funding
This research is supported by the Singapore Ministry of Health’s National Medical Research Council under its NMRC CSA grant, project ID: CSASI15nov001.
Data Availability Statement
No new data were created or analyzed in this study. Data sharing is not applicable to this article.
Acknowledgments
The authors are grateful to Jack Homer (Homer Consulting) for insight on Urgent Care Centers in the USA, Eric Wolstenholme and Douglas McKelvie (Symmetric Scenarios Ltd.) for insight on the 1-1-1 service in the UK and other members of Health Policy Special Interest Group of System Dynamics Society for their constructive critique of the CLD. Yohei Okada (Department of Preventive Services, Graduate School of Medicine, Kyoto University) helped us with insight into the 7-1-1-9 service in Japan. In Singapore, members of the Unit for Pre-hospital and Emergency Care (UPEC), Singapore provided their feedback in two group meetings. In addition, Colin Tan (Singapore Civil Defence Force), Goh Siang Hiong (SingHealth Duke NUS Emergency Medicine Academic Clinical Program); Tay Wei Ling (Department of Emergency Medicine, Ng Teng Fong General Hospital, Singapore) reviewed the CLD in separate meetings.
Conflicts of Interest
The authors declare no conflict of interest.
References
- World Health Organization. WHO Emergency Care System Framework. 2022. Available online: https://www.who.int/publications/i/item/who-emergency-care-system-framework (accessed on 26 January 2023).
- Glauser, J. Rationing and the Role of the Emergency Department as Society’s Safety Net. Acad. Emerg. Med. 2001, 8, 1101–1106. [Google Scholar] [CrossRef] [PubMed]
- Royal College of Emergency Medicine. Crowding and Its Consequences; Royal College of Emergency Medicine: London, UK, 2021. [Google Scholar]
- Asplin, B.R.; Magid, D.J.; Rhodes, K.V.; Solberg, L.I.; Lurie, N.; Camargo, C.A., Jr. A conceptual model of emergency department crowding. Ann. Emerg. Med. 2003, 42, 173–180. [Google Scholar] [CrossRef]
- Morley, C.; Unwin, M.; Peterson, G.M.; Stankovich, J.; Kinsman, L. Emergency department crowding: A systematic review of causes, consequences and solutions. PLoS ONE 2018, 13, e0203316. [Google Scholar] [CrossRef]
- Rasouli, H.R.; Esfahani, A.A.; Nobakht, M.; Eskandari, M.; Mahmoodi, S.; Goodarzi, H.; Farajzadeh, M.A. Outcomes of Crowding in Emergency Departments; a Systematic Review. Arch. Acad. Emerg. Med. 2019, 7, e52. [Google Scholar] [CrossRef]
- Boudi, Z.; Lauque, D.; Alsabri, M.; Östlundh, L.; Oneyji, C.; Khalemsky, A.; Rial, C.L.; Liu, S.W.; Camargo, C.A., Jr.; Aburawi, E.; et al. Association between boarding in the emergency department and in-hospital mortality: A systematic review. PLoS ONE 2020, 15, e0231253. [Google Scholar] [CrossRef]
- Moskop, J.C.; Geiderman, J.M.; Marshall, K.; McGreevy, J.; Derse, A.R.; Bookman, K.; McGrath, N.; Iserson, K.V. Another Look at the Persistent Moral Problem of Emergency Department Crowding. Ann. Emerg. Med. 2019, 74, 357–364. [Google Scholar] [CrossRef] [PubMed]
- Javidan, A.P.; Hansen, K.; Higginson, I.; Jones, P.; Lang, E. The International Federation for Emergency Medicine report on emergency department crowding and access block: A brief summary. Emerg. Med. J. 2021, 38, 245–246. [Google Scholar] [CrossRef] [PubMed]
- American College of Emergency Physicians. Emergency Department Crowding: High Impact Solutions; American College of Emergency Physicians: Irving, TX, USA, 2016. [Google Scholar]
- Royal College of Emergency Medicine. Tackling Emergency Department Crowding; Royal College of Emergency Medicine: London, UK, 2015. [Google Scholar]
- Ford, D.N. A system dynamics glossary. Syst. Dyn. Rev. 2019, 35, 369–379. [Google Scholar] [CrossRef]
- SCDF. Fire, Emergency Medical Services and Enforcement Statistics 2018; SCDF: Singapore, 2018.
- Oh, H.; Chow, W.; Gao, Y.; Tiah, L.; Goh, S.; Mohan, T. Factors associated with inappropriate attendances at the emergency department of a tertiary hospital in Singapore. Singap. Med. J. 2020, 61, 75–80. [Google Scholar] [CrossRef]
- Lai, L. How Close is Singapore’s Healthcare System to its Breaking Point? Straits Times, 23 October 2021. [Google Scholar]
- Teo, I.; Chay, J.; Cheung, Y.B.; Sung, S.C.; Tewani, K.G.; Yeo, L.F.; Yang, G.M.; Pan, F.T.; Ng, J.Y.; Aloweni, F.A.B.; et al. Healthcare worker stress, anxiety and burnout during the COVID-19 pandemic in Singapore: A 6-month multi-centre prospective study. PLoS ONE 2021, 16, e0258866. [Google Scholar] [CrossRef]
- American College of Emergency Physicians. Emergency Department Crowding: Emergency Medicine Practice Committee; American College of Emergency Physicians: Irving, TX, USA, 2016. [Google Scholar]
- Bodenheimer, T.; Sinsky, C. From Triple to Quadruple Aim: Care of the Patient Requires Care of the Provider. Ann. Fam. Med. 2014, 12, 573–576. [Google Scholar] [CrossRef]
- Blodgett, J.M.; Robertson, D.J.; Pennington, E.; Ratcliffe, D.; Rockwood, K. Alternatives to direct emergency department conveyance of ambulance patients: A scoping review of the evidence. Scand. J. Trauma Resusc. Emerg. Med. 2021, 29, 1–21. [Google Scholar] [CrossRef] [PubMed]
- Weinick, R.M.; Burns, R.M.; Mehrotra, A. Many Emergency Department Visits Could Be Managed At Urgent Care Centers And Retail Clinics. Health Aff. 2010, 29, 1630–1636. [Google Scholar] [CrossRef]
- Wang, B.; Mehrotra, A.; Friedman, A.B. Urgent care centers deter some emergency department visits but, on net, increase spending: Study examines whether growth of retail urgent care centers deterred lower-acuity emergency department visits. Health Aff. 2021, 40, 587–595. [Google Scholar] [CrossRef] [PubMed]
- Pope, C.; Turnbull, J.; Jones, J.; Prichard, J.; Rowsell, A.; Halford, S. Has the NHS 111 urgent care telephone service been a success? Case study and secondary data analysis in England. BMJ Open 2017, 7, e014815. [Google Scholar] [CrossRef]
- Sterman, J.D. Learning from Evidence in a Complex World. Am. J. Public Health 2006, 96, 505–514. [Google Scholar] [CrossRef]
- Forrester, J.W. Counter intuitive behavior of social systems. Technol. Rev. 1971, 73, 52–68. [Google Scholar]
- Sterman, J. Business Dynamics: Systems Thinking and Modeling for a Complex World; Irwin/McGraw-Hill: Boston, MA, USA, 2000; Volume 26, 982p. [Google Scholar]
- Lane, D.C.; Monefeldt, C.; Rosenhead, J.V. Looking in the wrong place for healthcare improvements: A system dynamics study of an accident and emergency department. J. Oper. Res. Soc. 2000, 51, 518–531. [Google Scholar] [CrossRef]
- Ansah, J.P.; Matchar, D.B.; Koh, V.; Schoenenberger, L. Mapping the Dynamic Complexity of Chronic Disease Care in Singapore: Using Group Model Building in Knowledge Elicitation. Syst. Res. Behav. Sci. 2018, 35, 759–775. [Google Scholar] [CrossRef]
- Cassidy, R.; Tomoaia-Cotisel, A.; Semwanga, A.R.; Binyaruka, P.; Chalabi, Z.; Blanchet, K.; Singh, N.S.; Maiba, J.; Borghi, J. Understanding the maternal and child health system response to payment for performance in Tanzania using a causal loop diagram approach. Soc. Sci. Med. 2021, 285, 114277. [Google Scholar] [CrossRef] [PubMed]
- Kenzie, E.S.; Patzel, M.; Nelson, E.; Lovejoy, T.; Ono, S.; Davis, M.M. Long drives and red tape: Mapping rural veteran access to primary care using causal-loop diagramming. BMC Health Serv. Res. 2022, 22, 1–14. [Google Scholar] [CrossRef] [PubMed]
- Vandenbroeck, P.; Goossens, J.; Clemens, M. Foresight: Tackling Obesities: Future Choices—Building the Obesity System Map. Report no DIUS/PUB/2K/10/07/NP. Department of Innovation Universities and Skills, Govt. of UK. 2007. Available online: https://assets.publishing.service.gov.uk/government/uploads/system/uploads/attachment_data/file/295154/07-1179-obesity-building-system-map.pdf (accessed on 21 April 2023).
- Rwashana, A.S.; Williams, D.W.; Neema, S. System dynamics approach to immunization healthcare issues in developing countries: A case study of Uganda. Health Inform. J. 2009, 15, 95–107. [Google Scholar] [CrossRef]
- Allender, S.; Owen, B.; Kuhlberg, J.; Lowe, J.; Nagorcka-Smith, P.; Whelan, J.; Bell, C. A Community Based Systems Diagram of Obesity Causes. PLoS ONE 2015, 10, e0129683. [Google Scholar] [CrossRef] [PubMed]
- Lindenfalk, B.; Resmini, A.; Weiss, K.; Molinari, W. Use of Causal Loop Diagrams to Improve Service Processes. In Service Design Practices for Healthcare Innovation; Springer: Berlin/Heidelberg, Germany, 2022; pp. 295–313. [Google Scholar]
- Dettmer, H.W. The Logical Thinking Process—An Executive Summary; Virtualbookworm.com Publishing: College Station, TX, USA, 2018. [Google Scholar]
- Paul, P.; Heng, B.H.; Seow, E.; Molina, J.; Tay, S.Y. Predictors of frequent attenders of emergency department at an acute general hospital in Singapore. Emerg. Med. J. 2010, 27, 843–848. [Google Scholar] [CrossRef] [PubMed]
- Gawronski, O.; Cerulli, C. Non-urgent use of the Emergency Department of the Bambino Gesù Hospital: A cross sectional survey of parents’ motivations. Paediatr. Child Health 2009, 19, S90–S93. [Google Scholar] [CrossRef]
- McCusker, J.; Roberge, D.; Lévesque, J.-F.; Ciampi, A.; Vadeboncoeur, A.; Larouche, D.; Sanche, S. Emergency Department Visits and Primary Care Among Adults With Chronic Conditions. Med. Care 2010, 48, 972–980. [Google Scholar] [CrossRef]
- Cunningham, A.; Mautner, D.; Ku, B.; Scott, K.; LaNoue, M. Frequent emergency department visitors are frequent primary care visitors and report unmet primary care needs. J. Evaluation Clin. Pract. 2017, 23, 567–573. [Google Scholar] [CrossRef]
- Enard, K.R.; Ganelin, D.M. Exploring the Value Proposition of Primary Care for Safety-Net Patients Who Utilize Emergency Departments to Address Unmet Needs. J. Prim. Care Community Health 2017, 8, 285–293. [Google Scholar] [CrossRef] [PubMed]
- Dettmer, H.W. The Logical Thinking Process: A Systems Approach to Complex Problem Solving; ASQ Quality Press: Milwaukee, WI, USA, 2007; Volume 29, 413p. [Google Scholar]
- Anderson, A.; Roland, M. Potential for advice from doctors to reduce the number of patients referred to emergency departments by NHS 111 call handlers: Observational study. BMJ Open 2015, 5, e009444. [Google Scholar] [CrossRef]
- Salman, O.H.; Taha, Z.; Alsabah, M.Q.; Hussein, Y.S.; Mohammed, A.S.; Aal-Nouman, M. A review on utilizing machine learning technology in the fields of electronic emergency triage and patient priority systems in telemedicine: Coherent taxonomy, motivations, open research challenges and recommendations for intelligent future work. Comput. Methods Programs Biomed. 2021, 209, 106357. [Google Scholar] [CrossRef]
- Sánchez-Salmerón, R.; Gómez-Urquiza, J.L.; Albendín-García, L.; Correa-Rodríguez, M.; Martos-Cabrera, M.B.; Velando-Soriano, A.; Suleiman-Martos, N. Machine learning methods applied to triage in emergency services: A systematic review. Int. Emerg. Nurs. 2022, 60, 101109. [Google Scholar] [CrossRef]
- Levin, S.; Toerper, M.; Hamrock, E.; Hinson, J.S.; Barnes, S.; Gardner, H.; Dugas, A.; Linton, B.; Kirsch, T.; Kelen, G. Machine-Learning-Based Electronic Triage More Accurately Differentiates Patients With Respect to Clinical Outcomes Compared With the Emergency Severity Index. Ann. Emerg. Med. 2018, 71, 565–574. [Google Scholar] [CrossRef] [PubMed]
- Fire and Disaster Management Agency (FDMA) Japan. FY2020 Study Group on Emergency Services Subcommittee for the Study of Nationwide Deployment of #7119 Interim Report; Fire and Disaster Management Agency (FDMA): Tokyo, Japan, 2021.
- Ministry of Health Singapore. Detailed Statistical Time Series (Health). Available online: https://www.singstat.gov.sg/find-data/search-by-theme/society/health/latest-data (accessed on 2 February 2023).
- Wolstenholme, E.F. Using Cascaded and Interlocking Generic System Archetypes to Communicate Policy Insights—The Case for Justifying Integrated Health Care Systems in Terms of Reducing Hospital Congestion. Systems 2022, 10, 135. [Google Scholar] [CrossRef]
- Richardson, G.P. Problems with causal-loop diagrams. Syst. Dyn. Rev. 1986, 2, 158–170. [Google Scholar] [CrossRef]
- Black, L.J. When visuals are boundary objects in system dynamics work. Syst. Dyn. Rev. 2013, 29, 70–86. [Google Scholar] [CrossRef]
- Ansah, J.P.; Ahmad, S.; Lee, L.H.; Shen, Y.; Ong, M.E.H.; Matchar, D.B.; Schoenenberger, L. Modeling Emergency Department crowding: Restoring the balance between demand for and supply of emergency medicine. PLoS ONE 2021, 16, e0244097. [Google Scholar] [CrossRef] [PubMed]
Disclaimer/Publisher’s Note: The statements, opinions and data contained in all publications are solely those of the individual author(s) and contributor(s) and not of MDPI and/or the editor(s). MDPI and/or the editor(s) disclaim responsibility for any injury to people or property resulting from any ideas, methods, instructions or products referred to in the content. |
© 2023 by the authors. Licensee MDPI, Basel, Switzerland. This article is an open access article distributed under the terms and conditions of the Creative Commons Attribution (CC BY) license (https://creativecommons.org/licenses/by/4.0/).