
Trajectory Generation of Ultra-Low-Frequency Travel Routes in Large-Scale Complex Road Networks

School of Intelligent Systems Engineering, Sun Yat-sen University, Shenzhen 518107, China
*
Author to whom correspondence should be addressed.
Systems 2023, 11(2), 61; https://doi.org/10.3390/systems11020061
Submission received: 19 December 2022
/
Revised: 19 January 2023
/
Accepted: 20 January 2023
/
Published: 23 January 2023
Abstract
:Trajectory generation can help predict the future road network state and properly deal with the privacy issues of trajectory data usage. To solve the problem that routes with very few journeys (ultra-low-frequency journey routes) are difficult to generate in the large-scale complex road network scenarios, the study designs a framework focusing on ultra-low-frequency route generation, ULF-TrajGAIL, and proposes an original trajectory-augmentation method called the combined expansion method. The specific original trajectory-augmentation method is determined by the pre-trajectory-generation experiment, and high-quality synthetic trajectories with higher diversity and similarity are output based on the final generation experiments which take the augmented trajectories as references. Based on the real trajectories of a complex road network in a region of Guangzhou, the quality of synthetic trajectories under different original trajectory-augmentation methods from the route, link and origin and destination pairs levels has been compared. The results show that the method can generate more ultra-low-frequency routes and help improve the overall diversity of routes and the similarity between routes and the number of journeys as well.
1. Introduction
Vehicle trajectory data contains rich information about the interaction between vehicles and the road network environment, specifically the route-selection behaviors of vehicles in the road network, and the information has important reference value for academic research in the field of traffic management and planning [1]. Due to the randomness and vagueness of route-selection behavior [2], research on trajectory data-driven trajectory feature mining and prediction has been proliferating. With the development of deep-learning-based generative models, the trajectory-generation task has gradually become a hot research topic in recent years and the synthetic trajectory datasets with overall statistical characteristics similar to the original trajectories by learning the potential distribution of the original ones in the road network.
The trajectory-generation task is mainly used to serve two purposes. The first is to address the dearth of real data by generating synthetic data that resembles real observations to increase training and test samples. The second purpose is to take advantage of the reasonable similarity of synthetic trajectories to achieve privacy protection in downstream applications that serve this task. The resultant trajectories are all in line with the road network topology rules, and can be selected by travelers in the real road network. Therefore, they can be used for trajectory data-driven research. In addition, by specifying the generated quantity of trajectories, it is possible to predict the distribution of journeys and evaluate the future state of the road network based on the estimation of the total number of future journeys. Thus, it can help road network administrations to manage and control in a rational way, which in turn helps to realize richer downstream applications, such as route recommendation to drivers through existing information systems. High-quality synthetic trajectories with more diversity and similarity contain more and more detailed route-selection behavior features in the original trajectory, which can help achieve more accurate prediction and recommendation.
Actually, in the realistic large-scale complex road network, there are many alternative routes between multiple pairs of origins and destinations, but the vehicle trajectories collected in this scenario usually involve many reasonable but rarely chosen routes [3]. Therefore, there are two main problems in the task of generating synthetic trajectories to the real trajectories in this scenario due to the routes corresponding to relatively few journeys, and this kind of route is defined as ultra-low-frequency route:
- A significant portion of ultra-low-frequency routes in the original trajectories do not appear in the synthetic trajectories;
- The number of journeys corresponding to the learned routes will change when ensuring the same generation quantity with the original trajectories and then the distribution between routes and the number of journeys is destroyed as a result.
The above problems lead to the eventual loss of more diversities and similarities in synthetic trajectories. It can be described as the problem of generating the trajectory dataset with an unbalanced distribution of routes and number of journeys and has received little research attention. It is similar to the extensive classification problem for unbalanced dataset and related studies show that the dataset is unbalanced if each class does not contain approximately equal sample sizes [4], and the imbalance learning problem occurs when the samples are significantly unbalanced to their distribution among different classes [5]. Presently, the existing solutions adapted in imbalanced learning problems can be roughly divided into algorithm-level and data-level approaches [6]. Some studies have shown that the main advantage of the latter is that it is more intuitive, operational and generalizable [7].
To address the problem of generating high-quality synthetic trajectories corresponding to unbalanced trajectory datasets that often occur in large-scale complex road networks, ULF-TrajGAIL, a trajectory-generation framework that focuses on ultra-low-frequency trajectory generation, is designed, and it uses TrajGAIL [8], a trajectory-generation model based on generative adversarial imitation learning(GAIL), to generate similar trajectories in the form of link sequences. Meanwhile, it also designs a unique data-level method often applied to solve imbalance learning problems to help obtain high-quality synthetic trajectories and the involved expert trajectory data augmentation method uses the distribution of routes and the number of journeys as the guide. The main contributions and innovations of this study are as follows:
- The problem of generating the trajectory dataset with an imbalance learning problem in a large-scale complex road network scenario has received attention for the first time, and the ULF-TrajGAIL framework provides a fixed and integral process to solve the problem;
- A trajectory dataset imbalance degree measurement method, a trajectory group generation difficulty judgment method, and a data augmentation method oriented to the distribution of routes and corresponding number of journey for the high-quality trajectory-generation task are proposed;
- A more comprehensive synthetic trajectory quality measurement metric system involving route, link, and OD pairs from multiple perspectives is proposed to evaluate the quality of the synthetic trajectories. The ability to generate ultra-low-frequency routes is focused and the impact of each augmentation method on the correspondence between route and journey frequency is also analyzed.
The remainder of this paper is structured as follows. In Section 2, a literature review is presented to summarize the development of research related to trajectory generation and the use of data-level approaches for classification imbalance learning, respectively. Then, Section 3 will introduce the ULF-TrajGAIL and the framework will be validated with an example in Guangzhou in Section 4. Finally, Section 5 concludes the work and discusses future research directions.
2. Literature Review
2.1. Trajectory Generation
With the rapid development of location sensing and wireless communication technologies, GPS data are gradually and widely available, making GPS data-based traffic analysis gradually popular. In the initial trajectory data-driven route feature mining tasks, there are studies on modeling the route-selection behavior through commuters’ trajectory data directly using the Logit model [9]. There are also related studies on trajectory periodic [10], sequence [11] and other features mining based on historical trajectory data. However, these movement patterns uncovered from trajectories are often subject to predefined one-sidedness.
Most of the subsequent studies go further to accomplish the task of predicting the next position of trajectory or complete trajectory. Among related tasks, there are studies that use the Markov model and its variants to perform next position prediction of vehicles for single-user or multi-user aggregated trajectories [12]. There are also recurrent neural networks and its variants which are advantageous for modeling variable-length sequential distributions and take traffic states [13] or other contextual influences into account, such as the purpose of travel [14]. However, the trajectories generated by multiple iterations with tandem multiple predictions of the next location are not focused on the distribution of the complete decision of the whole trajectory, and thus cannot be used to make route decisions from a global perspective. In addition, some studies have used the percentage of drivers turning at consecutive intersections to predict full trajectories [15] or find the most popular route between two locations [16] with the same subjective limitation, thus making the research on trajectory-generation models focusing on learning the distribution of raw data gradually developed.
In studies focusing on the trajectory-generation task, the article [1] first envisions the possibility of generating trajectory data using generative adversarial networks (GAN) [17] with the TrajGAN framework. The article points out that the difficulty of trajectory generation lies in the grasp and measurement of the balanced relationship between utility preservation and privacy protection of mobility patterns in the synthesized trajectories, but do not provide a corresponding solution. Subsequent scholars have studied the trajectories in the form of location points sequence. The TrajGen model [18] obtained by combining GAN and Seq2Seq [19] generates the spatio-temporal synthetic trajectories of cab trajectories, and uses cosine similarity to measure the spatial distribution. The TrajVAE model [20] uses LSTM to model trajectories and variational autoencoder (VAE) to generate corresponding formal trajectories, and focuses on measuring the similarity of two individual trajectories. These trajectories in the form of location points are rich in semantic information and can help infer the related activities of travelers in the process of trajectory generation, but the discrete location points are not the focus of attention and do not reflect the macro link selection behavior at intersections, so there are also related studies with trajectories in the form of link sequences as the object. The TrajGAIL model [8] which is the focus of this paper, aims at generating trajectories in the form of link sequences similar to the distribution of the original trajectories. It gives attention to the geometric information of the road network and the user’s decision at each intersection. And the study validates the effectiveness of the model approach for generating trajectories on a regularized road network and trajectory dataset with Jensen–Shannon divergence of routes.
However, while the trajectory-generation models can accomplish the task of generating trajectories, none of them focus on the generation of imbalanced trajectory datasets that are widespread in this large-scale complex road network context, and therefore lack a process-oriented framework and specific method to solve such problems. And it is worth noting that the original data plays an important role in the task of generating high-quality data in autonomous driving scenarios based on imitation learning [21].
2.2. Data-Level Approaches
Data augmentation techniques mean that by adding small changes to existing data or creating new synthetic data from existing data. The data-level approach mentioned here often applied to solve imbalance learning problems is one of the data augmentation methods based on sampling techniques and it can be divided into three types: undersampling, oversampling and hybrid sampling.
Undersampling tries to balance the dataset by reducing the number of samples of the majority classes. In previous studies, there exist methods based on clustering methods to obtain the distribution characteristics of samples of majority categories and thus reconstruct the dataset [22], but the inherent balancing mechanism of such methods always exposes models to the risk of discarding the information-rich majority of samples [23].
Oversampling combats the difficult source of unbalanced data by increasing the sample size of minority classes to compensate for the lack of sufficient information in the original dataset, and a related study [24] has shown that when the dataset is severely unbalanced, oversampling methods outperform undersampling methods. Some oversampling methods are further subdivided to include simple replications for samples of the minority [25], which are the most tractable and generalizable, but may trigger overfitting of the model with predictive purpose by improper handling. There also exists the most widely used method for minority class sample synthesis based on interpolation techniques, typified by SMOTE [26], which is based on the core idea that neighboring point features on the feature space are similar. So such a method samples in the feature space instead of the data space and thus achieves the purpose of synthesizing the data. But the principle makes SMOTE seem to be problematic in the scenarios when the model needs to specify specific oversampled objects because it works in feature space, which means that the output of SMOTE is not synthetic data. In addition, more sophisticated minority sample generation methods based on the unfolding of probability distributions are included [27], but such methods require the availability of sufficient minority class samples to obtain the exact potential distribution of these minority class samples through learning.
Hybrid sampling is a combination of the two methods above, where the model is expected to ensure that enough features of the majority are learned while learning as many small sample-size categories as possible. The study has experimentally verified that the combination of random oversampling and undersampling can significantly improve the correct classification rate of decision trees for the minority [28].
Although research on the problem of classifying unbalanced datasets have been extensive and mature, it is worth noting that all of these methods require explicit boundaries for a few or most classes in the dataset and are not designed for the task of trajectory generation, so there is a strong need to continue exploring data-level processing methods that can significantly improve the diversity and similarity of synthetic trajectories.
3. Methodology
3.1. Definitions
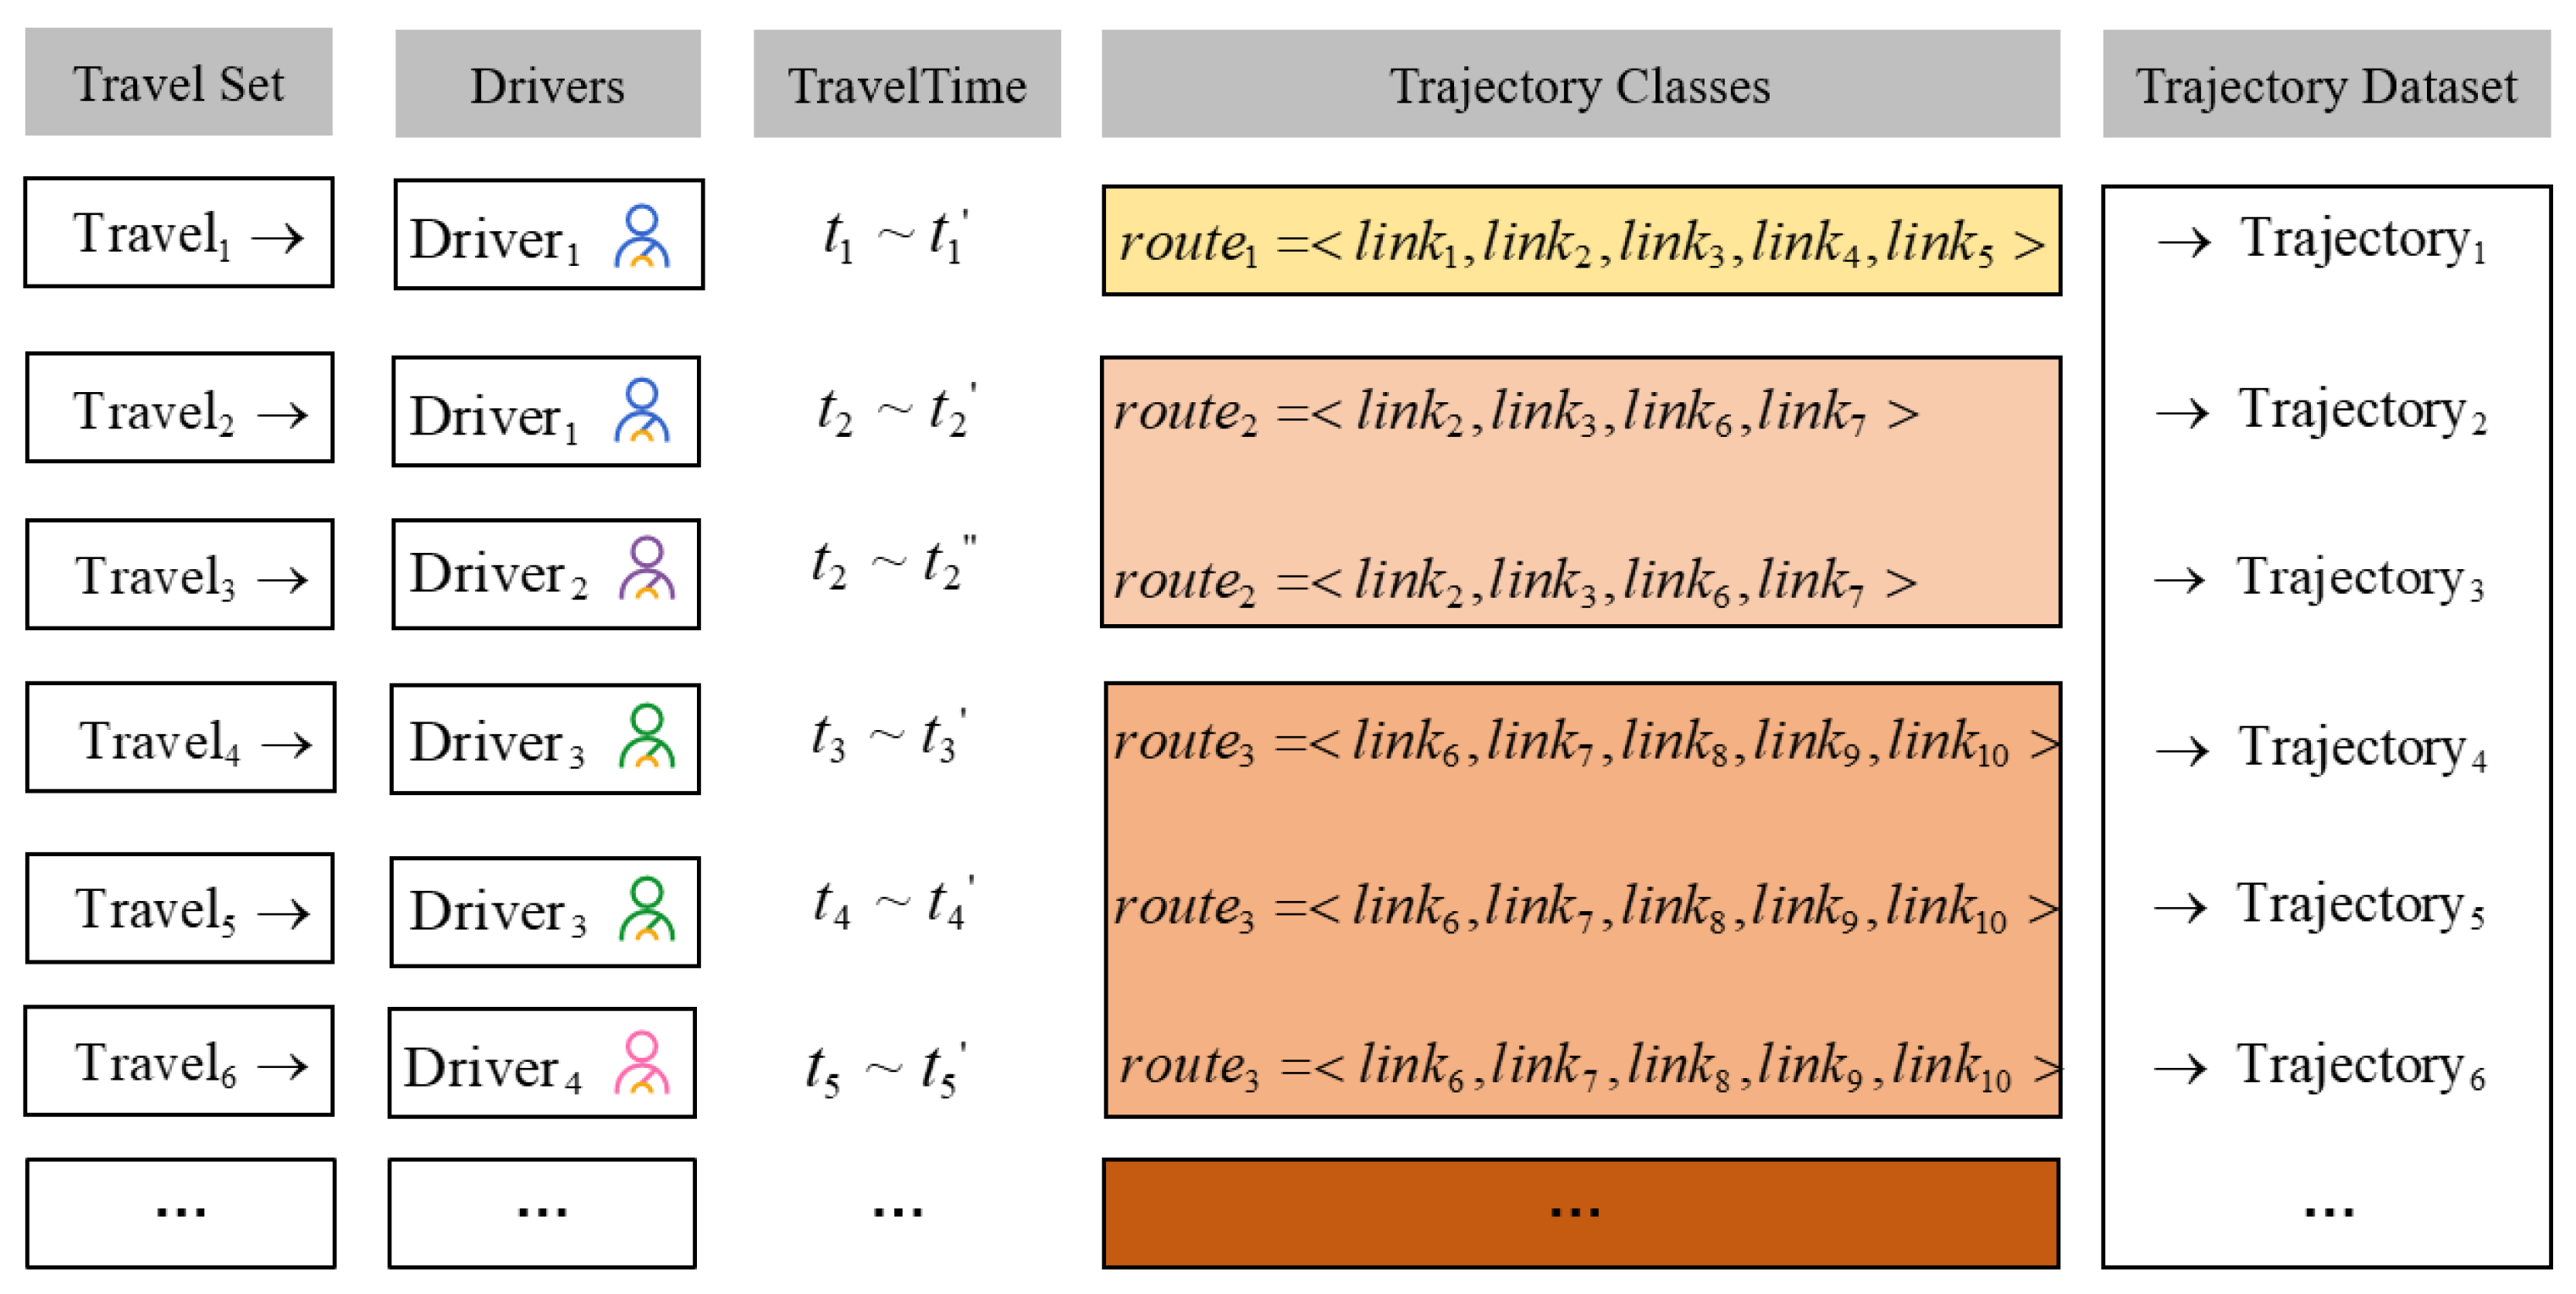
The trajectory dataset consists of thousands of trajectories and each trajectory can be viewed as a journey, so the whole dataset can be regarded as a distribution of the journeys corresponding to multiple routes. In a trajectory dataset where the trajectory is in the form of link sequence, each route is composed of links in a certain order, which is also called a trajectory category. Each trajectory contains time and spatial information of every journey, so it is common to have multiple trajectories using the same route, and the number of times each route adopted by drivers is called journey times or journey frequencies corresponding to the route. Therefore, Ultra-low-frequency journey route is the route that corresponds to relatively few journeys and is determined by the distribution of journeys, so the corresponding trajectories are the ultra-low-frequency trajectories. Figure 1 is the schematic of above definitions in the trajectory-generation scenario and is more likely to be the ultra-low-frequency journey route of this trajectory dataset.
From a macro perspective, the task of this study is to generate synthetic trajectories that approximate the summary statistics and analytical capabilities inherent to the original trajectory dataset, and it is also called the aggregated trajectory-generation task. However, such a task becomes tough in a large-scale complex road network scenario due to the imbalance learning problem triggered by ultra-low-frequency journey routes and the main manifestation is the diversity and similarity of synthetic trajectories are reduced, i.e., low-quality synthetic trajectories are generated eventually. In this way, the ultimate task is to accomplish the aggregated trajectory-generation task better in large-scale complex road network scenario with a targeted and effective framework and to generate high-quality synthetic trajectories with higher diversity and similarity.
3.2. ULF-TrajGAIL Framework
The proposed framework consists of a key confirmation step and two stages as described below.
In the confirmation step, the framework first calculates the values of the imbalance degree of each trajectory group and the whole trajectory dataset separately by applying an imbalance degree calculation method applicable to trajectory-generation scenarios. The results are used as a basis for measuring whether the original dataset has imbalance learning problem. Going through this step, it clarifies the pattern of imbalance degree of trajectory groups oriented by route journey frequency, and the strategy of augmenting the expert oriented by reducing the imbalance degree of trajectory dataset.
In the first stage, the framework determines the specific expert trajectory data augmentation method through a trajectory-generation pre-experiment which uses the original trajectory dataset as the reference expert trajectories and TrajGAIL model. During the process, the difficulty degree of the model learning and generating each trajectory group split by journey frequencies of related route, , is measured based on the preliminary synthetic trajectories . And then the specific journey frequency ranges of the ultra-low-frequency journey route of the original expert trajectory dataset , , is determined and it is the direct basis for determining the special augmentation method.
In the second stage, the TrajGAIL is adopted again, but use E, the trajectory dataset processed by the augmentation method, as the reference expert trajectories to obtain the final synthetic trajectories L with the same number of trajectories but including more routes. The overall process framework is shown in Figure 2.
3.2.1. Confirmation of the Imbalance Degree
The basic step is to confirm if there is a significant imbalance in the expert trajectory dataset. The imbalance ratio (IR) is the most commonly used class imbalance metric. It simply calculates the ratio of the sample size of the largest majority class to the smallest minority class. However, IR is not a valid imbalance degree metric when faced with a large number of trajectory classes because it does not take into account information about classes with sample sizes between the two extremes, and thus IR is considered a low-resolution metric for multi-class imbalance data [29].
Additionally, the distribution of routes and the number of journey is taken as the guide and the routes with the same journey frequencies are divided into a route group first. Then the original trajectories contained in the group fall into the trajectory group of this journey frequency k, which helps aptly explain the impact of unbalanced distribution of routes and corresponding journeys on the similarity of synthetic trajectories. The number of routes and the number of involved journeys are counted for . The closer the ratio of the proportion of in the total number of routes N and the proportion of in the total number of journeys W is, the lower the imbalance degree of is. The distance between the ratio of the two proportions and 1 is used as an indicator to measure the degree of imbalance of and is defined as , as in Equation (1):
The impact of different frequency trajectories on the overall imbalance degree of the trajectory dataset is described from the level of journey frequency characteristics differently. At the same time, it can be seen from Equation (1) that each within a trajectory dataset is fixed and only related to k. Specifically, the higher , the harder the routes involved in are learned fully by the generative model. But the larger the k is, the greater the chance that the routes involved in the corresponding are learned and generated, and the occurrence of the latter will aggravate the former situation, making it difficult to generate trajectory groups with lower journey frequencies. Thus, the metric gives the reason the lower-frequency trajectories need more attention and targeted processing and why the ultra-low-frequency journey routes often found in large-scale complex road network scenario trigger imbalance problems within the trajectory group perspective. It is the ultra-low-frequency journey routes that are the key factors affecting the imbalance degree of a trajectory dataset. Although the routes of this kind are not the drivers’ preferred ones, they contain numerous journey features that cannot be ignored and are important contributors to reflect the diversity of trajectory dataset.
Furthermore, all are summed and defined as , the measure of the imbalance degree of the whole trajectory dataset consisting of different trajectory group, as in Equation (2):
However, it should be noticed that the ultimate goal is not reducing the imbalance degree of trajectory dataset, but the multidimensional quality of synthetic trajectory dataset in the study. Attention needs to be paid to the quality metrics, and the fact is the reduction of is accompanied by a perturbation in the correspondence between the trajectory dataset involving routes and journey frequency. As an important step in the generation, the whole imbalance degree can be seen as an indicator to adjust the reference trajectories for the trajectory-generation task, which means adjusting the correspondence between routes and journey times in the direction of decreasing imbalance degree to reach an appropriate distribution.
3.2.2. Theory and Application of TrajGAIL
As shown in Figure 2, the TrajGAIL model will be used twice in the ULF-TrajGAIL framework described above. Therefore, it is necessary to introduce the idea of the model to generate trajectories and the process of applying it.
TrajGAIL consists of a route-selection behavior model and a generative adversarial imitation learning model. The route-selection behavior is first modeled using a Partially Observable Markov Decision Process (POMDP), and the sequential pattern features contained in each trajectory are mapped into “belief state”, , which changes along with the link sequence expansion. Now, the problem of learning the route-selection behavior is thus transformed into the problem of learning the probability distribution of .
where is the ith observation which refers to the ith link in the trajectory.
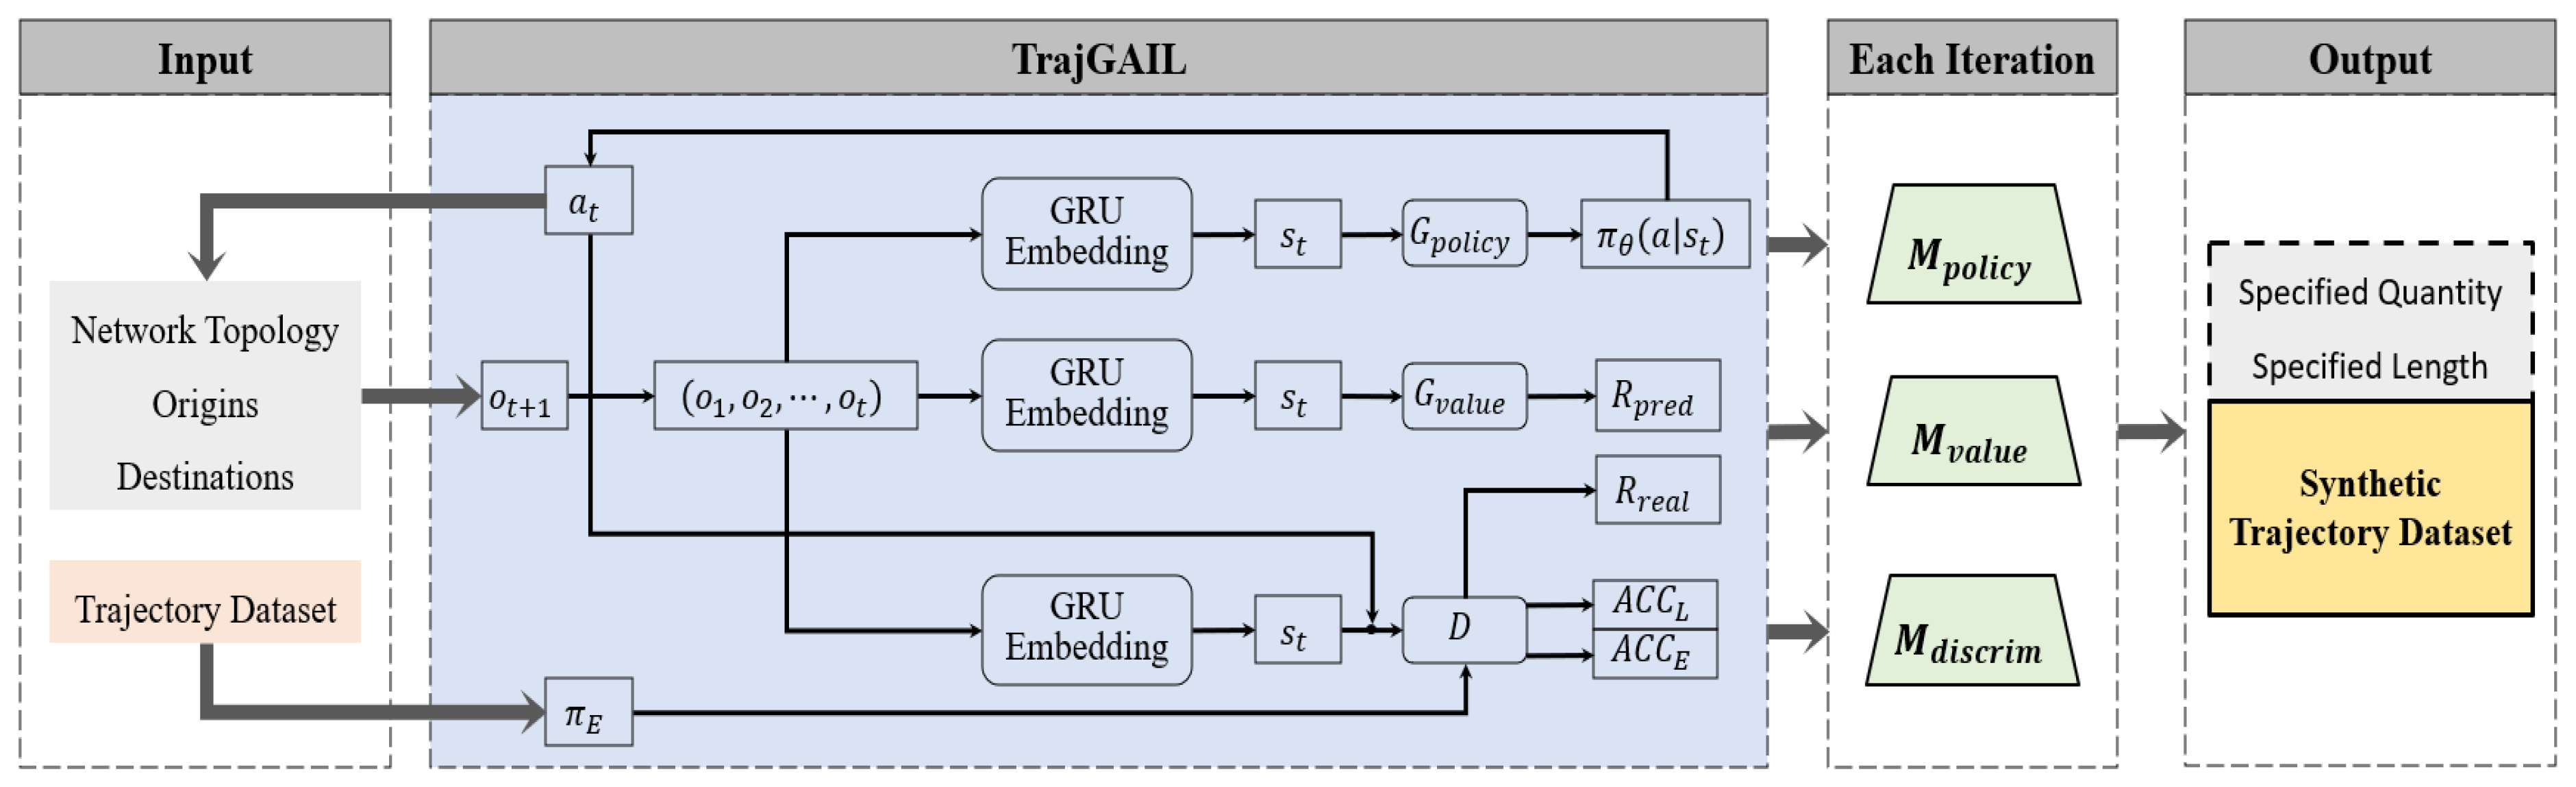
In the generative adversarial imitation learning part, multiple have been embedded by the GRU and defined as “expert behaviors”. Inverse reinforcement learning (IRL) tries to find the reward mechanism r to describe the , the expert policies which guide the turning behavior at intersections for each link. Reinforcement learning (RL) seeks the , learner’s policies, to maximize the expected cumulative reward based on r. The relationship between these two learning processes is consistent with the idea of GAN, where the RL can be described as a generator, G, based on r and the IRL is a discriminator, D, to distinguish between and . In the solving process, the problem of solving G and D can be transformed into seeking the respective approximation functions. There are a “Policy Generator” and a “Value Estimator” in G in the form of deep neural network. needs to complete the task of sampling the next turning behavior based on the current link and the task of finding the corresponding next link during the continuous expansion of link sequences. has the task of estimating the reward value for performing the current sampled action with the objective of minimizing the gap between the estimated reward value and the true computed reward value . At the end of each trajectory-generation process, D calculates the correct probability , the accuracy of input trajectory as the expert, and which is the accuracy of input trajectory as the learner by taking the optimization objective of minimizing binary cross-entropy.
In the concrete generation process, the first step is to construct the topology of the road network in the study area. The topology lookup contains the next link selection behaviors which are available and specifically refer to “turning left, straight, or right” to drivers at each intersection based on every link. In addition, it is necessary to clarify all the links entering and leaving the study area through the road network, because they are the signals indicating the model to start and stop generating trajectories. Then, for the trajectory in the form of link sequence, the study needs to complete the mutual verification with the road network topology and eliminate the wrong data that does not match with the turning rules. Both the road network topology and trajectories need to be input into the model. During multiple iterations, the network parameters are updated and saved after each iteration by updating each corresponding to the , , and D. Finally, the network parameter models , , under the corresponding iterations can be loaded, and the synthetic trajectories of any quantity and length range are output. The specific model application flow is shown in Figure 3.
3.2.3. Difficulty Degree and Augmentation Method
Based on the preliminary synthetic trajectory obtained from the pre-experiment of trajectory generation, the route that exists in the original trajectory dataset but does not appear in the synthetic dataset is called unlearned route and corresponding journeys are called unlearned trajectories. The number of unlearned routes and trajectories are counted and the product of the ratio of to N and the ratio of , the unlearned routes, to the number of is defined as the learning difficulty of each . is defined as follows:
is the proportion of the number of unlearned routes with the journey frequency k in the total number of routes involved in the original trajectory dataset. The larger the metric is, the more the number of unlearned routes in each is, and the more difficult it is to learn and generate the involved trajectories. As mentioned before, there is a fact that the trajectory group with lower journey frequencies is harder to be generated, so it is only necessary to determine the upper limit of journey frequencies corresponding to the ultra-low-frequency routes of this dataset, and then the complete range of journey frequencies of the ultra-low-frequency routes can be obtained. When there is a significant decrease between and of two contiguous and , then the journey frequency k is defined as the upper limit of the journey frequency corresponding to the ultra-low-frequency routes.
The obtained through the trajectory generation pre-experiments provides a reliable basis for augmenting the unbalanced expert trajectories. Therefore, the proposed augmentation method based on is also accurate and reasonable for the ultra-low-frequency trajectories specifically defined based on the distribution of routes and corresponding journeys. This augmentation method is called the combined expansion method and it refers that the number of journeys corresponding to all routes involved in the ultra-low-frequency trajectory are expanded to the minimum journey frequency corresponding to the non-ultra-low-frequency trajectory at first, and then the number of journeys corresponding to all routes involved in all trajectories are multiplied by two.
There are mainly two reasons for calling and designing this augmentation method this way. First, since each trajectory fed into the model becomes a reference for the model, this method is an oversampling method for the minority categories. Second, it is called a combined expansion method for two points of view. From the targeting perspective, it can combine the results of pre-experiments to expand the journey times of ultra-low-frequency routes learned with more difficulties purposefully and efficiently, and help improve the diversity of synthetic trajectories by adjusting the overall imbalance degree in the trajectory dataset. From the perspective of non-discriminatory treatment of journey frequency expansion, the more the number of reference expert trajectories corresponds to, the more time it takes to train the model usually. Therefore, after the targeted expansion of some difficult trajectories, the number of journeys of all routes is expanded without difference in learning probability on the premise of minimizing the size of reference expert trajectories. In this way, such an expansion can protect the correspondence between routes and journey frequencies to a certain extent without changing the imbalance degree of the original trajectory dataset again, and improve the diversity of synthetic trajectories by increasing the number of trajectories of references of experts once again.
4. Experiments
4.1. Description and Augmentation of the Original Trajectory Dataset
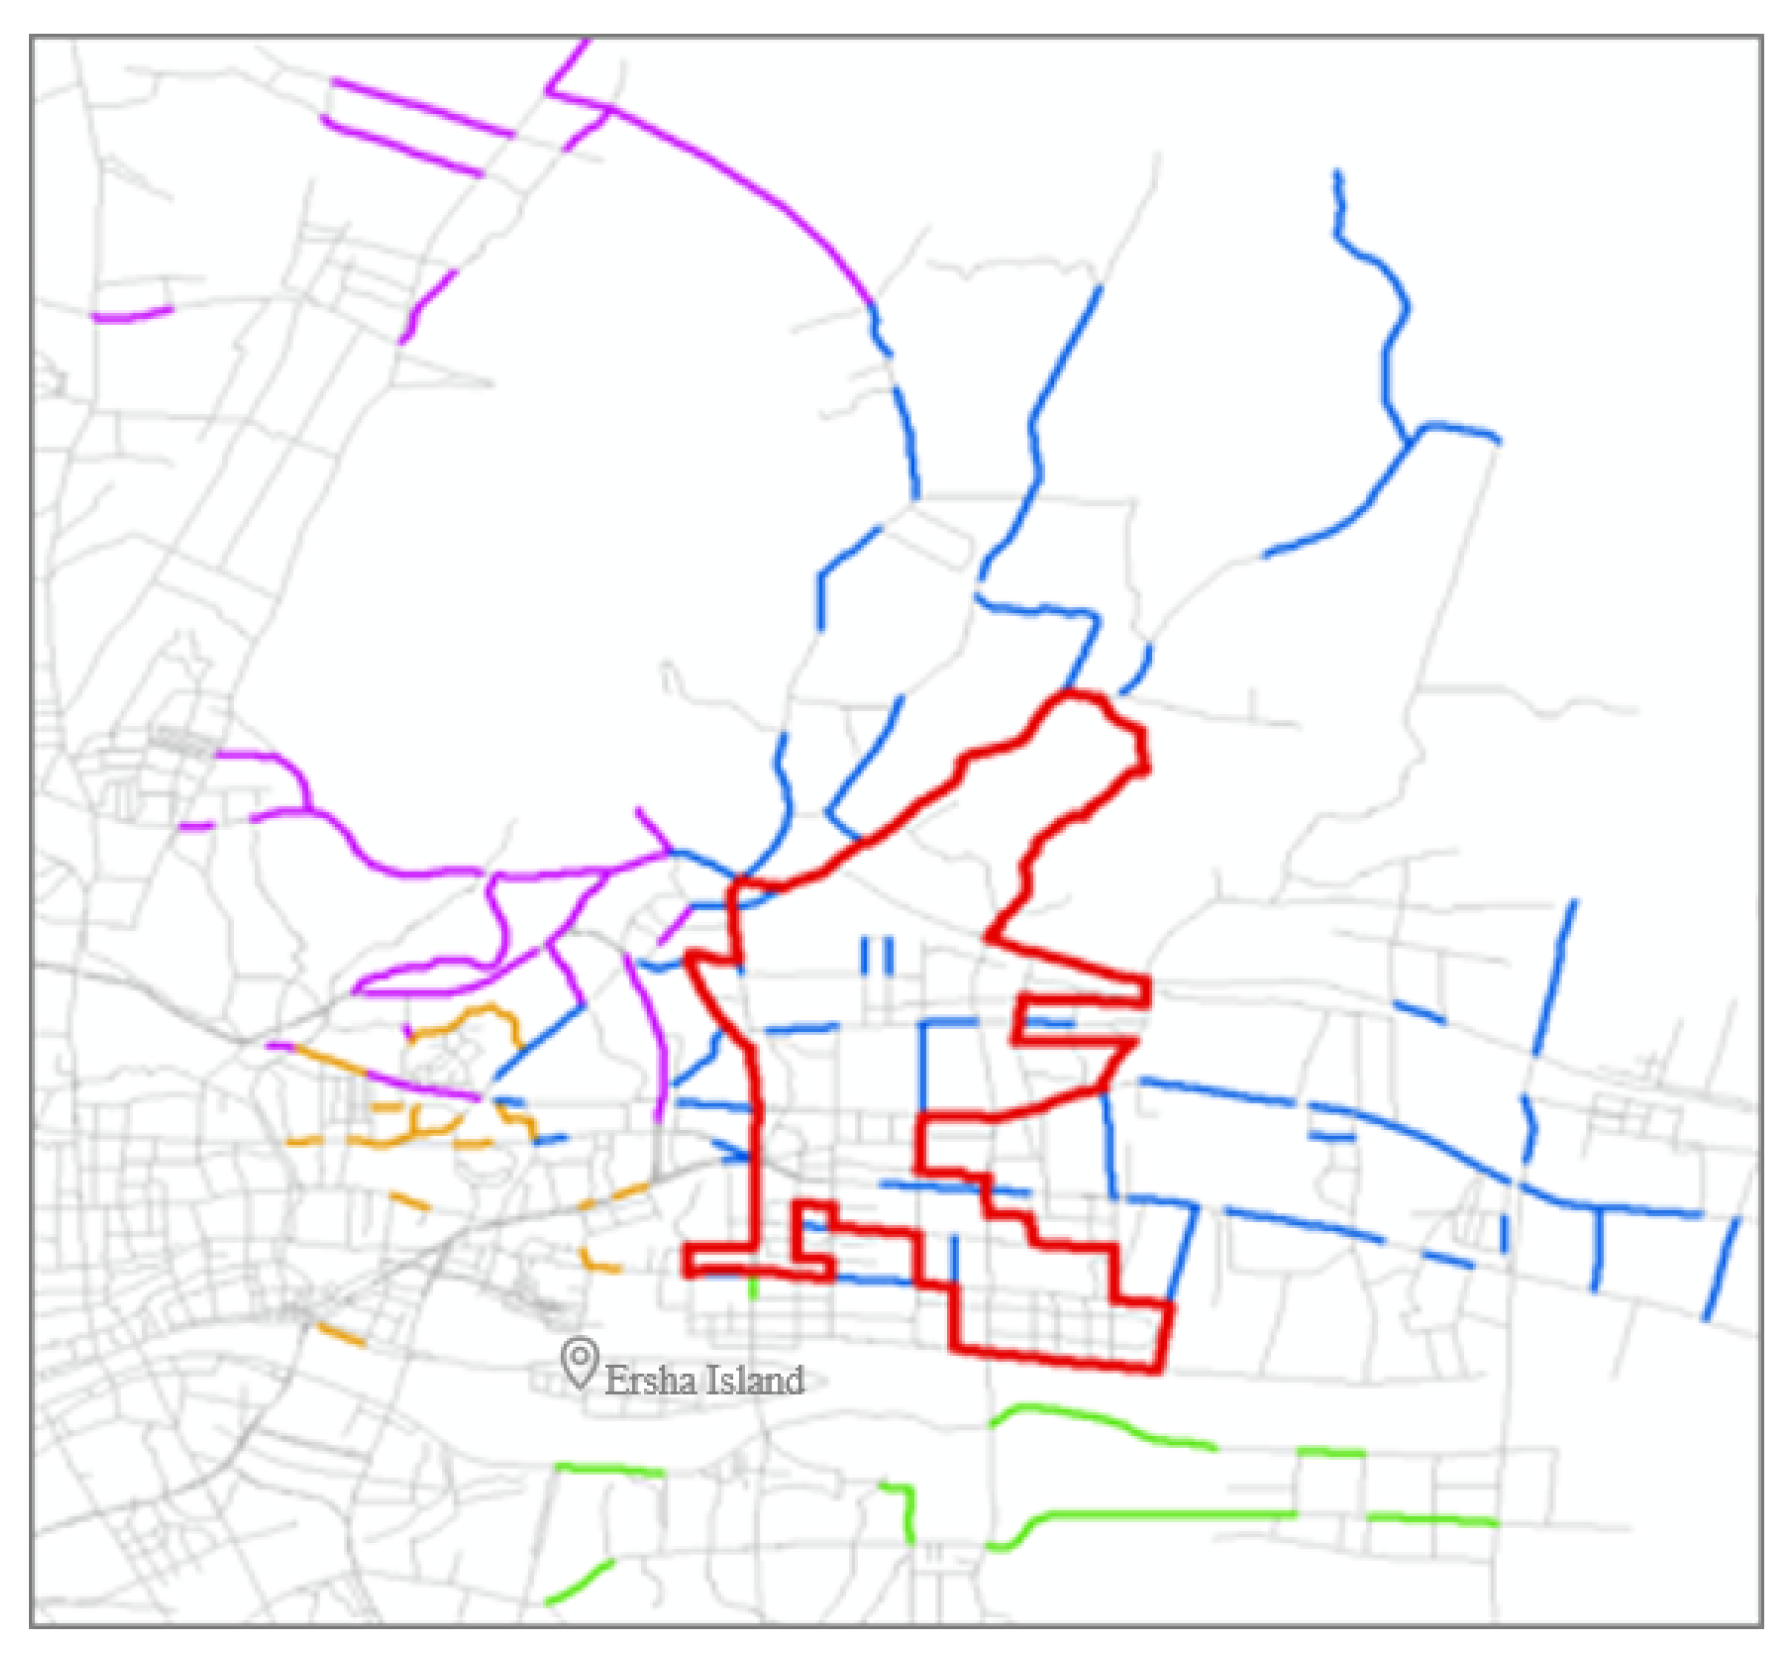
The distribution of floating vehicle trajectories in Guangzhou is relatively extensive, and to ensure that there are sufficient and aggregated expert trajectories, the high-frequency links taken as OD pairs of all trajectories within the trajectory distribution area are used as the basis for the selection of the final study area. Then the area in and around Guangzhou Tianhe CBD is finally delineated based on the frequency of links involved in the trajectory, as shown in Figure 4.
The study area contains 171 intersections, including 74 three-way intersections and 56 four-way intersections, involving 1273 turning relationships, with variable road directions, and the formed road network is in line with the category of large-scale complex road network. The trajectories of the five working days from 24 to 28 February 2014 in this study area are constructed as link sequence trajectories. The single link trajectories and circular trajectories included in them are excluded. Finally, 503 routes with path lengths of 4–9, i.e., the number of links contained in each route, totaling 10,499 journeys, are used as the original expert trajectory dataset for the cumulative five days, covering 483 links which are taken a total of 63,390 times.
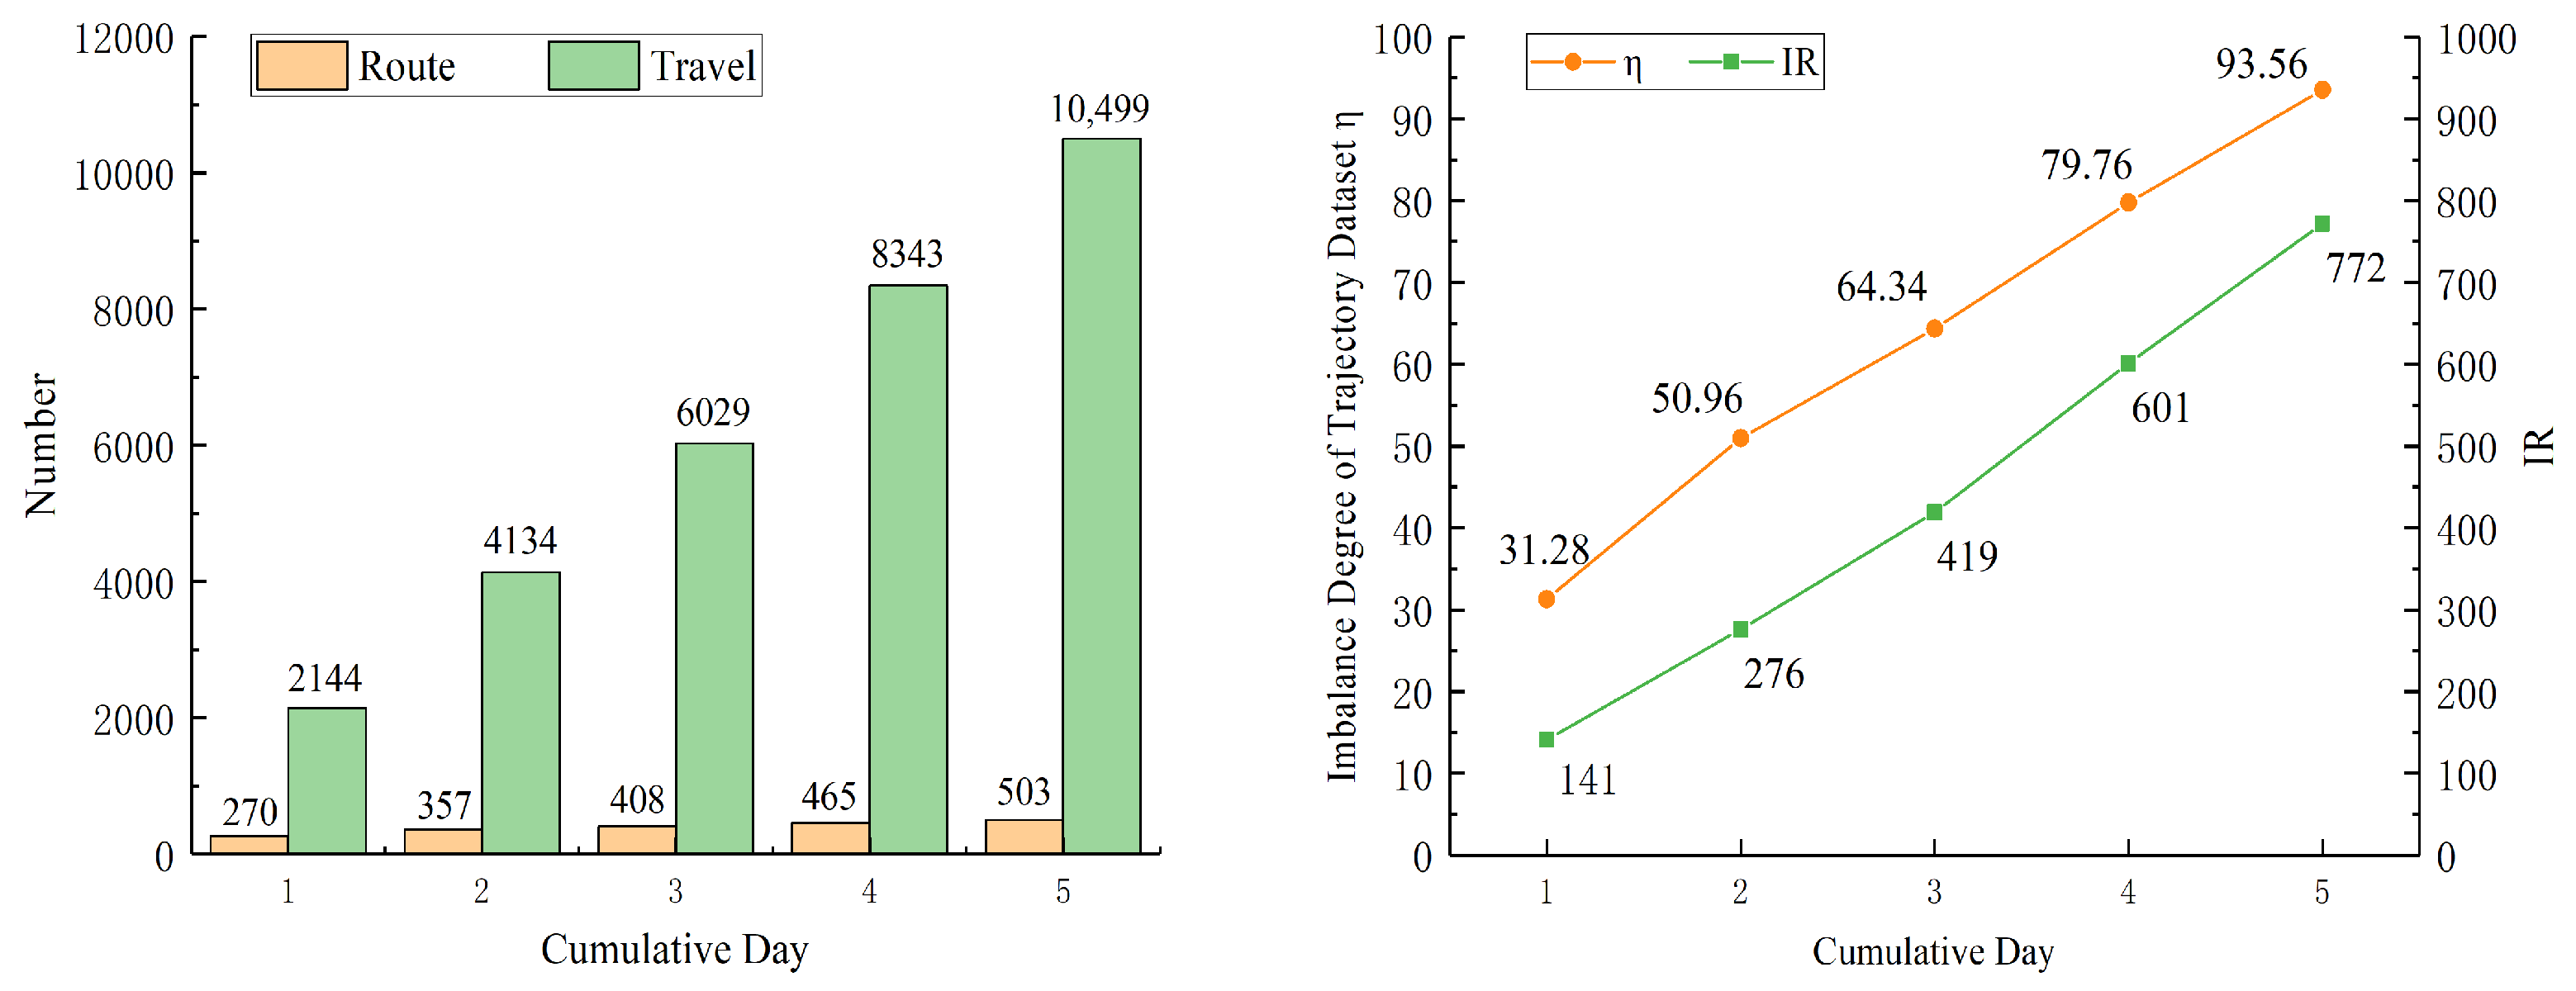
The total number of routes and journeys in the trajectory dataset corresponding to different cumulative days are counted separately, as shown in the statistical graph on the left of Figure 5. As the cumulative number of days increases, the total number of journeys increases more compared to the change in the number of routes, which indicates that there is an overlap of routes corresponding to the trajectories in the region, which in turn indicates that the original reference trajectory dataset is available to learn the characteristics of route-selection behavior.
According to the proposed model, the imbalance status of this original trajectory dataset is calculated in the confirmation step. Therefore, the imbalance degree and IRs for different cumulative days in the corresponding original reference trajectory datasets are calculated, as on the right of Figure 5. In the context of calling a route in a trajectory dataset as a trajectory category, IR is the ratio of the corresponding maximum journey times to the minimum journey times in all trajectory categories. It can be seen that both and IR show an obvious increasing trend but different values with the accumulation of days. On the one hand, it indicates that can reliably reflect the imbalance degree in the trajectory dataset while considering the distribution characteristics of the remaining journey frequency trajectories. On the other hand, it reveals that the imbalance presented by these trajectory dataset in this scenario is prevalent, and the imbalance degree does not ease with the increase of the number of journeys, but gradually increases.
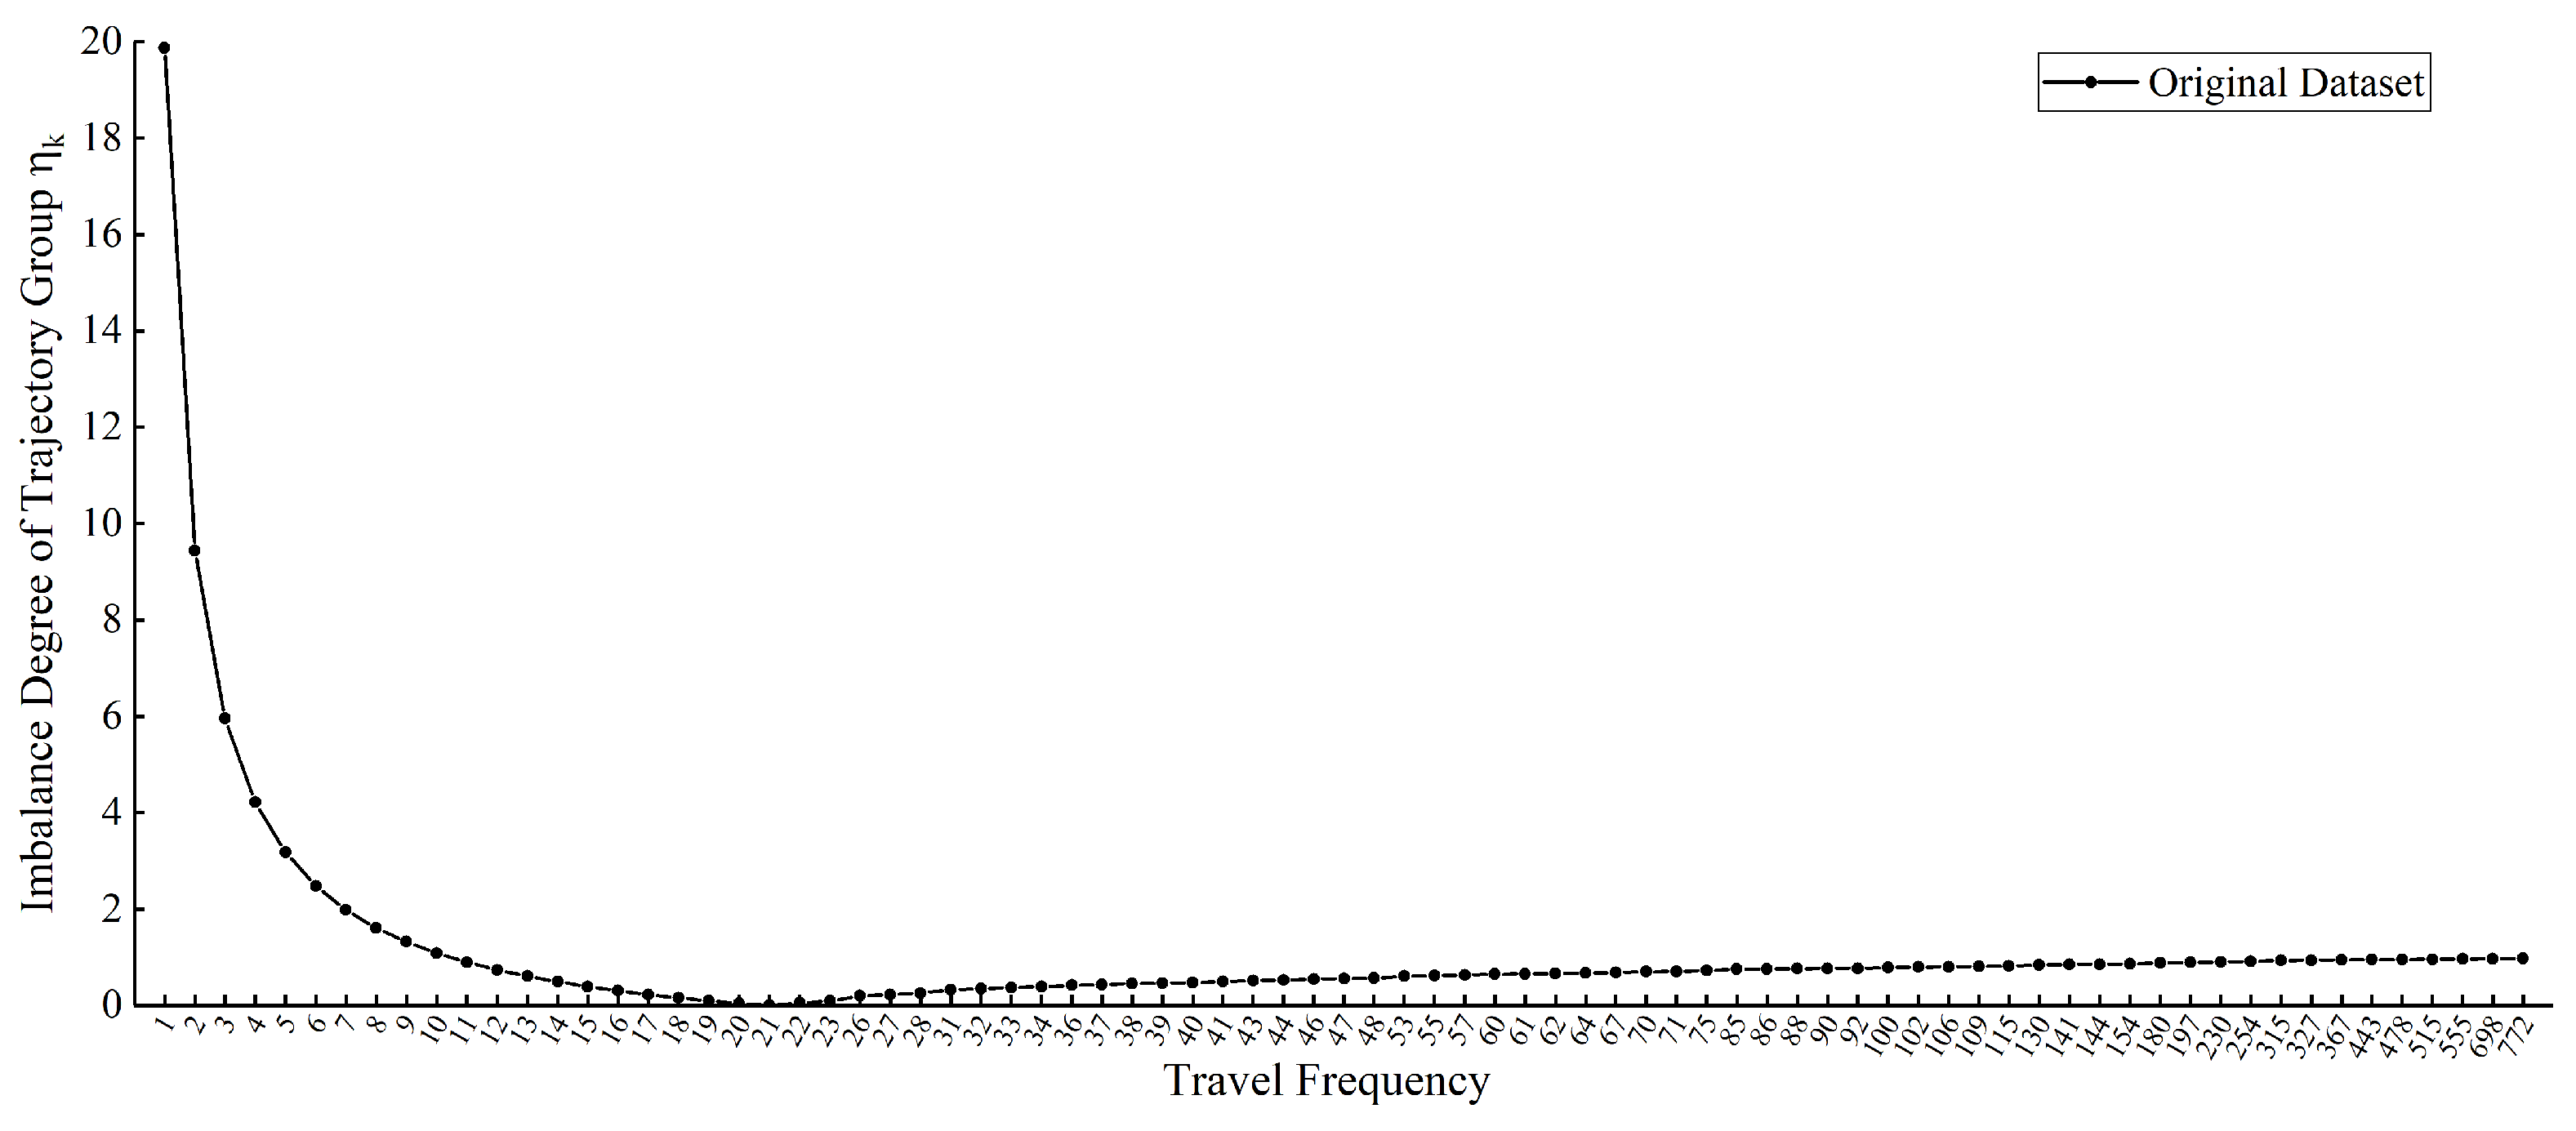
In addition, the imbalance degree for each journey frequency trajectory group of the final selected original reference trajectory dataset, , is calculated. Figure 6 shows that the lower-frequency trajectory groups have more influence on the overall imbalance of the whole dataset, while the higher-frequency trajectory groups contribute less because the involved routes with more traveling are easier to learn due to the high. And means it is that is the optimal sample number of each trajectory category when the trajectory dataset is balanced. However, the trajectory groups with involve 85.09% of the total number of routes, while these trajectory groups contain only 15.57% of the total number of journeys. It indicates that the overall imbalance of the original reference learning trajectory is obvious, which greatly increases the number of routes that are difficult to learn adequately for the generative model, and thus it is necessary to fall into the subsequent stages of measurement and augmentation.
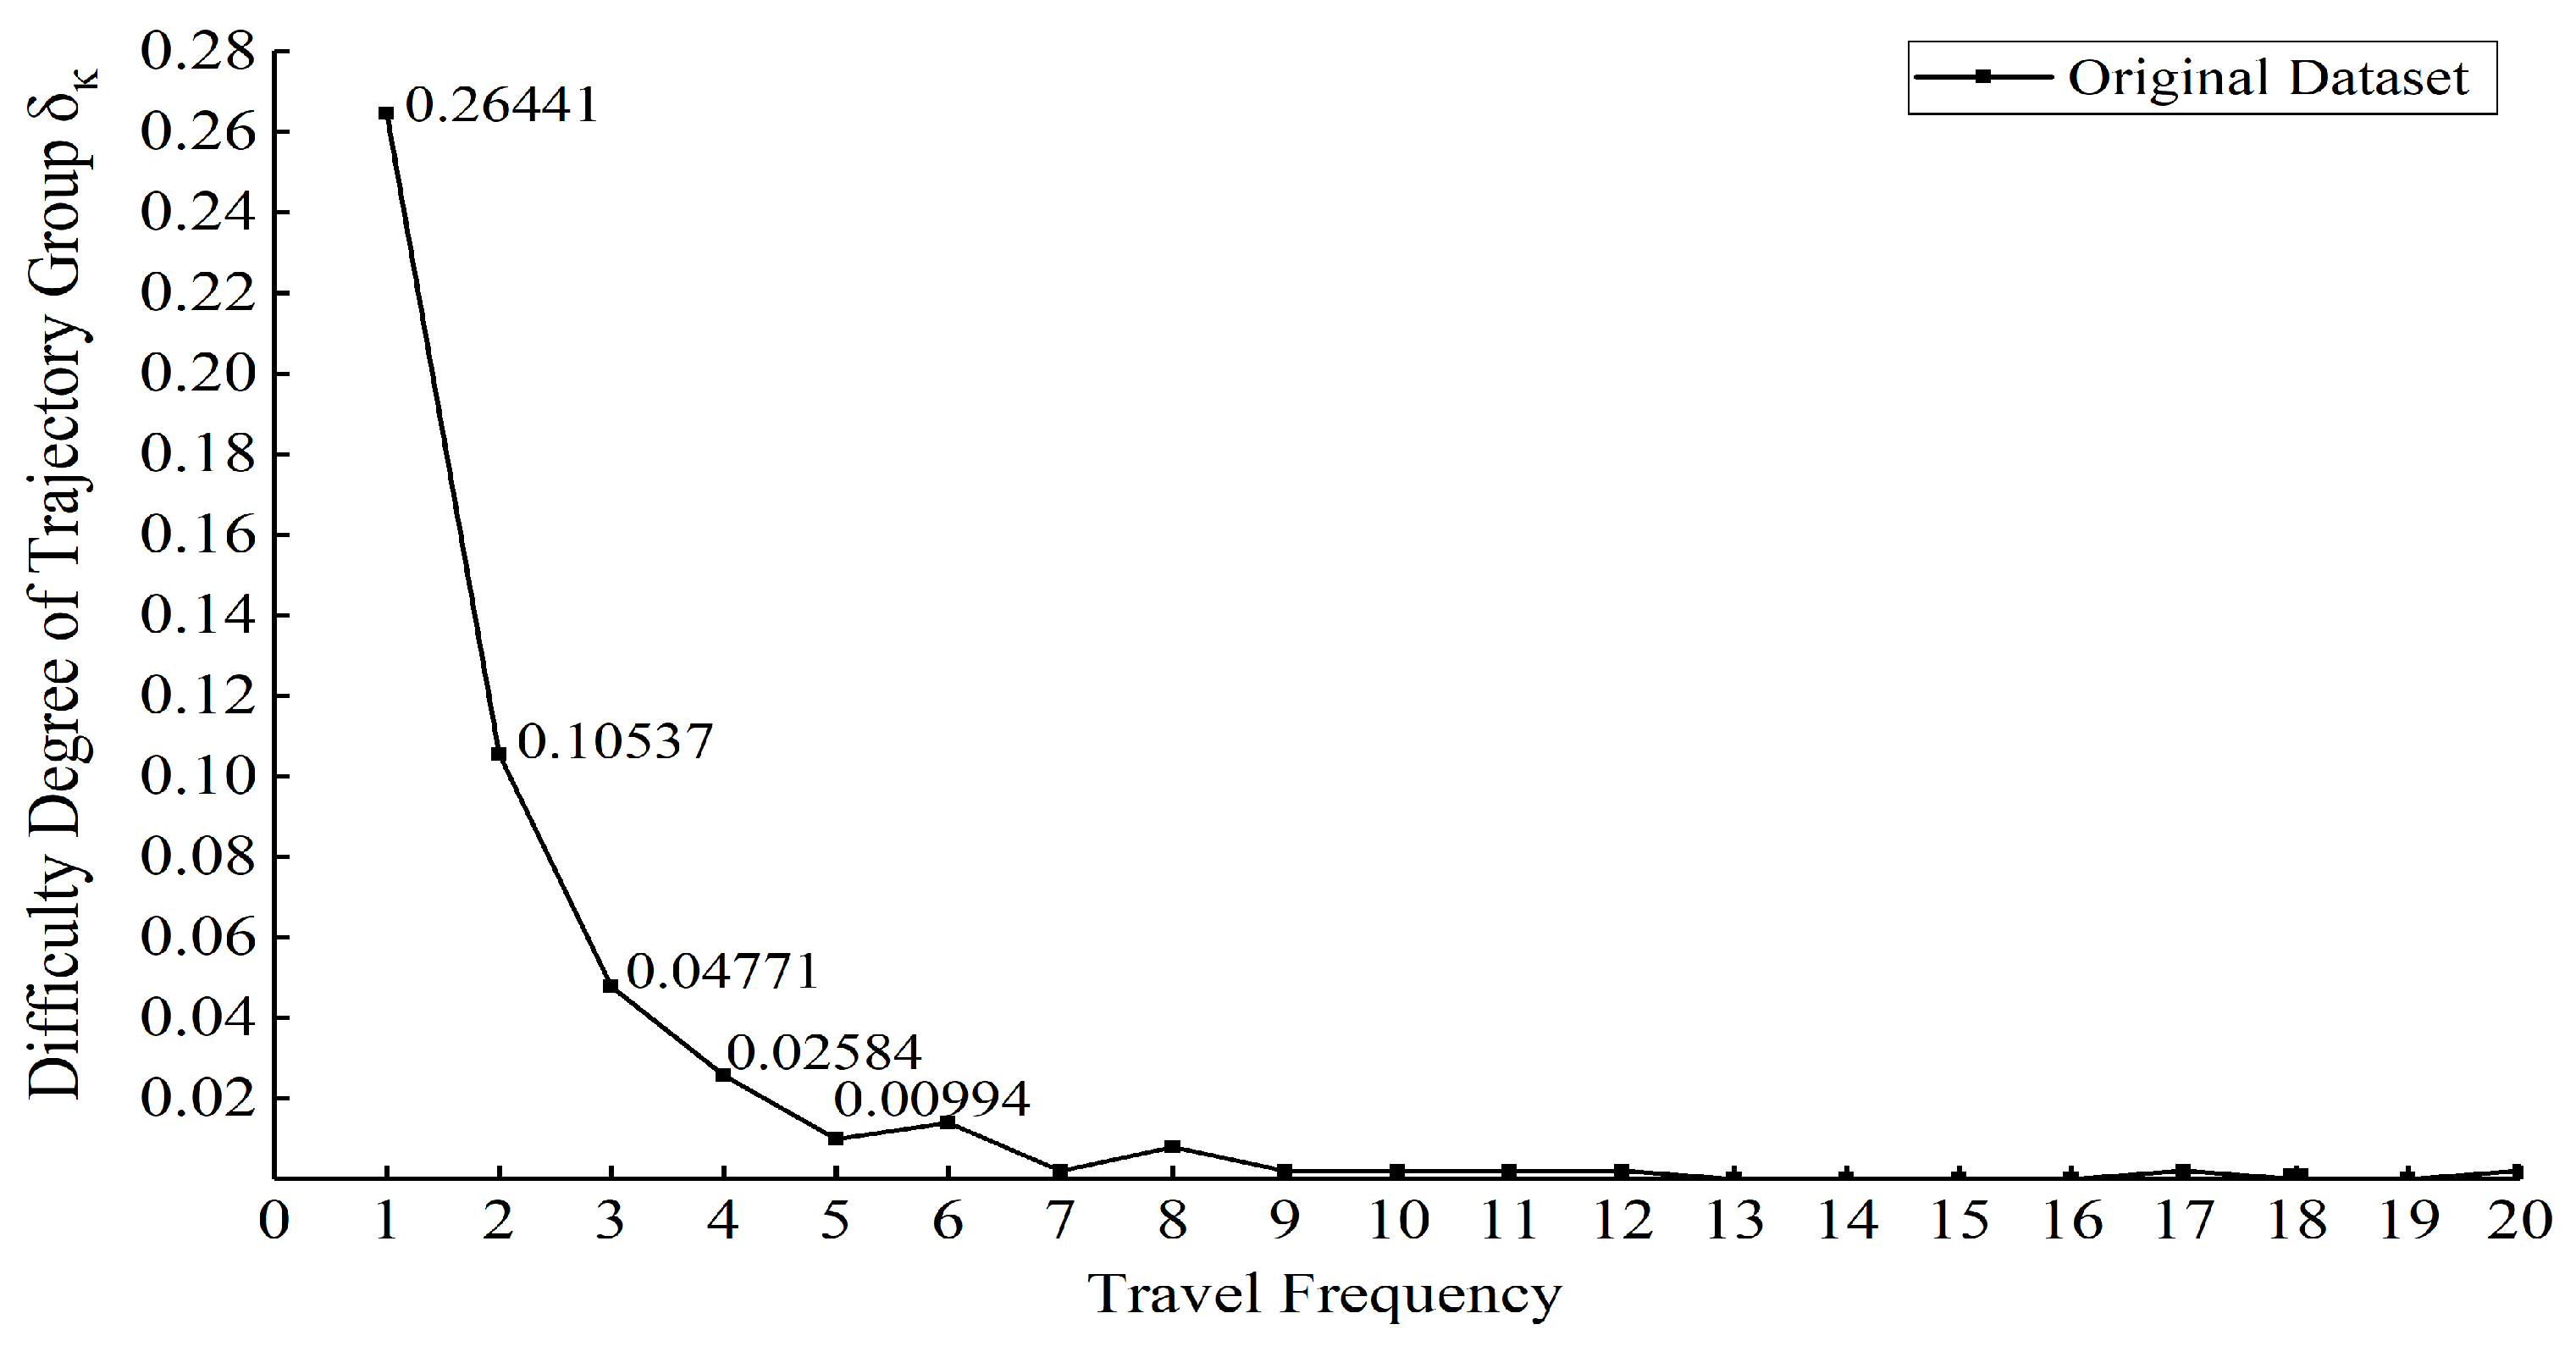
Based on the pre-experiment of trajectory generation, the difficulty of model learning and generating routes involved in each trajectory group are calculated, in which the routes with journey times greater than 21 are learned stably, so Figure 7 shows the final calculated results of . First, shows a significant decreasing trend with k, thus is the maximum of all , which is about 2.5 times as large as and 5.5 times as large as . Moreover, when k changes from 1 to 2, the difficulty of the model to learn the trajectory group decreases significantly compared to . It involves 33.40% of the original total routes, while the unlearned routes accounted for 79.17% of all . Therefore, the route corresponding to the journey frequency of 1 is defined as the ultra-low-frequency route of this original trajectory dataset. When , has stabilized to zero, so the routes corresponding to the journey frequency at are defined as the low-frequency routes, and all journeys using the low-frequency routes are called low-frequency journey trajectories.
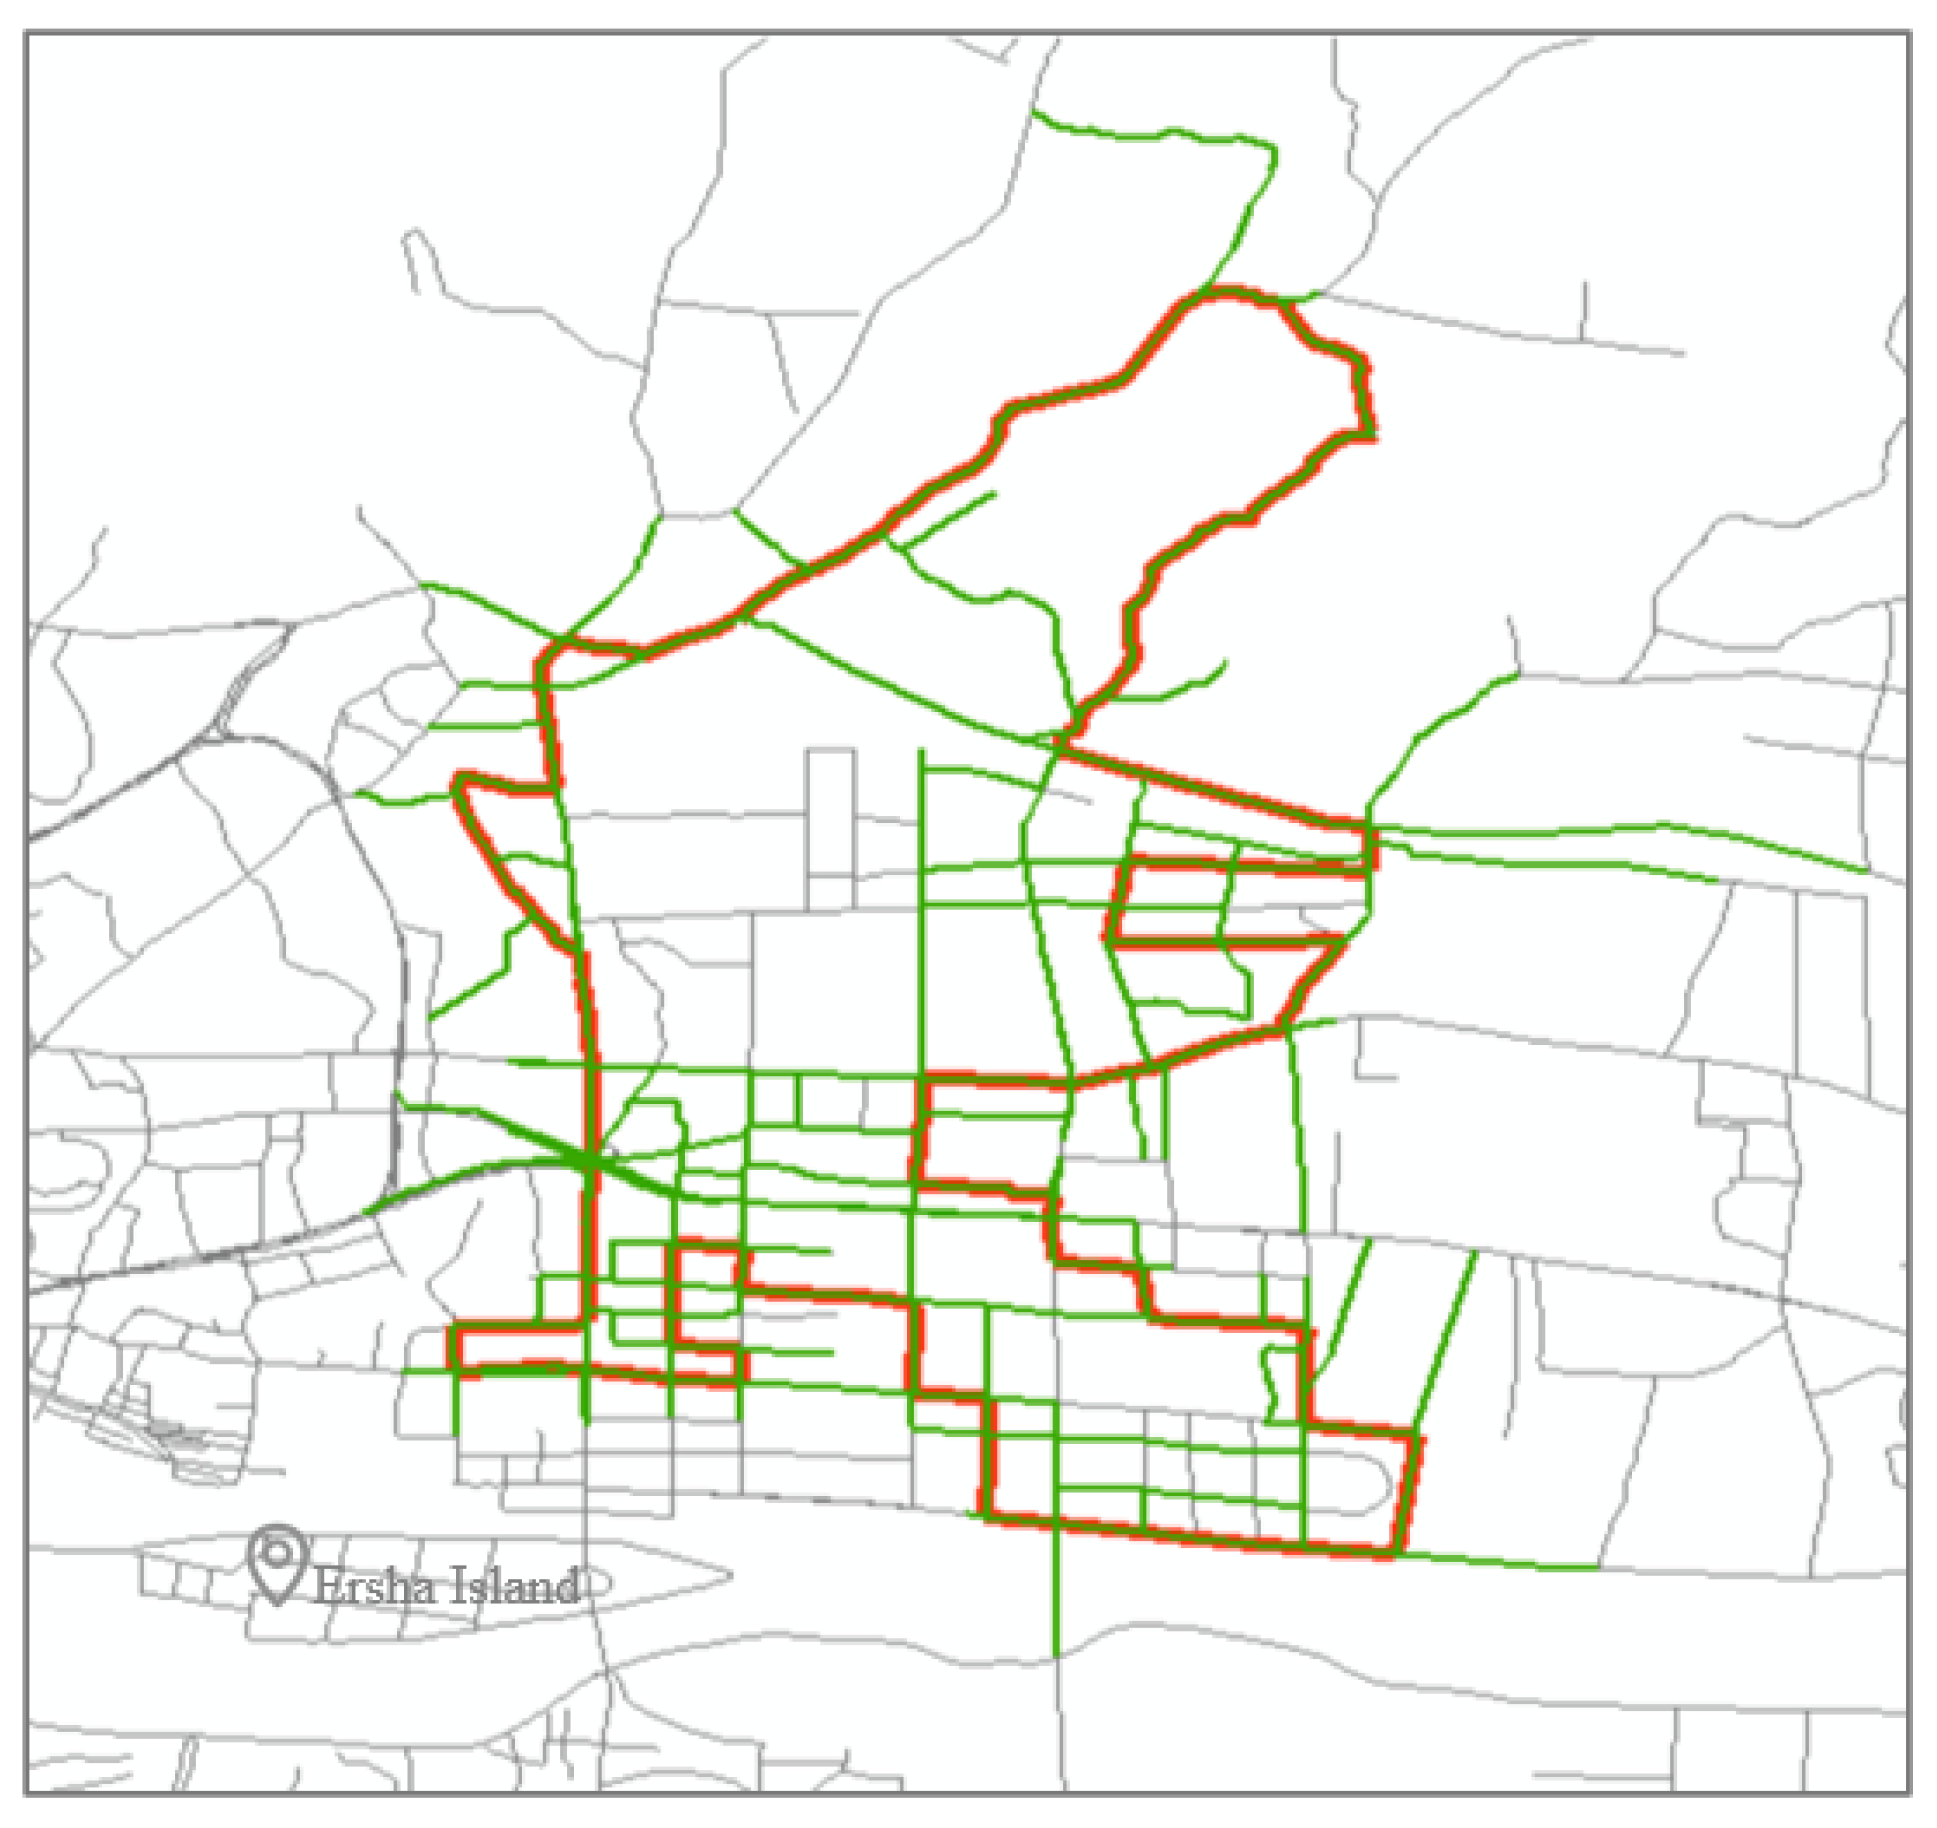
The links covered by ultra-low-frequency journey trajectories are shown in Figure 8, and it can be found that the links are widely distributed and contain the links taken by trajectories of other journey frequency. It indicates that the ultra-low-frequency trajectories in the original expert dataset of the case are stable, extensive and reasonably present in daily journeys, containing a larger proportion of journey features in the study area. Therefore, it is necessary to learn and generate such specific trajectories which are the most difficult ones to be learned.
At this time, the specific augmentation method designed for this original expert trajectory dataset is to first expand the journey times corresponding to all routes with frequency of 1 to 2, and then the journey frequencies corresponding to all routes involved in the original trajectories are multiplied by two.
4.2. Experiments and Evaluations
4.2.1. Descriptions of Experiments
A total of ten trajectory-generation experiments are performed and all experiments are specified to generate the same number of trajectory as the original trajectory dataset.
First, to verify the effectiveness of the above-mentioned expert trajectory-augmentation method in improving the diversity and protecting the similarity of synthetic trajectories, without any processing is used as the expert and the result of this experiment is used as the benchmark for comparing the quality of synthetic trajectories. Then the different augmented trajectories, E, are used as the expert for the other trajectory-generation experiment.
Second, in order to verify the rationality of this oversampling method, will also be undersampled, which reduces the journey frequency k of the routes which are taken more than 100 times to 100. And the hybrid sampling method increases k of the ultra-low-frequency route from 1 to 2 while reducing the k of the highest frequency path from 772 to 700. But both experiments will be conducted, respectively, when the imbalance degree of each trajectory dataset processed under corresponding methods is approximately equal to the one under our specific augmentation method.
Moreover, to verify the superiority of the method, relevant experiments are also conducted with the expert trajectories processed by different targeted expansion methods which aim at ultra-low-frequency journey routes and low-frequency journey routes, respectively. These processing methods of remaining experiments include only expanding the journey frequency k of routes from 1 to 2, only expanding to , only expanding to , and only expanding to . And the experiment only using the undifferentiated method to process is conducted as well, which expands the journey frequency of all routes to twice and takes the processed dataset as the L. The tenth experiment using the extra combined expansion method is conducted and the corresponding method increases to while expanding the journey frequency corresponding to all routes involved in by twice as a whole.
Since the undifferentiated expansion method does not change the correspondence between routes and the number of journeys, the under Experiment 1 and 8 are same and under Experiment 4 and 9 are the same as well. But of E under all targeted expansion methods decreases continuously as the minimum journey frequency increases. Related information is shown in Table 1.
The training technique which makes the generator update six times and the discriminator update twice in each iteration is set because the discriminator usually learns faster than the generator. And the optimal hyperparameters involved in the neuron network is same as TrajGAIL [8]. The study sets the number of iterations for each experiment to 3000, and saves the neuron network parameter models per hundred iterations. To ensure the stability of the quality of the trajectories generated by each parametric model, three synthetic trajectory datasets are generated for each model, and the optimal synthetic trajectory dataset is determined by comparing the number of “learned routes” in each synthetic trajectory dataset, and then measuring the quality of synthetic trajectories. The “learned route” refers to the routes which are contained in the original trajectory and appears in the synthetic trajectory, and the corresponding part of the trajectory is called “learned trajectory”.
4.2.2. Evaluations
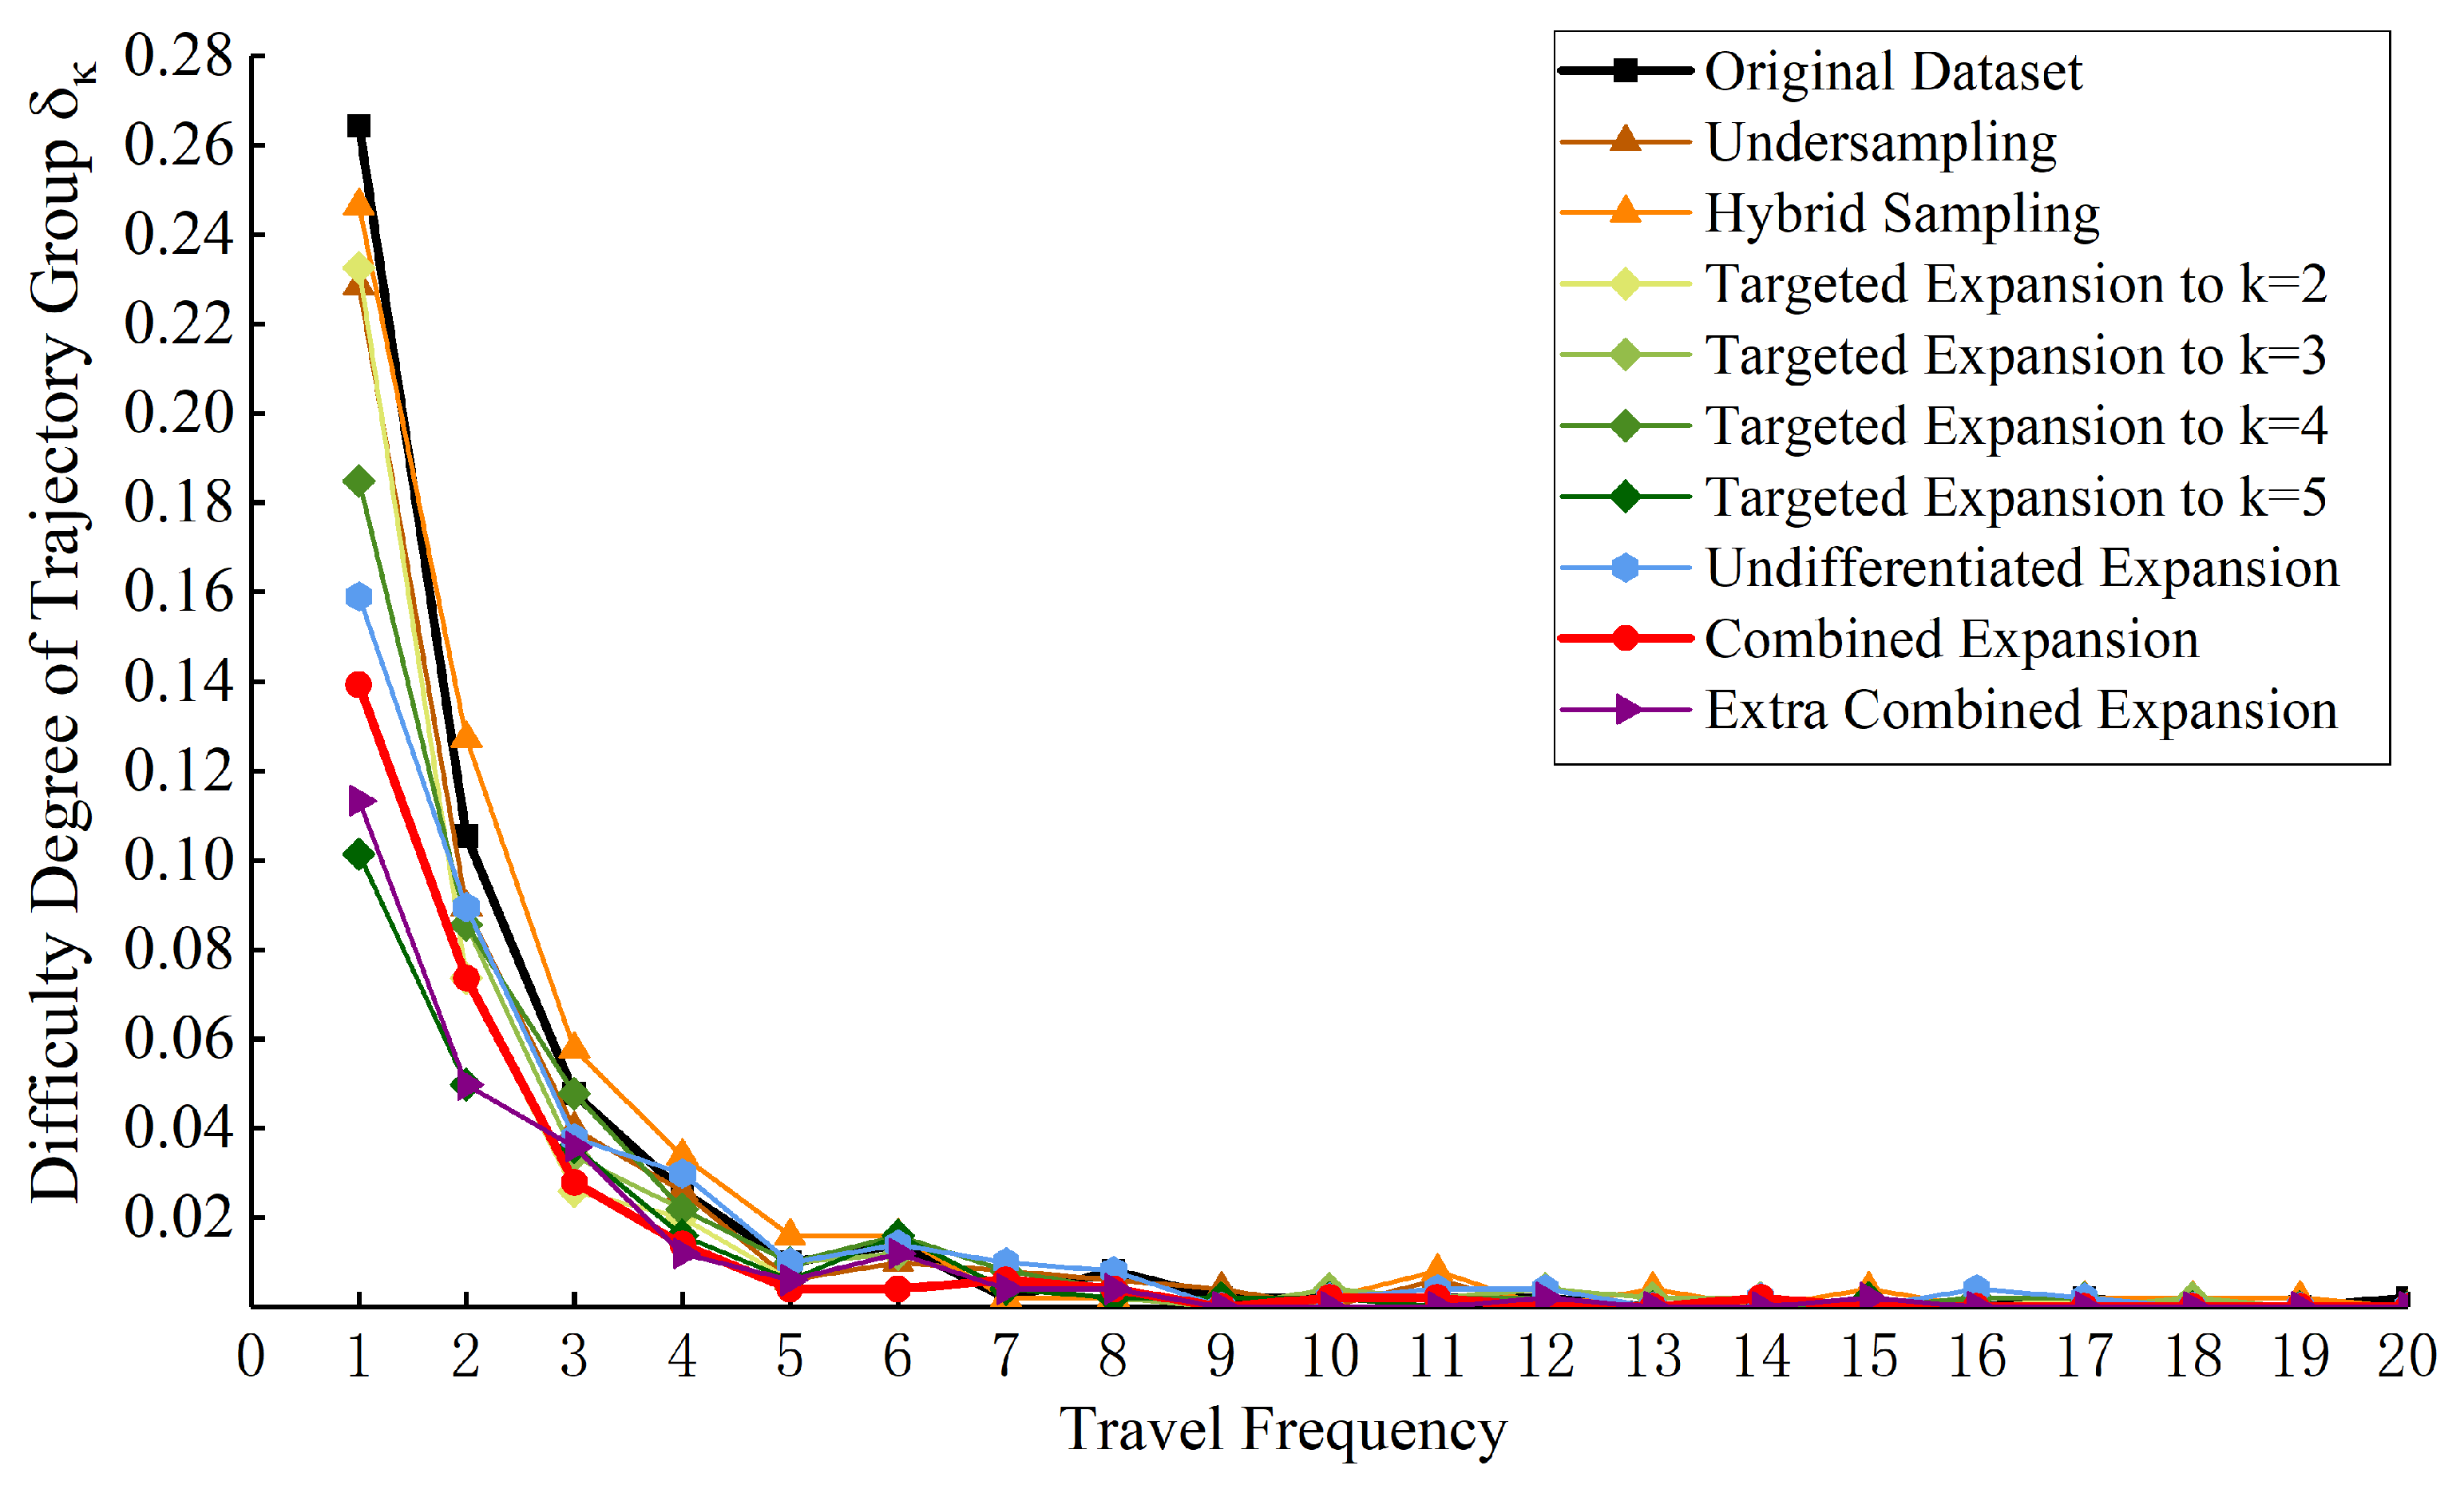
At first, ten groups of , difficulty degree of E are calculated intuitively based on the optimal synthetic trajectory dataset corresponding to each method, as shown in Figure 9. The overall variation trend of under all experiments is consistent. Compared with Experiment 1 where the original trajectories are used as the expert, most of the in the remaining experiments are reduced, especially . The result means that all processing methods can help reduce the difficulty of learning and generating trajectory groups of different journey frequency and the effect is most significant in the ultra-low-frequency trajectory group. Among them, the effects of Targeted Expansion to , Extra Combined Expansion and Combined Expansion are the most significant, but the ability of the first two methods to generate other frequency trajectory groups is gradually inferior to the augmentation method proposed.
The quality of synthetic trajectories under each experiment in depth are further measured at three levels: route, link and OD pair. At the route level, by counting the number of routes and journeys involved in the “learned trajectories” in the final synthetic trajectory L, the proportion and of the corresponding items in are calculated. A larger proportion means that L contains more categories of trajectories and similar journeys, which indicates that the model learns more internal sequential features of trajectories. In addition, in order to measure the ability of the model to generate ultra-low-frequency routes, the ultra-low-frequency routes involved in “learned trajectories” in the total number of ultra-low-frequency routes included in is calculated and called . In addition, the similarity of the whole L is measured by calculating the Jensen–Shannon divergence between the distribution of the number of journeys of each route in L and the corresponding distribution in , . The closer the is to 0, the more similar the two distributions are. The calculation formula is as in Equation (5):
where p and q are two discrete probability distributions. is the Kullback–Leibler divergence, and the calculation formula is as in Equation (6):
where and are the probabilities corresponding to the ith element of each distribution.
At the level of links and OD pairs, the proportion and of the links and OD pairs involved in for the corresponding items involved in the whole L are calculated to measure the comprehensiveness of the synthetic trajectories in the coverage of links and access to the area, i.e., the diversities of these two levels. Second, by calculating the Jensen–Shannon divergence between the distribution of the number of journeys of different links and OD pairs in L and the corresponding distribution in E, and . In this way, it can measure the similarity which shows the distribution of road network in detail. The results of each experiment for each element are shown in Table 2.
Compared with the results of Experiment 1, the values of and show that all the processing methods except the hybrid sampling method can help the trajectory-generation model learn more internal sequential features of the trajectory. Additionally, the results of and mean that all methods can improve the coverage of the synthetic trajectory in the links and the locations of access areas. Compared with other methods that process the original trajectories, it is worth noting that the combined expansion methods proposed by the study have the most significant improvement in all three dimensions, especially in the ability of generating ultra-low-frequency routes.
From the perspective of synthetic trajectory similarity, all index values associated with Jensen–Shannon divergence indicate that the non-differentiated expansion method corresponding to Experiment 8 has the best ability to protect the overall distribution of the synthetic trajectory dataset and the similarity of the distribution of road network in detail. Therefore, the proposed combined expansion method also enhances the similarity of synthetic trajectories from multiple angles to some extent while trying to enhance the enhancement of diversity as much as possible. In contrast, Experiments 2 and 3 containing undersampling processing impair above similarity obviously. In addition, the three targeted expansion methods, except for the targeted expansion to method in Experiment 4, also impair the similarity of synthetic trajectories to some extent, and the extent of this impairment deepens with the increase of the minimum journey frequency to which the expansion is applied. Thus, although the extra combined expansion method containing the non-differentiated treatment also produces impairment of the similarity at the synthetic trajectory link level. These similarity losses also reveal that not the more trajectories are fed as the expert references will result in higher-quality synthetic trajectories.
Since the combined expansion method also involves the processing of targeted expansion, the study further validates the effectiveness of the method by applying the metrics from the multi-classification problem to measure the degree of impact of these targeted expansion on the correspondence between routes and journey times in the original trajectory dataset. But there are some differences in the trajectory-generation context. It is believed that if the trajectory group in which each route in the synthetic trajectory is located is the same as that in the original trajectory or the number of journeys differs by 5 up and down corresponding to trajectory groups, the number of journeys corresponding to each trajectory category is considered to be classified correctly. When this correct classification occurs, it means that the impact of such targeted processing on the correspondence between the routes and the number of journeys is controllable. The metrics involved in this measurement process include accuracy, which measures the global categorical sample situation, Weighted-Precision, Weighted-Recall, and Weighted-F1-score, which take into account the category imbalance situation by assigning different weights based on the proportion of each category, respectively. A higher value means that the above specific classification task is performed better, further indicating that there is less impact of targeted expansion on the correspondence between routes and journey times. The results of each method are shown in Table 3.
Based on the comparison results in Table 3, it can be seen that the combined expansion method has the best correspondence results, and means that it can control and minimize the influence of its adjustment of the number of journeys corresponding to the ultra-low-frequency routes on the correspondence of the trajectories of the remaining journey frequencies. Due to the large number of trajectory categories and extremely high imbalance in this dataset, the calculated values under each experiment are relatively low. According to the results, the proportion of the ultra-low-frequency routes becoming the low-frequency ones is more than 70%. Therefore, it is verified that the influence of the combined expansion method on the correspondence of each journey frequency trajectory is within the controllable range.
5. Conclusions and Discussions
Complex road networks are common in real journey scenarios, and as the scale of the network increases, the involved turning relationships will become even larger and more complex. Therefore, the ULF-TrajGAIL is proposed, and it provides a process-oriented generation of the trajectory dataset with imbalanced distribution of routes and number of journeys. The measure of imbalance degree of trajectory groups and whole datasets involved in this framework is specially designed for trajectory-generation tasks. It can provide a basis for judging whether there will be a imbalance learning problem for the trajectory-generation task and reflect the reason ultra-low-frequency routes are difficult to generate. In the example of Tianhe CBD area in Guangzhou, the study clarifies that there is a stable imbalanced distribution and imbalance learning problem in our focused scenario based on the trend of imbalance degree in each cumulative day corresponding to the trajectory dataset. In order to generate higher-quality trajectories, a more reasonable and targeted augmentation method is investigated based on the pre-experimental stage of trajectory generation and a measure of the difficulty of generating trajectory, and the method varies depending on the distribution of the number of journeys corresponding to each route within the original trajectory dataset. In the example, the specific combination expansion method is to first expand the journey times corresponding to all routes with frequency of 1 to 2, and then expand the journey frequency corresponding to all routes involved in the original trajectories by twice as a whole.
The experimental results based on the case will be used to validate the superiority of the proposed method from a macro perspective. Compared with the synthetic trajectory learned by the original trajectory without any processing, the percentage of all learned routes increases from 50.70% to 72.17% in the synthetic trajectory learned by the trajectory processed by the combined expansion method, which indicates that the quality of the synthetic trajectory is improved in terms of diversity. It is also worth noting that the percentage of learned ultra-low-frequency routes increases from 20.83% to 58.33%, which means the whole framework can help overcome the imbalance learning problem. In this way, the final trajectory can provide richer route-selection behavioral features for learning and mining. Meanwhile, the improved coverage of both link and access area may help reflect a more realistic road network status and trip distribution, and then provide more reasonable route recommendations. The similarity of the correspondence between all the routes and the number of journeys in the synthetic trajectory is also improved from 0.2694 to 0.2501, so it can be concluded that this expert trajectory-augmentation method can finally make the synthetic trajectory with higher quality, and also justifies the rationality of the process of determining the method based on the ULF-TrajGAIL. It is novel and relatively complete to measure the quality of synthetic trajectories from the diversity and similarity of the three levels of the route, link and OD. In addition, the synthetic trajectories obtained from other augmentation methods are also evaluated from the above perspectives. The results show that the method with undersampling processing is not suitable for the trajectory-generation task in such scenarios, while the remaining methods with only targeted and undifferentiated expansions are much less advantageous than the combined expansion method in improving the trajectory quality.
Since this paper attempts to investigate the quality of trajectory generation in a specific context for the first time, several limitations can be observed while applying the proposed solution i.e., (1) the study focuses on the aggregated characteristics of traffic behaviors in regular situations within a defined period, but does not take into account the uncertainty of journey behaviors, such as the impact of unexpected events or information induced within the study area and time frame, so further studies can try to improve the applicability of the method from the algorithm-level by adding additional information apart from the trajectory data to enrich embeddings; (2) although the study has a relatively complete way to evaluate the quality of trajectories, it cannot vividly demonstrate the practicality of the study, and the subsequent attempts will be made to further enhance by testing the complete capability of downstream applications related to trajectory generation, such as popular route recommendations.
Author Contributions
Conceptualization, J.L.; methodology, W.Z.; software, J.L.; validation, W.Z.; formal analysis, W.Z.; investigation, W.Z.; resources, J.L.; data curation, W.Z.; writing—original draft preparation, W.Z.; writing—review and editing, J.L.; visualization, W.Z.; supervision, J.L.; project administration, J.L.; funding acquisition, J.L. All authors have read and agreed to the published version of the manuscript.
Funding
This work was supported by the Research and Development Project in Key Areas of Guangdong Province (No. 2019B090913001).
Data Availability Statement
The data presented in this study are available on request from the corresponding author. The data are not publicly available due to privacy protection of respondents.
Acknowledgments
We are very grateful to the editors and reviewers for their hard work.
Conflicts of Interest
The authors declare no conflict of interest.
References
- Liu, X.; Chen, H.; Andris, C. trajGANs: Using generative adversarial networks for geo-privacy protection of trajectory data (Vision paper). In Proceedings of the Location Privacy and Security Workshop, San Francisco, CA, USA, 21–23 May 2018; pp. 1–7. [Google Scholar]
- Lee, B.; Fujiwara, A.; Sugie, Y.; Namgung, M. Route choice behavior model considering randomness and vagueness uncertainty. In Proceedings of the 13th Mini EURO Conference on Handling Uncertainty in Analysis of Traffic and Transportation Systems, Bari, Italy, 10–13 June 2002. [Google Scholar]
- He, D.; Wang, S.; Ruan, B.; Zheng, B.; Zhou, X. Efficient and robust data augmentation for trajectory analytics: A similarity-based approach. World Wide Web 2020, 23, 361–387. [Google Scholar] [CrossRef]
- Chawla, N.V. Data mining for imbalanced datasets: An overview. In Data Mining and Knowledge Discovery Handbook; Springer: Berlin/Heidelberg, Germany, 2009; pp. 875–886. [Google Scholar]
- Li, D.C.; Hu, S.C.; Lin, L.S.; Yeh, C.W. Detecting representative data and generating synthetic samples to improve learning accuracy with imbalanced data sets. PLoS ONE 2017, 12, e0181853. [Google Scholar] [CrossRef] [PubMed] [Green Version]
- Zhu, T.; Luo, C.; Zhang, Z.; Li, J.; Ren, S.; Zeng, Y. Minority oversampling for imbalanced time series classification. Knowl.-Based Syst. 2022, 247, 108764. [Google Scholar] [CrossRef]
- Fernández, A.; LóPez, V.; Galar, M.; Del Jesus, M.J.; Herrera, F. Analysing the classification of imbalanced data-sets with multiple classes: Binarization techniques and ad-hoc approaches. Knowl.-Based Syst. 2013, 42, 97–110. [Google Scholar] [CrossRef]
- Choi, S.; Kim, J.; Yeo, H. Trajgail: Generating urban vehicle trajectories using generative adversarial imitation learning. Transp. Res. Part C Emerg. Technol. 2021, 128, 103091. [Google Scholar] [CrossRef]
- Li, H.; Guensler, R.; Ogle, J. Analysis of Morning Commute Route Choice Patterns Using Global Positioning System–Based Vehicle Activity Data. Transp. Res. Rec. 2005, 1926, 162–170. [Google Scholar] [CrossRef]
- Li, Z.; Ding, B.; Han, J.; Kays, R.; Nye, P. Mining periodic behaviors for moving objects. In Proceedings of the 16th ACM SIGKDD International Conference on Knowledge Discovery and Data Mining, San Francisco, CA, USA, 13–17 August 2010; pp. 1099–1108. [Google Scholar]
- Giannotti, F.; Nanni, M.; Pinelli, F.; Pedreschi, D. Trajectory pattern mining. In Proceedings of the 13th ACM SIGKDD International Conference on Knowledge Discovery and Data Mining, San Jose, CA, USA, 12–15 August 2007; pp. 330–339. [Google Scholar]
- Chen, M.; Liu, Y.; Yu, X. Nlpmm: A next location predictor with markov modeling. In Proceedings of the Pacific-Asia Conference on Knowledge Discovery and Data Mining, Tainan, Taiwan, 13–16 May 2014; pp. 186–197. [Google Scholar]
- Fan, X.; Guo, L.; Han, N.; Wang, Y.; Shi, J.; Yuan, Y. A deep learning approach for next location prediction. In Proceedings of the IEEE 22nd International Conference on Computer Supported Cooperative Work in Design (CSCWD), Nanjing, China, 9–11 May 2018; pp. 69–74. [Google Scholar]
- Jin, C.; Lin, Z.; Wu, M. Augmented intention model for next-location prediction from graphical trajectory context. Wirel. Commun. Mob. Comput. 2019, 2019, 2860165. [Google Scholar] [CrossRef] [Green Version]
- Jun, L.; Yu-wei, G.; Wei, Y. Predicting Optimal Route Based on Link-to-link Transition Probability. J. Transp. Syst. Eng. Inf. Technol. 2021, 21, 36. [Google Scholar]
- Hu, G.; Shao, J.; Ni, Z.; Zhang, D. A graph based method for constructing popular routes with check-ins. World Wide Web 2018, 21, 1689–1703. [Google Scholar] [CrossRef]
- Goodfellow, I.; Pouget-Abadie, J.; Mirza, M.; Xu, B.; Warde-Farley, D.; Ozair, S.; Courville, A.; Bengio, Y. Generative adversarial networks. Commun. ACM 2020, 63, 139–144. [Google Scholar] [CrossRef]
- Cao, C.; Li, M. Generating Mobility Trajectories with Retained Data Utility. In Proceedings of the 27th ACM SIGKDD Conference on Knowledge Discovery & Data Mining, Singapore, 14–18 August 2021; pp. 2610–2620. [Google Scholar]
- Sutskever, I.; Vinyals, O.; Le, Q.V. Sequence to sequence learning with neural networks. Adv. Neural Inf. Process. Syst. 2014, 27. [Google Scholar]
- Chen, X.; Xu, J.; Zhou, R.; Chen, W.; Fang, J.; Liu, C. TrajVAE: A Variational AutoEncoder model for trajectory generation. Neurocomputing 2021, 428, 332–339. [Google Scholar] [CrossRef]
- Codevilla, F.; Müller, M.; López, A.; Koltun, V.; Dosovitskiy, A. End-to-end driving via conditional imitation learning. In Proceedings of the IEEE International Conference on Robotics and Automation (ICRA), Brisbane, Australia, 21–25 May 2018; pp. 4693–4700. [Google Scholar]
- Ng, W.; Hu, J.; Yeung, D.; Yin, S.; Roli, F. Diversified sensitivity-based undersampling for imbalance classification problems. IEEE Trans. Cybern. 2014, 45, 2402–2412. [Google Scholar] [CrossRef] [PubMed]
- He, H.; Garcia, E.A. Learning from imbalanced data. IEEE Trans. Knowl. Data Eng. 2009, 21, 1263–1284. [Google Scholar]
- García, V.; Sánchez, J.S.; Mollineda, R.A. On the effectiveness of preprocessing methods when dealing with different levels of class imbalance. Knowl.-Based Syst. 2012, 25, 13–21. [Google Scholar] [CrossRef]
- Estabrooks, A.; Jo, T.; Japkowicz, N. A multiple resampling method for learning from imbalanced data sets. Comput. Intell. 2004, 20, 18–36. [Google Scholar] [CrossRef] [Green Version]
- Chawla, N.V.; Bowyer, K.W.; Hall, L.O.; Kegelmeyer, W.P. SMOTE: Synthetic minority over-sampling technique. J. Artif. Intell. Res. 2002, 16, 321–357. [Google Scholar] [CrossRef]
- Engelmann, J.; Lessmann, S. Conditional Wasserstein GAN-based oversampling of tabular data for imbalanced learning. Expert Syst. Appl. 2021, 174, 114582. [Google Scholar] [CrossRef]
- Seiffert, C.; Khoshgoftaar, T.M.; Van Hulse, J. Hybrid sampling for imbalanced data. Integr. Comput.-Aided Eng. 2009, 16, 193–210. [Google Scholar] [CrossRef]
- Zhu, R.; Guo, Y.; Xue, J.H. Adjusting the imbalance ratio by the dimensionality of imbalanced data. Pattern Recognit. Lett. 2020, 133, 217–223. [Google Scholar] [CrossRef]
Figure 1.
The schematic of related definitions in the trajectory-generation scenario.

Figure 2.
Framework of ultra-low-frequency trajectory generation using TrajGAIL.
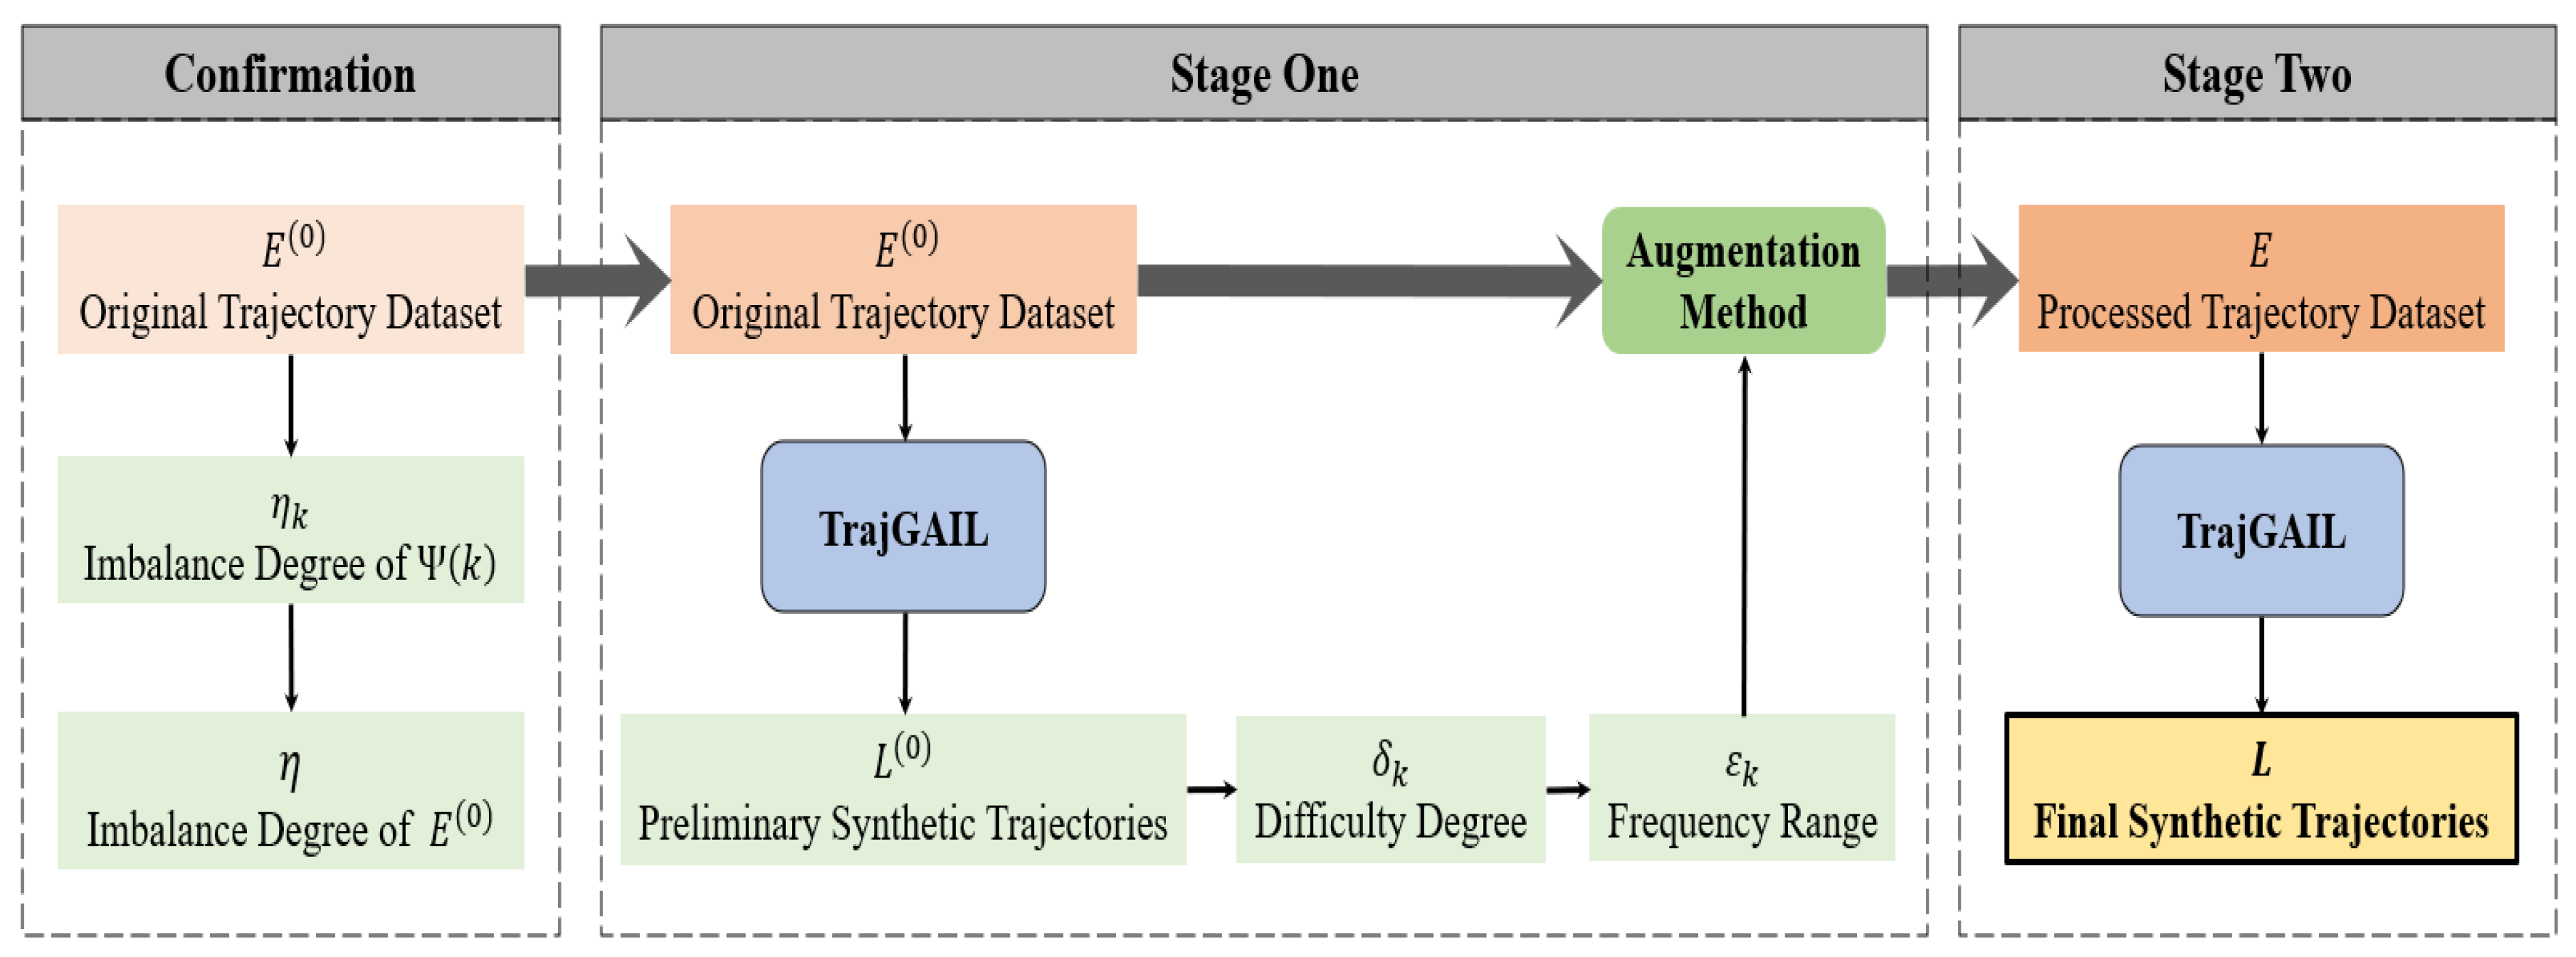
Figure 3.
Model of trajectory generation.

Figure 4.
The study area of trajectory generation. The red bold solid lines refer to the boundaries of the study area, while the blue, green, yellow and purple solid lines represent the high-frequency link of Origin and Destination involved in trajectories from the northeast, southeast, southwest and northwest directions, respectively.

Figure 5.
Distribution of the number of routes and journeys and the imbalance degree of each original expert trajectory dataset.
Figure 5.
Distribution of the number of routes and journeys and the imbalance degree of each original expert trajectory dataset.

Figure 6.
Indicator of the imbalance degree of trajectory group.

Figure 7.
Calculation results of the difficulty degree of each journey frequency trajectory in .

Figure 8.
Links covered by ultra-low trajectories. All links covered by ultra-low-frequency trajectories are outlined in solid green lines.
Figure 8.
Links covered by ultra-low trajectories. All links covered by ultra-low-frequency trajectories are outlined in solid green lines.

Figure 9.
Calculation results of the difficulty degree of each journey frequency trajectory.

Table 1.
Basic information of trajectory-generation experiments. The proposed method and corresponding results are shown in bold.
Table 1.
Basic information of trajectory-generation experiments. The proposed method and corresponding results are shown in bold.
| No. | Processing Method | Number of Routes of E | Number of Travels of E | Number of Travels of L | |
|---|---|---|---|---|---|
| 1 | – | 93.56 | 503 | 10,499 | 10,499 |
| 2 | Undersampling | 73.92 | 503 | 6267 | 10,499 |
| 3 | Hybrid Sampling | 74.00 | 503 | 10,595 | 10,499 |
| 4 | Targeted Expansion to | 74.25 | 503 | 10,667 | 10,499 |
| 5 | Targeted Expansion to | 65.25 | 503 | 10,919 | 10,499 |
| 6 | Targeted Expansion to | 59.54 | 503 | 11,207 | 10,499 |
| 7 | Targeted Expansion to | 55.43 | 503 | 11,528 | 10,499 |
| 8 | Undifferentiated Expansion | 93.56 | 503 | 20,998 | 10,499 |
| 9 | Combined Expansion | 74.25 | 503 | 21,334 | 10,499 |
| 10 | Extra Combined Expansion | 65.25 | 503 | 21,838 | 10,499 |
Table 2.
The results of the diversity and similarity comparison of synthetic trajectories.
| No. | Processing Method | ||||||||
|---|---|---|---|---|---|---|---|---|---|
| 1 | – | 0.5070 | 0.9333 | 0.2083 | 0.2694 | 0.8861 | 0.1268 | 0.6266 | 0.2543 |
| 2 | Undersampling | 0.5726 | 0.9517 | 0.3155 | 0.3100 | 0.9234 | 0.2459 | 0.7110 | 0.2917 |
| 3 | Hybrid Sampling | 0.4692 | 0.9302 | 0.2619 | 0.2885 | 0.9234 | 0.1253 | 0.7110 | 0.2703 |
| 4 | Targeted Expansion to | 0.6302 | 0.9565 | 0.4464 | 0.2670 | 0.9689 | 0.1239 | 0.7852 | 0.2510 |
| 5 | Targeted Expansion to | 0.6083 | 0.9477 | 0.4464 | 0.2891 | 0.9689 | 0.1300 | 0.7724 | 0.2686 |
| 6 | Targeted Expansion to | 0.5726 | 0.9517 | 0.3155 | 0.2707 | 0.9710 | 0.1420 | 0.8900 | 0.2517 |
| 7 | Targeted Expansion to | 0.6203 | 0.9444 | 0.5238 | 0.3063 | 0.9607 | 0.1473 | 0.8875 | 0.2828 |
| 8 | Undifferentiated Expansion | 0.6183 | 0.9636 | 0.3036 | 0.2445 | 0.8923 | 0.1205 | 0.6880 | 0.2334 |
| 9 | Combined Expansion | 0.7217 | 0.9707 | 0.5833 | 0.2501 | 0.9731 | 0.1268 | 0.8031 | 0.2376 |
| 10 | Extra Combined Expansion | 0.7594 | 0.9721 | 0.6607 | 0.2617 | 0.9814 | 0.1431 | 0.8875 | 0.2476 |
We mark the comparison items with inferior performance to Experiment 1 without any processing of the original trajectories in red, and the top two performers in each comparison item are in bold black.
Table 3.
Theimpact degree of the correspondence between routes and the number of journeys.The proposed method and corresponding results are shown in bold.
Table 3.
Theimpact degree of the correspondence between routes and the number of journeys.The proposed method and corresponding results are shown in bold.
| No. | Processing Method | Accuracy | Weighted-Precision | Weighted-Recall | Weighted-F1-Score |
|---|---|---|---|---|---|
| 1 | – | 0.46 | 0.55 | 0.46 | 0.49 |
| 2 | Undersampling | 0.42 | 0.56 | 0.42 | 0.47 |
| 3 | Hybrid Sampling | 0.40 | 0.51 | 0.40 | 0.44 |
| 4 | Targeted Expansion to | 0.50 | 0.59 | 0.50 | 0.53 |
| 5 | Targeted Expansion to | 0.46 | 0.58 | 0.46 | 0.50 |
| 6 | Targeted Expansion to | 0.42 | 0.56 | 0.42 | 0.47 |
| 7 | Targeted Expansion to | 0.36 | 0.58 | 0.36 | 0.42 |
| 8 | Undifferentiated Expansion | 0.56 | 0.64 | 0.56 | 0.59 |
| 9 | Combined Expansion | 0.58 | 0.64 | 0.58 | 0.60 |
| 10 | Extra Combined Expansion | 0.48 | 0.61 | 0.48 | 0.52 |
Disclaimer/Publisher’s Note: The statements, opinions and data contained in all publications are solely those of the individual author(s) and contributor(s) and not of MDPI and/or the editor(s). MDPI and/or the editor(s) disclaim responsibility for any injury to people or property resulting from any ideas, methods, instructions or products referred to in the content. |
© 2023 by the authors. Licensee MDPI, Basel, Switzerland. This article is an open access article distributed under the terms and conditions of the Creative Commons Attribution (CC BY) license (https://creativecommons.org/licenses/by/4.0/).
Share and Cite
MDPI and ACS Style
Li, J.; Zhao, W. Trajectory Generation of Ultra-Low-Frequency Travel Routes in Large-Scale Complex Road Networks. Systems 2023, 11, 61. https://doi.org/10.3390/systems11020061
AMA Style
Li J, Zhao W. Trajectory Generation of Ultra-Low-Frequency Travel Routes in Large-Scale Complex Road Networks. Systems. 2023; 11(2):61. https://doi.org/10.3390/systems11020061
Chicago/Turabian StyleLi, Jun, and Wenting Zhao. 2023. "Trajectory Generation of Ultra-Low-Frequency Travel Routes in Large-Scale Complex Road Networks" Systems 11, no. 2: 61. https://doi.org/10.3390/systems11020061
Note that from the first issue of 2016, this journal uses article numbers instead of page numbers. See further details here.