Enhanced Symbiotic Characteristics in Bacterial Genomes with the Disruption of rRNA Operon


Abstract
Simple Summary
Abstract
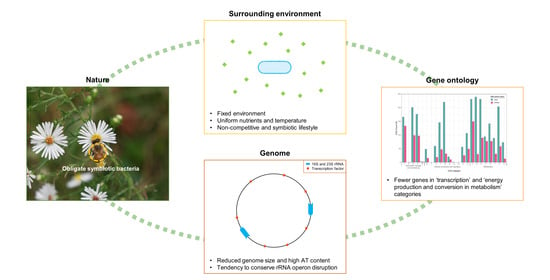
1. Introduction
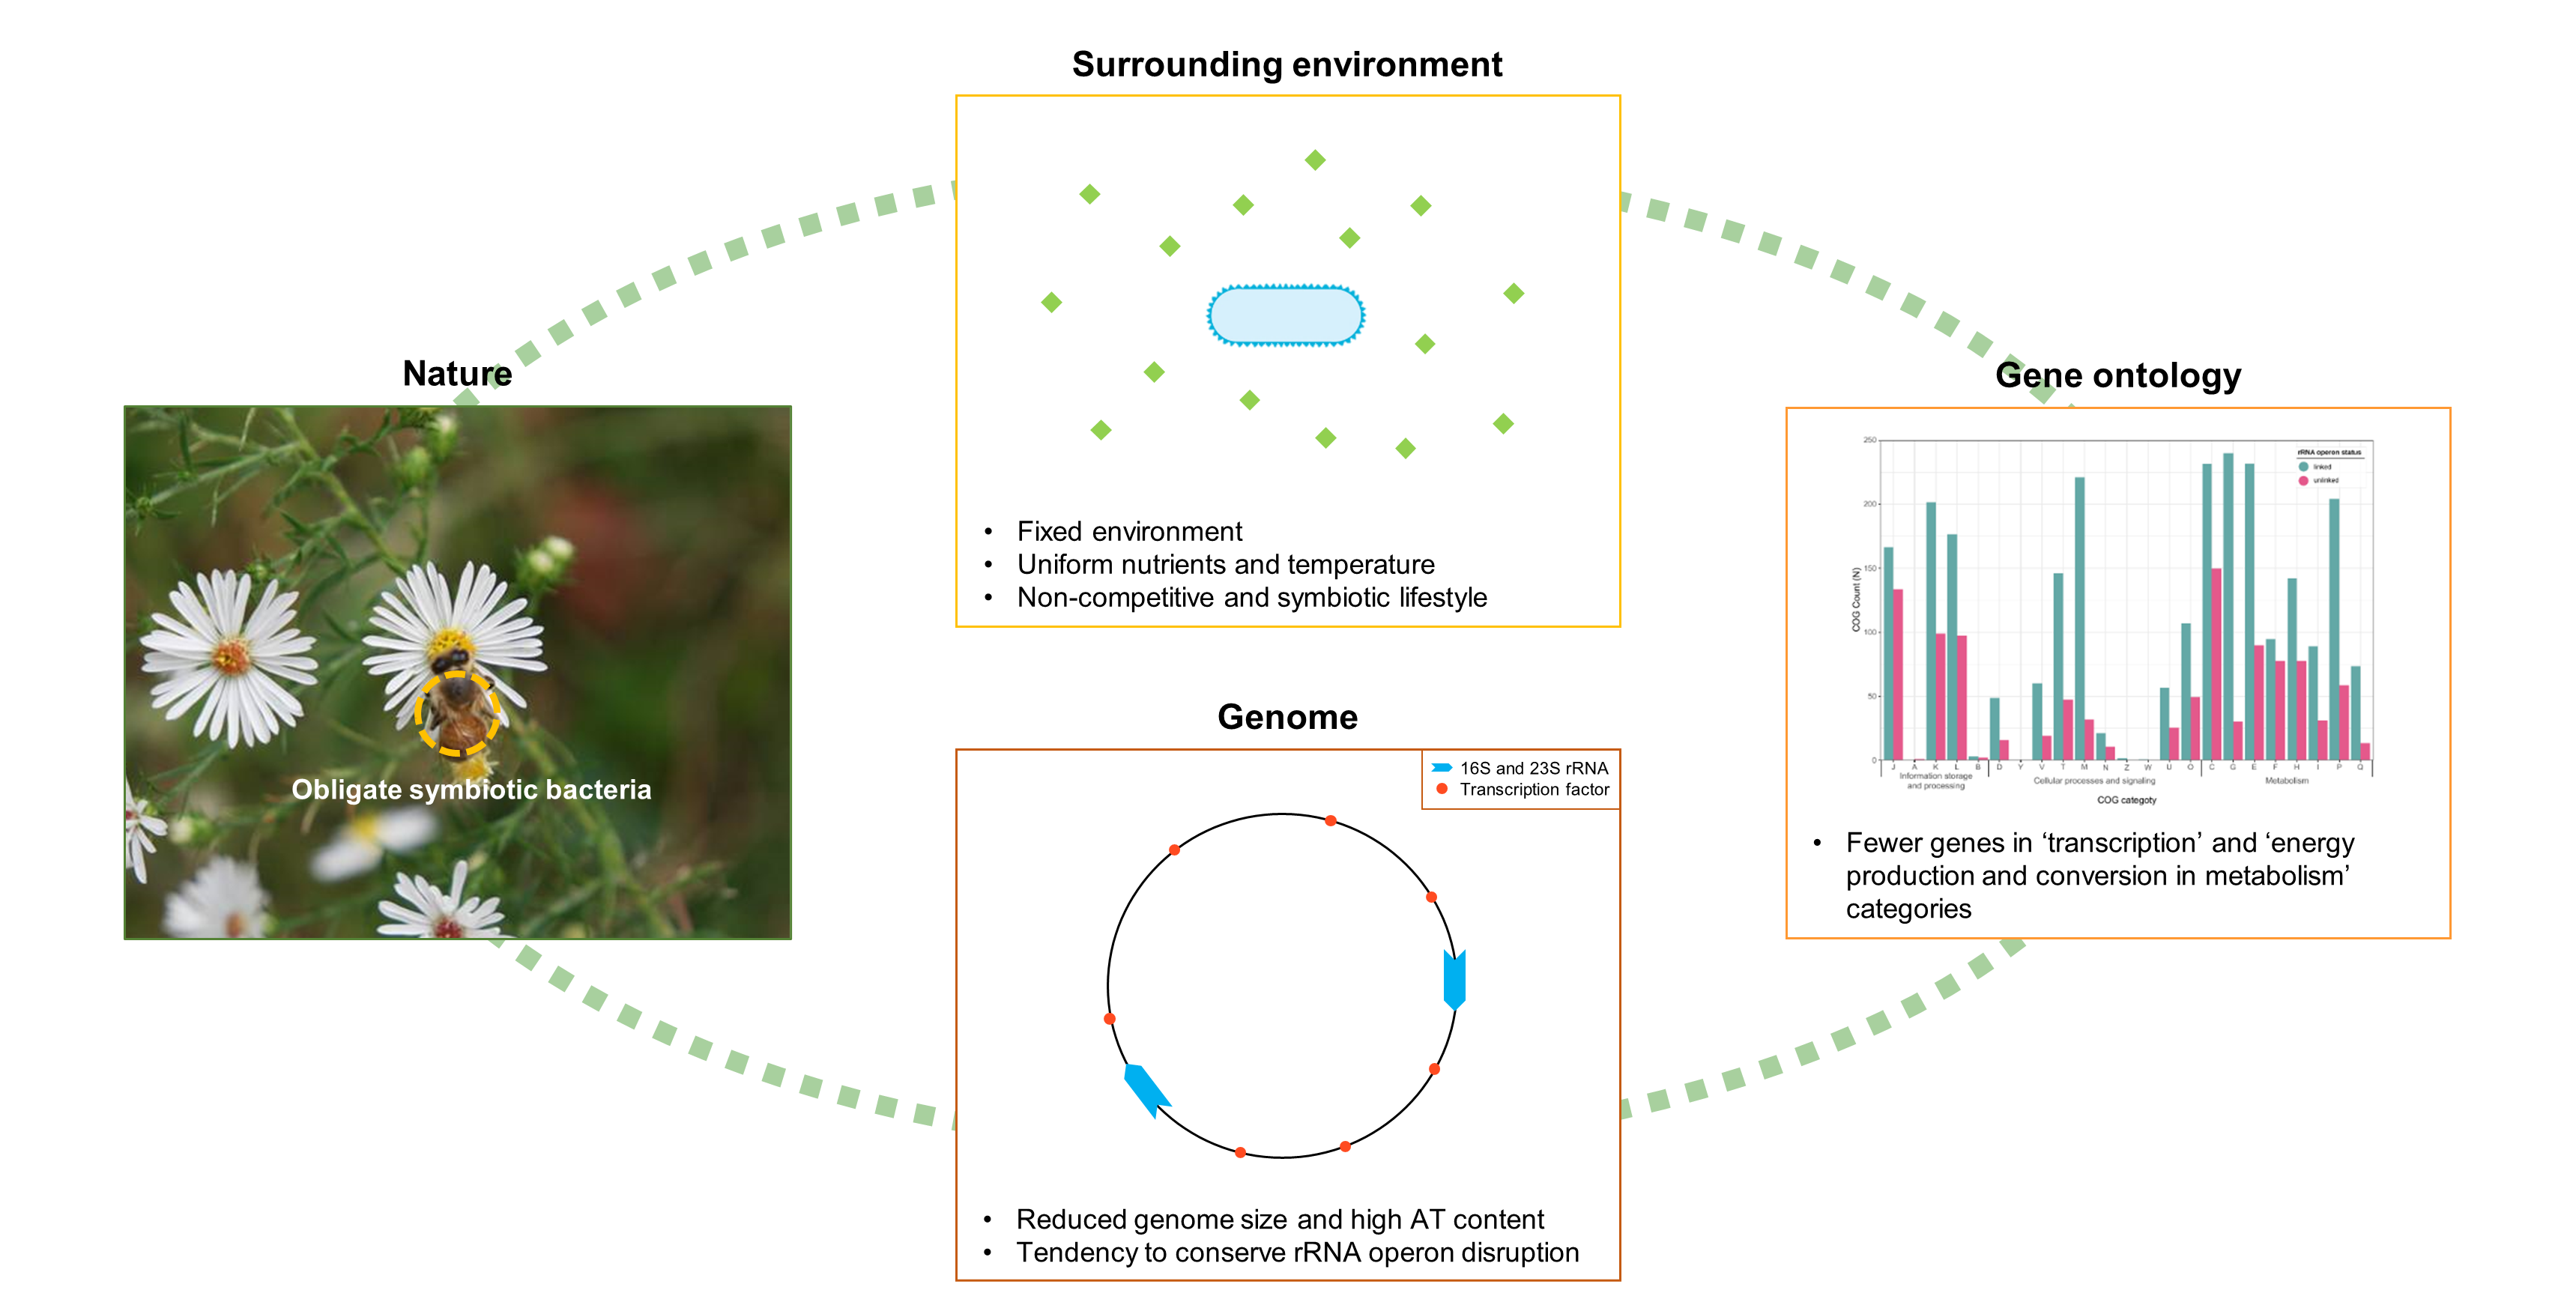
2. Materials and Methods
2.1. Bacterial rRNA Data Preparation
2.2. Taxonomy Reclassification
2.3. Primer-Based Identification and rRNA Filtering
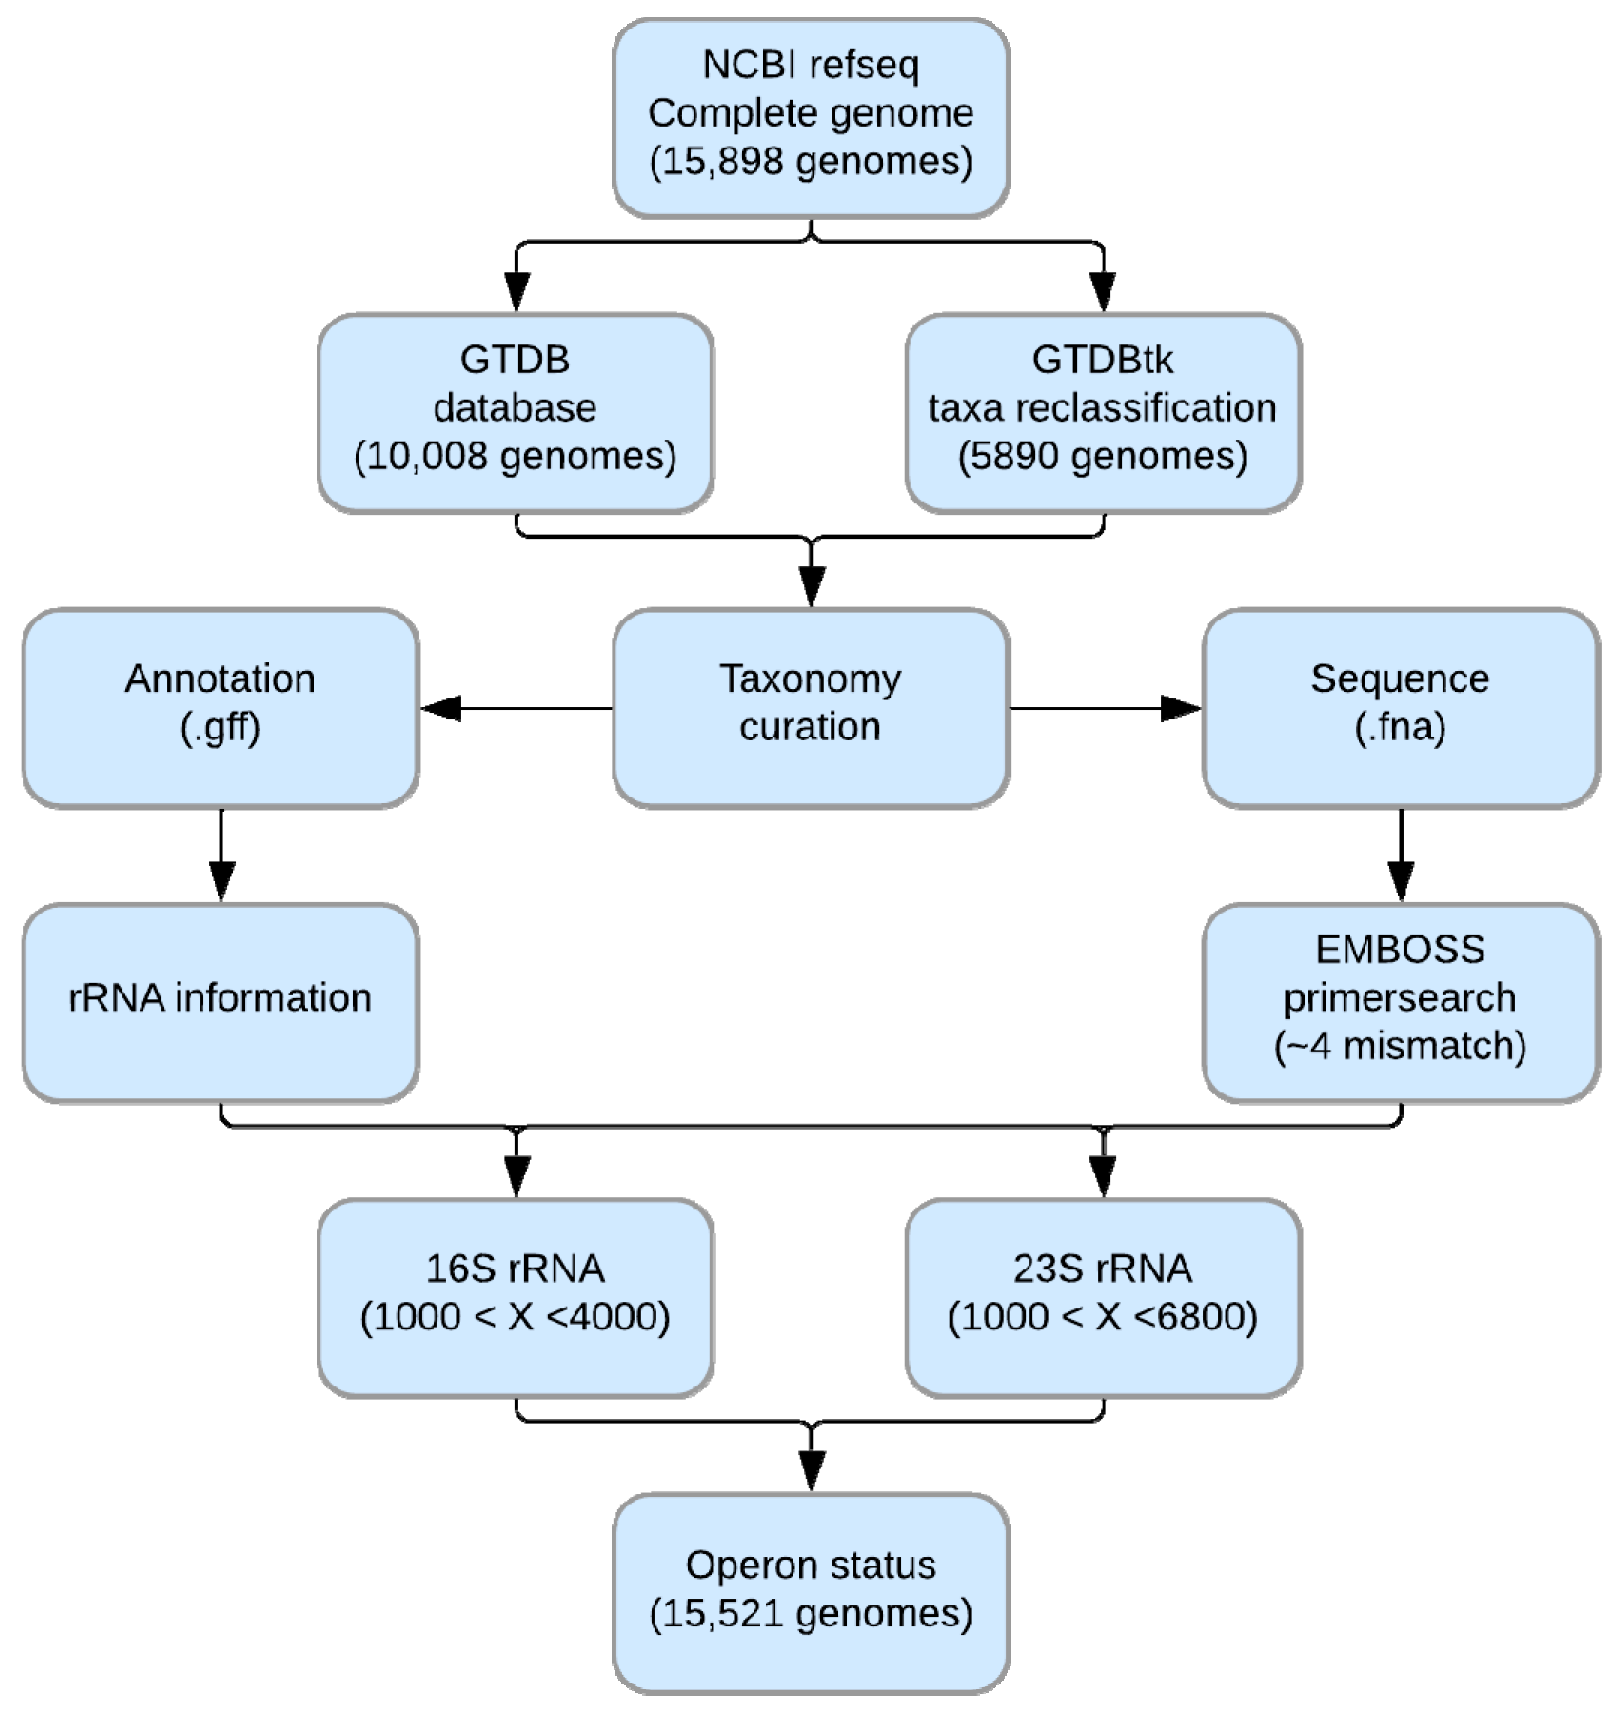
2.4. rRNA Operon Identification
2.5. Correlation Analysis of Genomic Features of Symbiotic Bacteria
2.6. Comparisons of Functional Genes between rRNA Operon-Linked and Unlinked Bacteria
3. Results
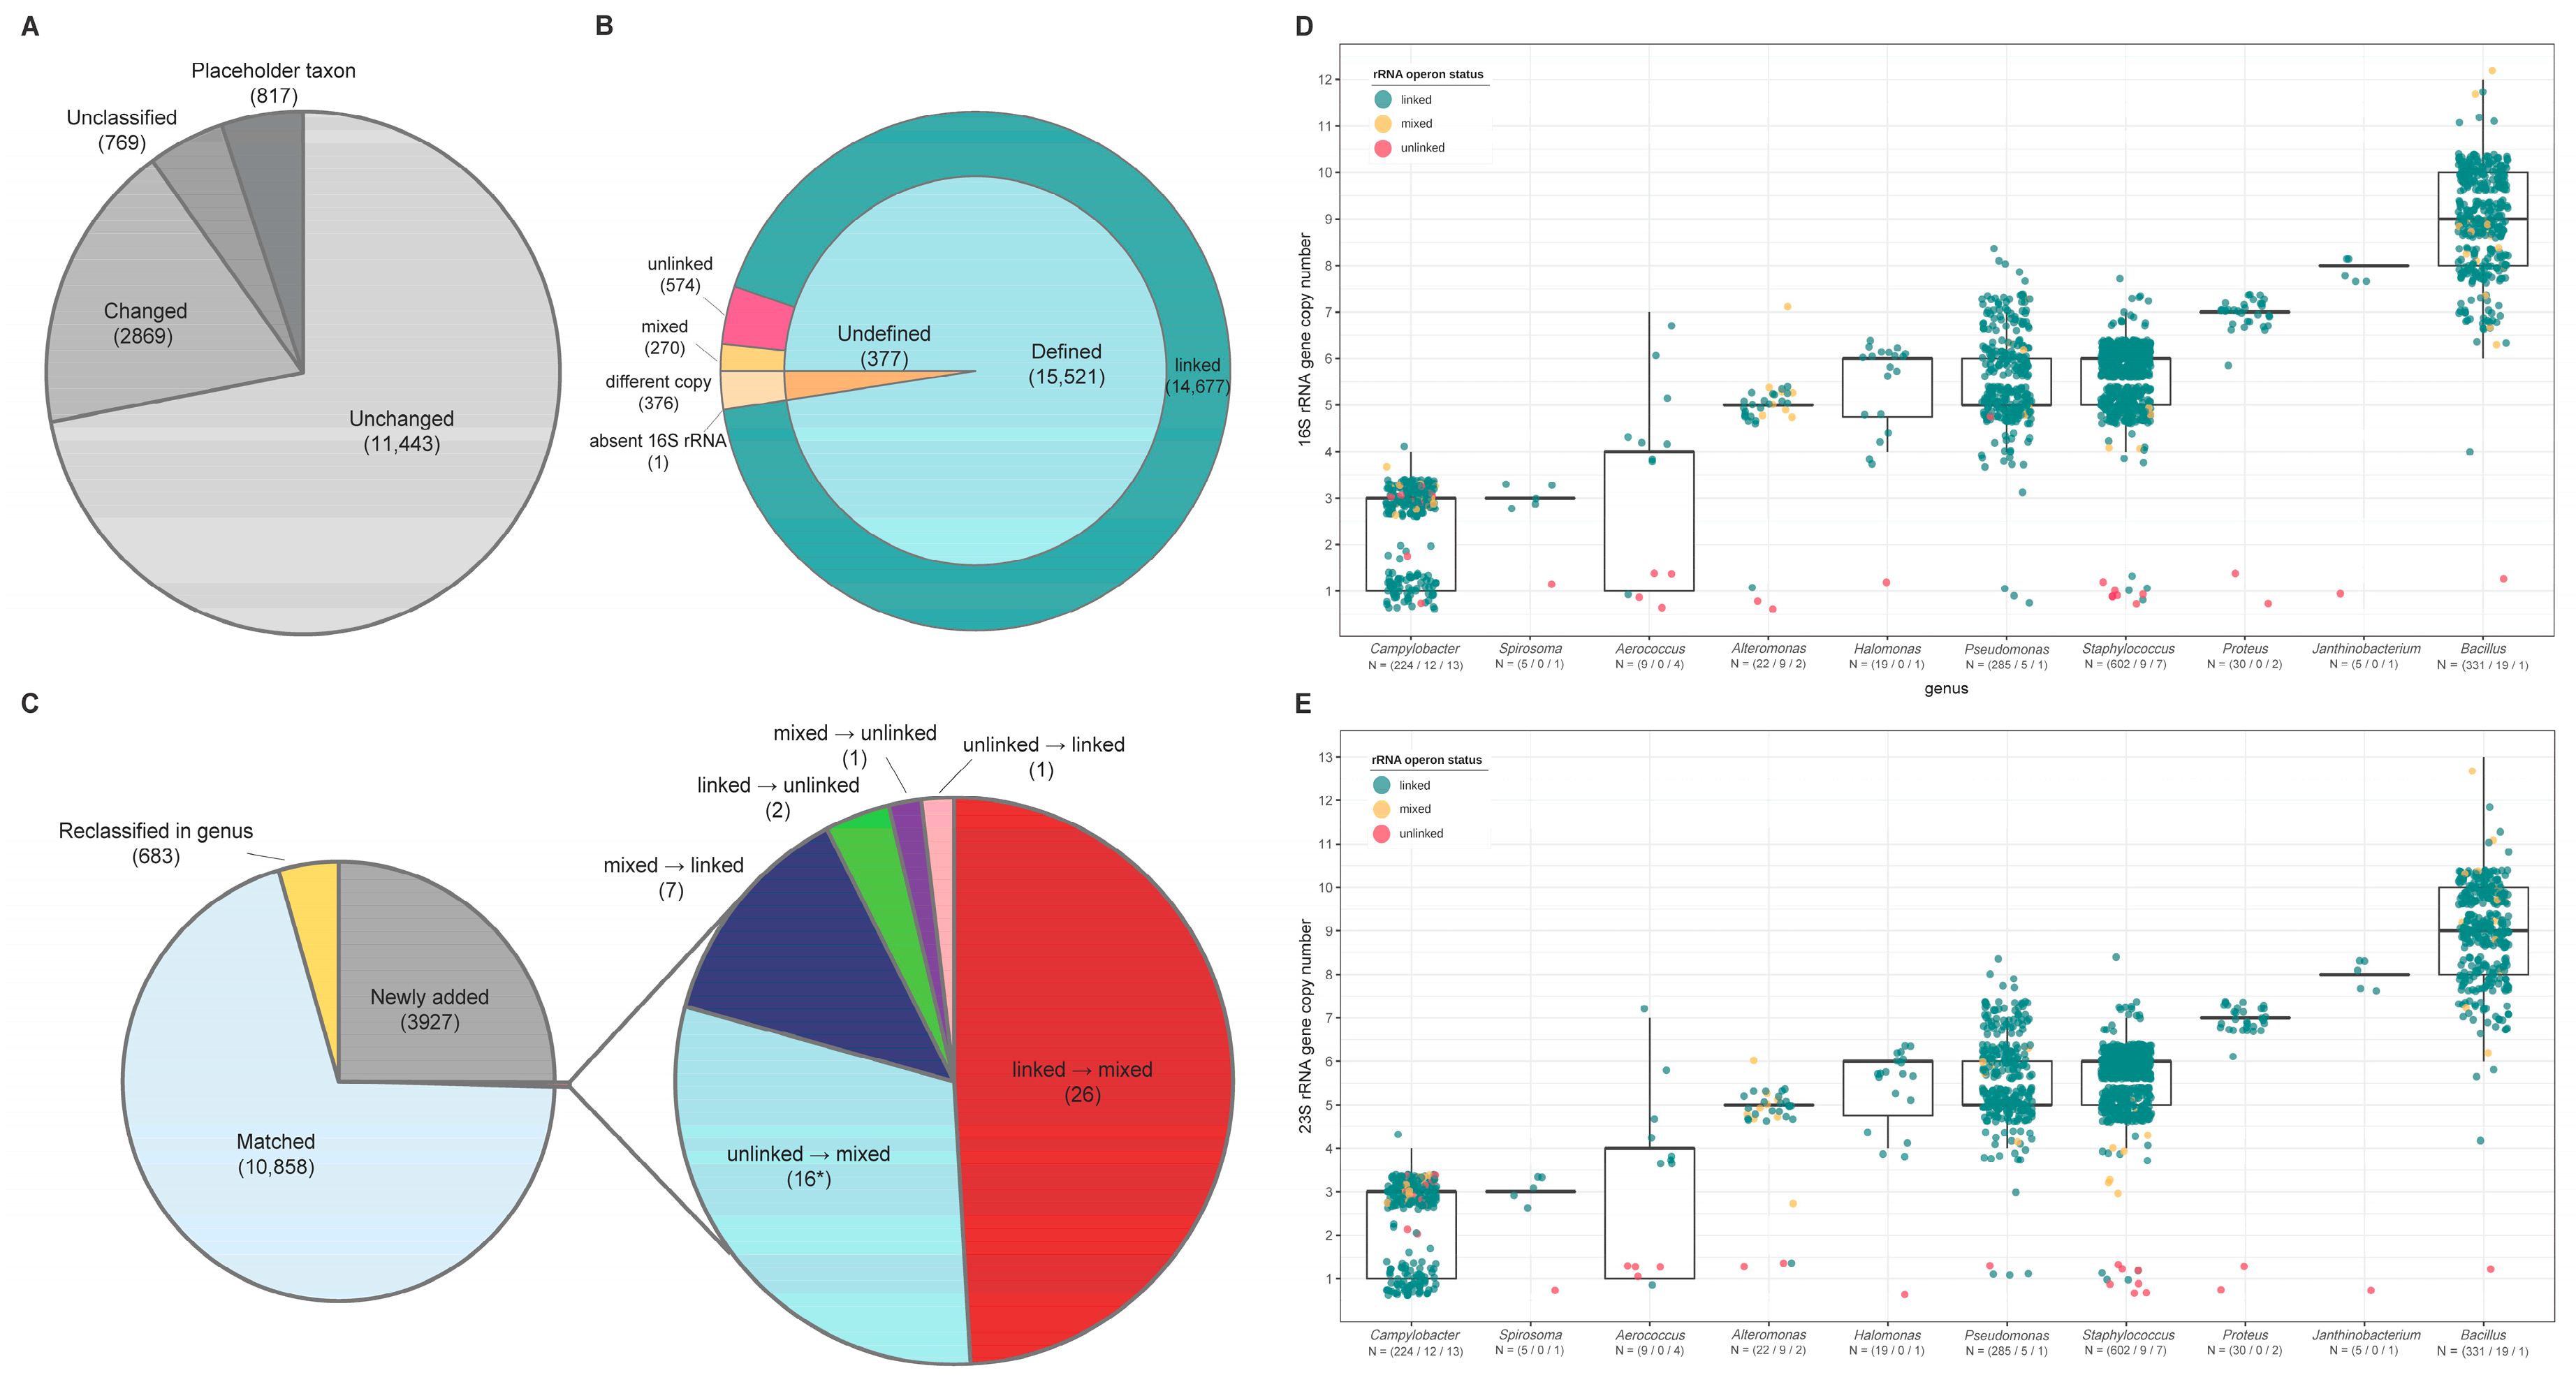
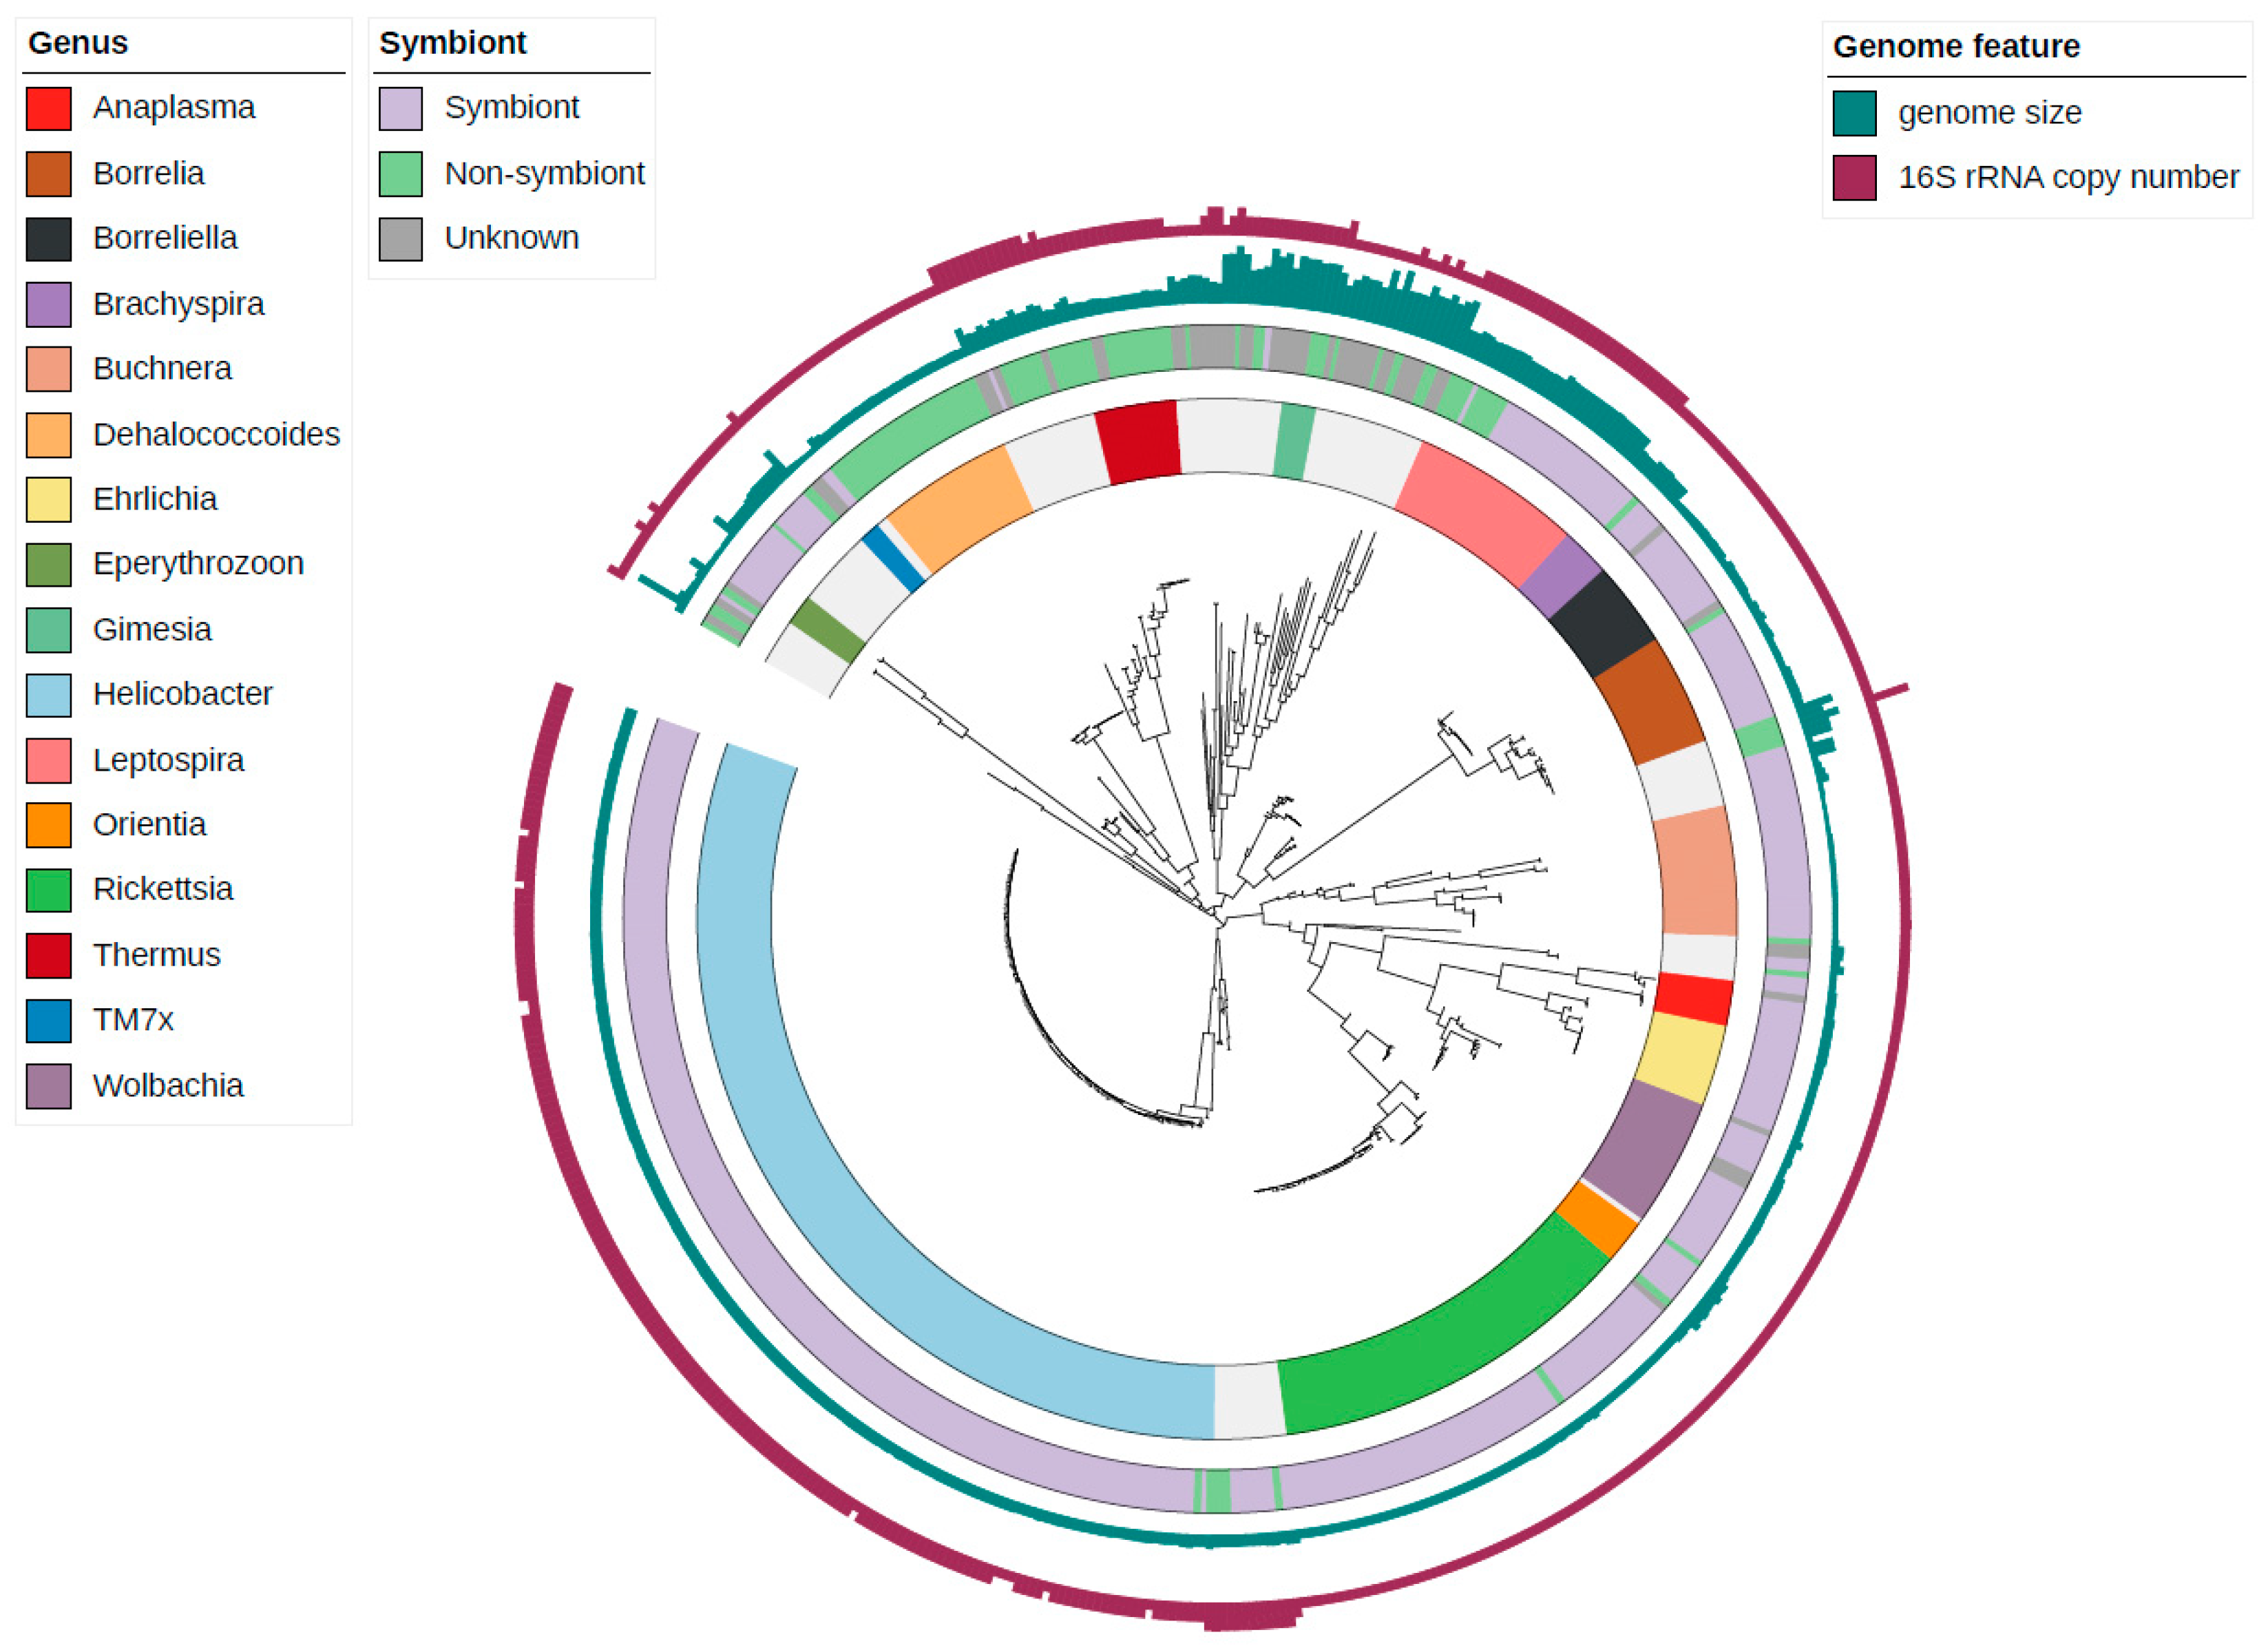
3.1. Confirmation of rRNA Operon Status
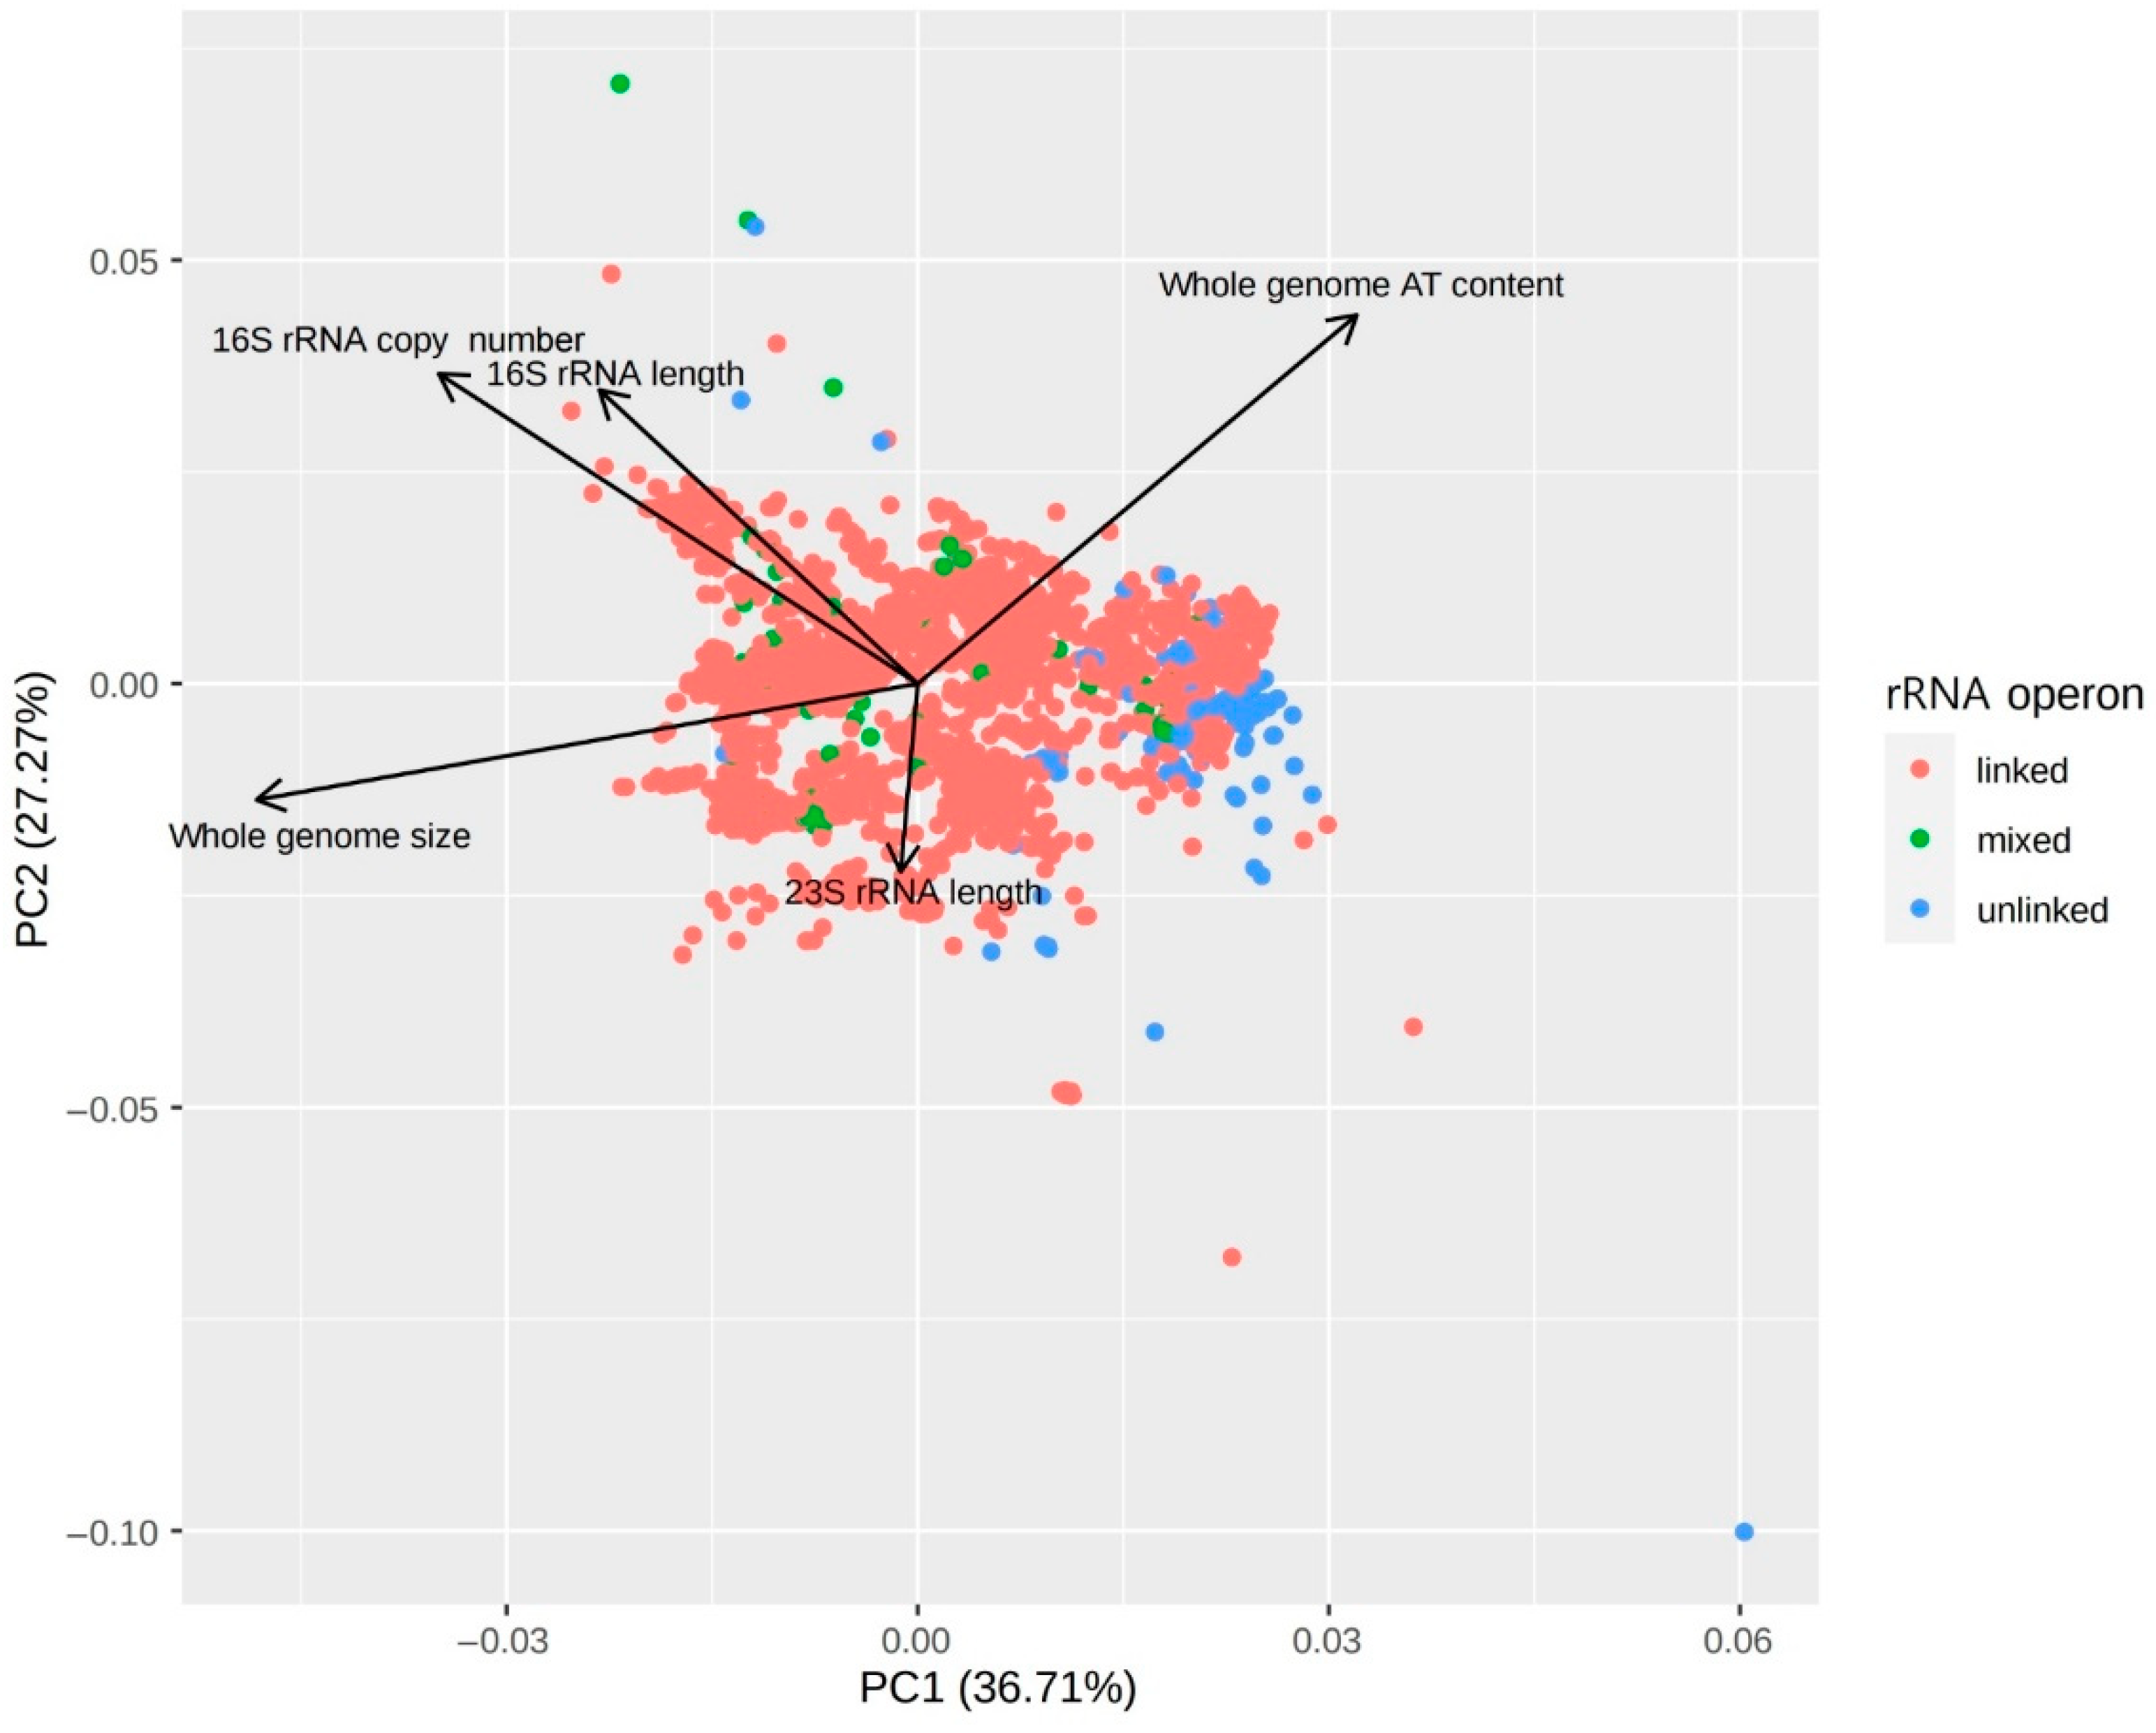
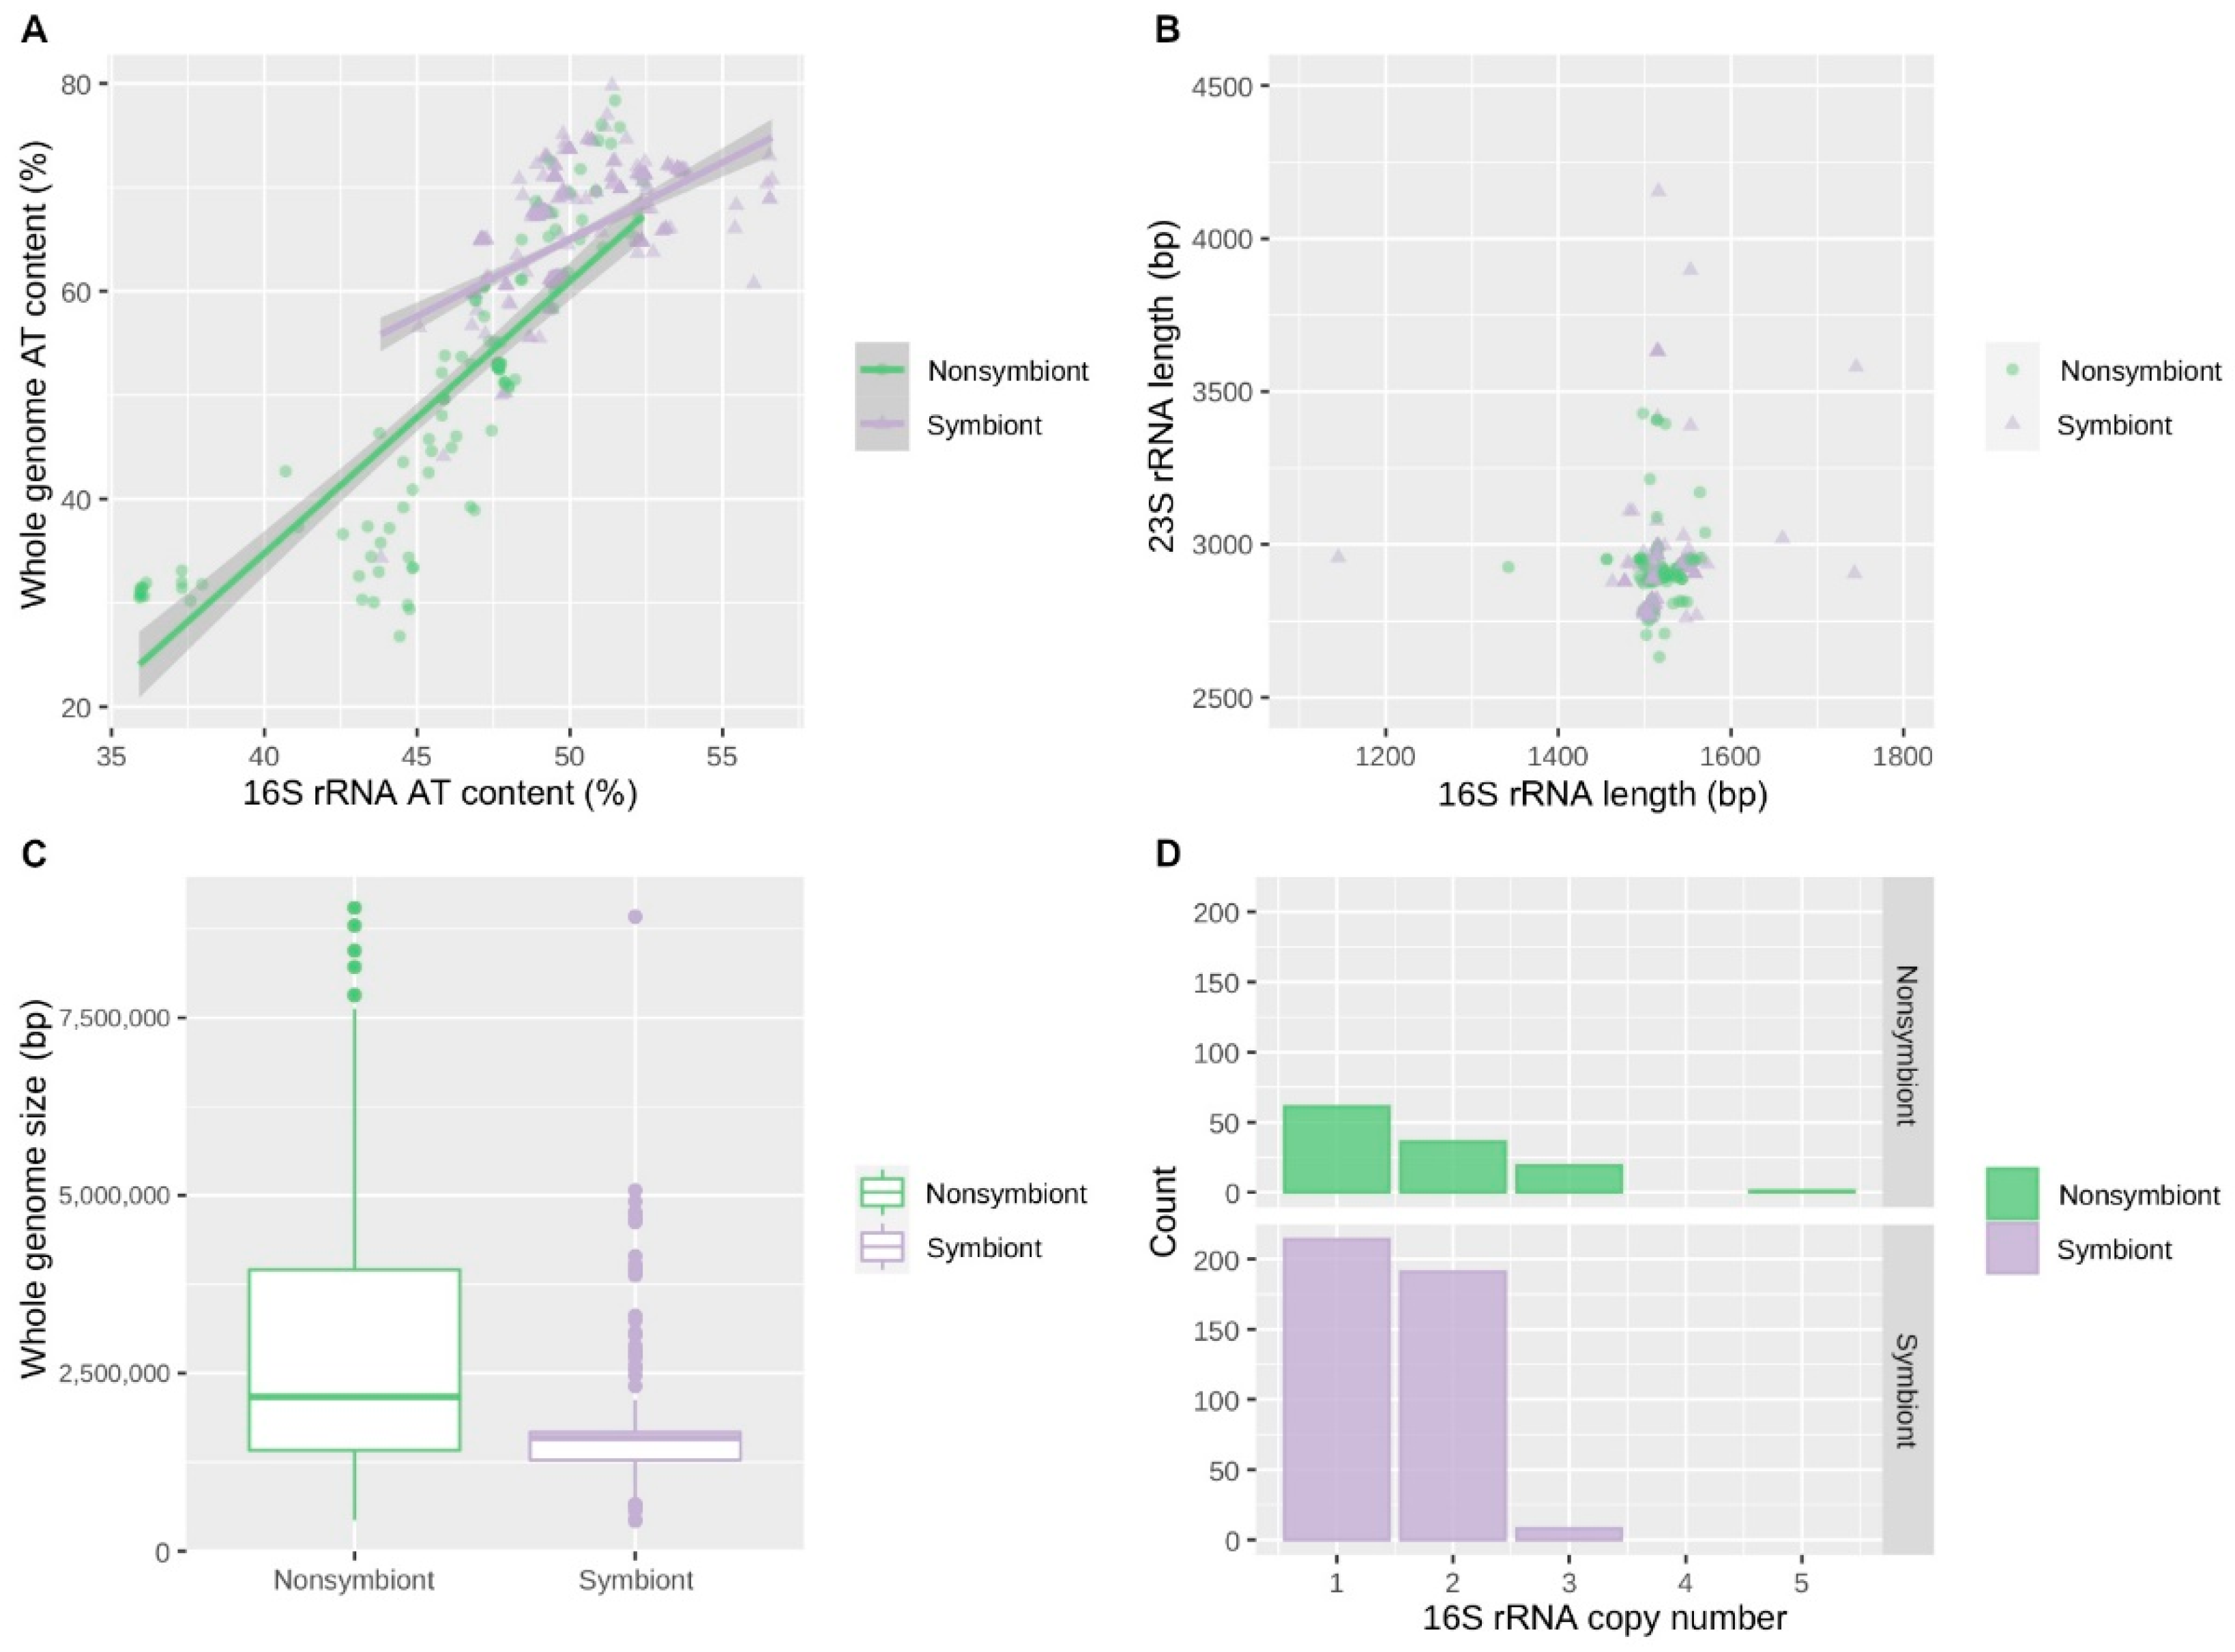
3.2. Correlations between Genomic Features of Symbionts and rRNA Operon Disruption
3.3. Functional Gene Alterations in rRNA Operon-Unlinked Symbionts
4. Discussion
5. Conclusions
Supplementary Materials
Author Contributions
Funding
Conflicts of Interest
References
- Condon, C.; Philips, J.; Fu, Z.-Y.; Squires, C.; Squires, C.L. Comparison of the expression of the seven ribosomal RNA operons in Escherichia coli. EMBO J. 1992, 11, 4175–4185. [Google Scholar] [CrossRef] [PubMed]
- Espejo, R.T.; Plaza, N. Multiple Ribosomal RNA operons in bacteria; Their concerted evolution and potential consequences on the rate of evolution of their 16S rRNA. Front. Microbiol. 2018, 9, 1232. [Google Scholar] [CrossRef] [PubMed]
- Klappenbach, J.A.; Dunbar, J.M.; Schmidt, T.M. rRNA operon copy number reflects ecological strategies of bacteria. Appl. Environ. Microbiol. 2000, 66, 1328–1333. [Google Scholar] [CrossRef]
- Nemergut, D.R.; Knelman, J.E.; Ferrenberg, S.; Bilinski, T.; Melbourne, B.; Jiang, L.; Violle, C.; Darcy, J.L.; Prest, T.; Schmidt, S.K. Decreases in average bacterial community rRNA operon copy number during succession. ISME J. 2016, 10, 1147–1156. [Google Scholar] [CrossRef] [PubMed]
- Roller, B.R.; Stoddard, S.F.; Schmidt, T.M. Exploiting rRNA operon copy number to investigate bacterial reproductive strategies. Nat. Microbiol. 2016, 1, 1–7. [Google Scholar] [CrossRef] [PubMed]
- Sarmientos, P.; Sylvester, J.E.; Contente, S.; Cashel, M. Differential stringent control of the tandem E. coli ribosomal RNA promoters from the rRNA operon expressed in vivo in multicopy plasmids. Cell 1983, 32, 1337–1346. [Google Scholar] [CrossRef]
- Paul, B.J.; Ross, W.; Gaal, T.; Gourse, R.L. rRNA transcription in Escherichia coli. Annu. Rev. Genet. 2004, 38, 749–770. [Google Scholar] [CrossRef]
- Liesack, W.; Stackebrandt, E. Evidence for unlinked rrn operons in the Planctomycete Pirellula marina. J. Bacteriol. 1989, 171, 5025–5030. [Google Scholar] [CrossRef]
- Tu, J.; Zillig, W. Organization of rRNA structural genes in the archaebacterium Thermoplasma acidophilum. Nucleic Acids Res. 1982, 10, 7231–7245. [Google Scholar] [CrossRef][Green Version]
- Munson, M.A.; Baumann, L.; Baumann, P. Buchnera aphidicola (a prokaryotic endosymbiont of aphids) contains a putative 16S rRNA operon unlinked to the 23S rRNA-encoding gene: Sequence determination, and promoter and terminator analysis. Gene 1993, 137, 171–178. [Google Scholar] [CrossRef]
- Bensaadi-Merchermek, N.; Salvado, J.-C.; Cagnon, C.; Karama, S.; Mouchès, C. Characterization of the unlinked 16S rDNA and 23S-5S rRNA operon of Wolbachia pipientis, a prokaryotic parasite of insect gonads. Gene 1995, 165, 81–86. [Google Scholar] [CrossRef]
- Iost, I.; Chabas, S.; Darfeuille, F. Maturation of atypical ribosomal RNA precursors in Helicobacter pylori. Nucleic Acids Res. 2019, 47, 5906–5921. [Google Scholar] [CrossRef] [PubMed]
- Brewer, T.E.; Albertsen, M.; Edwards, A.; Kirkegaard, R.H.; Rocha, E.P.C.; Fierer, N. Unlinked rRNA genes are widespread among bacteria and archaea. ISME J. 2020, 14, 597–608. [Google Scholar] [CrossRef]
- Ciufo, S.; Kannan, S.; Sharma, S.; Badretdin, A.; Clark, K.; Turner, S.; Brover, S.; Schoch, C.L.; Kimchi, A.; Di Cuccio, M. Using average nucleotide identity to improve taxonomic assignments in prokaryotic genomes at the NCBI. Int. J. Syst. Evol. Microbiol. 2018, 68, 2386–2392. [Google Scholar] [CrossRef] [PubMed]
- Merchant, S.; Wood, D.E.; Salzberg, S.L. Unexpected cross-species contamination in genome sequencing projects. PeerJ 2014, 2, e675. [Google Scholar] [CrossRef] [PubMed]
- Steinegger, M.; Salzberg, S.L. Terminating contamination: Large-scale search identifies more than 2,000,000 contaminated entries in GenBank. Genome Biol. 2020, 21, 115. [Google Scholar] [CrossRef]
- Parks, D.H.; Chuvochina, M.; Waite, D.W.; Rinke, C.; Skarshewski, A.; Chaumeil, P.-A.; Hugenholtz, P. A standardized bacterial taxonomy based on genome phylogeny substantially revises the tree of life. Nat. Biotechnol. 2018, 36, 996–1004. [Google Scholar] [CrossRef]
- Chaumeil, P.-A.; Mussig, A.J.; Hugenholtz, P.; Parks, D.H. GTDB-Tk: A toolkit to classify genomes with the Genome Taxonomy Database. Bioinformatics 2019, 36, 1925–1927. [Google Scholar] [CrossRef]
- Matsen, F.A.; Kodner, R.B.; Armbrust, E.V. pplacer: Linear time maximum-likelihood and Bayesian phylogenetic placement of sequences onto a fixed reference tree. BMC Bioinform. 2010, 11, 538. [Google Scholar] [CrossRef]
- Letunic, I.; Bork, P. Interactive Tree of Life (iTOL) v4: Recent updates and new developments. Nucleic Acids Res. 2019, 47, W256–W259. [Google Scholar] [CrossRef]
- Barribeau, S.M.; Parker, B.J.; Gerardo, N.M. Exposure to natural pathogens reveals costly aphid response to fungi but not bacteria. Ecol. Evol. 2014, 4, 488–493. [Google Scholar] [CrossRef] [PubMed]
- Daims, H.; Purkhold, U.; Bjerrum, L.; Arnold, E.; Wilderer, P.A.; Wagner, M. Nitrification in sequencing biofilm batch reactors: Lessons from molecular approaches. Water Sci. Technol. 2001, 43, 9–18. [Google Scholar] [CrossRef]
- Zeng, Y.H.; Koblížek, M.; Li, Y.X.; Liu, Y.P.; Feng, F.Y.; Ji, J.D.; Jian, J.C.; Wu, Z.H. Long PCR-RFLP of 16S-ITS-23S rRNA genes: A high-resolution molecular tool for bacterial genotyping. J. Appl. Microbiol. 2013, 114, 433–447. [Google Scholar] [CrossRef] [PubMed]
- Van Camp, G.; Chapelle, S.; De Wachter, R. Amplification and sequencing of variable regions in bacterial 23S ribosomal RNA genes with conserved primer sequences. Curr. Microbiol. 1993, 27, 147–151. [Google Scholar] [CrossRef] [PubMed]
- Rice, P.; Longden, I.; Bleasby, A. EMBOSS: The European Molecular Biology Open Software Suite. Trends Genet. 2000, 16, 276–277. [Google Scholar] [CrossRef]
- Reyes-Prieto, M.; Vargas-Chávez, C.; Latorre, A.; Moya, A. SymbioGenomesDB: A database for the integration and access to knowledge on host–symbiont relationships. Database 2015, 2015, bav109. [Google Scholar] [CrossRef]
- R Core Team. R: A Language and Environment for Statistical Computing; R Foundation for Statistical Computing: Vienna, Austria, 2018; Volume 2018. [Google Scholar]
- Huerta-Cepas, J.; Forslund, K.; Coelho, L.P.; Szklarczyk, D.; Jensen, L.J.; von Mering, C.; Bork, P. Fast Genome-Wide Functional Annotation through Orthology Assignment by eggNOG-Mapper. Mol. Biol. Evol. 2017, 34, 2115–2122. [Google Scholar] [CrossRef] [PubMed]
- Huerta-Cepas, J.; Szklarczyk, D.; Heller, D.; Hernández-Plaza, A.; Forslund, S.K.; Cook, H.; Mende, D.R.; Letunic, I.; Rattei, T.; Jensen, L.J.; et al. eggNOG 5.0: A hierarchical, functionally and phylogenetically annotated orthology resource based on 5090 organisms and 2502 viruses. Nucleic Acids Res. 2019, 47, D309–D314. [Google Scholar] [CrossRef]
- Eddy, S.R. Accelerated Profile HMM Searches. PLoS Comput. Biol. 2011, 7, e1002195. [Google Scholar] [CrossRef]
- Pinheiro, J.; Bates, D.; DebRoy, S.; Sarkar, D.; Heisterkamp, S.; Van Willigen, B.; Maintainer, R. Package ‘nlme’. Linear Nonlinear Mixed Eff. Model. 2017, 3, 1–336. [Google Scholar]
- Analyses of Phylogenetics and Evolution. Available online: https://cran.stat.unipd.it/web/packages/ape/ape.pdf (accessed on 24 March 2020).
- Whitman, W.B.; Oren, A.; Chuvochina, M.; da Costa, M.S.; Garrity, G.M.; Rainey, F.A.; Rossello-Mora, R.; Schink, B.; Sutcliffe, I.; Trujillo, M.E.; et al. Proposal of the suffix–ota to denote phyla. Addendum to ‘Proposal to include the rank of phylum in the International Code of Nomenclature of Prokaryotes’. Int. J. Syst. Evol. Microbiol. 2018, 68, 967–969. [Google Scholar] [CrossRef] [PubMed]
- Haft, D.H.; DiCuccio, M.; Badretdin, A.; Brover, V.; Chetvernin, V.; O’Neill, K.; Li, W.; Chitsaz, F.; Derbyshire, M.K.; Gonzales, N.R.; et al. RefSeq: An update on prokaryotic genome annotation and curation. Nucleic Acids Res. 2017, 46, D851–D860. [Google Scholar] [CrossRef] [PubMed]
- Toju, H.; Tanabe, A.S.; Notsu, Y.; Sota, T.; Fukatsu, T. Diversification of endosymbiosis: Replacements, co-speciation and promiscuity of bacteriocyte symbionts in weevils. ISME J. 2013, 7, 1378–1390. [Google Scholar] [CrossRef] [PubMed]
- McCutcheon, J.P.; Moran, N.A. Extreme genome reduction in symbiotic bacteria. Nat. Rev. Microbiol. 2012, 10, 13–26. [Google Scholar] [CrossRef] [PubMed]
- Giovannoni, S.J.; Cameron Thrash, J.; Temperton, B. Implications of streamlining theory for microbial ecology. ISME J. 2014, 8, 1553–1565. [Google Scholar] [CrossRef] [PubMed]
- Bechhofer, D.H.; Deutscher, M.P. Bacterial ribonucleases and their roles in RNA metabolism. Crit. Rev. Biochem. Mol. Biol. 2019, 54, 242–300. [Google Scholar] [CrossRef] [PubMed]
- Breitwieser, F.P.; Lu, J.; Salzberg, S.L. A review of methods and databases for metagenomic classification and assembly. Brief. Bioinform. 2019, 20, 1125–1136. [Google Scholar] [CrossRef]
- Denton, J.F.; Lugo-Martinez, J.; Tucker, A.E.; Schrider, D.R.; Warren, W.C.; Hahn, M.W. Extensive Error in the Number of Genes Inferred from Draft Genome Assemblies. PLoS Comput. Biol. 2014, 10, e1003998. [Google Scholar] [CrossRef]
- Bonnet, S.I.; Binetruy, F.; Hernández-Jarguín, A.M.; Duron, O. The tick microbiome: Why non-pathogenic microorganisms matter in tick biology and pathogen transmission. Front. Cell. Infect. Microbiol. 2017, 7, 236. [Google Scholar] [CrossRef]
- Hildebrand, F.; Meyer, A.; Eyre-Walker, A. Evidence of selection upon genomic GC-content in bacteria. PLoS Genet. 2010, 6, e1001107. [Google Scholar] [CrossRef]
- Omelchenko, M.V.; Wolf, Y.I.; Gaidamakova, E.K.; Matrosova, V.Y.; Vasilenko, A.; Zhai, M.; Daly, M.J.; Koonin, E.V.; Makarova, K.S. Comparative genomics of Thermus thermophilus and Deinococcus radiodurans: Divergent routes of adaptation to thermophily and radiation resistance. BMC Evol. Biol. 2005, 5, 57. [Google Scholar] [CrossRef] [PubMed]
- Kumwenda, B.; Litthauer, D.; Reva, O. Analysis of genomic rearrangements, horizontal gene transfer and role of plasmids in the evolution of industrial important Thermus species. BMC Genom. 2014, 15, 813. [Google Scholar] [CrossRef] [PubMed]
- McMurdie, P.J.; Behrens, S.F.; Müller, J.A.; Göke, J.; Ritalahti, K.M.; Wagner, R.; Goltsman, E.; Lapidus, A.; Holmes, S.; Löffler, F.E. Localized plasticity in the streamlined genomes of vinyl chloride respiring Dehalococcoides. PLoS Genet. 2009, 5, e1000714. [Google Scholar] [CrossRef] [PubMed]
- Hurst, L.D.; Merchant, A.R. High guanine–cytosine content is not an adaptation to high temperature: A comparative analysis amongst prokaryotes. Proc. R. Soc. Lond. Ser. B Biol. Sci. 2001, 268, 493–497. [Google Scholar] [CrossRef] [PubMed]
- Musto, H.; Naya, H.; Zavala, A.; Romero, H.; Alvarez-Valín, F.; Bernardi, G. Correlations between genomic GC levels and optimal growth temperatures in prokaryotes. FEBS Lett. 2004, 573, 73–77. [Google Scholar] [CrossRef] [PubMed]
- Srivastava, A.K.; Schlessinger, D. Mechanism and regulation of bacterial ribosomal RNA processing. Annu. Rev. Microbiol. 1990, 44, 105–129. [Google Scholar] [CrossRef]
- Kaczanowska, M.; Rydén-Aulin, M. Ribosome biogenesis and the translation process in Escherichia coli. Microbiol. Mol. Biol. Rev. 2007, 71, 477–494. [Google Scholar] [CrossRef]
- George, E.E.; Husnik, F.; Tashyreva, D.; Prokopchuk, G.; Horák, A.; Kwong, W.K.; Lukeš, J.; Keeling, P.J. Highly Reduced Genomes of Protist Endosymbionts Show Evolutionary Convergence. Curr. Biol. 2020, 30, 925–933.e923. [Google Scholar] [CrossRef]
- Moran, N.A.; Dunbar, H.E.; Wilcox, J.L. Regulation of Transcription in a Reduced Bacterial Genome: Nutrient-Provisioning Genes of the Obligate Symbiont Buchnera aphidicola. J. Bacteriol. 2005, 187, 4229. [Google Scholar] [CrossRef]
- Knobloch, S.; Jóhannsson, R.; Marteinsson, V.Þ. Genome analysis of sponge symbiont ‘Candidatus Halichondribacter symbioticus’ shows genomic adaptation to a host-dependent lifestyle. Environ. Microbiol. 2020, 22, 483–498. [Google Scholar] [CrossRef]
- Hirokawa, G.; Nijman, R.M.; Raj, V.S.; Kaji, H.; Igarashi, K.; Kaji, A. The role of ribosome recycling factor in dissociation of 70S ribosomes into subunits. RNA 2005, 11, 1317–1328. [Google Scholar] [CrossRef] [PubMed][Green Version]
- Piir, K.; Paier, A.; Liiv, A.; Tenson, T.; Maiväli, U. Ribosome degradation in growing bacteria. EMBO Rep. 2011, 12, 458–462. [Google Scholar] [CrossRef] [PubMed]
- Zundel, M.A.; Basturea, G.N.; Deutscher, M.P. Initiation of ribosome degradation during starvation in Escherichia coli. RNA 2009, 15, 977–983. [Google Scholar] [CrossRef] [PubMed]
- Lankiewicz, T.S.; Cottrell, M.T.; Kirchman, D.L. Growth rates and rRNA content of four marine bacteria in pure cultures and in the Delaware estuary. ISME J. 2016, 10, 823–832. [Google Scholar] [CrossRef] [PubMed]
- La Manno, G.; Soldatov, R.; Zeisel, A.; Braun, E.; Hochgerner, H.; Petukhov, V.; Lidschreiber, K.; Kastriti, M.E.; Lönnerberg, P.; Furlan, A.; et al. RNA velocity of single cells. Nature 2018, 560, 494–498. [Google Scholar] [CrossRef] [PubMed]
- Mackie, G.A. RNase E: At the interface of bacterial RNA processing and decay. Nat. Rev. Microbiol. 2013, 11, 45–57. [Google Scholar] [CrossRef]
- Kennell, D. Processing endoribonucleases and mRNA degradation in bacteria. J. Bacteriol. 2002, 184, 4645–4665. [Google Scholar] [CrossRef][Green Version]
- Li, Z.; Pandit, S.; Deutscher, M.P. Maturation of 23S ribosomal RNA requires the exoribonuclease RNase T. RNA 1999, 5, 139–146. [Google Scholar] [CrossRef][Green Version]
- Ishii, R.; Nureki, O.; Yokoyama, S. Crystal Structure of the tRNA Processing Enzyme RNase PH from Aquifex aeolicus. J. Biol. Chem. 2003, 278, 32397–32404. [Google Scholar] [CrossRef]
- Sulthana, S.; Basturea, G.N.; Deutscher, M.P. Elucidation of pathways of ribosomal RNA degradation: An essential role for RNase E. RNA 2016, 22, 1163–1171. [Google Scholar] [CrossRef]
- Fessler, M.; Gummesson, B.; Charbon, G.; Svenningsen, S.L.; Sørensen, M.A. Short-term kinetics of rRNA degradation in Escherichia coli upon starvation for carbon, amino acid or phosphate. Mol. Microbiol. 2020, 113, 951–963. [Google Scholar] [CrossRef] [PubMed]


Publisher’s Note: MDPI stays neutral with regard to jurisdictional claims in published maps and institutional affiliations. |
© 2020 by the authors. Licensee MDPI, Basel, Switzerland. This article is an open access article distributed under the terms and conditions of the Creative Commons Attribution (CC BY) license (http://creativecommons.org/licenses/by/4.0/).
Share and Cite
Ahn, H.; Seol, D.; Cho, S.; Kim, H.; Kwak, W. Enhanced Symbiotic Characteristics in Bacterial Genomes with the Disruption of rRNA Operon. Biology 2020, 9, 440. https://doi.org/10.3390/biology9120440
Ahn H, Seol D, Cho S, Kim H, Kwak W. Enhanced Symbiotic Characteristics in Bacterial Genomes with the Disruption of rRNA Operon. Biology. 2020; 9(12):440. https://doi.org/10.3390/biology9120440
Chicago/Turabian StyleAhn, Hyeonju, Donghyeok Seol, Seoae Cho, Heebal Kim, and Woori Kwak. 2020. "Enhanced Symbiotic Characteristics in Bacterial Genomes with the Disruption of rRNA Operon" Biology 9, no. 12: 440. https://doi.org/10.3390/biology9120440
APA StyleAhn, H., Seol, D., Cho, S., Kim, H., & Kwak, W. (2020). Enhanced Symbiotic Characteristics in Bacterial Genomes with the Disruption of rRNA Operon. Biology, 9(12), 440. https://doi.org/10.3390/biology9120440