1. Introduction
Preeclampsia (PE) is a pregnancy-specific disorder characterized by the onset of hypertension after 20 weeks of gestation, accompanied by at least one additional complication. These may include proteinuria, maternal organ dysfunction (such as acute kidney injury, hepatic impairment, neurological symptoms, hemolysis, or thrombocytopenia), or evidence of uteroplacental dysfunction, including fetal growth restriction (FGR) or an imbalance in angiogenic factors [
1]. PE is also recognized as an inflammatory disease. Women with PE exhibit a state of chronic inflammation, and inflammatory markers such as C-reactive protein (CRP) and interleukins are frequently altered. Globally, preeclampsia (PE) affects approximately 2–8% of pregnancies and remains a leading cause of adverse maternal and fetal outcomes, including placental abruption, preterm delivery, and fetal growth restriction (FGR) [
2]. To date, delivery of the fetus remains the only definitive intervention, which contributes to high rates of preterm birth and associated neonatal complications [
3]. Although abnormal placentation is widely recognized as a key event in the pathogenesis of PE, the underlying mechanisms remain poorly understood due to its complex, multisystemic nature. A hallmark feature of PE is the insufficient invasion of extravillous trophoblasts (EVTs) and the inadequate remodeling of spiral arteries, resulting in reduced placental perfusion and hypoxia [
4]. This ischemic state is accompanied by mitochondrial dysfunction and oxidative stress, leading to increased placental apoptosis and fetal growth restriction [
5].
Mitochondria are often referred to as the “powerhouses” of the cell, as they are responsible for ATP production through oxidative phosphorylation [
6]. The placenta—particularly its central functional unit, the trophoblastic villous or villous tree—exhibits a high metabolic rate due to the elevated mitochondrial content in its two main cell types: the cytotrophoblast (CTB) and the syncytiotrophoblast (STB). The STB arises from the fusion of cells in the underlying CTB layer. Notably, CTB and STB mitochondria differ in both structure and function, with STB mitochondria being 2–10 times smaller and displaying reduced respiratory capacity, membrane potential, and antioxidant activity [
7]. Accumulating evidence indicates that mitochondrial dysfunction and elevated oxidative stress are consistently observed in placentas from women with PE [
8]. Our group previously reported that the mitochondrial β-oxidation pathway of fatty acids is reduced in placental tissue from pregnancies complicated by PE [
9]. Structural mitochondrial abnormalities—such as swelling, disrupted cristae, and even mitochondrial depletion—have also been documented in trophoblastic cells from PE placentas [
10]. In PE, uteroplacental hypoxia increases oxidative stress in placental cells. Reactive oxygen species (ROS) promote mitochondrial lipid peroxidation in these cells [
11]. These morphological and functional mitochondrial defects are believed to play a major role in disease progression, although the precise regulatory mechanisms and causal factors remain to be elucidated.
Evidence indicates that mitochondrial fission and fusion processes are dysregulated in PE. Mitofusin 2 (Mfn2), an outer mitochondrial membrane protein, plays a crucial role in maintaining mitochondrial fusion and network integrity. Reduced ATP levels and decreased Mfn2 gene expression have been reported in placentas from PE pregnancies [
12]. Autophagy is essential for cellular homeostasis, and mitophagy represents the selective autophagic process targeting mitochondria. However, reports on mitophagy activation in PE placentas are conflicting. A decrease in BNIP3 expression, a key regulator of mitophagy, has been observed in PE placentas, accompanied by accumulation of p62. These changes were associated with reduced autophagy/mitophagy, accumulation of damaged mitochondria, and increased ROS levels [
13]. Conversely, another study reported increased expression of the 63 kDa pro-mitophagy form of PINK1 and Parkin in PE placentas, suggesting potential activation of mitophagy. Transmission electron microscopy in the same study revealed evidence of mitophagy occurring specifically in placental CTB [
14]. The observation of mitophagy activation by electron microscopy provides direct evidence that extends beyond the analysis of mitophagy-related gene expression. This finding strongly supports the notion that mitophagy is activated during PE, at least in CTB.
Coenzyme Q
10 (CoQ
10), a lipid-soluble molecule located in the inner mitochondrial membrane, plays a crucial role in the electron transport chain and ATP production via oxidative phosphorylation. Additionally, it functions as a potent antioxidant, particularly protecting against lipid peroxidation [
15]. By maintaining mitochondrial bioenergetic homeostasis and reducing ROS, CoQ
10 may help preserve mitochondrial function in the placenta. In PE, oxidative stress and mitochondrial dysfunction are key hallmarks of placental pathology, and an imbalance in CoQ
10 may further exacerbate these alterations. The CTB contains a higher number of mitochondria that are metabolically more active than those in the STB. Therefore, we hypothesize that CoQ
10 plays a particularly critical role in the CTB. Studies linking PE and CoQ
10 are limited. In healthy pregnant Ecuadorian women, plasma CoQ
10 levels have been reported to increase by 33%. However, in women with PE, CoQ
10 levels are decreased in both umbilical cord blood (−67%) and maternal blood (−33%), in contrast to other lipids such as cholesterol. Conversely, placental tissue from women with PE shows an increase in CoQ
10 levels (68%) [
16]. A negative correlation has also been observed between CoQ
10 levels in amniotic fluid during the second trimester and newborn weight [
17]. In a clinical study involving 235 pregnant women at risk of PE, participants received either a placebo or 200 mg of CoQ
10 daily from week 20 until delivery; 47 women developed PE, with 30 in the control group and 17 in the CoQ
10-treated group. The study concluded that CoQ
10 supplementation reduced the risk of developing PE in at-risk women [
18]. Furthermore, in a murine model of PE induced by Nω-Nitro-l-argininemethyl ester (L-NAME) at 200 mg/kg, CoQ
10 administration alleviated PE symptoms by improving placental mitochondrial function, thereby contributing to reductions in blood pressure and proteinuria [
19]. The protective effects of CoQ
10 may arise from enhanced mitochondrial bioenergetics and reduced oxidative stress, which in turn can improve endothelial function, increase nitric oxide bioavailability, and support renal function. These data indicate that CoQ
10 represents a promising therapeutic approach for the management of PE.
This study aims to further investigate the relationship between placental mitochondrial function and PE, as well as the possible involvement of CoQ10 in the disease. To this end, we performed mitochondrial isolation from placental trophoblasts, with particular attention to distinguishing mitochondria derived from CTB and STB. Based on the experimental observations, we describe an exploratory framework in which PE is associated with oxidative stress and mitochondrial alterations, together with changes consistent with mitophagy activation and increased CoQ10 content per CS. Importantly, these alterations appear to occur specifically in CTB and were not observed in STB. Both mitophagy and elevated CoQ10 levels may represent cellular defense mechanisms. This approach provides new insights into the contribution of placental mitochondrial dysfunction to PE pathogenesis and may help guide future mechanistic studies focused on placental mitochondrial function.
2. Materials and Methods
2.1. Study Design and Participant Details
A cross-sectional analytical study was conducted involving pregnant women diagnosed with early-onset PE and women with healthy, uncomplicated singleton pregnancies (controls). Early-onset PE was selected because this subtype is more frequently associated with placental mitochondrial dysfunction and oxidative stress compared with late-onset PE. The participants were recruited at the University Hospital “Puerta del Mar” in Cádiz, in collaboration with the Department of Obstetrics and Gynecology and the Research Unit of INIBICA. Exclusion criteria for all the participants were congenital malformations or abnormal karyotype, gestational diabetes mellitus, obesity (BMI ≥ 30 kg/m2), multiple gestation, autoimmune diseases, maternal smoking, infertility treatments, conception by assisted reproductive technologies, or any other significant condition that could interfere with the study of mitochondrial function. Specific exclusion criteria for control pregnancies included hypertension and/or proteinuria. The study included participants undergoing scheduled cesarean section. We excluded vaginal deliveries to avoid the possible effect of labor exertion on placental mitochondrial metabolism. Control term placentas (n = 13) and PE-complicated placentas (n = 11) were collected from 24 pregnant women. PE was diagnosed based on the following criteria: healthy, normotensive women with a blood pressure recording of 140/90 mmHg on 2 occasions for at least 4 h intervals after week 20 of pregnancy and presence of proteinuria (300 mg per 24 h that was assessed by 24 h urine collections) and/or altered angiogenic ratio (sFlt-1/PlGF). All participants provided written informed consent after receiving detailed patient information sheets according to the Cádiz Research Ethics Committee (protocol code 166.22).
2.2. Sample Collection, Storage, and Assessment of Biochemical Parameters
Clinical and demographic data from the subjects were collected from medical records and recorded in protected databases. Placental samples were collected within the first 30 min after cesarean delivery. The placenta explants were obtained from the paracentral region of the placenta, specifically from the villous trophoblast, avoiding blood vessels. The placenta explants were washed twice in phosphate-buffered saline (PBS) until all traces of blood were removed, frozen in liquid nitrogen, and stored at −80 °C. Additionally, maternal blood was obtained on the day of the scheduled cesarean section for biochemical analysis. The measurement of biochemical variables in blood was carried out at our hospital using standardized methods routinely employed for patient blood analyses. All biological specimens were labeled and preserved to ensure sample traceability and participant anonymity.
2.3. Mitochondria Purification
Mitochondria-enriched fractions from CTB and STB were prepared using a modified protocol from [
20]. The mitochondria of both STB and CTB could be separated by differential centrifugation due to their different sizes. In brief, 8 g of villous trophoblast was homogenized using the gentleMACS™ Octo Dissociator (Miltenyi Biotec, Aubur, CA, USA) with the “Human mito-tissue” (software version GM_V02.H21) program, in a specific buffer containing 1 mM EDTA, 10 mM Tris (pH 7.4), 250 mM sucrose, and protease inhibitors. The homogenate was then subjected to multiple rounds of sequential centrifugation to isolate the cytosol-enriched and mitochondria-enriched fractions from CTB and STB. The resulting fractions were aliquoted to be thawed only once, frozen in liquid nitrogen, and stored at −80 °C until analysis.
2.4. Citrate Synthase Activity Assay
Citrate synthase (CS) activity, a standard marker of mitochondrial quantity, was determined spectrophotometrically following the protocol described by Spinazzi et al. [
21]. In brief, 3 µL of mitochondria-enriched fractions were added to a cuvette with 317 µL of MilliQ H
2O, 500 µL of 200 mM Tris pH = 8 with 0.2% Triton, 100 µL of 1 mM DTNB, and 30 µL of 10 mM acetyl-CoA. After this, the absorbance was measured continuously at 412 nm after adding 50 µL of 10 mM oxalacetic acid. Enzymatic activity was calculated from the slope of the absorbance curve and normalized to total protein concentration using the following formula: Enzyme activity (nmol·min
−1·mg
−1) = (∆Absorbance/min × 1000)/[(extinction coefficient × volume of sample in mL) × protein concentration in mg/mL].
2.5. RNA Isolation, Reverse Transcription, and Quantitative PCR
Total RNA was isolated from 100 mg of placental explant using PRImeZOL™ Reagent (Canvax, Valladolid, Spain). RNA concentrations were quantified using the NanoDrop One Microvolume UV-Vis Spectrophotometer (Thermo Fisher Scientific, Waltham, MA, USA). Only 260/280 nm ratios between 1.8 and 2.0 samples were accepted. The mRNA was reverse-transcribed into cDNA using the iScript™ cDNA Synthesis Kit (Bio-Rad, Hercules, CA, USA). Quantitative PCR (qPCR) was performed on a CFX Connect Real-Time PCR Detection System (Bio-Rad, Hercules, CA, USA), using iTaq™ Universal SYBR
® Green Supermix (Bio-Rad, Hercules, CA, USA) and primers listed in
Table A1. Relative mRNA levels were analyzed using the 2
−ΔΔCT method and normalized to β-actin [
22].
2.6. DNA Isolation and Quantification of mtDNA
Total DNA was isolated from 25 mg of placental explant using Quick-DNA™ miniprep Plus kit (ZYMO Research, Irvine, CA, USA), following the manufacturer’s recommendations. Samples were incubated with proteinase K overnight at 55 °C. The mtDNA content in 50 ng of total DNA was measured by qPCR as described in 2.5. The PCR program (Bio-Rad CFX Maestro 1.1) consisted of an initial 10 min denaturation step at 95 °C followed by 40 cycles of denaturation (15 sec at 95 °C) and annealing/extension (1 min at 60 °C). The analyzed genes were the mitochondrial
12S-rRNA gene and the nuclear
HPRT1 gene. The primers are listed in
Table A1. For determining mtDNA copy number an independent standard curve was generated for each gene (
12S-rRNA and
HPRT1). mtDNA copy number values were expressed by the ratio
12S rRNA/HPRT1.
2.7. Western Blot
Western blot assays were performed to quantify protein content in placental samples. Samples were homogenized manually and subsequently in RIPA lysis buffer (Thermo Scientific, Waltham, MA, USA). Protein concentration was determined using the BCA Protein Assay Kit (Thermo Scientific) following the manufacturer’s instructions. A total of 20 µg of protein for total extract or 15 µg for mitochondria-enriched samples was loaded onto 15% denaturing SDS-PAGE gels. Separated proteins were transferred to polyvinylidene fluoride (PVDF) membranes (Immobilon-P; Millipore, Burlington, MA, USA), which were blocked with 5% skim milk in TBS-T and incubated overnight at 4 °C with primary antibodies. Membranes were then incubated with specific secondary antibodies for 1 h at room temperature. All antibodies used in the study are listed in
Table A2. Detection was performed by chemiluminescence using the WesternBright™ ECL kit (Advansta, San Jose, CA, USA), and signals were visualized with a ChemiDoc imaging system (Bio-Rad, Hercules, CA, USA). Band quantification was performed by densitometric analysis using ImageJ software (version 1.54g).
2.8. Quantification of Coenzyme Q10
CoQ10 level in placental tissue and mitochondria-enriched fractions was measured using a standard protocol for total CoQ extraction from cells, with specific modifications for tissue homogenization. For explant samples, tissue was manually homogenized using a glass-glass Dounce homogenizer (Sigma-Aldrich, St. Louis, MO, USA). Protein concentration was determined using the BCA assay, and the volume corresponding to 0.5 mg of protein for tissue samples or 0.2 mg for mitochondria-enriched samples was used. Next, 10 µM of an internal ubiquinone standard (CoQ6), 10× SDS, 300 µL of an ethanol/isopropanol mixture (95:5), and 700 µL of hexane were added. The samples were centrifuged at 1000× g for 5 min at 4 °C. The organic phase was evaporated in a SpeedVac™ DNA 130 concentrator (Thermo Scientific™, Waltham, MA, USA) at 40 °C. The dry residue was resuspended in a methanol/propanol (80:20) mixture. Two aliquots of 50 µL of the extract was directly injected into a HPLC system with a C18 reversed-phase column (15 cm, Phenomenex, Torrance, CA, USA), and a Coulochem III electrochemical detector (ECD) (Thermo Scientific™, Waltham, MA, USA). Final quantification was performed using an internal standard (CoQ6) and an external CoQ10 standard. CoQ10 levels were normalized to total protein content in whole tissue extracts, whereas in mitochondria-enriched fractions, normalization was performed using citrate synthase activity, which was predefined as the primary metric for data interpretation.
2.9. Statistical Analysis
All data are presented as the mean ± standard deviation (SD). Student’s t-test was used to compare differences between two groups, and one-way ANOVA was applied for comparisons among three or more experimental groups. Statistical analyses were performed using GraphPad Prism 8 software. A p-value < 0.05 was considered statistically significant.
2.10. Study Limitations
This study has several limitations that should be acknowledged. First, although the sample size is comparable to that of previous studies investigating placental mitochondrial metabolism in preeclampsia, some analyses were performed in smaller subsets due to the limited availability of mitochondrial material. This may reduce the generalisability of the findings.
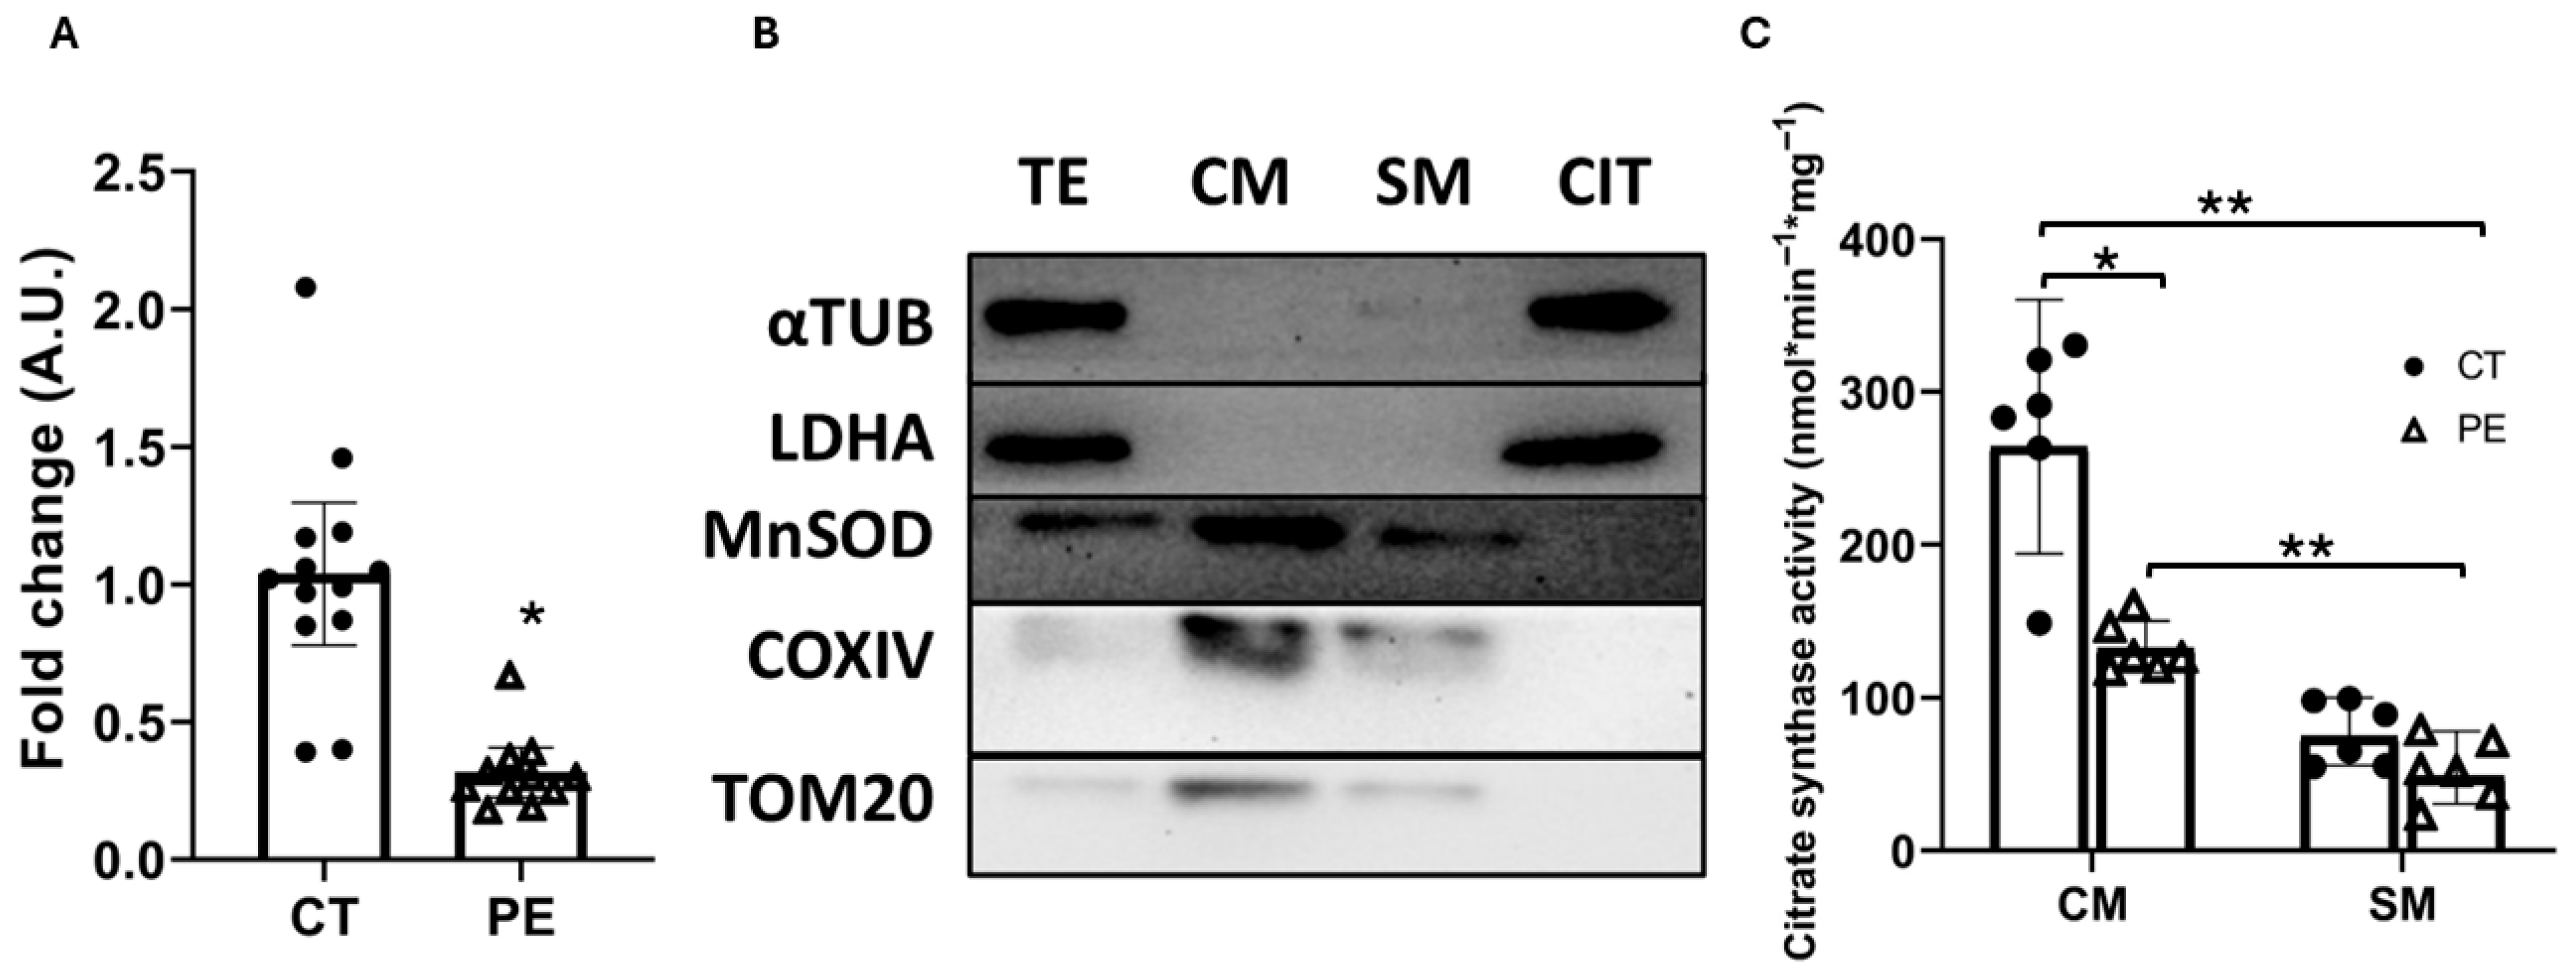
Second, mitochondria-enriched fractions were analyzed rather than fully purified mitochondrial preparations. While cytosolic contamination was negligible, as indicated by the absence of LDHA, contamination from other organelles, such as the endoplasmic reticulum, cannot be entirely excluded.
Third, mitophagy was evaluated using static markers, and no dynamic mitophagy flux assays were performed. As a result, any conclusions regarding mitophagy are indirect and should be interpreted cautiously. Future studies employing lysosomal inhibition or other flux-based methodologies will be required to directly assess mitophagy dynamics.
In addition, protein-based normalization was applied for some mitochondrial measurements. Although this approach is commonly used, disease-associated alterations in mitochondrial mass or protein composition in preeclampsia may influence normalization accuracy.
Finally, although statistical analyses were limited to pairwise comparisons using Student’s t-test, multiple independent tests were conducted across different parameters, which may increase the risk of type I error.
Overall, in light of these limitations, this study should be considered exploratory and hypothesis-generating. The findings represent preliminary, cell-type-specific observations that generate testable hypotheses for future mechanistic and interventional studies in preeclampsia.
4. Discussion
This study investigates the relationship between PE pathology and placental mitochondrial dysfunction. Our findings support the notion that mitochondrial impairment in the placental trophoblast plays a key role in the pathophysiology of PE, with a particularly pronounced effect on the CTB. We emphasize the importance of this cell type relative to the STB. Clinically, significant differences were observed in common PE-related variables, including neonatal weight, placental weight, and gestational age. The latter two parameters are known to be negatively associated with impaired fetal development and maturation, as reflected by the high incidence of FGR in the PE group. Additionally, pregnant women with PE exhibited a significantly higher average BMI (overweight, BMI ≥ 25), a recognized risk factor for developing PE [
27]. Biochemically, we detected elevated inflammatory markers, such as CRP and IL-6, consistent with the systemic inflammatory state previously reported in PE [
28]. Together, these clinical and biochemical data indicate that the placental samples analyzed reflect typical features of PE.
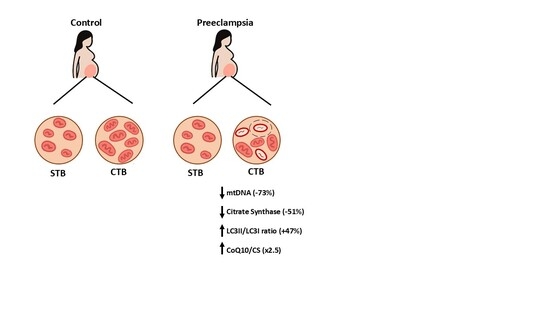
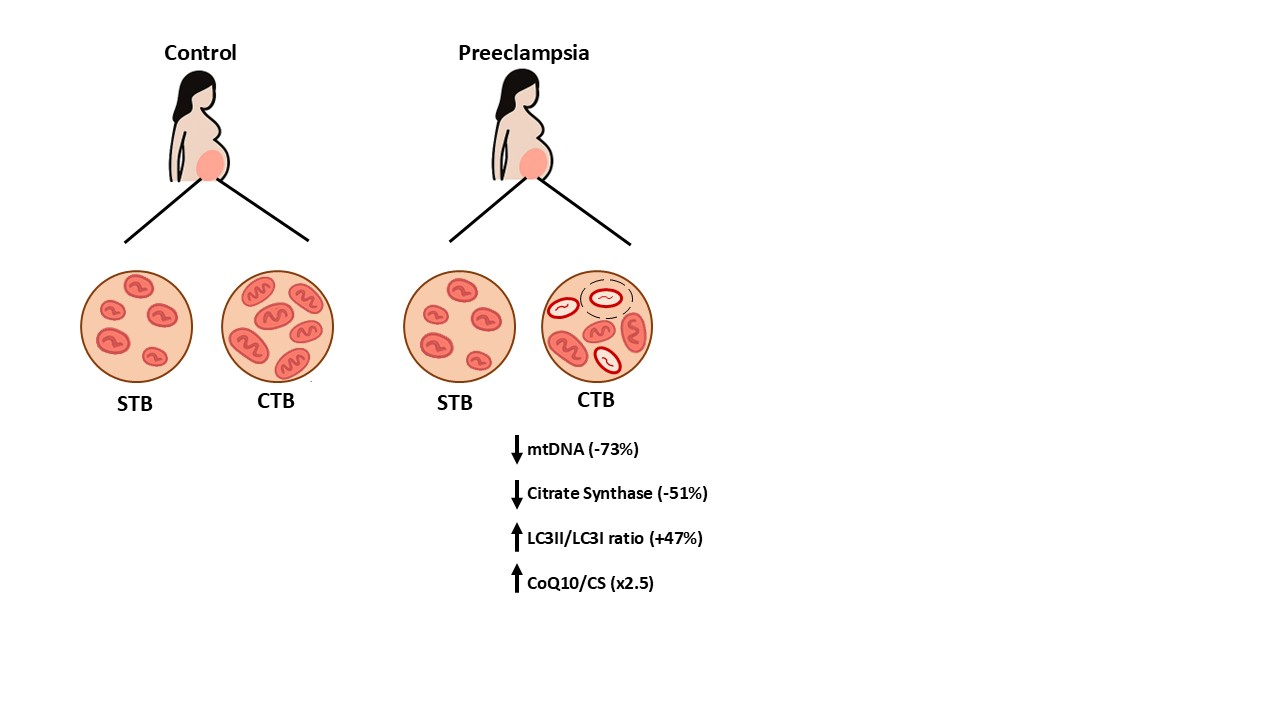
In terms of mitochondrial analysis, we observed a 73% reduction in mtDNA copies in PE placentas, consistent with the presence of mitochondrial dysfunction accompanied by a marked reduction in mitochondrial number. As a second marker of mitochondrial health, we measured CS activity and detected a 51% reduction in CM in PE, in agreement with the decline in mtDNA copy number. CS activity is a marker of mitochondrial mass and also reflects the bioenergetic status of mitochondria. Clinically, it is a widely used marker for the diagnosis of mitochondrial diseases, as it provides an estimate of functional mitochondrial mass. Similarly, the antioxidant enzyme MnSOD serves as an additional marker of antioxidant capacity and, consequently, of the amount of functional mitochondria. In our data, we quantified MnSOD levels by Western blot and also observed a pronounced decrease (−32%) in CTB during PE. Taken together, the mtDNA copy number, CS activity, and MnSOD content are consistent with the presence of mitochondrial dysfunction—possibly associated with a reduction in mitochondrial mass—specifically in CTB during PE. This dysfunction was not observed with the same severity in STB.
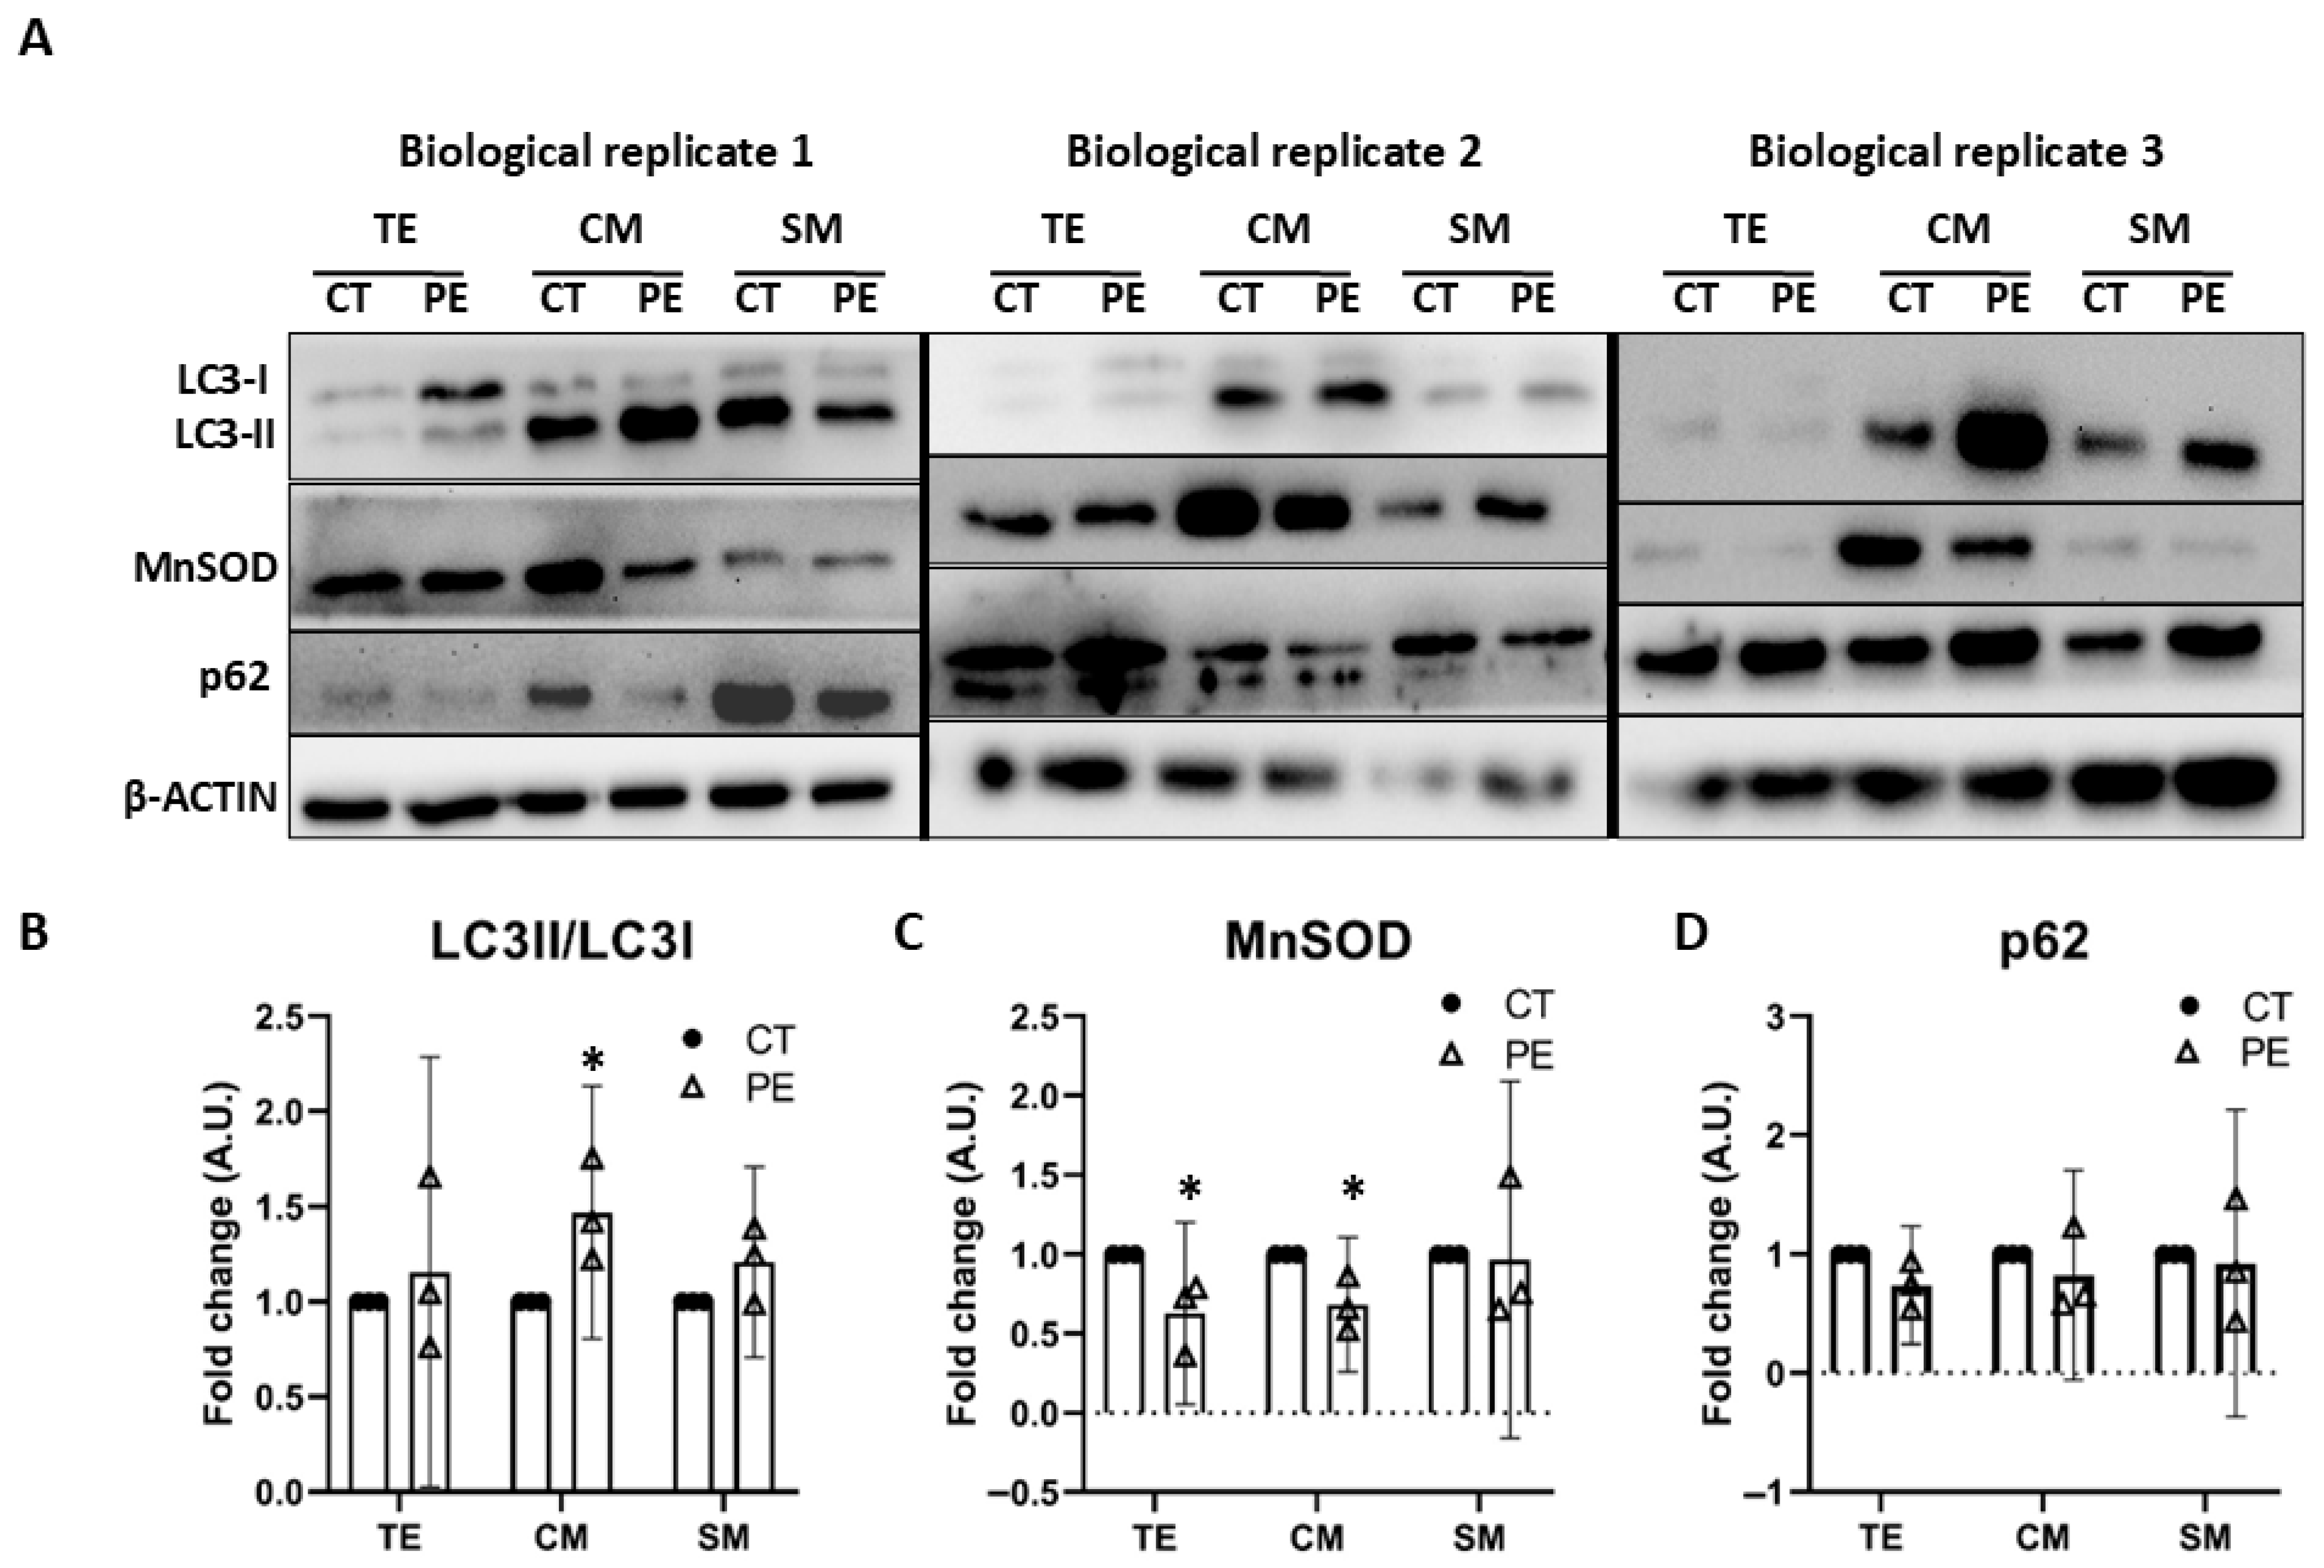
After identifying the mitochondrial dysfunction in placental CTB, we sought to determine whether this dysfunction was accompanied by variations in markers related to mitophagy. In CM, we observed a significant 47% increase in the LC3II/LC3I ratio and a 32% decrease in MnSOD levels. These findings are compatible with an activation of mitophagy in this cell type. The decrease in MnSOD levels in CTB, together with the decline in CS activity, supports the presence of mitochondrial dysfunction and a reduction in the amount of functional mitochondria. Consequently, an increase in mitophagy is expected, as suggested by the elevated LC3II/LC3I ratio in this cell type. This phenomenon appears specific to CTB and was not observed in STB. Previous studies have reported structures indicative of mitophagy in CTB from PE placentas [
14], but these observations were neither quantified nor demonstrated to be cell-type specific. Nonetheless, we cannot exclude the alternative possibility that the observed LC3 lipidation occurs independently of autophagic flux. Importantly, mitophagy seems to be activated in CTB during PE—pending confirmation from further studies—and our data suggest that autophagic flux remains functional, as no accumulation of p62 was detected. We therefore propose that CTB exhibits mitochondrial dysfunction accompanied by an increased LC3II/LC3I ratio, suggesting—and consistent with previous reports—a role for mitophagy in CTB during PE.
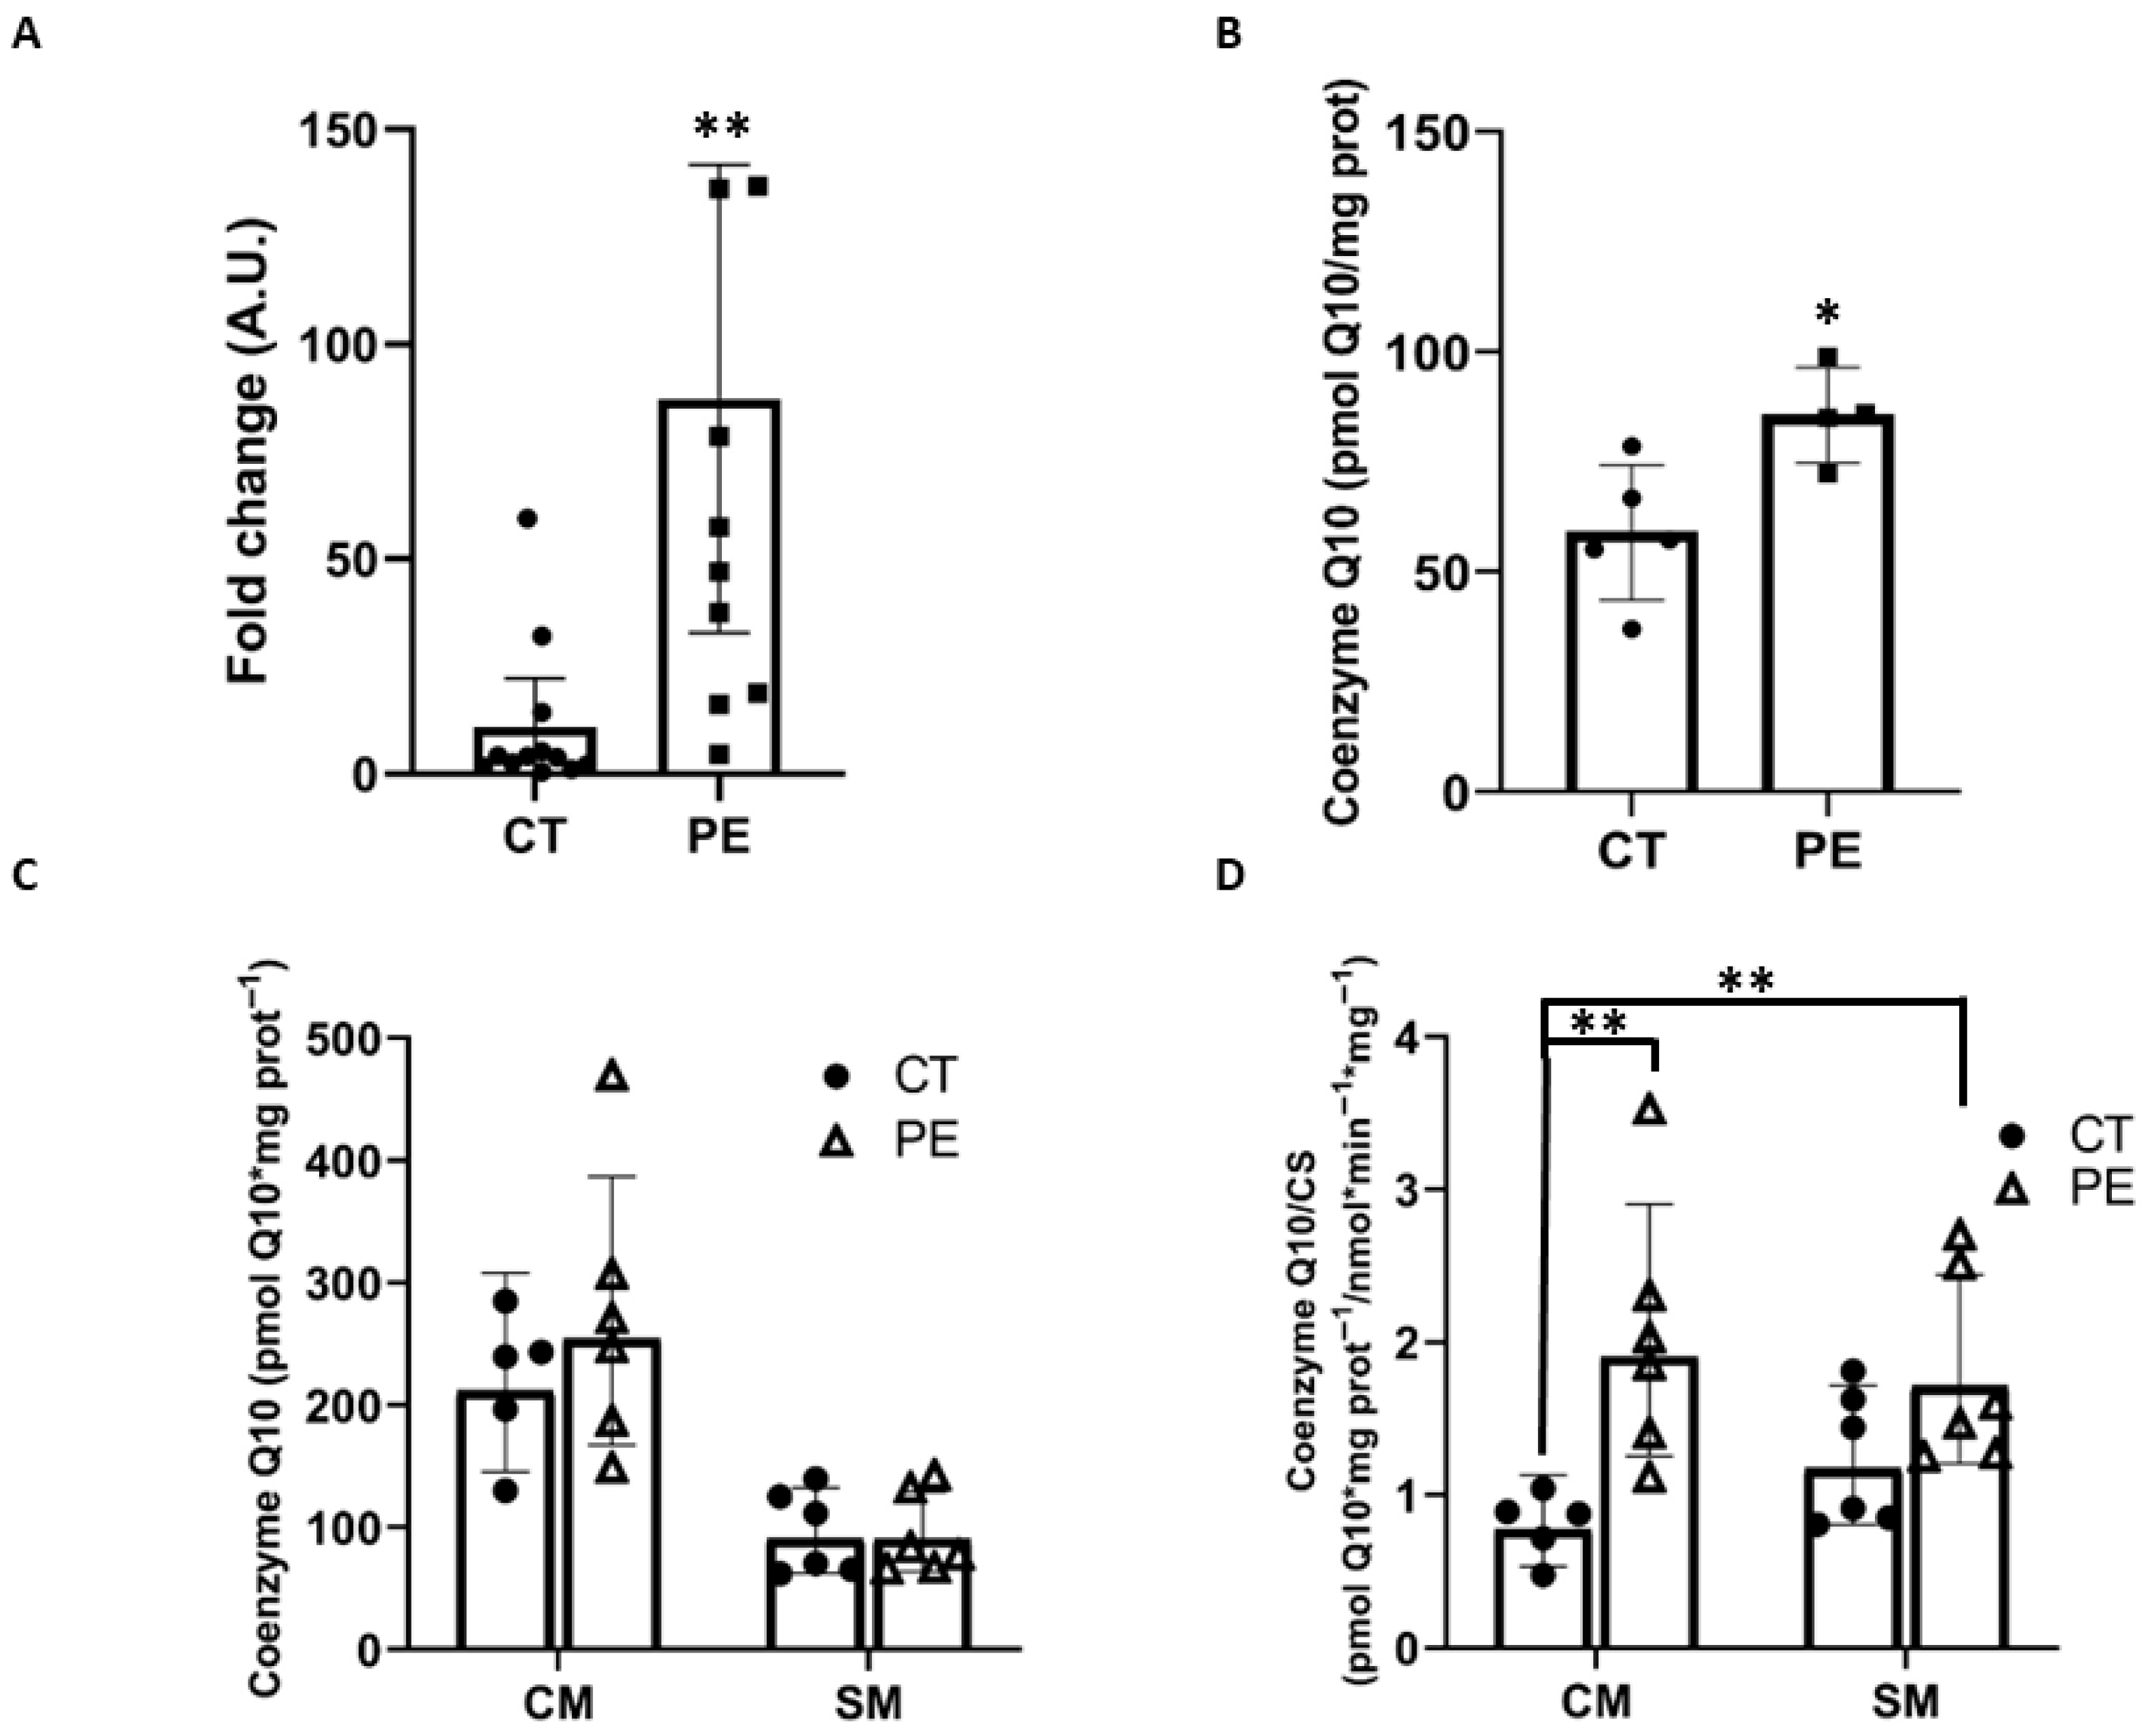
On the other hand, we observed a significant upregulation of COQ2, a key gene in the CoQ10 biosynthesis pathway, in placentas with PE. Furthermore, CoQ10 levels in placental tissue were increased by 31% in PE, a more moderate elevation than previously reported. This discrepancy may be explained by differences in study populations. In the study by Terán et al., participants were women residing in Quito (2800 m above sea level), all under 25 years of age, nulliparous, and with unspecified placental sampling regions. In contrast, our cohort included women living in Cádiz (at sea level), with a mean age of 33.3 years, including both nulliparous and multiparous participants, and placental trophoblast tissue was consistently sampled. When analyzing CoQ10 levels in mitochondrial fractions, no statistically significant differences were observed; however, there was a slight tendency for CoQ10 to increase in CTB in PE. Importantly, the observed mitochondrial dysfunction in CTB during PE must be taken into account when evaluating CoQ10 levels in these fractions. As previously discussed, the data on mtDNA copy number, CS activity, and MnSOD levels indicate a reduction in functional mitochondrial mass in CTB. Under these conditions, a proportional decrease in CoQ10 content in CTB would be expected; however, such a reduction was not observed. This finding is compatible with the existence of a compensatory response in which CTB attempts to counterbalance mitochondrial dysfunction by increasing CoQ10 levels. It is plausible that this reflects a concentration of CoQ10 within the remaining healthy mitochondria. Therefore, we propose that CoQ10 levels should be normalized to functional mitochondrial mass, represented by CS activity. Interestingly, in PE, we observed a 2.5-fold increase in CoQ10 when normalized to functional mitochondrial mass in CM, further supporting the idea of a compensatory mitochondrial response. CoQ10 is a component of the electron transport chain (ETC) and also functions as an antioxidant against lipid peroxidation. The increase in placental lipid peroxidation in PE could represent another factor within the resulting mitochondrial dysfunction, potentially inducing an upregulation of CoQ10 biosynthesis as a protective response. We observed that mitochondrial dysfunction specifically affects the CTB. Accordingly, CTB may exhibit a more robust compensatory response, as mitochondrial homeostasis is more severely compromised in this cell type, resulting in a greater increase in CoQ10 levels when normalized to CS activity compared with STB.
Overall, these results support an association between PE and significant alterations in mitochondrial metabolism in CTB, leading to a reduction in the amount of functional mitochondria and suggesting a possible activation of mitophagy. This process could mediate the selective preservation of healthy mitochondria. In parallel, we observed an increase in CoQ10 concentration, possibly within this population of healthy mitochondria, as a compensatory response to the mitochondrial dysfunction. These effects were not observed in STB, likely due to its distinct structural and metabolic characteristics, such as smaller mitochondria, lower membrane potential, and reduced antioxidant capacity. We propose that both the potential activation of mitophagy and the increase in CoQ10 may act as cellular defense mechanisms against mitochondrial dysfunction in CTB during PE. Future studies employing mitophagy modulators or CoQ10 supplementation could provide new therapeutic strategies to mitigate the progression of PE.




 ,
,