Simple Summary
Heptahelical transmembrane proteins have recently been recognized as crucial regulators of diverse biological processes. In this study, we identified ten genes encoding heptahelical transmembrane proteins in soybean. Expression profiling showed that these genes were transcriptionally regulated by abscisic acid, methyl jasmonate, and soybean cyst nematode infection. Protein interaction network analysis and microRNA prediction suggested that these genes may interact with other proteins and conserved microRNAs involved in phytohormone pathways and stress responses.
Abstract
Heptahelical transmembrane proteins (HHPs) have recently been recognized as crucial regulators of diverse biological processes in eukaryotes. In this study, 10 GmHHP genes were identified in soybean, and a comprehensive analysis was conducted to examine their phylogenetic relationships, cis-regulatory elements, expression patterns, and potential regulatory networks. Expression profiling revealed that most GmHHP genes were transcriptionally induced by abscisic acid (ABA) and methyl jasmonate (MeJA), with GmHHP1 and GmHHP7 exhibiting the strongest induction. During soybean cyst nematode (SCN) infection, several GmHHP genes were down-regulated, suggesting a potential role in plant–nematode interactions. Protein interaction network analysis indicated that GmHHPs could interact with mitochondrial pyruvate carriers, alkaline phytoceramidases, and histone deacetylases, which may link them to ABA-regulated biological processes such as stomatal movement, water homeostasis, and stress adaptation. Furthermore, interacting miRNA prediction demonstrated that conserved miRNAs, including miR172 and miR319, might co-regulate GmHHP genes and their associated protein partners. Collectively, these findings indicate that GmHHP genes function as membrane-associated regulators of ABA signaling and defense responses, particularly under biotic stress, such as nematode infection.
1. Introduction
Plants inhibit environments continuously exposed to diverse stimuli and challenges. To survive, they have evolved strategies to perceive external conditions and respond to both abiotic and biotic stresses [1]. These strategies involve either direct sensing mechanisms or molecular interaction-based pathways. At the molecular level, a wide range of receptor genes, including photoreceptors, phytohormone receptors, and pattern recognition receptors (PRRs), facilitate the perception of environmental factors such as light, phytohormones, and biotic stresses [2,3,4]. To counter pathogen attack, nucleotide-binding leucine-rich repeat receptor (NLR) and PRR genes function in effector-triggered immunity (ETI) and pattern-triggered immunity (PTI), respectively [5]. PRRs are located in the plasma membrane, where they detect external signals including pathogen-associated molecular patterns (PAMPs), damage-associated molecular patterns (DAMPs), microbe-associated molecular patterns (MAMPs), and herbivore-associated molecular patterns (HAMPs), as well as stress-induced phytocytokines, to trigger immune responses [4].
The human progestin and adipoQ receptor (PAQR) gene family encodes a group of membrane proteins, including receptors for steroid hormones and adiponectin, which participate in various physiological processes such as metabolism, reproduction, and stress responses [6,7]. This receptor family, mainly composed of adiponectin receptors (AdipoRs) and membrane progestin receptors (mPRs), interacts with intracellular signaling components, such as G proteins, AMP-activated protein kinase (AMPK), and mitogen-activated protein kinase/extracellular signal-regulated kinases (MAPK/ERKs) to regulate diverse biological processes [6].
In plants, homologs of human PAQRs have been annotated as heptahelical transmembrane proteins (HHPs) in multiple species (https://phytozome-next.jgi.doe.gov/, accessed on 5 March 2025). However, their biological roles remain largely unknown. Notably, their potential interacting partners, G proteins and AMPK, play roles in various biological pathways. Plant G proteins are heterotrimeric complexes consisting of α, β, and γ subunits that regulate hormone signaling, development, stress adaption, and immune response [8]. In Arabidopsis, the AMPK ortholog SNF1-related kinase 1 (SnRK1) serves as a central regulator of energy metabolism, particularly under energy-deficient conditions such as starvation, darkness, or stress. For example, the Arabidopsis transcription factor bZIP63 is a direct target of SnRK1. The phosphorylation of bZIP63 by SnRK1 alters its dimerization, thereby modulating target gene expression and influencing primary metabolism [9,10]. These observations suggest HHP genes, as a class of receptor-like genes, may coordinate plant immunity and responses to environmental stimuli. In Arabidopsis, Hiseh and Goodman identified the AtHHP gene family, which is structurally similar to AdipoRs and mPRs. The expression of AtHHP genes can be differentially regulated by plant hormones, sucrose, temperature, and salt stress, implying that these conserved transmembrane proteins may function as a new class of receptors [11,12].
In silico and in vivo analyses of plant genomic datasets have provided valuable insights into the functions of plant receptor genes and their molecular mechanisms, thereby deepening our understanding, and facilitating the enhancement, of broad-spectrum disease resistance in crops, contributing to sustainable agricultural practices [13]. Soybean is a crucial source of protein and oil for humans. However, global infestations of soybean parasitic nematodes, particularly the soybean cyst nematode (SCN), have caused yield losses of 10% to 15% and resulted in estimated annual economic losses of nearly USD 78 billion [14]. Currently, identification of SCN-resistance genes remains a primary strategy for effective control [15]. Based on the demonstrated role of HHP receptor genes in enhancing disease resistance in other plants, this study conducted a comprehensive analysis of the HHP gene family in soybean, encompassing gene structure, conserved motifs, phylogenetic relationships, gene synteny, and expression patterns under phytohormone treatments and SCN infections. In addition, we investigated the miRNAs regulating these genes, and a regulatory network of their interacting proteins was constructed. This study provides new insights and establishes a theoretical basis for functional research on soybean HHP genes and disease-resistance breeding.
2. Materials and Methods
2.1. Identification of HHP Genes in Soybean Genome
The genome sequences, protein sequences, and GFF3 annotation files of G. max (Wm82.a4.v1), A. thaliana (TAIR10), and G. soja (Gsoja_509_v1.0) were downloaded from the Phytozome database (https://phytozome-next.jgi.doe.gov/, accessed on 4 April 2025). The protein sequences files were used to build a local BLAST+ 2.17.0 database using TBtools software (V2.310) [16]. Then, the Hidden Markov Model (HMM) profile corresponding to PF03006 was utilized to query this database through BLASTP with an E-value threshold of <1 × 10⁻⁵. In parallel, amino acid sequences of AtHHPs were employed as queries in separate BLASTP analyses against the G. max dataset using a threshold of <1 × 10⁻⁵. The combined results from both strategies were used to further analysis.
2.2. Conserved Domain, Motif Identification, Gene Structure, and Chromosomal Distribution Analysis
We used the sequences candidate HHP genes identified by HMM search and BLAST to query Conserved Domain Database (CDD). The presence of the PF03006 domain was confirmed using the CD-Search tools provided by NCBI (https://www.ncbi.nlm.nih.gov/cdd/, accessed on 5 April 2025). Specifically, a CDD search was performed against the CDD-62456 PSSM database with an E-value threshold of <0.01, retrieving up to 500 hits. Conserved motifs were predicted using the MEME Suite (https://meme-suite.org/meme/tools/meme, accessed on 5 April 2025), with the maximum number of motifs set to three and all other parameters kept at default. Genes lacking the PF03006 domain and any homologous conserved motifs were removed from further analysis. The gene structures of validated HHP genes from G. max were visualized using TBtools based on the GFF3 annotation file. These genes were localized to specific chromosomes in the soybean genome.
2.3. Phylogenetic Evolution, Physicochemical Properties, and Subcellular Localization of GmHHPs
Protein sequences of GmHHP genes and their homologs in Arabidopsis were aligned using ClustalW implemented in MEGA X, with default parameters (gap opening penalty = 10, gap extension penalty = 0.2). A neighbor-joining (NJ) phylogenetic tree was subsequently constructed based on the Poisson correction model, with gaps treated by pairwise deletion. The reliability of each branch was assessed by bootstrap analysis with 1000 replicates [17]. The ProtParam tool (https://web.expasy.org/protparam/, accessed on 5 April 2025) was employed to analyze physicochemical characteristics such as amino acid composition, molecular mass, and theoretical pI values. Subcellular localization of GmHHP was predicted using Plant-mPLoc (http://www.csbio.sjtu.edu.cn/bioinf/Cell-PLoc-2, accessed on 5 April 2025).
2.4. Duplication and Collinearity Analysis of HHP Genes
Tandem and segmental duplications of GmHHP genes were identified using the MCScanX toolkit with default settings [18]. The Dual Synteny Plotter module was applied to further examine tandem duplication and orthologous relationships of HHP genes between soybean and two additional species (A. thaliana and G. soja).
2.5. Prediction of cis-Elements, Interacting Proteins, and Regulating miRNA
To identify cis-regulatory elements, 2000 bp upstream sequences of the GmHHP- and AtHHP-coding regions were retrieved from genome annotations based on GFF3 files. These promoter regions were subsequently analyzed using the PlantCARE database (http://plantpan.itps.ncku.edu.tw/index.html, accessed on 5 April 2025). The protein sequences of GmHHP were submitted to the STRING database (https://string-db.org/, accessed on 10 April 2025) to predict potential protein–protein interactions. Enrichment analysis of the biological processes regulated by the interacting proteins was subsequently conducted. Furthermore, the CDS of GmHHP and its predicted interactors were uploaded to the psRNATarget server (https://www.zhaolab.org/psRNATarget/, accessed on 17 April 2025) for miRNA target prediction, using the default parameters of schema V2 (2017 release), with a maximum expectation value of 3.0.
2.6. Plant Material and Phytohormone Treatments
Soybean (Williams 82) seeds were surface-sterilized with 1% sodium hypochlorite (NaClO) for 10 min and then thoroughly rinsed with sterile distilled water. The sterilized seeds were germinated in vermiculite moistened with Hoagland nutrient solution at a photoperiod 16/8 (light/dark) with 25 °C in a greenhouse. Five seven-day-old soybean seedlings with fully expanded primary leaves were transferred to ABA and MeJA treatment solutions for 12 h with three biological replicates. Both ABA and MeJA were applied at concentrations of 0, 10, 40, and 160 μM, respectively.
2.7. GmHHP Gene Expression Analysis Under Nematode Infection
Transcriptome data of soybean under nematode infection were downloaded from the studies by Kang et al. [19]. and Qi et al. [20]. Based on these datasets, the expression profiles of GmHHP genes were extracted, and a heatmap was generated using the log2(fold change) values of GmHHPs. SCN was used as biotic stress to test the response of GmHHP genes. Briefly, freshly hatched second-stage juveniles (J2s) of SCN race 3 (HG type 0) were inoculated to the ten-day-old soybean (Williams 82) roots. Five non-infected and SCN-infected soybean roots were collected at 48 h post-inoculation (hpi) and 8 dpi with three biological replicates.
2.8. RNA Extraction and qRT-PCR Analysis
Total RNA of soybean roots was isolated using the Ultrapure RNA Kit (CWbiotech, Beijing, China) following the manufacturer’s instructions. RNA concentration and purity were measured with a NanoDrop 2000 spectrophotometer (Thermo Fisher Scientific, Wilmington, DE, USA). First-strand cDNA was synthesized from 1 μg of total RNA using the SYBR PrimeScript RT Master Mix kit (Takara, Dalian, China). Quantitative real-time PCR (qRT-PCR) was performed on a CFX Connect Real-Time PCR Detection System (Bio-Rad, Hercules, CA, USA) under the following cycling conditions: 95 °C for 2 min, followed by 40 cycles of 95 °C for 5 s and 60 °C for 30 s. The soybean 60SRP gene was used as the internal reference. Relative expression levels were calculated using the 2^−ΔΔCt method [21]. Each qRT-PCR analysis included three biological replicates and three technical replicates.
3. Results
3.1. Identification of GmHHP Genes in Soybean Genome
To identify soybean heptahelical transmembrane protein-coding genes (GmHHPs), the HMM profile of PF03006 was retrieved and used to query a local soybean protein database, which identified 23 putative GmHHP genes (Table S1). Moreover, the protein sequences of five AtHHP genes (from Arabidopsis thaliana) were obtained from the TAIR database and used as queries in a BLAST search against the soybean protein datasets, leading to the identification of 10 candidate GmHHP genes (Table S1). The protein sequences of all genes identified by these two methods were submitted to the Conserved Domain Database (CDD) to confirm the presence of Hemolysin-III related (HlyIII) conserved domains. Five AtHHP genes (AT5G20270, AT4G30850, AT2G24150, AT4G37680, and AT4G38320) were found to contain the HlyIII domain. Similarly, this conserved domain was also present in 10 candidate GmHHP genes (Glyma.01G194900, Glyma.02G207000, Glyma.04G046500, Glyma.04G156100, Glyma.06G047200, Glyma.06G223600, Glyma.11G046900, Glyma.13G161500, Glyma.17G070900, and Glyma.17G109800) (Figure 1 and Table S1). Therefore, the remaining 13 genes were excluded from further analysis. The validated soybean genes were designated as GmHHP1 through GmHHP10 (Figure 1 and Table S1).
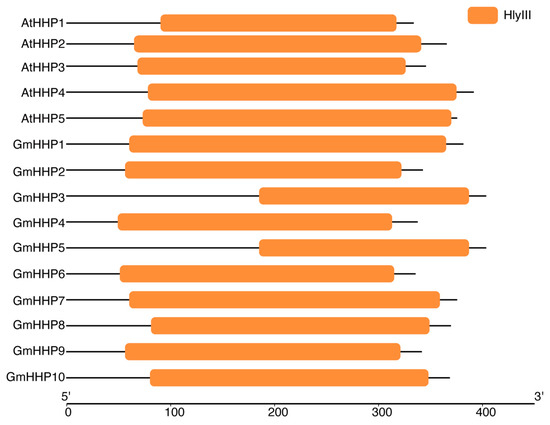
Figure 1.
Conserved domain identification of AtHHPs and GmHHPs. The conserved domains of HHPs from A. thaliana and Glycine max were identified using NCBI CDD. All identified HHPs contained domains belong to the Hemolysin-III related (HlyIII) family. Colored boxes represent conserved domains mapped along amino acid sequences. The x-axis indicates the protein length from the N-terminus (5′) to the C-terminus (3′).
Further analysis using MEME revealed that HHP genes from both A. thaliana and soybean shared three conserved motif structures (Figure 2). Each motif consisted of approximately 50 amino acid residues.
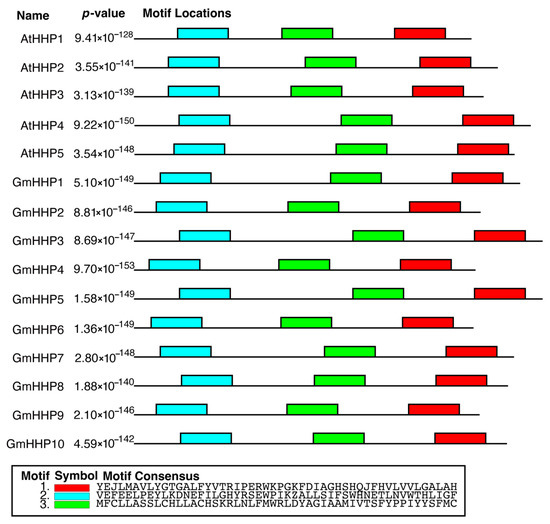
Figure 2.
Conserved motif analysis of HHPs from A. thaliana and G. max. The conserved motifs within HHPs were identified using the MEME Suite. The schematic diagram shows the distribution of three conserved motifs across individual GmHHP sequences. Each colored box represents a distinct motif positioned along the protein from the N-terminus (5′) to the C-terminus (3′).
To investigate the physicochemical properties of soybean HHPs, the amino acid sequences of GmHHP were analyzed using the ProtParam tool (http://web.expasy.org/protparam/, accessed on 5 April 2025). The lengths of GmHHPs ranged from 334 to 402 amino acid residues, with molecular weights between 37,957 and 46,245 Da, as well as theoretical isoelectric points (pI) ranging from 8.04 to 9.24. Subcellular localization prediction with Plant-mPLoc indicated that all GmHHPs could be localized to the plasma membrane (Table 1).

Table 1.
Physicochemical properties of GmHHPs.
3.2. Gene Structure, Chromosomal Distribution, and Phylogenetic Analysis
To elucidate the structural composition of GmHHP genes, a gene structure map was generated from the soybean genome sequence, highlighting the untranslated regions (UTRs), coding sequences (CDSs), and introns (Figure 3). Structural variations were observed in GmHHP genes and their homologs in A. thaliana. For example, in Arabidopsis, AtHHP1 contains three CDSs, AtHHP2 and AtHHP3 each contain four CDSs, and AtHHP4 and AtHHP5 possess two CDSs. In soybean, 3 of the 10 GmHHP genes (GmHHP2, GmHHP8, and GmHHP9) also contained four CDSs. Differences were also observed in the number of UTRs. Except for AtHHP4 and AtHHP5, which contain more than three UTRs, all other HHP genes in both soybean and Arabidopsis possessed only three UTRs (Figure 3A,B). The 10 GmHHP genes were unevenly distributed across seven soybean chromosomes. GmHHP1 was located on chromosome 1 (Chr01), GmHHP2 on Chr02, GmHHP3 and GmHHP4 on Chr04, GmHHP5 and GmHHP6 on Chr06, GmHHP7 and GmHHP8 on Chr11 and Chr13, respectively, and GmHHP9 and GmHHP10 on Chr17 (Figure 3C).
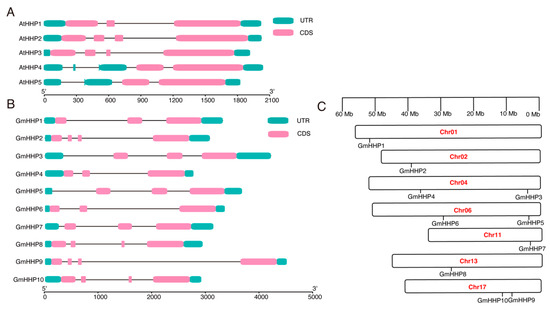
Figure 3.
Structure and chromosomal distribution of HHP genes in soybean. (A) Structure of AtHHP genes. (B) Structure of GmHHP genes. Untranslated regions (UTRs) are marked with green boxes, while coding sequences (CDS) are shown as purple or pink boxes. Introns are represented by black lines. (C) Chromosomal localization of GmHHP genes on soybean chromosomes Gm01, Gm04, Gm06, Gm11, Gm12, Gm13, and Gm17. The x-axis indicates gene length from the 5′ to 3′ end.
A phylogenetic tree was constructed using MEGA software (bootstrap value of 1000) based on the amino acid sequences of the ten identified GmHHPs, together with five AtHHPs. Phylogenetic analysis revealed that GmHHP1 and GmHHP7 clustered more closely with AtHHP4 and AtHHP5. GmHHP3, GmHHP5, GmHHP8, and GmHHP10 showed a closer evolutionary relationship with AtHHP1, whereas GmHHP2, GmHHP4, GmHHP6, and GmHHP9 were more closely related to AtHHP2 and AtHHP3 (Figure 4).
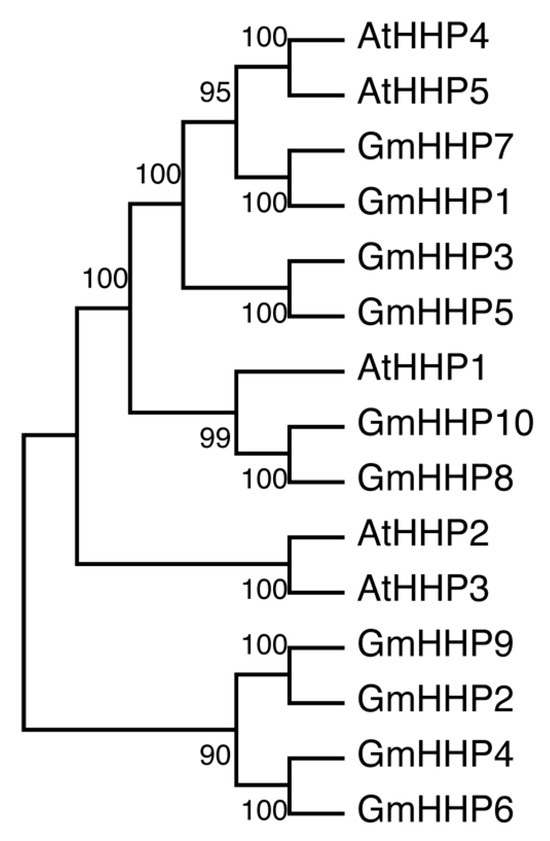
Figure 4.
Phylogenetic analysis of GmHHPs.The phylogenetic tree was constructed based on the amino acid sequences of five AtHHPs proteins and ten GmHHPs, using the neighbor-joining (NJ) method implemented in MEGA11. Multiple sequence alignment was performed with ClustalW. Bootstrap analysis was conducted with 1000 replicates, and bootstrap values above branches indicate statistical support, suggesting evolutionary divergence among the HHP family members in Arabidopsis and soybean.
3.3. Gene Duplication and Collinearity
A total of 10 segmental duplication events involving GmHHP genes were identified in the soybean genome, while no tandem duplications were detected (Figure 5 and Table S2). This analysis demonstrated that several GmHHP genes participated in duplication events across multiple chromosomes. For instance, GmHHP1 was segmentally duplicated with GmHHP3, GmHHP5, and GmHHP7. Similarly, GmHHP2 formed duplication pairs with both GmHHP4 and GmHHP9. GmHHP3 also shared duplication events with GmHHP5 and GmHHP7, while GmHHP5 was duplicated with GmHHP7. A duplicate relationship was also observed between GmHHP4 and GmHHP6. Furthermore, GmHHP8 and GmHHP10 constituted another duplication pair (Figure 5 and Table S2).
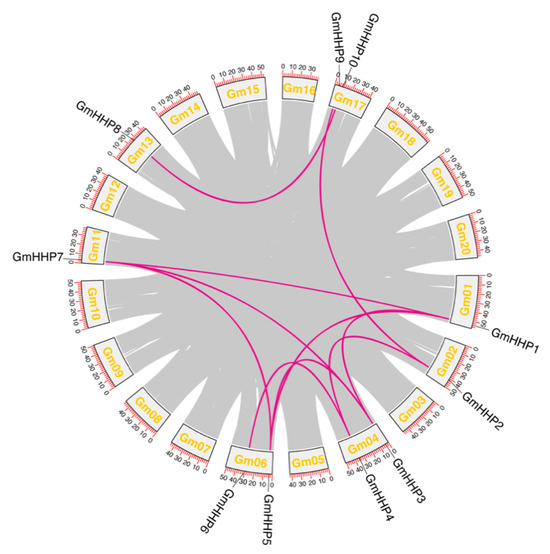
Figure 5.
Gene duplication and collinearity analysis of GmHHP genes in the soybean genome. Genome-wide synteny analysis was performed to identify duplicated GmHHP gene pairs in G. max. The gray lines represent all duplicated gene pairs across the genome, while the purple lines highlight the collinear pairs within the GmHHP family. Chromosome numbers are displayed at the bottom of each chromosome, and renamed GmHHP gene IDs are presented above their corresponding loci.
Collinearity analysis between soybean and A. thaliana revealed several orthologous relationships among HHP genes, indicating evolutionary conservation across species. Specifically, GmHHP1 was collinear with AtHHP2 and AtHHP3. GmHHP2, GmHHP3, GmHHP5, and GmHHP7 were all collinear with AtHHP3. GmHHP6 and GmHHP9 were associated with AtHHP2. GmHHP9 showing the collinearity with AtHHP3 (Figure 6A and Table S2). Furthermore, GmHHP8 and GmHHP10 were collinear with AtHHP1. Further comparison with Glycine soja demonstrated 10 GmHHP genes had orthologous counterparts in the Glycine soja genome, reflecting strong evolutionary conservation between the cultivated and wild species. For example, GmHHP1, GmHHP5, and GmHHP7 were all collinear with GlysoPI483463.01G156600, 04G043300, and 11G042500, respectively, while GmHHP8 and GmHHP10 corresponded to GlysoPI483463.13G127800 and 17G101600 (Figure 6B and Table S2).
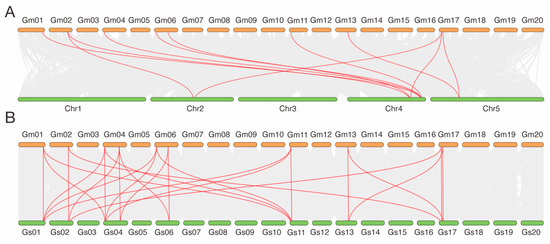
Figure 6.
Collinearity analysis of HHP genes among A. thaliana, G. max, and G. soja. (A) Synteny analysis was performed to explore the evolutionary relationships of HHP genes among A. thaliana and G. max. (B) Synteny analysis of evolutionary relationships of HHP genes among G. max and G. soja. Gray lines indicate all syntenic blocks across the genomes, whereas red lines highlight collinear gene pairs specifically within the HHP gene family. Chromosomes from each species are labeled accordingly.
3.4. cis-Regulating Element Analysis and Phytohormone Response of GmHHP Genes
To characterize the regulatory region of GmHHP promoters, approximately 2000 bp upstream sequences were analyzed. Sixteen categories of cis-acting elements were identified, including both GmHHP and AtHHP gene promoters, covering hormone responsiveness, hormonal responses, stress signaling, developmental regulation, and secondary metabolism. Light-responsive elements were particularly abundant, with GmHHP4 and GmHHP5 containing 13 and 12 such elements, respectively. Stress-related motifs, including those responsive to drought and low temperature, were also widely distributed. For example, GmHHP7 contained seven low-temperature–responsive elements. Elements related to flavonoid biosynthesis were identified in GmHHP3, GmHHP6, and GmHHP10, suggesting their involvement in secondary metabolism (Table S3).
Hormone-responsive elements are particularly prominent. All GmHHP genes contained abscisic acid (ABA)-responsive motifs, with GmHHP8 carrying the highest number. MeJA-responsive elements were found in approximately 60% of the genes, implying the potential participation of this family in multiple hormone signaling pathways (Table S3). To validate these predictions, soybean roots were treated with different concentrations of ABA and MeJA, and the expression pattern profiles of GmHHP genes were subsequently analyzed. GmHHP genes exhibited differential expression under various concentrations of ABA and MeJA. Distinct responses were observed for both treatments (Figure 7). Under ABA treatment exposure, most GmHHP genes were up-regulated, particularly at 10 and 40 μM, except for GmHHP2 and GmHHP6, which showed no significant induction (Figure 7A). In contrast, MeJA generally elicited a generally weaker response. Notably, GmHHP6 was repressed at 40 and 160 μM MeJA, whereas the remaining genes were activated at all tested concentrations (Figure 7B). Some genes exhibited consistent patterns in both treatments. For instance, GmHHP1 was strongly up-regulated at 40 and 160 μM ABA and MeJA, whereas GmHHP6 was induced at 10 and 40 μM of both hormones but repressed at 160 μM (Figure 7).
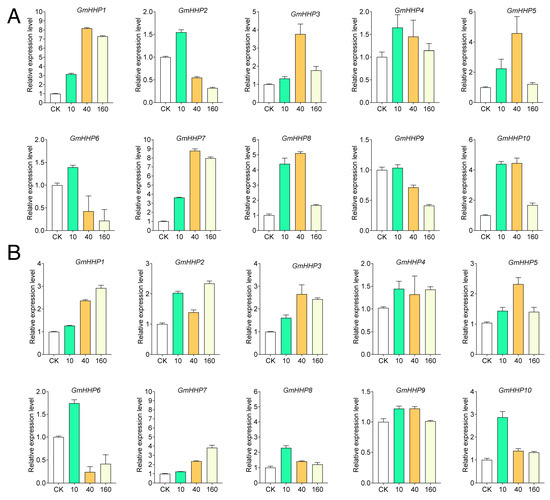
Figure 7.
Expression patterns of GmHHP genes in response to ABA and MeJA treatments. (A) Expression profiles of GmHHP genes after treatment with a series of ABA concentrations (0, 10, 40, and 160 μM). (B) Expression profiles of GmHHP genes under various MeJA concentrations (0, 10, 40, and 160 μM). Soybean seedlings were treated for 12 h, and root tissues were collected for qRT-PCR analysis with three biological and three technical replicates.
3.5. GmHHP Genes Were Responsive to Nematode Infection
To determine whether GmHHP genes could respond to soybean cyst nematode (SCN) infection, we first analyzed publicly available transcriptome datasets. A heatmap was generated to visualize the expression profiles of GmHHP genes in soybean roots at 5, 10, and 15 days post-inoculation (dpi) with SCN. The results demonstrated that several GmHHP genes exhibited dynamic and time-specific responses to nematode infection. For instance, GmHHP10 was markedly up-regulated, with log2(fold change) values of 2.2 and 2.7 observed at 10 and 15 dpi, respectively (Figure 8). Then, we also used qRT-PCR to detect the expression patterns of other GmHHP genes under SCN infection.
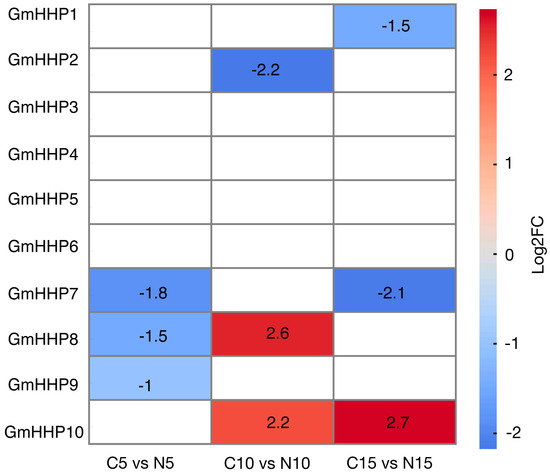
Figure 8.
Expression profiles of GmHHP genes under SCN infection at different time points by using RNA-seq data. The heatmap illustrates the expression patterns of GmHHP genes in G. max based on RNA-seq data from Kang et al. and Qi et al. Expression values were normalized and log2-transformed (log2FC) to highlight relative changes across different samples or treatments. The color scale represents expression levels, where red indicates up-regulation and blue indicates down-regulation.
To investigate the transcriptional response of GmHHP genes to SCN infection, qRT-PCR was performed to assess their expression in soybean roots at 1, 2, and 15 dpi. Notably, GmHHP3, GmHHP4, and GmHHP5 were significantly up-regulated at both 2 and 15 dpi, suggesting their potential role in the sustained response to nematode invasion. GmHHP1 exhibited a transient down-regulation at 2 dpi, followed by an increase at 15 dpi. In contrast, GmHHP2 and GmHHP6 demonstrated consistent down-regulation across all time points, suggesting suppression under nematode stress. GmHHP10 displayed pronounced down-regulation at 2 dpi, with a slight recovery at 15 dpi. Other members, including GmHHP7, GmHHP8, and GmHHP9, displayed moderate or variable expression changes, with GmHHP8 showing a distinct suppression at 2 dpi (Figure 9).
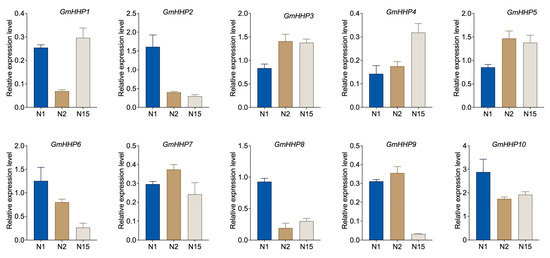
Figure 9.
Expression patterns of GmHHP genes under SCN infection. Soybean seedlings were inoculated with 2000 second-stage juveniles (J2) of SCN. Roots from inoculated and non-inoculated (control) and SCN-inoculated plants were collected at 1, 2, and 15 dpi, corresponding to C1, C2, and C15 (control), as well as N1, N2, and N15 (infected), respectively. The gene expression levels of GmHHP genes were normalized to those of non-inoculated soybean roots. qRT-PCR analysis was conducted using three biological and three technical replicates.
3.6. GmHHP Genes Influence Several Biological Processes
We performed GO enrichment analysis of GmHHP genes by using the Soybase database. These genes are enriched in GO terms related to response to salt stress (GO:0009651), response to hormone (GO:0009725), response to sucrose (GO:0009744), regulation of abscisic acid-activated signaling pathway (GO:0009788), and signaling receptor activity (GO:0038023) (Table S5). To explore the potential functions of GmHHPs, a protein–protein interaction network was constructed by querying the STRING database. In total, ten potential interacting proteins were predicted, including mitochondrial pyruvate carriers Glyma.19G087300, Glyma.19G087200, Glyma.10G280800, Glyma.20G108800, Glyma.07G156300, and Glyma.15G246900; alkaline phytoceramidases Glyma.10G183100 and Glyma.17G009000; and histone deacetylases Glyma.05G021400 and Glyma.17G078000 (Figure 10A and Table S4). GO enrichment analysis of these putative interactors revealed significant enrichment in a variety of biological processes, such as mitochondrial pyruvate transmembrane transport, positive regulation of autophagy, regulation of stomatal movement and closure, water homeostasis, and wax biosynthetic process (Figure 10B).
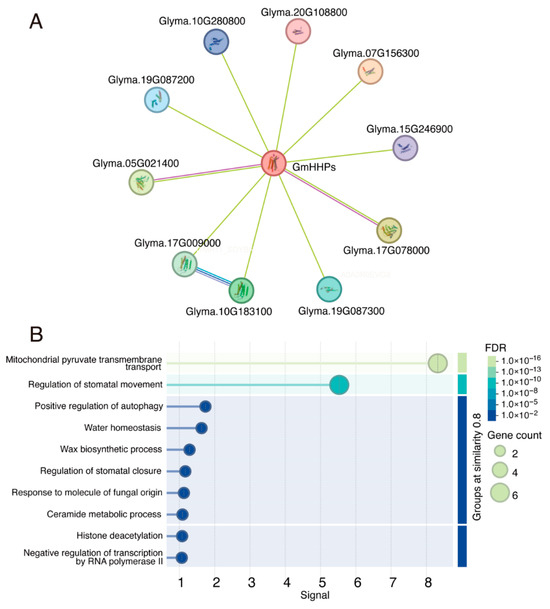
Figure 10.
Predicted protein–protein interaction (PPI) network of GmHHPs. Protein–protein interaction (PPI) network of GmHHPs predicted using the STRING database. (A) GmHHPs and their putative interactors. (B) GO analysis of GmHHPs potential interactors enriched in biological process enrichment.
3.7. Regulation of GmHHP Genes and Their Potential Interactors by Conserved and Legume-Specific miRNA
To explore the potential post-transcriptional regulation of GmHHP genes and their predicted interacting proteins, miRNA–mRNA interaction network construction was performed using the psRNATarget tool. Within this regulatory network, multiple miRNAs were found to co-target both GmHHP genes and their interactors (Figure 11 and Table S6). For example, miR1514 was predicted to target GmHHP5 and GmHHP8, as well as Glyma.10G183100. Similarly, miR156 was predicted to regulate GmHHP3, along with Glyma.17G078000 and Glyma.05G021400. miR1521 was found to co-target GmHHP1, GmHHP7, GmHHP8, and Glyma.05G021400. Notably, miR2111 was predicted to simultaneously target GmHHP3, GmHHP4, GmHHP7, and GmHHP8, along with several interacting proteins, including Glyma.05G021400, Glyma.17G078000, and Glyma.17G009000 (Figure 11A and Table S6). In addition, we also observed that several conserved miRNAs were predicted to regulate GmHHP genes and their interactors. For example, miRNA172 regulates Glyma.05G021400 and Glyma.17G078000, while miR319 and miR408 were predicted to regulate GmHHP3 and GmHHP7, respectively (Figure 11B and Table S6).
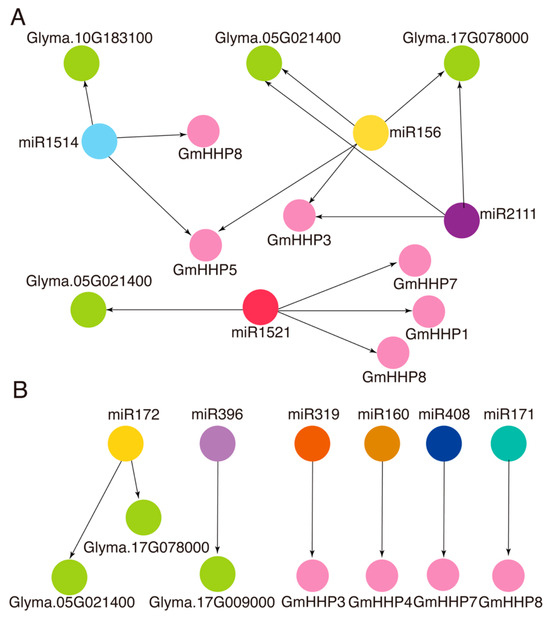
Figure 11.
Network representation of predicted interactions between miRNAs and GmHHP genes and their potential interactors. (A) Common miRNAs regulate GmHHP genes and their interactors. (B) Conserved miRNAs predicted to regulate GmHHP genes and their interactors. Purple circular nodes represent GmHHP genes, whereas nodes of other colors represent miRNAs. Green circular nodes indicate putative protein interactors of GmHHP genes. Black arrows represent regulatory relationships predicted by psRNATarget.
4. Discussion
In plants, homologs of human progestin and adiponectin receptors have been annotated as HHPs in several species (https://phytozome-next.jgi.doe.gov/, accessed on 4 May 2025). These proteins contain a conserved Hemolysin-III–related (HlyIII) domain (Figure 1). In this study, a genome-wide analysis of soybean was conducted using HMM search, BLAST, and conserved domain validation, which identified and confirmed 10 GmHHP genes (Table 1 and Table S6). This gene family comprised 307 members distributed across approximately 50 distinct species. According to TAIR and PhyloGenes (https://phylogenes.arabidopsis.org/tree/PTHR20855, accessed on 4 May 2025), 5 members of this family were identified in Arabidopsis, 1 in orange, 11 in cotton, 6 in rice, 20 in wheat, and 11 in humans. This distribution indicates that the gene family is highly conserved and has undergone extensive evolutionary expansion in both plants and animals, highlighting its fundamental and conserved role in biological processes.
Recently, Zhang et al. identified homologs of human PAQRs in Arabidopsis and designated them as PAQR-like sensor (PLS) genes. Their study demonstrated that overexpression of the human adiponectin receptor AdipoRs in A. thaliana positively regulated plant immune responses [22]. Furthermore, in rice and soybean, HHP genes have been shown to enhance resistance to multiple diseases, including bacterial blight, sheath blight, and stem rot [22]. Additionally, AtHHP genes have been predicted to interact with KIN7, a leucine-rich repeat receptor-like kinase (LRR-RLK) that regulates stomatal closure in response to ABA and CO2 [22,23]. In Arabidopsis, ABA regulates the expression of AtHHP1 and AtHHP2, whereas AtHHP4/5 mRNA levels are slightly increased by ABA, and no effect is observed on AtHHP3 [11]. The expression of stress-responsive, ABA signaling, and ABA biosynthetic genes was further elevated in the hhp1-1 mutant under ABA or salt treatment. These findings suggest that AtHHP1 may act as a negative regulator of ABA biosynthesis and signaling pathways in response to exogenous ABA and osmotic stress. Moreover, AtHHP1 expression was rapidly induced within 1 h of high salinity exposure and remained elevated throughout the 24 h treatment period [12]. In Arabidopsis, salinity stress can rapidly trigger ABA accumulation, which activates ABA signaling pathways to mitigate cellular damage and regulate osmotic and ionic homeostasis in the roots [24]. These observations imply that AtHHP1 may play diverse roles in ABA-responsive pathways. In the present study, GmHHP genes were also found to respond to ABA treatments (Figure 7). Based on the evolutionary analysis, GmHHP8 and GmHHP10 clustered closely with AtHHP1. Notably, both genes displayed similar expression trends under ABA treatment, showing consistent up-regulation at 10, 40, and 160 μM ABA (Figure 4 and Figure 7). These findings suggest that the functions of GmHHP8 and GmHHP10 in the ABA signaling pathway may differ from those of AtHHP1. Overall, most GmHHP genes were up-regulated under 10–160 μM ABA (Figure 7). GmHHP7 and GmHHP1 exhibited the strongest induction, with fold changes of 3.62, 8.78, and 7.96 for GmHHP7 and 3.15, 8.18, and 7.29 for GmHHP1 under 10, 40, and 160 μM ABA, respectively (Figure 7). However, these two genes contained relatively few ABA-responsive cis-elements in their promoters, each harboring only 2–3 such motifs. By contrast, GmHHP8 containing the largest number of ABA-responsive cis-elements demonstrated lower induction levels of 4.40, 5.10, and 1.68 under 10, 40, and 160 μM ABA, respectively (Figure 7 and Table S3).
In humans, PAQR genes perform diverse functions and play essential roles in regulating energy metabolism and disease response pathways [25,26,27]. For instance, PAQR1 (AdipoR1) acts as a receptor for adiponectin, activating AMP-activated protein kinase (AMPK) to enhance fatty acid oxidation, glucose uptake, and insulin sensitivity. PAQR1 also contributes to membrane homeostasis and protects against endoplasmic reticulum (ER) stress responses [26]. Similarly, PAQR2 functions as a glucoregulatory receptor for adiponectin, primarily by activating PPAR-α signaling. Through these mechanisms, PAQR2 improves insulin sensitivity, lipid metabolism, and mitochondrial function, thereby contributing to resistance to stress and aging [25]. In Arabidopsis, AtHHP genes exhibit functional redundancy in PTI signaling and act as positive regulators of PTI-mediated responses and pathogen defenses. These functions included resistance to Pseudomonas syringae pv. tomato DC3000, Botrytis cinerea, and Agrobacterium tumefaciens. In rice and soybean, AtHHP homologs have also been implicated in defense responses against fungal pathogens [11,22]. In this study, we analyzed publicly available datasets and observed that GmHHP genes were differentially expressed in susceptible soybean cultivars upon nematode infection. To further investigate this, soybean roots were collected at 1, 2, and 15 dpi after inoculation with nematodes, and the expression of GmHHP genes was examined. The results indicated that, except for GmHHP3, GmHHP5, and GmHHP10, most GmHHP genes were down-regulated during nematode infection (Figure 8 and Figure 9). Similar trends have been reported for other membrane-associated receptor genes. For example, the receptor-like kinase GmBIR1 negatively regulates soybean immunity to SCN, with mutants exhibiting enhanced resistance [28]. Moreover, the SNARE protein GmSYP31A is up-regulated in nematode-infected roots and may contribute to vesicle-mediated defense signaling [29]. Collectively, these findings suggest that GmHHPs may serve as positive regulators of membrane-associated defense pathways during nematode infection.
In humans, the PAQR gene family interacts with multiple protein kinases, thereby influencing the AMPK signaling pathway [6,26]. In Arabidopsis, AtHHP genes have been shown to interact with heterotrimeric G proteins [22]. In this study, we also predicted potential interacting proteins of GmHHPs using the STRING database. These predicted proteins primarily included mitochondrial pyruvate carriers, alkaline phytoceramidases, and histone deacetylases. Notably, these interactors were potentially involved in biological processes such as stomatal regulation, water homeostasis, and stress signaling. Interestingly, these processes were all regulated by abscisic acid (ABA) in soybean, where ABA plays a critical role in inducing stomatal closure and maintaining water balance under osmotic stress. Under drought conditions, elevated ABA levels in soybean are associated with reduced stomatal conductance and enhanced water-use efficiency. Furthermore, cultivar-specific differences have been observed in xylem ABA sensitivity and stomatal responsiveness [30,31]. In addition, we analyzed potential miRNAs that may regulate GmHHPs and their interacting genes. Several miRNAs, including miR172, miR319, and miR408, were predicted to target GmHHPs and their associated genes (Figure 11A,B). Among these, miR172 and miR319 play critical roles in coordinating ABA-mediated developmental and defense responses during nematode challenge [32,33,34,35,36]. In Arabidopsis, miR172b is down-regulated by ABA and osmotic stress, and its overexpression increases ABA sensitivity by inducing ABA-responsive genes, highlighting its role as a regulatory switch in growth–stress balance. Similarly, soybean miR172c enhanced tolerance to water deficit and salinity but simultaneously increased ABA sensitivity, reflecting a trade-off between stress tolerance and ABA responsiveness. These findings suggest that GmHHPs may participate in ABA signaling and disease resistance regulation. Meanwhile, miR319 regulated JA biosynthesis by targeting TCP transcription factors and mediated RKN resistance in tomato, suggesting that interconnected hormone-miRNA defense networks may also operate in soybean SCN defense. In our soybean model, these miRNAs targeted GmHHP genes to modulate ABA-dependent stomatal closure, water homeostasis, and defense pathways. This integrated miRNA-GmHHP-ABA regulatory axis may enable soybean to fine-tune stress and immune responses during nematode infection. Future research using transgenic modulation of miRNA levels in soybean is essential to validate these regulatory links under both abiotic and biotic stress conditions.
5. Conclusions
This study provides comprehensive insights into the GmHHP gene family in soybean, highlighting its differential expression in response to ABA, MeJA, and SCN infection. The identification of potential interacting proteins and regulatory miRNAs indicates that GmHHP genes may be involved in ABA-mediated signaling pathways and biotic stress responses. These findings may establish a foundation for elucidating the functional roles of GmHHPs in hormone signaling and pathogen defense.
Supplementary Materials
The following supporting information can be downloaded at: https://www.mdpi.com/article/10.3390/biology14091223/s1, Table S1: Soybean HHP gene identification information; Table S2: Comparative genomic analysis of GmHHP genes; Table S3: Cis-elements of GmHHP gene promoters; Table S4: Interacting genes of GmHHP genes predicted by the STRING database; Table S5: GO enrichment analysis of GmHHP genes. Table S6: Potential miRNAs regulate GmHHP genes and their interacting genes; Table S7: Primers used for qRT-PCR.
Author Contributions
Conceptualization, W.K. and P.L.; methodology, W.K., N.Q. and P.L.; software, W.K. and P.L.; validation, W.K., N.Q. and P.L.; formal analysis, W.K.; investigation, W.K., N.Q. and P.L.; resources, W.K., N.Q. and P.L.; data curation, W.K. and P.L.; writing—original draft preparation, W.K. and P.L.; writing—review and editing, W.K. and P.L.; visualization, W.K., N.Q. and P.L.; supervision, P.L.; project administration, W.K. and N.Q.; funding acquisition, W.K. and N.Q. All authors have read and agreed to the published version of the manuscript.
Funding
This study was funded by the Doctoral Start-up Foundation of Shenyang Normal University (BS202414) and the National Natural Science Foundation of China (32402324).
Data Availability Statement
The original contributions presented in the study are included in the article/Supplementary Material. Further inquiries can be directed to the corresponding author.
Acknowledgments
The authors would like to thank Bohong Wu for providing the materials to detect GmHHP gene expression under SCN infection.
Conflicts of Interest
The authors declare no conflict of interest.
References
- Kumar, A.; Memo, M.; Mastinu, A. Plant behaviour: An evolutionary response to the environment? Plant Biol. 2020, 22, 961–970. [Google Scholar] [CrossRef]
- Chen, M.; Chory, J.; Fankhauser, C. Light signal transduction in higher plants. Annu. Rev. Genet. 2004, 38, 87–117. [Google Scholar] [CrossRef]
- Kiba, T.; Kudo, T.; Kojima, M.; Sakakibara, H. Hormonal control of nitrogen acquisition: Roles of auxin, abscisic acid, and cytokinin. J. Exp. Bot. 2011, 62, 1399–1409. [Google Scholar] [CrossRef]
- Zipfel, C. Plant pattern-recognition receptors. Trends Immunol. 2014, 35, 345–351. [Google Scholar] [CrossRef]
- Jones, J.D.; Dangl, J.L. The plant immune system. Nature 2006, 444, 323–329. [Google Scholar] [CrossRef]
- Thomas, P. Membrane progesterone receptors (mPRs, PAQRs): Review of structural and signaling characteristics. Cells 2022, 11, 1785. [Google Scholar] [CrossRef] [PubMed]
- Tang, Y.T.; Hu, T.; Arterburn, M.; Boyle, B.; Bright, J.M.; Emtage, P.C.; Funk, W.D. PAQR proteins: A novel membrane receptor family defined by an ancient7-transmembrane pass motif. J. Mol. Evol. 2005, 61, 372–380. [Google Scholar] [CrossRef] [PubMed]
- Urano, D.; Jones, A.M. Heterotrimeric G protein–coupled signaling in plants. Annu. Rev. Plant Biol. 2014, 65, 365–384. [Google Scholar] [CrossRef]
- Baena-González, E.; Hanson, J. Shaping plant development through the SnRK1–TOR metabolic regulators. Curr. Opin. Plant Biol. 2017, 35, 152–157. [Google Scholar] [CrossRef]
- Mair, A.; Pedrotti, L.; Wurzinger, B.; Anrather, D.; Simeunovic, A.; Weiste, C.; Valerio, C.; Dietrich, K.; Kirchler, T.; Nägele, T.; et al. SnRK1-triggered switch of bZIP63 dimerization mediates the low-energy response in plants. eLife 2015, 4, e05828. [Google Scholar] [CrossRef] [PubMed][Green Version]
- Hsieh, M.-H.; Goodman, H.M. A novel gene family in Arabidopsis encoding putative heptahelical transmembrane proteins homologous to human adiponectin receptors and progestin receptors. J. Exp. Bot. 2005, 56, 3137–3147. [Google Scholar] [CrossRef]
- Chen, C.; Liang, C.; Kao, A.; Yang, C. HHP1 is involved in osmotic stress sensitivity in Arabidopsis. J. Exp. Bot. 2009, 60, 1589–1604. [Google Scholar] [CrossRef] [PubMed]
- Snoeck, S.; Johanndrees, O.; Nürnberger, T.; Zipfel, C. Plant pattern recognition receptors: From evolutionary insight to engineering. Nat. Rev. Genet. 2025, 26, 268–278. [Google Scholar] [CrossRef]
- Wendimu, G.Y. Cyst nematode (Heterodera glycines) problems in soybean (Glycine max L.) crops and its management. Adv. Agric. 2022, 2022, 7816951. [Google Scholar] [CrossRef]
- Arjoune, Y.; Sugunaraj, N.; Peri, S.; Nair, S.V.; Skurdal, A.; Ranganathan, P.; Johnson, B. Soybean cyst nematode detection and management: A review. Plant Methods 2022, 18, 110. [Google Scholar] [CrossRef] [PubMed]
- Chen, C.; Wu, Y.; Li, J.; Wang, X.; Zeng, Z.; Xu, J.; Liu, Y.; Feng, J.; Chen, H.; He, Y. TBtools-II: A “one for all, all for one” bioinformatics platform for biological big-data mining. Mol. Plant 2023, 16, 1733–1742. [Google Scholar] [CrossRef]
- Tamura, K.; Stecher, G.; Kumar, S. MEGA11: Molecular evolutionary genetics analysis version 11. Mol. Biol. Evol. 2021, 38, 3022–3027. [Google Scholar] [CrossRef]
- Wang, Y.; Tang, H.; DeBarry, J.D.; Tan, X.; Li, J.; Wang, X.; Lee, T.; Jin, H.; Marler, B.; Guo, H. MCScanX: A toolkit for detection and evolutionary analysis of gene synteny and collinearity. Nucleic Acids Res. 2012, 40, e49. [Google Scholar] [CrossRef] [PubMed]
- Kang, W.; Zhu, X.; Wang, Y.; Chen, L.; Duan, Y. Transcriptomic and metabolomic analyses reveal that bacteria promote plant defense during infection of soybean cyst nematode in soybean. BMC Plant Biol. 2018, 18, 86. [Google Scholar] [CrossRef]
- Qi, N.; Yan, J.; Lei, P.; Kang, W.; Liu, X.; Xuan, Y.; Fan, H.; Wang, Y.; Yang, N.; Chen, L.; et al. Transcriptome Analysis of GmPUB20A Overexpressing and RNA-Interferencing Transgenic Hairy Roots Reveals Underlying Negative Role in Soybean Resistance to Cyst Nematode. J. Agric. Food Chem. 2023, 71, 18059–18073. [Google Scholar] [CrossRef]
- Livak, K.J.; Schmittgen, T.D. Analysis of relative gene expression data using real-time quantitative PCR and the 2−ΔΔCT method. Methods 2001, 25, 402–408. [Google Scholar] [CrossRef]
- Zhang, H.; Zhang, Y.; Li, Q.; Hao, F.; Stacey, G.; Chen, D. Plant PAQR-like sensors activate heterotrimeric G proteins to confer resistance against multiple pathogens. Mol. Plant 2025, 18, 639–650. [Google Scholar] [CrossRef] [PubMed]
- Isner, J.C.; Begum, A.; Nuehse, T.; Hetherington, A.M.; Maathuis, F.J. KIN7 kinase regulates the vacuolar TPK1 K+ channel during stomatal closure. Curr. Biol. 2018, 28, 466–472.e464. [Google Scholar] [CrossRef] [PubMed]
- Lamers, J.; Zhang, Y.; van Zelm, E.; Leong, C.K.; Meyer, A.J.; de Zeeuw, T.; Verstappen, F.; Veen, M.; Deolu-Ajayi, A.O.; Gommers, C.M.; et al. Abscisic acid signaling gates salt-induced responses of plant roots. Proc. Natl. Acad. Sci. USA 2025, 122, e2406373122. [Google Scholar] [CrossRef]
- Bjursell, M.; Ahnmark, A.; Bohlooly-Y, M.; William-Olsson, L.; Rhedin, M.; Peng, X.-R.; Ploj, K.; Gerdin, A.-K.; Arnerup, G.; Elmgren, A. Opposing effects of adiponectin receptors 1 and 2 on energy metabolism. Diabetes 2007, 56, 583–593. [Google Scholar] [CrossRef]
- Yamauchi, T.; Kamon, J.; Minokoshi, Y.; Ito, Y.; Waki, H.; Uchida, S.; Yamashita, S.; Noda, M.; Kita, S.; Ueki, K.; et al. Adiponectin stimulates glucose utilization and fatty-acid oxidation by activating AMP-activated protein kinase. Nat. Med. 2002, 8, 1288–1295. [Google Scholar] [CrossRef] [PubMed]
- Yu, X.; Li, Z.; Chan, M.T.; Wu, W.K.K. PAQR3: A novel tumor suppressor gene. Am. J. Cancer Res. 2015, 5, 2562. [Google Scholar]
- Hawk, T.E.; Piya, S.; Zadegan, S.B.; Li, P.; Rice, J.H.; Hewezi, T. The soybean immune receptor GmBIR1 regulates host transcriptome, spliceome, and immunity during cyst nematode infection. New Phytol. 2023, 239, 2335–2352. [Google Scholar] [CrossRef]
- Wang, R.; Deng, M.; Yang, C.; Yu, Q.; Zhang, L.; Zhu, Q.; Guo, X. A Qa-SNARE complex contributes to soybean cyst nematode resistance via regulation of mitochondria-mediated cell death. J. Exp. Bot. 2021, 72, 7145–7162. [Google Scholar] [CrossRef]
- Kim, T.-H.; Böhmer, M.; Hu, H.; Nishimura, N.; Schroeder, J.I. Guard cell signal transduction network: Advances in understanding abscisic acid, CO2, and Ca2+ signaling. Annu. Rev. Plant Biol. 2010, 61, 561–591. [Google Scholar] [CrossRef]
- He, J.; Jin, Y.; Palta, J.A.; Liu, H.-Y.; Chen, Z.; Li, F.-M. Exogenous ABA induces osmotic adjustment, improves leaf water relations and water use efficiency, but not yield in soybean under water stress. Agronomy 2019, 9, 395. [Google Scholar] [CrossRef]
- Zou, Y.; Wang, Y.; Wang, L.; Yang, L.; Wang, R.; Li, X. miR172b controls the transition to autotrophic development inhibited by ABA in Arabidopsis. PLoS ONE 2013, 8, e64770. [Google Scholar] [CrossRef] [PubMed]
- Li, W.; Wang, T.; Zhang, Y.; Li, Y. Overexpression of soybean miR172c confers tolerance to water deficit and salt stress, but increases ABA sensitivity in transgenic Arabidopsis thaliana. J. Exp. Bot. 2016, 67, 175–194. [Google Scholar] [CrossRef]
- Díaz-Manzano, F.E.; Cabrera, J.; Ripoll, J.-J.; del Olmo, I.; Andrés, M.F.; Silva, A.C.; Barcala, M.; Sánchez, M.; Ruíz-Ferrer, V.; de Almeida-Engler, J.; et al. A role for the gene regulatory module miRNA172/TOE1/FT in the feeding sites induced by Meloidogyne javanica in Arabidopsis. New Phytol. 2017, 217, 813–827. [Google Scholar] [CrossRef] [PubMed]
- Zhao, W.; Li, Z.; Fan, J.; Hu, C.; Yang, R.; Qi, X.; Chen, H.; Zhao, F.; Wang, S. Identification of jasmonic acid-associated microRNAs and characterization of the regulatory roles of the miR319/TCP4 module under root-knot nematode stress in tomato. J. Exp. Bot. 2015, 66, 4653–4667. [Google Scholar] [CrossRef]
- Thiebaut, F.; Rojas, C.A.; Almeida, K.L.; Grativol, C.; Domiciano, G.C.; Lamb, C.R.C.; de Almeida Engler, J.; Hemerly, A.S.; Ferreira, P.C. Regulation of miR319 during cold stress in sugarcane. Plant Cell Environ. 2012, 35, 502–512. [Google Scholar] [CrossRef]
Disclaimer/Publisher’s Note: The statements, opinions and data contained in all publications are solely those of the individual author(s) and contributor(s) and not of MDPI and/or the editor(s). MDPI and/or the editor(s) disclaim responsibility for any injury to people or property resulting from any ideas, methods, instructions or products referred to in the content. |
© 2025 by the authors. Licensee MDPI, Basel, Switzerland. This article is an open access article distributed under the terms and conditions of the Creative Commons Attribution (CC BY) license (https://creativecommons.org/licenses/by/4.0/).